Peatland restoration and potential emissions savings on agricultural land: an evidence assessment
←
→
Page content transcription
If your browser does not render page correctly, please read the page content below
Peatland restoration and potential
emissions savings on agricultural land:
an evidence assessment
Matt Aitkenhead, Marie Castellazzi, Margaret McKeen, Matt Hare,
Rebekka Artz (James Hutton Institute); Mark Reed (SRUC)
February 2021
DOI: http://dx.doi.org/10.7488/era/974
1 Executive summary
1.1 Aims and findings
Peatland restoration has a significant role in tackling the global climate emergency and
helping Scotland meet its ambitious climate change targets. Globally, peatlands are the
largest natural terrestrial carbon store, containing about 25% of global soil carbon.
However, they have been damaged by overexploitation. The Scottish Government has
committed to restoring 250,000 hectares of peatland in Scotland by 2030. About a
quarter of Scotland’s area is covered in peat, storing over 3 billion tonnes of carbon.
Peat also provides a range of other co-benefits. Changing some current uses of
peatland, particularly for agriculture, may lead to significant savings in greenhouse gas
(GHG) emissions and offer some of the highest per hectare emissions savings.
This report assesses the current evidence for the potential for emissions savings from
re-wetting peatland currently used for agriculture in Scotland and explores alternative
uses that might provide an economic return.
1.2 Key findings
The quality and coverage of spatial data on peatland in Scotland is mixed. In the
last 40 years, a variety of different datasets have been gathered at different times
on Scotland’s soils, land use and land cover. Examples include: where best to
grow arable crops, the presence of different vegetation types, and the proportion
of different soils within an area of land.
The relevance of resulting datasets to spatial variability of peat GHG emissions
has been inconsistent. Specifically, the definition of what constitutes drainage is
critical to the outcome of mapping exercises with currently available data
products; no mapping has specifically targeted this question.
On emissions reduction potential: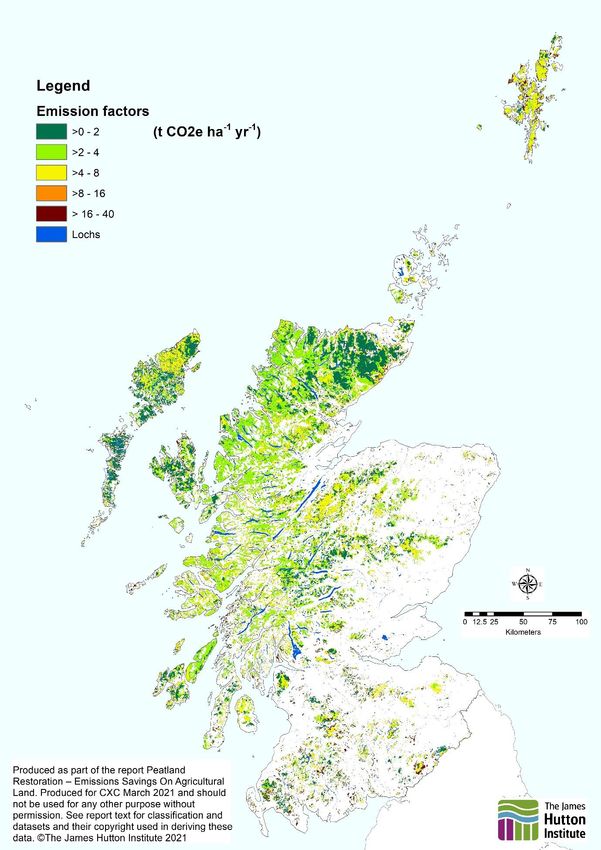
Page |2
o Emissions resulting from land use on peatlands have only recently been
included in the Provisional UK greenhouse gas emissions national
statistics.
o Peatland with the poorest agricultural production capability presents the
greatest opportunity for emission reductions.
o While cropland on peat has a very high emission factor per unit area, it
only covers a small area of Scotland, and so does not contribute
meaningfully to the emissions inventory. Broadly, emissions are
dominated by the drained heather-dominated or grass-dominated or
eroded peatland and extensive grassland land categories (due to their
spatial extent rather than emission factors).
We found low capacity (small spatial extent scattered over multiple sites) for and
high costs of ‘alternative’ agricultural practices such as paludiculture (the growth
of crops on rewetted peat, often for bioenergy).
There is strong evidence for emissions reductions potential across a significant
proportion of Scotland’s peat area, which could be achieved through
rewetting/restoration.
o Most of the emissions reduction could be achieved on poor production
quality land where extensive grazing is currently carried out. However,
there are social impacts where specific land management practices are
common (e.g. crofting).
o The geographical areas of Scotland likely to provide the highest levels of
emission savings are Shetland, Lewis, the Monadhliath Mountains,
several areas in the Cairngorm Mountains and in Sutherland, as well as
several localised areas within Ayrshire, Dumfries and Galloway, the
Borders and Lanarkshire.
o A relatively small area of good quality agricultural land that is currently
under more intensive grazing or arable management could also provide
large emission reductions per unit area. However, the financial impacts on
land managers would be significantly greater on this higher quality land,
while providing only a small fraction of the cumulative GHG emission
reductions that could be achieved on the poorer quality land.
Uncertainties remain as to the extent and location of peat in Scotland, and as to
the limitations of the data sources available to classify current land cover. It is
important to note that our approach here differed to that used in the data sources
for the UK Greenhouse Gas Inventory; further alignment is needed.
There are management alternatives, including some that permit cropping on
rewetted peat. However, only very small-scale Sphagnum farming and bioenergy
crop production have some precedent in the UK or EU countries with similar
climates. There are significant barriers to these alternatives, due to major
changes being required to farming practices, market accessibility and other
economic considerations. Additionally, evidence for the effectiveness of these
alternatives, both for emission reductions and in terms of economic benefit, is
from other countries (largely Germany and the Netherlands), and under different
climatic and topographic conditions.
1.3 Conclusions
We have identified specific locations across Scotland where there may be GHG
emission reduction opportunities, largely on low-grade agricultural land (very often
upland heath vegetation on peat). Holdings for this type of land often cover large areas;
because of this the potential exists to achieve significant emission reductions through
engagement with a small number of key land managers. Ongoing improvement of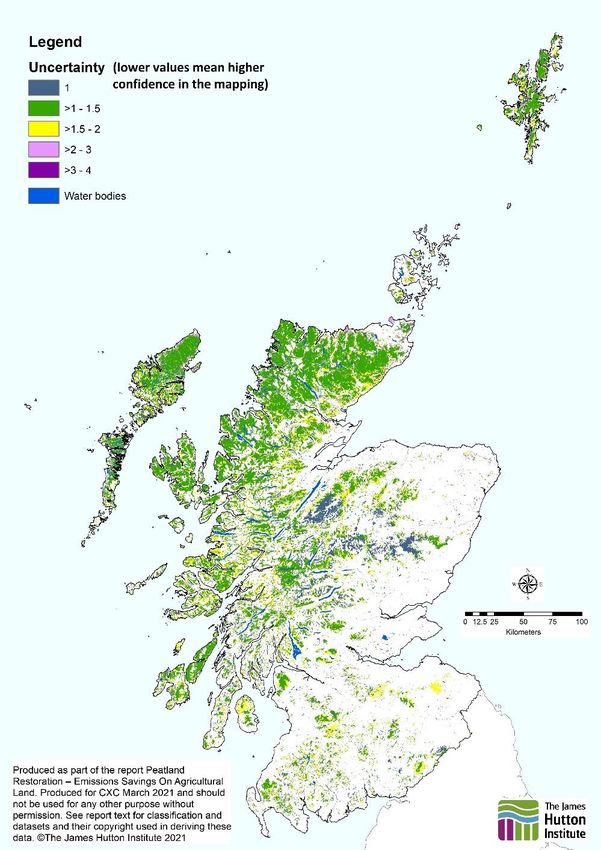
Page |3

datasets would improve the accuracy of this assessment. Additionally, further work
would improve our understanding of the effectiveness of various paludiculture practices
in reducing GHG emissions.
Page |4

Contents

1 Executive summary .......................................................................... 1
1.1     Aims and summary ........................................................................................................... 1
1.2     Key findings ...................................................................................................................... 1
1.3     Conclusions ...................................................................................................................... 2

2 Review of evidence .......................................................................... 6
2.1     Summary of geographical peatland areas likely to provide the highest level of emission
savings ....................................................................................................................................... 6
2.2     Quality and coverage of spatial data on peatland in Scotland....................................... 12
2.3     Review of evidence for potential agricultural uses of rewetted peatland ...................... 17

3 Conclusions and recommendations .................................................23

4 Annex: rationale and policy links......................................................25

5 Annex of methodologies and underlying assumptions .....................26

6 Annex of maps and data used in this report ...................................220

7 Annex: quality and suitability of spatial data used in this report ......225

8 Annex: social, economic and political review of paludiculture.........227

9 References ......................................................................................45
Page |5

Glossary of terms
BEIS: UK Government’s Department for Business, Energy & Industrial Strategy
Bioenergy crops: crops that are grown to be processed for fuel or burned directly
CO2e: the standard unit for greenhouse gas, used to determine and quantify the
greenhouse gas impact of different GHGs
Cutover: peat where the biologically and hydrologically active surface layer has been
removed, preventing natural sphagnum moss regeneration
Drained (peat context): peat that has been drained either artificially through ditches or
(in this report) effectively through management processes that have resulted in the
formation of drainage channels
Emission factor: coefficient allowing conversion of activity data into GHG emissions
GHG: Greenhouse Gas
Ha: Hectare
IACS: Integrated Administration and Control System; system for supporting farm subsidy
applications
IPCC: Intergovernmental Panel on Climate Change
LCM2007: Land Cover Map 2007 dataset/report, produced by CEH
LCS88: Land Cover of Scotland 1988 dataset/report, produced by Macaulay Land Use
Research Institute
Paludiculture: productive agricultural or forestry practices on wet or rewetted peat,
aimed at minimising GHG emissions while continuing land use
Peat: soil composed of accumulated organic matter that is only partially decomposed; in
Scotland, the technical definition of peat requires 50 cm depth of organic matter from the
soil surface
Peatland Action Project: a programme of peatland restoration coordinated by
NatureScot, linking funds for site restoration to survey and monitoring
Remote sensing: the use of data captured from equipment at a distance from the object
of interest; commonly taken to imply the use of drones, aerial photography or satellite
imagery
Sphagnum: a family of moss species commonly associated with peat bogs across the
UK, with slow decomposition rates under wet and cool conditions
Tier 1, Tier 2, Tier 3 etc.: levels of increasing methodological complexity and
sophistication for approaches adopted by the IPCC for assessment of GHG emission
from landscapes

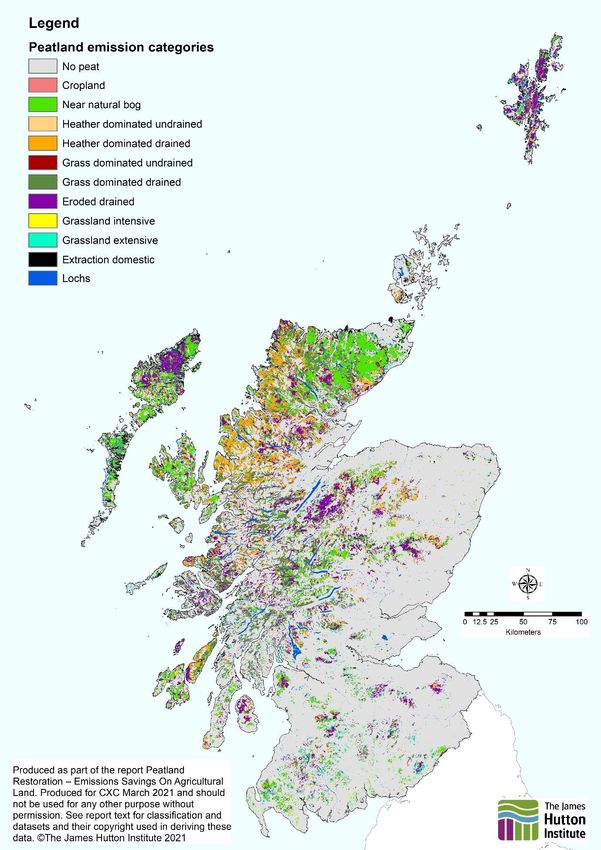
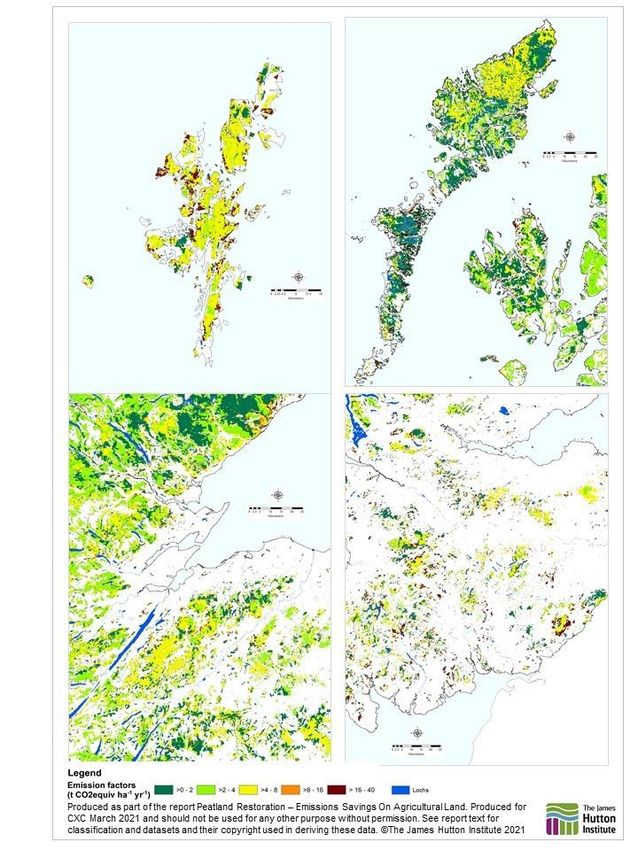
Page |6

2 Review of evidence
2.1 Summary of geographical peatland areas of Scotland likely
to provide the highest level of emission savings
Peat is a soil type formed of organic material from plants that is only partly decomposed,
due to climatic or local constraints that manifest themselves through waterlogging at
small to landscape scales since the last Ice Age. Approximately a quarter of Scotland’s
area is covered in peat, storing over 3 billion tonnes of carbon.
Mapping of Scotland’s peat has progressed through several stages over the last 50
years, from surveys of individual bogs to national-level efforts combining remote sensing
and modelling with field surveys. In the last 20 years, increased appreciation of peat as
a carbon sink (and potential source) has created a new impetus to understand where
peat is, what condition it is in and what land uses these historically undervalued areas
have been converted to. This report targets GHG emissions of agricultural peat,
providing evidence of where and how these emissions may be reduced.
2.1.1 The wider context - peatland emissions reporting in the inventory
Scotland’s GHG emissions are reported as part of the UK greenhouse gas emissions
national statistics 1. At the present time, the contribution of peatland emissions to the land
use sector figures has only recently been included in a provisional version of these
statistics2. This is based on analysis of draft peatland emission factors and spatial
mapping of land use patterns on peat by Evans et al. (2017) 3.
2.1.2 The methodology for this review
We used spatial data products of peat extent, carbon content, land cover and land use
(Section 6, Annex of maps and data) to map the likely current land use on peatland
across Scotland.
Figure 1 shows the map of peat emission factor categories we developed from existing
evidence. This map includes all areas identified as peatland in the previous Evans et al
(2017) report to UK BEIS. An improvement on the previous report to BEIS was made in
this evidence assessment: we used more advanced peat mapping4 in which further peat
deposits were discovered in Scotland and where areas with significant spatial
uncertainty in the Evans et al (2017) underlying data could be clarified.
Figure 2 shows these same areas but with the emission factor categories replaced by
their respective emission factor values. Large areas where low to moderate emission
factor (0-4 t CO2e ha-1 yr-1) have been identified are visible in green. Several moderately
large areas of high emission factor (4-8 t CO2e ha-1 yr-1) are visible in yellow, scattered
across the country. Most of the locations with very high emissions (orange, brown) are
areas of quite small spatial extent and thus not visible on a national extent map.
Figure 3 is used to clearly show examples of areas with higher emission factors that are
scattered throughout Scotland, with large areas visible in Shetland, Lewis and Harris,
the area between Inverness and Kingussie, and south of the Central Belt. The data from
these figures is summarised in Table 1, which provides an estimated total area and
annual emissions for each emission factor category. This gives a total for estimated

1
  https://data.gov.uk/dataset/final-uk-greenhouse-gas-emissions-national-statistics
2
  https://data.gov.uk/dataset/9a1e58e5-d1b6-457d-a414-335ca546d52c/provisional-uk-greenhouse-
gas-emissions-national-statistics
3
  Evans et al. (2017)
4
  Aitkenhead & Coull (2019)
Page |7

emissions from agricultural peat of 8.8 Mt CO 2e, which is lower than the total given in the
CCC Net Zero report (9.7 Mt CO 2e). This difference appears due to different peat extent
in the multiple maps used, and also to different approaches in identifying emission factor
categories between the Evans et al (2017) report and the present work, which uses a
different functional definition of drainage to the previous effort (see Annex).
The emissions associated with these land uses (called ‘activity data’ in the UK
Emissions) were used as per the draft UK-specific emission factors (termed ‘Tier 2”) for
consideration to be included in the UK National Greenhouse Gas Inventory 5 (see also
Section 4). Further details on the Tier concept are given in the Glossary.
2.1.3 Emission factor mapping
The methodology for developing the following maps is given in the Annex of
Methodologies and Underlying Assumptions. Briefly, the steps followed are: (1)
identification and mapping of the types of land use/land management on peat throughout
Scotland; (2) mapping of the emission factor values using Tier 2 va lues from6. Areas
with higher emission factors have the greatest potential for reducing emissions if
restored to functional peatland.

5
    Evans et al. (2017)
6
    Evans et al. (2017)
Page |8 Figure 1. Map of peatland emission categories.
Page |9

Figure 2. Map of emission factors for peatland under agriculture/no agriculture
P a g e | 10

Peatland emission category              Area (ha)           Draft Tier 2               Emissions (t
                                                      Emission factor (t                CO2eq yr-1)
                                                        CO2eq ha-1 yr-1
Cropland                                      73                  38.98                        2,846
Near natural bog                         638,100                   0.01                        6,381
Heather dominated undrained               21,121                   2.08                       43,932
Heather dominated drained                389,796                   3.40                    1,325,306
Grass dominated undrained                 30,244                   2.08                       62,908
Grass dominated drained                  412,180                   3.40                    1,401,412
Eroded drained                           591,266                   4.85                    2,867,640
Grassland extensive                      108,019                  19.02                    2,054,521
Grassland intensive                       24,111                  29.89                      720,677
Extraction (domestic)                     42,248                   7.91                      334,181
TOTAL                                  2,257,158                                           8,819,804
Table 1. Areas and total emissions for peatland emission categories.

Emission factor values are taken from 7, area figures are from this current work. Areas under forestry
were excluded as these are reported using outputs from the CARBINE (Forest Research) model
(“Tier 3”) rather than using the draft Tier 2 emission factors.

2.1.4 Cropland
The area identified as cropland in Table 1 is lower than identified in previous work6. This
is because the two approaches to identifying emission categories are different and used
different underlying datasets. In this work, some areas of agricultural land that are part of
a cropping-grassland rotation will have been identified as grassland categories due to
the methodology used to identify grassland in the LCM2007 dataset used.
We do not consider the difference between this and previous work 6 to imply significant
differences in total GHG emissions, as cropped peatland is a very small fraction of the
total agricultural peat area in both cases.
2.1.5 Drainage
Drainage classes in this report cover a larger area than in previous work6 and are
responsible for a significant proportion of agricultural peat GHG emissions. This work
took a broad view of the definition of drainage in peat as conditions where the water
table was ‘artificially lowered’, and therefore where evidence of land management
existed that implied the outcome of a lowered water table, this was assumed to mean
drainage. This would therefore include, for example, eroded peatlands as drained
eroded land cover classes. In contrast to this, Evans et al (2017) used a definition of
drainage that was limited to the existence of man-made drainage ditches. Under their
definition, eroded peatland without man-made ditches were classified as ‘eroded’
whereas those with ditches were classes as ‘eroded drained’. This has important
consequences for the assignment of emission factors and overall emissions calculation
approaches and hence the two methodologies produce different outcomes.
One drawback of the Evans et al (2017) work was that no spatial data product of
drainage ditch distribution across Scotland or the UK exists. In the Inventory
implementation, drainage proportions were taken to be a proportion of the overall land
area, informed by estimates of drainage across Scotland’s’ peatland area from two 2017

7
    Evans et al. (2017)
P a g e | 11
pilot studies performed for ClimateXChange 8. However, while this approach results in a
robust reporting method for international emissions reporting, it does not allow for spatial
identification of drained versus undrained areas. This is an important data gap that
requires to be addressed, for example, by using remote sensing to map drainage
features across Scotland and the UK more widely. Further clarification is also required
with the Inventory team to make the distinction between ‘intentional’ drainage (i.e.
drainage channels) and ‘unintentional’ drainage (e.g. erosion/overgrazing features,
vegetation change).
Remote sensing could be used to map peat drainage and erosion classes more
effectively. Both visible (e.g., aerial photography, Sentinel-2) and radar (Sentinel-1) have
potential in this area and there is a large body of literature on this research topic.
8
https://www.climatexchange.org.uk/research/projects/detecting-peatland-drainage/P a g e | 12
Figure 3. Areas of Scotland with high emission factors for peatland under agriculture.
There are two points of note when considering Table 1 & Figures 2 & 3: firstly, cropland
on peat, while having very high emission factor per unit area, only covers a small area of
Scottish land, and so does not contribute meaningfully to the emission inventory;
secondly, ‘semi-natural’ categories (e.g., grassland-dominated drained and heather-
dominated drained), along with extensive grazing, contribute the vast majority of
emissions from agricultural peatland.
An important point is therefore visible here: that agricultural peat with the poorest
capability also presents the greatest opportunity for emission reductions.P a g e | 13
2.1.6 Loss of livestock grazing
Much of the peatland identified as providing an opportunity for GHG emission reductions
in Scotland is grazing land. Removal of livestock from this land, to allow other
agricultural practices, implies a loss of income for land managers. It is important to
quantify this potential loss of income by exploring livestock density and the rate of
current income from livestock per unit area.
To provide a benchmark figure for the profitability of livestock grazing in Scotland,
figures for 2013/149 indicate that the gross margins (sales revenue minus cost of
production) of hill farming are approximately 18 GBP per hectare for ewes (assuming a
stocking density of 3 animals per hectare) and 118 GBP per hectare for cows (assuming
a stocking density of 0.7 animals per hectare). For lowland, the corresponding gross
margins are 95 GBP per hectare (assuming a stocking density of 5 animals per hectare)
and 288 GBP per hectare (assuming a stocking density of 1 per hectare) respectively.
Note that gross margins do not include fixed costs and capital depreciation which could
mean many livestock enterprises actually operate at a loss on average. Stocking rates
are for UK, while the GBP figures are for Scotland.
Currently, livestock grazing figures are not available at sufficiently high resolution to
directly link livestock density to emission factor maps. If successful, this would provide a
way to spatially determine trade-offs between gross margins and emission reductions
(i.e., ‘what emission reduction can be achieved here per unit of loss to farmer income?’).
Livestock movement and preferential stocking within the 2 km resolution mapping
available from AgCensus prevents us from linking these two pieces of information.
2.2 Quality and coverage of spatial data on peatland in Scotland
2.2.1 Individual datasets
The quality and coverage of spatial data on peatland in Scotland is mixed. In the last 40
years, there have been many requirements on gathering information on Scotland’s soils,
land use and land cover. Examples include where best to grow arable crops, the
presence of different vegetation types and the proportion of different soils within an area
of land.
The relevance of resulting datasets to spatial variability of peat greenhouse gas
emissions has been variable, with no mapping having specifically targeted this question.
The result is a complex Venn diagram of data which helps us to understand where peat
soils can be found, what condition they are in and what land use is present on them.
Strengths
The LCS88 dataset, although now over 30 years old, is a robust and still relevant source
of information. The quality of the original work has been demonstrated multiple times
since its development.
Soil mapping at a national level is considered reliable and accurate at the catchment
level but needs to be updated and maintained to account for changing soil conditions.
For peat soils in particular, recent work provides good-quality mapping including details
of location, depth and carbon stock. Currently, multiple datasets exist that need to be
harmonised and integrated to provide a dataset for consistent use by all stakeholders.
Weaknesses
9
Moxey, 2016P a g e | 14 Until recently land cover mapping was not updated frequently, and datasets generated since the LCS88 have been problematic – particularly in relation to heath and peatland vegetation discrimination. This has led to continued reliance on the LCS88 as a ‘gold standard’ for land cover data in Scotland, and we feel that this reliance is becoming problematic due to the amount of time in which changes to land cover could have occurred. National-level mapping of soils at sufficiently high spatial resolution for this report requires disaggregation of the 1:250k Soils Map of Scotland. There is ongoing work to accomplish this, but current data requires workarounds and assumptions that reduce confidence in the outputs. Grazing intensity data derived from LCM2007 & AgCensus 2015 provided livestock stocking density data at 2km resolution. Given the potential variability in soil and land cover within that distance, the effectiveness of this data is not optimal. Potential improvements Due to differences in measurement techniques and accuracy of data collection, some of the best quality environmental and land management spatial data in Scotland is relevant to this report but not directly aligned with the questions being asked. We have given recommendations later in the report on how to improve on dataset quality and suitability in future. Reliable high-resolution mapping of Scotland’s soil, land use and land cover is recommended in particular. At the initiation stage for this project, discussions were held about the possible use of IACS data as a tool, given its more detailed and up to date information on land management. However, data privacy and information sensitivity concerns prevent its use for this report. Future work in this area would be greatly improved through the inclusion of IACS data, particularly on (i) livestock density and location and (ii) crop rotation practices. The use of Peat Scotland data implies some circularity, as it was derived using other datasets used here. The specific categorisation approach used was still effective for evidence assessment, but a more independent map of peat condition would be better. 2.2.2 Uncertainties caused by data integration It is important to emphasize that the spatial datasets used in this report come from different sources; they were produced in different years and rely on different underlying data sources and methodologies. This means they do not always agree with one another. Details of this uncertainty are explored in detail at Appendix 7. Additionally, no information could be found for locations where industrial extraction of peat is, or has been, taking place in recent years. An assumption has therefore been made that all extraction areas identified in LCS88 were of a ‘domestic’ nature i.e., small- scale extraction or domestic use only. The reason for this assumption is that while industrial peat workings are identified in the LCS88 dataset, these would now be over 40 years older than when first identified (and may have been active for many years before that), and many of them will have been exhausted and may now be under different land management. This assumption should be validated as it may be incorrect. Recent CXC reporting indicates emissions on the order of 0.1 Mt CO2e yr-1 ( 10). Two points of note are identified from the uncertainty assessment: Firstly, cropland, while having very high emission factor per unit area and being confidently identified, covers a small land area. It is therefore possible to focus 10 Litterick et al., 2020, https://www.climatexchange.org.uk/research/projects/alternatives-to- horticultural-peat-in-scotland
P a g e | 15
peatland restoration efforts on non-cropland areas, which generally are considered to
have lower productivity. If it were a priority to maximise emission reductions on
agricultural peat while minimising impacts on farm productivity, then this would inform
the ability to do so. We acknowledge that this would be a policy decision.
Secondly, the categories that contribute most emissions (eroded peat, heather
dominated drained, grass dominated drained) also have greater uncertainty, because
it is difficult to distinguish between these specific classes, rather than between these
classes and for example, intensive grazing, cropland or near natural bog. The classes
where misclassification occurs often have been allocated the same emission factor.
This misclassification into functionally similar classes (from an emission perspective)
reduces the level of uncertainty for overall emission estimates but may be misleading
if the emission factor allocations are incorrect for these classes.
The approach to classification taken in this report also differs substantially to the
methodology in11 and so the results cannot be directly compared. This is predominantly
due to differences in classification between the LCS88 and LCM approaches, as well as
a difference in how drainage was defined between 12 and the present work. Additionally,
the peat depth map13, based on thousands of measurements from Peatland Action Plan
survey work) provided an additional data source not available at the time of the Evans et
al. work. For more information, see 14 and Section 4: Annex on methodologies.
It is emphasised that emission category area values in15 and this report are based
on sound methods, but that variation exists due to the remaining uncertainties in
both peat extent and land cover mapping data (further discussion in Section 3).
2.3 Review of evidence for potential agricultural uses of
rewetted peat
Most of Scotland’s lowland peats have been historically drained to create high grade
arable and horticultural land. This exposes previously waterlogged organic matter to
decomposition, compaction, subsidence and oxidation, ultimately leading to significant
emissions of carbon dioxide (CO2).
Cropped peatland in England (69% of which is horticulture, remainder in arable/cereal
production) loses typically 10 to 30 mm of peat yr -1 due to subsidence and oxidation, and
GHG emissions are 10 times higher than emissions from upland peat 16. We do not have
similar data for cropped peatland in Scotland, although it is likely that values for both
depth loss and GHG emissions are similar if slightly lower due to climatic conditions.
Reducing vegetation cover (as happens during fallow periods) on carbon-rich soil
increases the risk of soil erosion, which thus reduces soil carbon levels. Peatland in
good condition can retain carbon and additionally sequester around 0.2 to 0.8 t C ha -1 yr-
1
under optimal conditions 17, 18.
In our analysis, we found evidence of very little area of cropping on peat in Scotland.
Discussions with colleagues at the James Hutton Institute indicated that there are likely
11
Evans et al. (2017)
12
Evans et al. (2017)
13
Aitkenhead & Coull, 2019
14
Evans et al. (2017)
15
Evans et al. (2017)
16
Mulholland et al., 2020
17
Artz et al., 2014
18
https://www.nature.com/articles/s41586-021-03523-1P a g e | 16
to be scattered, small areas of peat soils under arable cropping that have not been
included in existing soil maps; these are difficult to identify during field survey or other
identification processes (e.g., including remote sensing) due to the very high degree of
modification of the remaining underlying peat. Conventional agricultural cropping should
be excluded from consideration as an option for land management on peat. Conversion
of rewetted peat to agriculture can release significant amounts of additional emissions
per year, estimated at 6.5t C ha -1 yr-1.
Alternative land management options should be considered, including the option of ‘no
productive management,’ which removes the risk and impact of carbon release from
land management activities.
Several strategies have been proposed to tackle emissions from agriculturally used
peatland, including:
Conservation agriculture (e.g., zero tillage systems).
Seasonally raising water tables (between cropping cycles).
Raising water tables year-round and replacing arable and horticultural crops with
wetland agriculture, also known as paludiculture (e.g., bioenergy crops,
Sphagnum for growing media or food/medicinal crops) 19.
Full restoration of semi-natural wetland habitats.
Conservation agriculture and seasonal water table manipulation require no change in
land use but offer only modest emissions savings. They also require investment,
intensive effort and constant water table monitoring, while restricting management
activities in ways that reduce farm income. Therefore, while appropriate for some land
management goals, they are not considered appropriate for achieving the objectives
aligned with this report; namely, significant greenhouse gas emission reductions.
In the previous section, we provided spatially discrete information on agricultural peat
and the potential emission savings that could be achieved through rewetting. In this
section, we explore different paludiculture options that could potentially provide
agricultural productivity on rewetted peat.
Paludiculture and full restoration offer more significant emission reductions because they
retain high water tables all year round, but there are more significant social and
economic barriers to these significant changes in land use. The costs and benefits of
paludiculture are complex, and specific conditions in Scotland place significant
constraints on the application and effectiveness of this approach.
2.3.1 Paludiculture - introduction
Paludiculture is defined as the “productive land use of wet peatlands that stop
subsidence and minimizes emissions” 20. In principle, paludiculture has potential
application in Scotland, particularly for bioenergy cropping. Approaches to paludiculture
fall under two categories involving the management and harvesting of either
a) deliberately planted crops, e.g., Sphagnum moss farming (for potential growing
media and other uses) or
b) spontaneously established, naturally occurring plants, e.g., reed harvesting.
These two approaches represent an important distinction between high intensity and low
intensity paludiculture. Paludiculture has applications in both lowlands and uplands, as
19
Schäfer, 2012
20
Tanneberger et al., 2020aP a g e | 17 well as in groundwater-fed land such as fens, and rainwater-fed land, such as blanket bogs 21. Paludiculture could provide income from a number of sources alongside a wide range of cost savings and other benefits to landowners and wider society. Direct income from paludiculture varies by crop but is typically lower than the income from existing arable and horticultural uses, giving rise to significant opportunity costs (see next section). Given the other costs associated with paludiculture (covered in the next section), this creates a significant economic barrier to farmers considering changing their land use. However, when combined with private payments for ecosystem services and public funding via agri-environment schemes, paludiculture may provide sufficient income to overcome these barriers. In the context of these other income streams, it is therefore important to understand the economics of the main paludiculture crops. The literature mentions the possibility of producing a wide range of plants under paludiculture, including Sphagnum, sundews (Drosera), purple moor grass, blueberry and cranberry, common reed (Phragmites australis), Reed Canary Grass (RCG) (Phalaris arundinacea), cattail (Typha spec.), willow (Salix species), alder (alnus glutinosa), wild rice (Zizania palustris), celery (Apium graveolens), sedge (Carex spec.) hybrid napier grass, giant reed, meadowsweet (Filipendula ulmaria), valerian (Valeriana officinale) and butterbur (Petasites hybridus) 22 23 24 25 26 27 28. These species can be used for: Growing media – Sphagnum moss Packaging and matting – Sphagnum, reeds Biofuels – reeds, alder, willow, napier grass Building materials – cattail, purple moor grass, reeds, alder, willow Water treatment – cattail Soil improver (biochar) – reeds Compost – reeds, Sphagnum As donors of plant material for additional peatland restoration or paludiculture Food – cattail, blueberry and cranberry, wild rice, celery Medicine/pharmaceuticals – meadowsweet, valerian and butterbur, drosera Most of these uses have been suggested rather than tested in the field for practicability or economic benefit. Published field studies have mainly focused on Sphagnum moss farming and reed harvesting and none of these have taken place in Scotland, with very few under conditions similar to the Scottish climate. From the perspective of atmospheric impact, the most suitable agricultural option for an abandoned peat extraction area appears to be cultivation of Reed Canary Grass (RCG)29, which is grown as a commercial bioenergy crop in some northern European countries. 2.3.2 Afforestation Some forestry practices are included in the definition of paludiculture. However, the UK Forestry Standard states that new forests should not be established on deep peat (where the peat layer is deeper than 50 cm), or on sites where planting would 21 Ferré et al, 2019 22 Pouliot et al., 2015 23 Baranyai & Joosten, 2016 24 Dragoni et al., 2017 25 Jensen & Eller, 2020 26 Jurasinski et al., 2020 27 Tanneberger et al., 2020b 28 CANAPE, 2021 29 Jarveoja et al., 2013
P a g e | 18
compromise the hydrology of adjacent bog or wetland habitats. This exclusion covers all
of the areas identified as peat in this report. The implementation of Short Rotation
Forestry (SRF) or Short Rotation Coppice (SRC) (e.g., alder, willow) therefore cannot be
carried out on this type of land.
Converting peatland to forestry by draining and planting has been shown to lead to net
carbon emissions, over and above the carbon stored in the trees. In general, on shallow
peat/organo-mineral soils in Scotland, planting forestry with limited disturbance
increases soil carbon storage, whereas on deep peat, planting forestry decreases soil
carbon storage and increases GHG emissions. Planting of two Scottish native tree
species ((birch (Betula pubescens) and Scots Pine (Pinus sylvestris)) on peat soils does
not result in net carbon sequestration across medium-term (10-20 year) timescales.
Current scientific evidence and Scottish Government policy are in agreement that
afforestation on peat is extremely high-risk and that alternatives should be sought.
2.3.3 Food / medical crops
There are a number of food and medicinal plants that could be grown as paludiculture
crops in Scotland, and there are a range of crops that can be used for building and
insulation30 31, with experiments currently being conducted on the use of cattail (Typha
spp) paludiculture for use as insulation material in The Netherlands 32. See33 for a
database of 800 potential paludicultural plants, many of which could be grown in
Scotland. However, most of the interest and published evidence pertains to bioenergy
crops (for which there is an existing market), and Sphagnum for direct use in horticulture
or as a growing medium (where markets are currently small or under development).
2.3.4 Low intensity harvesting of reeds for biogas or construction
Recent scenario-based economic modelling, based on central European examples,
assessed the Contribution Margin (gross margin per unit of product) of harvesting
common reed (p. australis) for the harvesting of various products. The model calculated
costs of harvesting, transportation to field edge and processing, machinery costs, labour
and depreciation.
Chaff for biogas: the modelling suggests that revenues would currently almost
certainly not cover costs. The mode Contribution Margin was –195 EUR/ha.
Bales for combustion: the break-even point would be reached 82% of the time, with
a mode Contribution Margin of 53 EUR/ha.
Bundles for thatching: producing thatching products (including mats, screens etc)
would be almost guaranteed to break even and would provide a Contribution
Margin of over 500 EUR/ha.
The results indicated that the production of reed bundles for thatching would bring the
greatest financial rewards, and thus provide the best income improvement opportunities
when moving from livestock grazing.
However, gaining market access for Scottish thatching would be challenging. A new
domestic entrant into this market would face strong competition from existing dominant
global producers in Hungary, Romania, Turkey and China. Competitivity is also reduced
by the fact that the thatching currently grown in the UK is not considered of sufficient
quality, which explains why the UK imports the vast majority of its thatching.
30
Wichtmann & Schäfer, 2007
31
Wichtmann & Tanneberger, 2011
32
Jong, 2020
33
Abel et al. (2013)P a g e | 19 Additionally, there are estimated to be only 80 properties in Scotland with thatched roofs and 6 professional thatchers. The domestic market capacity for traditional roof thatching is therefore low. 2.3.5 Bioenergy crops There is currently limited evidence for the commercial viability of bioenergy paludiculture crops, and as such it is important to avoid making simplistic assumptions about the viability of bioenergy crops for paludiculture in Scotland based on data from other countries where conditions may be very different. One of the most comprehensive farm- level studies of bioenergy production from paludiculture focussed on reed (Phragmites australis) production in central Europe using three different harvesting options. This estimated that after subtracting variable costs and fixed machinery costs, returns could range from a loss of around £870 ha −1 yr−1 to a profit of £1300 ha −1 yr−1, with winter mowing for direct combustion the most cost-efficient option34. Research in England has investigated a range of options for bioenergy from rewetted peatland sites, including an assessment of potential yields of different crops based on data from the UK and Europe, a cost comparison of different harvesting machinery and options for on-site bioenergy production including anaerobic digestion and conversion to briquettes and pellets 35. The report also considered pyrolysis to convert biomass to biochar for use as a soil amendment to improve soil structure and fertility while increasing soil carbon storage, options for supplying existing conversion plants, including large-scale anaerobic digestion and combined heat and power plants, and reviewed Government funding schemes at the time to incentivise renewable energy production from biomass. Of particular interest was the proposal of community funding models based around district heating schemes where local communities form a co- operative organisation and receive a share of the profits from the sale of bioenergy or receive cheaper energy 36. There are organic soils where cultivation of perennial bioenergy crops is possible with low resulting emissions in nitrogen oxide and methane (two significant greenhouse gases)37, but it has not been demonstrated that this is possible in Scotland. Studies of the properties of carbonized biomass (either hydrochar or pellets) reveal that fuel grade hydrochar can be produced from peat moss, or from the blend of peat moss and miscanthus (agricultural biomass/energy crops). It is possible that this carbonised biomass can be used in existing coal-fired power plants 38. Calluna vulgaris (heather) and could also represent an efficient energy crop in areas where it would not be possible to revert to functioning peat bogs, but evidence is limited to modelling work (e.g.,39. Reed Canary Grass (RCG) RCG cultivation could be a good land use option in terms of mitigating GHG emission from rewetted peatlands, potentially turning these ecosystems into a sink of atmospheric carbon dioxide 40. No significant short-term effect of biomass harvest on net greenhouse gas balances was found in one study from Germany, in which 17 t CO 2e ha-1 yr-1 was saved by rewetting compared to a drained state 41. However, no such studies have been 34 Wichmann, 2017 35 Mills, 2016 36 Mills, 2016 37 Hyvonen et al., 2009 38 Roy et al., 2018 39 Worrall & Clay, 2014 40 Karki et al., 2015 41 Gunther et al., 2015
P a g e | 20

carried out in Scotland, which has markedly different climate, soil and topographic
conditions that make comparison with studies from other countries problematic.
Overall, it is suggested that maximizing plant growth and the associated carbon dioxide
uptake through adequate water and nutrient supply is a key prerequisite for ensuring
sustainable high yields and climate benefits in RCG cultivations established on organic
soils following drainage and peat extraction 42.
Studies of Reed Canary Grass grown on cutover peat (i.e., peat where cuttings have
been made for extraction) in Ireland found that biomass yields were lower than
expected43. For bioenergy-based paludiculture, combustion quality/efficiency varies
between different crops, depending on nutrient availability and other conditions 44. Site-
specific management would therefore be necessary to optimise productivity in different
locations. Combustibility performance also appears to be influenced by having a
combination of different crops grown under different conditions 45.
Studies have shown that the cultivation of Reed Canary Grass transformed degraded
peat from a net source of carbon into a net sink of carbon (e.g., 46. After six years of
cultivation, old peat decomposition contributed less to total soil respiration than
respiration of recent plant material (30% vs. 70% on average, respectively), but the
relative proportions were highly variable over the growing season47. Maintaining a high
water table is critical to preserve this, because of growth requirements. Wet years create
conditions which enable a high uptake of atmospheric carbon dioxide by Reed Canary
Grass. Dry years on the contrary are marked by long dry spells during important phases
of crop growth, which results in corresponding reductions in gross ecosystem
productivity 48.
Other grasses
The perennial high yielding energy grass Miscanthus (commonly known as Elephant
grass, a tropical species) is reported to not fully compensate for organic matter loss in
drained peatland. Miscanthus is also more suited for organo-mineral and mineral soils.
See also the description of the UK Forestry Standard exclusion in the Afforestation
section above which has been interpreted to specifically exclude miscanthus.
The Common Reed (Phragmites australis) can sequester substantial amount of carbon
dioxide each year (estimated at 4-13 tonnes CO2e per hectare per year depending on
climate conditions). However, this is re-emitted if the reed is used as a substitute for
fossil fuels creating an overall negative carbon balance from using this reed plant for
burning. If the reed crop is used as building materials or returned to the soil in unreactive
forms, it has the potential to contribute directly to long-term sequestration of carbon
dioxide. Another peatland plant, Bulrush/cattail (Typha latifolia) has unknown impacts on
management of levels of methane (which contributes to the CO2e inventory) and it is
likely that biogas production may be economically unviable. Additionally, these two
plants grow on fen habitats rather than blanked or raised bog, and so potential growth in
Scotland is limited.
2.3.6 Sphagnum for horticulture
Peat is currently the most widely used growing medium for professional growers in the
UK, but the environmental impact of peat extraction for horticulture has driven calls for

42
   Jarveoja et al., 2016
43
   Laasasenaho et al., 2020
44
   Ren et al., 2019
45
   Giannini et al., 2016
46
   Mander et al., 2012
47
   Biasi et al., 2011
48
   Shurpali et al., 2013
P a g e | 21

peat to be phased out, with voluntary targets set by Defra and CCC 49 50. However,
progress has been limited by a lack of viable peat-free alternatives due to cost or
performance issues 51 52 53 54.
Sphagnum farming aims to provide a renewable and therefore more sustainable source
of biomass for growing media with similar properties to peat. Several factors influence
the commercial viability of Sphagnum production including: the growth rate of the
chosen species of Sphagnum, the effect of species choice on the water holding capacity
and air-filled porosity of the resulting growing media, and the nutrient content of water
supplying plants (growing media needs to be low in nutrients so growers can tailor
nutrition to the species they are growing).
Moreover, there are several notable challenges to production, including sourcing
material for propagation, the irrigation and management of water quality to ensure
Sphagnum outcompetes weed species, weed control and challenges around the
mechanisation of planting, harvesting and processing 55. Despite several ongoing
experiments demonstrating that it is possible to achieve harvestable yields (e.g. 56 57 58 59
60 61
  ), concluded that continued testing was required to determine the suitability of farmed
Sphagnum as a growing medium, prior to any evaluation of commercial viability.
2.3.7 Paludiculture & solar power/wind turbine
Paludiculture could be complemented with photovoltaic panels supported by scaffolding
or rail systems above the peat surface 51. This option could particularly be considered for
Sphagnum cultivation as the increased humidity and partial shade caused by the
photovoltaic panels may support the growth of sphagnum. Wind turbines could also be
an option, as long as the installation and management of the wind turbines do not lead
to large-scale damage of the peat51. Academic literature emphasises that future policy
should avoid constructing wind farms on undegraded peatlands unless impacts can be
minimised.

49
   Defra, 2018
50
   CCC, 2020
51
   AHDB, 2016
52
   Defra, 2011a
53
   Mulholland et al., 2020
54
   Litterick et al., 2020
55
   Mulholland et al., 2020
56
   Gaudig et al., 2008
57
   Emmel, 2008
58
   Kumar, 2017
59
   Kämäräinen et al., 2018
60
   Gaudig et al., 2017, 2018
61
   Mulholland et al., 2020
P a g e | 22

3 Conclusions and recommendations
2.3.1 Confident knowledge
A large proportion of Scotland’s agricultural land on peat is of relatively poor production
capability, with associated low productivity but with significant GHG emissions. The
economic cost of incentivising land managers to reduce agricultural practices (mostly
grazing) on this land is relatively low per unit area. However, changing these land
management practices will have economic impacts in parts of Scotland where
opportunities for replacement income are poor; there are also social impacts to consider
where specific land management practices are common (e.g., crofting). Challenges with
traditional grazing practices on peat exist, but there may be opportunities for low-density,
high-quality livestock grazing with low GHG emissions on restored peat.
Specific geographical locations have been identified where conditions combine to
provide a good opportunity for significant emission reductions. The case for replacement
agricultural practices that are economically and physically viable is less strong than the
case for rewetting and restoration of natural peat vegetation; in many cases, it is not to
be recommended. Financial incentivisation for land managers to implement these
emission reductions therefore appears mostly aligned with ‘compensation’ rather than
‘market opportunities’.
Sphagnum cultivation for biomass production as a growth medium to replace peat-based
compost does not have a strong economic case and has multiple biophysical and
socioeconomic barriers. It is currently mostly practiced in the northern hemisphere in
rewetted cutover bogs previously used for peat extraction. The cultivation of reed for
bioenergy, in combination with providing additional land-use functions, is not a viable
option under current economic and political conditions. However, it may become
competitive within the next twenty years if policy is implemented that increases
bioenergy prices 62. It may also become viable if policy is implemented that stimulates
water buffering and the preservation of peat soils to improve the physical condition of
peat soils to a state where reed cultivation is possible. However, reed growing on peat
has not yet been tested at scale in Scotland; there may be value in experimental work to
evaluate viability, and carbon benefits, of this option.
In the past, afforestation has been demonstrated as the most popular after-use method
for agricultural and cutover (extracted) peatland among landowners 63; however, this is
no longer policy in Scotland and has been demonstrated to increase emissions.
Of the suitable options studied here, energy crop cultivation has potential, but is highly
dependent on economic profitability and subsidies. Landowners with interests in
achieving high environmental standards have been shown to be more interested in
biomass production. However, evidence gathered for this report shows that the
biological and physical suitability of energy crop cultivation on peatland is restricted to
peats that have largely been extracted or degraded to the point where they are no longer
able to sustain peat vegetation (e.g., Sphagnum).
Spatial analysis methods used in this report to identify peatlands suitable for emission
reductions could be applied in many other countries, if appropriate data is available.

62
     Kuhlman et al., 2013
63
     Laasasenaho et al., 2017
P a g e | 23
2.3.2 Significant knowledge gaps
A future goal could be to use cutover/extracted peat production lands for bioenergy crop
production to mitigate climate change while providing farmer income 64, but many
questions remain before this can be assured.
There is reasonable agreement on the location of peat in Scotland, from datasets
produced using a number of different approaches. This provides a strong evidence base
for peat location at good spatial resolution. However, the different approaches taken in65
the present report have predicted peat in some locations in disagreement with one
another, for example on floodplain valley bottoms or small pockets of land in the north-
west Highlands. Exploring the discrepancies between these maps would provide insight
into peat formation and allow us to improve our understanding of the conditions
necessary for restoration.
The uncertainties in the extent and specific location of peat deposits across Scotland
therefore also place significant uncertainties on the areas that are likely to be under a
given land cover, even if spatial mapping of land cover were accurate, complete for all
the condition categories required for the UK GHG inventory, and up to date. At present,
land cover mapping for Scotland has considerable uncertainties both in terms of
potential misclassification errors and the degree to which certain land cover types or
drainage are mapped. These issues compound when data products of different vintages
are combined and thus lead to considerable mismatches between the outcomes of 66 and
the present work. This also makes it difficult to carry out serious spatial analyses of the
potential of specific approaches such as paludiculture (e.g.,67).
The long-term impacts of harvesting common reeds or other bioenergy crops on GHG
emissions in peatlands are unknown, and future studies would be useful to assess the
sustainability of such practices for bioenergy production. In addition, the short-term
benefits are not proven for Scottish conditions. Environmentally sound bioenergy
production has been demonstrated on peat soils in a small number of field experiments
(e.g.,68). However, as long-term experimental data on the GHG balance of bioenergy
production are scarce, more (and more detailed) scientific data stemming from field
experiments are needed to help shape renewable energy source policies 69.
2.3.3 Active debate
Results from ongoing field experiments suggest that paludiculture has the potential to
reduce overall GHG emissions relative to conventional drainage-based agriculture or
peat extraction; the reduction is mostly created by avoided emissions from deep-drained
peat cropland (as high as 25-30 t CO2e ha-1 yr-1). Several studies, albeit based in other
countries, suggest that paludiculture sites could become a net CO 2 sink. However,
results from other field experiments disagree with those studies. The harvesting of
sphagnum biomass, in particular, is considered likely to prevent peat from being a long-
term carbon store and is also likely to cause further peat degradation 70. Full life-cycle
analysis of harvested products on all types of paludiculture is also not complete and is
needed to provide a clearer understanding of which paludiculture crops could provide a
net carbon sink under what conditions, and where this may be possible.
64
Laasasenaho et al., 2016
65
Evans et al (2017)
66
Evans et al (2017)
67
Schlattmann & Rode, 2019
68
Shurpali et al., 2010
69
Karki et al., 2016
70
Wichmann et al., 2020P a g e | 24 Some bioenergy crop production on peat would require pH adjustment, usually accomplished through liming. There is disagreement on whether this would lead to negative impact by increasing emissions, as has been reported in multiple field experiments, or whether the impacts of liming on cultivated peat have been overestimated due to misunderstanding of the effects on soil biological processes.
P a g e | 25

Appendix 1: rationale and policy links
The Intergovernmental Panel on Climate Change (IPCC) published a new report on
emissions from drained peatland in 2014, the 2013 Supplement to the 2006 IPCC
Guidelines for National Greenhouse Gas Inventories: Wetlands 71, which requires a more
refined reporting method for peatland areas. As this IPCC report also recommended that
countries with significant peatland extent implement a country-specific reporting
approach, the UK Government Department for Business, Energy & Industrial Strategy
(BEIS) commissioned a report to compile spatial data of land use on peatlands and their
likely emissions. The resulting report, “Implementation of an Emissions Inventory for UK
Peatlands”, suggested total emission from peatlands were likely to be significant and
would require a major change in Inventory reporting 72. The subsequent Committee on
Climate Change Net Zero report73 suggests peatland emissions to be in the order of
18.5-23 Mt CO₂e for the whole of the UK, and up to 9.7 Mt CO 2e for Scotland. These
values are in the same order as the entire forestry carbon sink for Scotland and
therefore it is of high interest to examine where emissions mitigation may be feasible.
The UK GHG Inventory captures emissions by calculating the emissions for a given land
use category (collectively these are called ‘activity data’) times its associated emission
factor (EF, a single average value of the equivalent of carbon dioxide, CO 2).

71
   https://www.ipcc.ch/publication/2013-supplement-to-the-2006-ipcc-guidelines-for-national-
greenhouse-gas-inventories-wetlands/
72
   Evans et al. (2017)
73
   https://www.theccc.org.uk/publication/net-zero-the-uks-contribution-to-stopping-global-warming/
You can also read