March , Volume , Issue - IIM Calcutta
←
→
Page content transcription
If your browser does not render page correctly, please read the page content below
Mar
  ch   ,Vol
          ume ,I
               ssue
Editor
Dr. Sudhir S Jaiswall
Faculty Member (Finance & Control Group)
Coordinator (Financial Research & Trading Laboratory)

Editorial Office
Ms. Priyanka Dasgupta
Assistant Manager (Financial Research & Trading Laboratory)
Email: artha@iimcal.ac.in
____________________________________________________________________________

Indian Institute of Management Calcutta
Diamond Harbour Road
Joka, Kolkata-700104
West Bengal, India
+91-33-7121-1141
A
            `
    N E W S L E T T E R   O F   T H E   F I N A N C E   L A B

      Indian Institute of Management Calcutta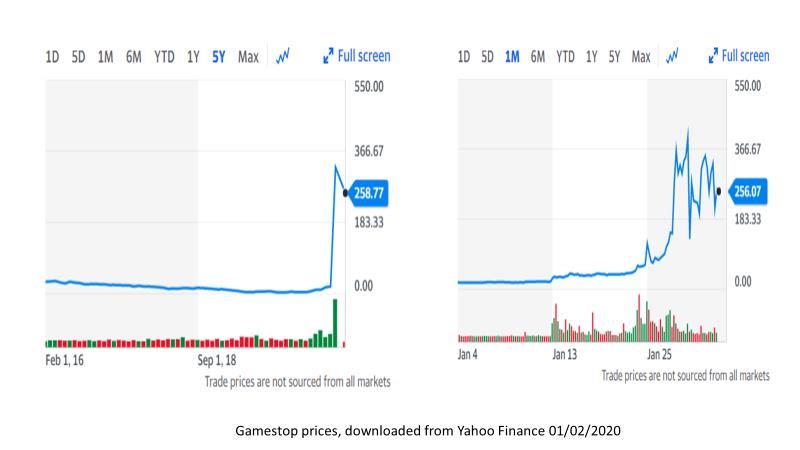
a₹tha (March 2021)

                                                                                                   Contents
1               Editorial

                Sudhir S. Jaiswall
__________________________________________________________________________________________________

2               Herding and Financial Markets: The case of REDDIT daytraders versus Hedge funds

                 Arvind Ashta
__________________________________________________________________________________________________

11               Return of the Market Stabilisation Scheme?

           Balachandran R
________________________________________________________________________________

16                Corporate Governance in India: Understanding the History and Peeking into the
                  Future (Part II)

                  Asish K. Bhattacharya
__________________________________________________________________________________________________

26               The Cost of Data Breaches

                  Yash Sharma
________________________________________________________________________________

35                P2P Lending and the MSME Sector

           Teerna Chatterjee
________________________________________________________________________________

Note: The views expressed by the authors in their article published in this issue of Artha are personal and do not necessarily represent
the views of their employer, or that of Artha, FRTL and IIM Calcutta. Authors are responsible for any permission needed for copyrighted
material used in their article.

Indian Institute of Management Calcutta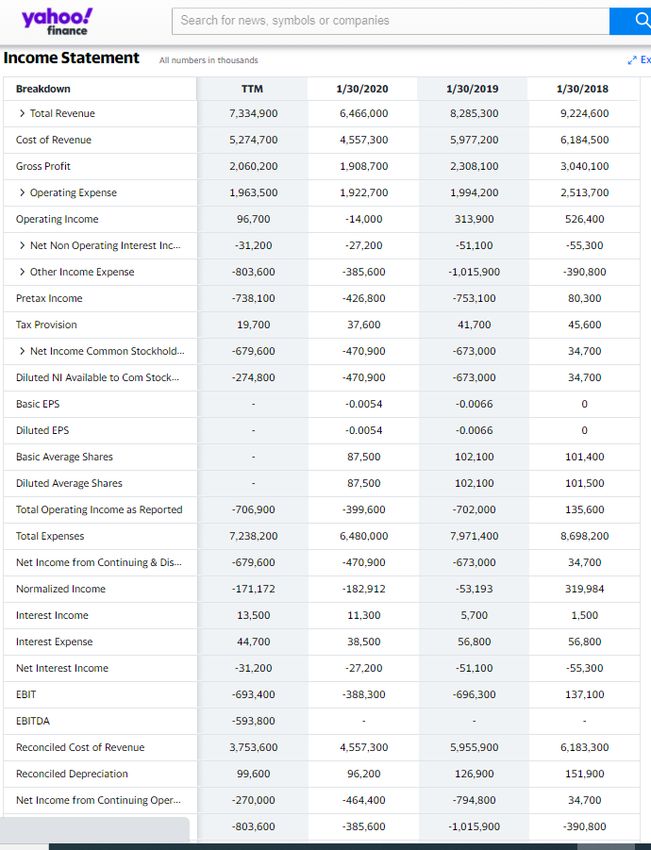
1
a₹tha (March 2021)

                                                                              Editorial
Welcome to the March 2021 issue, the fourth and final issue of A₹tha in the current fiscal year.

I am delighted to share with you, what a remarkable year 2020-21 was for A₹tha. We published 26 interesting
articles contributed by our stakeholders from India, Europe, and the USA: 6 articles by current & former IIMC
faculty members, 4 by current IIMC students, 11 by IIMC alumni, and 5 by non-IIMC contributors.

The current issue carries five articles. In the first article, the author uses a contemporary event, the REDDIT action
on GameStop, to lucidly explain various concepts related to financial, trading, security price determination, and
valuation. The second piece discusses the tools RBI uses to intervene in the foreign exchange market and their
intended and unintended consequences on domestic liquidity. The author concludes that open market operation
purchases of government securities may be the only option for RBI in the current context. The third article is the
second part of an extended essay (part I was published in December 2020 issue of A₹tha) tracing the historical
development of corporate governance in India and offering a perspective on the future of governance practices.
In the second part, the author outlines the governance practices in India after economic liberalization in 1991. The
fourth piece is on data breaches, which has affected numerous individuals, companies, and government agencies.
The author probes various issues related to breaches of sensitive data, provides examples of some of the significant
data breaches in recent years, and suggests what individuals and organizations can do to safeguard themselves.
The last piece provides a theoretical perspective on peer-to-peer lending and its potential impact on the Micro,
Small, and Medium Enterprises (MSME) sector.

I hope that you will enjoy reading it and continue to send your feedback, suggestions, and contributions to us at
artha@iimcal.ac.in.

Stay safe and in good health!

Sudhir S. Jaiswall

Editor

Indian Institute of Management Calcutta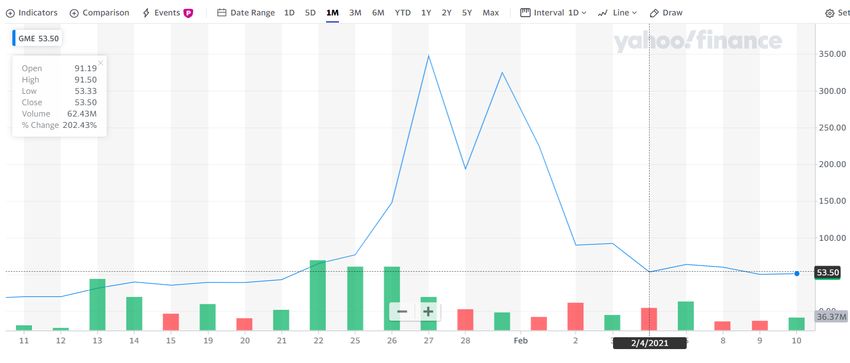
2
a₹tha (March 2021)

     Herding and Financial Markets: The case of REDDIT
                         daytraders versus Hedge funds

                                                Arvind Ashta

                          Dr. Arvind Ashta is an alumnus of IIM Calcutta (1980-82). He is now professor of Finance at the
                          Burgundy School of Business, Université Bourgogne Franche-Comté in Dijon, France, and is
                          member of its research center CEREN, EA 7477. His main research area is micro-finance, but he
                          sometimes writes on macro issues. He has over sixty publications in international journals. His
                          most recent book is “A Realistic Theory of Social Entrepreneurship: A Life Cycle Analysis of
                          Micro-Finance” (Palgrave MacMillan, 2020). He is a member of a club of micro-investors.

Introduction

The whole world was shocked. On January 28, 2021, the Financial Times reported that a group of small investors
beat the hedge funds (Wigglesworth, 2021). These investors made 300% returns in one day, and about 1500% in
2 weeks, while the hedge fund Melvin Capital lost more than $4.5 billion in January (Schroeder, 2021). The
question is, what happened?

It may be good to provide a small introduction for a non-financial audience as a background to the case. As you
know, the stock market trades in shares that represent ownership in a company. After obtaining shares from a
company, investors buy and sell these shares in the secondary market. They pay a commission to the broker who
gets the shares for them. Supply and demand establish the price as shown in the top panel of Figure 1. If demand
increases, the price goes up; if supply increases, the price goes down; and there is some equilibrium price. As
seen in the bottom panel of figure 1, investors can make profits by buying low and later selling high, hoping that
price will go up from P0 to P1 in the figure. But one could also sell high and later buy low. Hedge funds backed
by high net worth investors do this, hoping the price would go down from P0 to P2.

One problem with the system is that the commission per share charged to big investors is much smaller. If a
broker is given a deal of €1 million, he could ask for a commission of €1000, which is 0.1%. But if a small investor
wants to make a deal of €1000, the broker may ask for at least €10, which is 1%. The point is that the commission
percentage is higher for small investors, and the game is biased in favor of the rich. To compete effectively, small
investors get together in mutual funds. Once their collective trades are larger, they get the advantage of smaller

Indian Institute of Management Calcutta
3
a₹tha (March 2021)

fees, but they have to pay fund management fees. Besides reducing the commission costs, investors in mutual
funds also have lower risk since they can diversify into many stocks.

Figure 1: The first panel is a reminder of microeconomics, the lower panel is a reminder of financial economics.

To get higher returns, you need to take high risk, and for this, big investors group into hedge funds. Hedge funds
may be managed aggressively or make use of derivatives and leverage to generate higher returns. Hedge fund
strategies include long-short equity. For some shares, they sell them before buying.

Indian Institute of Management Calcutta
4
a₹tha (March 2021)

How do people decide whether the stock price is expected to go up or down? For this, some people do technical
analysis. They look at how the stock price has been behaving. They make fancy curves, and based on these, they
decide the expected trend. If the price is over this trend curve, they would like to sell. Others do fundamental
analysis where they look at the industry, the economic conditions, the past performance of the company itself,
and then they try to project future cash flows and decide what should be the expected fair value.

But not everybody is a long-term investor. The stock market has many participants who are speculating, and these
speculators realize the role of sentiments. If the market sentiment is optimistic, everybody wants to buy; when it
is pessimistic, everybody wants to sell. Speculators try to buy before others when they feel the market will be
optimistic and will sell later. Today, market sentiment is gauged by big data analyzed with artificial intelligence
tools.

The case study: Gamestop in the News

We now have the tools to study the case of GameStop, which has been the center of attention. GameStop is a
video game, consumer electronics, and gaming merchandise retailer based in Texas. It was founded 37 years ago
in 1984 and is the world’s largest video game retailer. It has about 5500 retail stores. This company’s history
shows that it was growing very fast, but it started declining in 2010 due to the shift of video game sales to online
channels. It experimented with diversification in selling smartphones, but it didn’t work out. However, with the
advent of the pandemic, all the tech stocks started booming, people were buying more and more games, which
ushered in hope. But no extraordinary change in 2020 justified a dynamic price increase (Badkar, 2021).

From the technical analysis, you can see in figure 2 that prices followed an almost a flat line from February 1,
2016 till recently. Actually, the price was going down to about till January 2020, remaining at this level till July,

                                  Figure 2: Gamestop Price trends: 5 years and 1 month.

Indian Institute of Management Calcutta
5
a₹tha (March 2021)

and then in the last few months of 2020, it started going up till December. There was certainly no reason for it to
suddenly boom to €300. Technical analysis cannot explain this increase.

What about the fundamentals? As we mentioned before, there is no significant change in strategy. As shown by
the income statement (Figure 3), the business was down. It picked up a little bit in 2020 compared to 2019, but
total revenue and profits remained below previous years. Therefore, fundamentals can explain a slight price rise
but not a significant shift.

               Figure 3: Gamestop Income statements2018-2021, downloaded from Yahoo Finance

Would sentiments and irrational exuberance have provided such a big boost? We can see that the whole market
has been optimistic during the pandemic. This optimism is owing to several factors. First, interest rates are low,
which means your discount rate of future cash flows is low, so the firm value goes up. More consumer interest in
technology leads to high expected growth, and again the expected value of future cashflows goes up. Public
money is pouring in, and so people’s income constraint is disappearing. You know there are many new trading
platforms like Robinhood that are charging zero commission. So, there’s no friction to buying and selling of
shares. All these reasons explain the market optimism (Fletcher, 2021; Mackenzie, 2021).

While this is true about technology stocks, what about Gamestop? Should the price go up further? To understand
the analysis of the hedge funds, you can look at the monthly and weekly data presented in Figure 4. From the

Indian Institute of Management Calcutta
6
a₹tha (March 2021)
beginning of February 2020 till July, there was almost no change, and the price was close to $4. Then the price
goes up reasonably fast and by January 2021, you can see that it increased by 300% to $18. This is a huge increase.
So hedge funds at this time said no, they should sell. Since they were confident of their analysis, this time they
started placing puts expecting that the price would indeed go down.
Figure 4: monthly and weekly average prices of Gamestop
But everything changed this week (11-01-2021). Instead of price going down, it doubled, and then it doubled
again, and then it went up five times before coming down. So, hedge funds like Melvin Capital and Citron capital
lost money (Aliaj & Platt, 2021).
What can explain this reversal of fortune? It is attributed to social media (Stafford, Kantor, & Lewis, 2021). One
of these social media is REDDIT, which is a social networking website with many forums for discussion. One of
these forums is a community called WallStreetBets. There were about 7.5 million people in the community (as
on January 31, 2020). These members include individual investors, ex-bankers, and traders who exchange their
experiences. Together, they decided to do the inverse of what bankers and hedge funds were doing. No small
trader could have succeeded in what they did, but with a million small traders buying the same share, their power
becomes as much as that of the hedge funds. When hedge funds thought they would make money by selling and
then buying later at a low price, the WallStreetbets investors decided to purchase shares or calls options and the
price went up, instead of going down. Some of these small investors made extraordinary profits. One person
bought and turned $50,000 of GameStop call options into nearly $23 million (Wigglesworth, 2021). Another
bought shares worth $4,000, and these were worth $124,000 before he cashed $20,000 out (Platt, Smith,
Darbyshire, Kantor, & Wigglesworth, 2021).
Indian Institute of Management Calcutta7
a₹tha (March 2021)
This situation is called a gamma squeeze. An investor buys a call, in effect building pressure that the underlying
stock price will move higher, which happens because call option sellers must buy the stock to hedge their risk.
Furthermore, the bank or other firms that have sold the shares have to deliver the shares. This need for delivery
means they need to buy, which raises the demand for shares even more, and the price goes up even more. The
short sellers lose their money (Smith & Wigglesworth, 2021). As a result, Melvin Capital lost 53% of its value
(Aliaj & Platt, 2021).
There’s another angle to this story, which is on margin rules. The margin account is used when an investor buys
from a broker on credit, hoping to gain a leveraged effect. However, if there is a loss, then there is a leveraged
negative effect, and the broker may be worried that the investor will not pay up. The margin rules protect the
Stock Exchange from liquidity problems of an investor so that if they think that you’re going to make a loss, they
will take your margin and buy or sell shares to make sure that they have enough liquidity. The investors who are
losing money would need to sell their positions to ensure their commitments. A clearinghouse keeps this margin
money. Each day, members of the clearinghouse must put in the margin as insurance for their trades. The killing
bit is the limited time to make any shortfall. For example, a clearinghouse ordered one US Bank to find $10 billion
of margin within an hour! In our case, hedge funds had to liquidate all their stocks at market prices because their
margin had been eaten. Even platforms, such as Robinhood, feared that they would be disbarred from being a
broker, and they halted trading in an attempt to curtail the price increase (Stafford & Rennison, 2021).
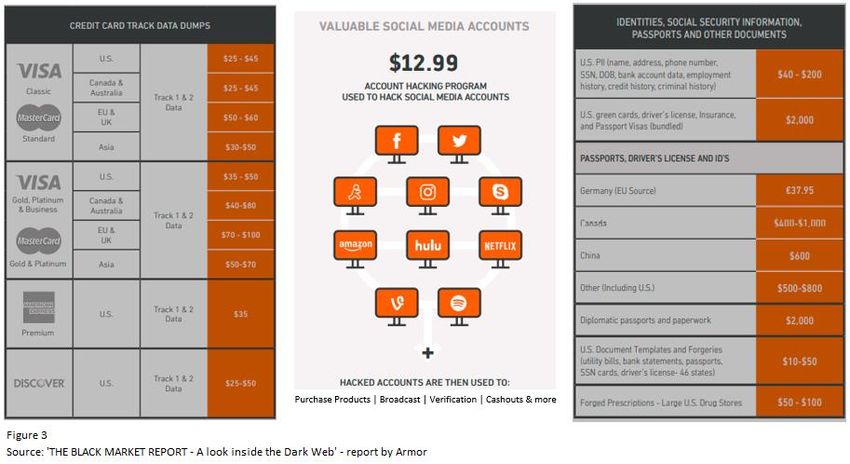
A third complication is that people who are not just buying shares and selling shares, they’re buying options
(Wigglesworth, 2021). Options are like leveraged stock. For example, you can buy an option for $1.00 on a share
priced at $100. Instead of buying ten shares of $100, with the same budget, you can buy a thousand options of
(Wigglesworth, 2021, January 28).
Figure 5: A boom in options trading during the pandemic
Indian Institute of Management Calcutta8 a₹tha (March 2021) $1.00. And if the price goes up, you buy the shares for the price you had agreed on, called the exercise price. What we’ve seen is that when the markets are going up, people start taking risks. Figure 5 shows that the number of people buying call options is going up for all the shares, but not necessarily for GameStop. Alternative Issues These news stories open the way for broader questions. The first question is a kind of political debate: can the small investors win against the rich hedge funds and usher in greater equality? People on one side of the discussion are invoking the Occupy Wall Street movement, indicating that the group of small investors is seeking economic justice (FT, 2021b). The other side replies that such a fight is useless because the rich platforms, banks, and traders make money every time they buy and sell through the trading commissions. Moreover, only a few small investors make money: those who are smart enough to sell once the price goes up (Webb, 2021). Many small investors even lose money because they would have bought the shares at a high price, and the price will eventually fall to its fair market value. A quick “back of the envelope” kind of calculation by the FT (2021a), based on prospective future earnings of $100 million and a price-earnings ratio of 20, values the share at $28. The second issue is about smart money versus dumb money. Smart money is people who invest in research and development before they buy or sell. Hedge funds have colossal research and analysis departments, and they act in an informed way. Retail investors do not have access to such research and follow the smart. But a study of the blogs on Reddit shows that there are intellectual analysis and discussion taking place before the action by the group of small investors. The smart guys are now joining these websites to learn from the dumb. They’re using AI and big data collection techniques and then analyzing them (Wigglesworth, 2021). A third is whether speculation is legal. Certainly, we have the freedom to lose and win our money, but can we manipulate others? Can we induce others to buy and sell? Certainly, you cannot tell lies. But what if you don’t lie and you say “I am doing this” or “Lets do this”? When is it called manipulation? The reason the State may want to control speculation is that if it seems that the Stock Exchange is only a gambling den, then maybe companies won’t be able to finance their investments. Therefore, the State wants to show that the stock exchange is a fair long-term investment platform and that returns are based on a company’s fundamental value. Watchdogs like the SEC in the USA are examining whether this herding was manipulative (Armstrong, 2021; Martin & Platt, 2021). A fourth issue is whether platforms like Robinhood have the right to close down and keep retail speculators from making money. In examining this issue, one has to keep in mind that the margin money requirement also extends Indian Institute of Management Calcutta
9
a₹tha (March 2021)

to platforms that have chosen to net the margins of all their members. The trading platforms would have gone
bankrupt if they had not stopped trading (Armstrong, 2021; Martin & Platt, 2021).

Concluding Remarks

We could make a few concluding remarks. In retrospect, with the benefit of hindsight, it is clear that the prices
would fall back towards their fundamentals, as we can see in figure 6, and the best strategy is to be a short-seller
or buy puts when prices rise so high.

        Figure 6: Gamestop prices fall back. Source: Yahoo finance, downloaded on February 11, 2021

We can see that the press has made a lot of noise about a few small investors making a lot of money. This noise
makes people think that they have a chance to win the lottery, and that encourages speculation. As a result, many
new people start joining the market. And that boosts the market further, already pumped with the helicopter money
that the governments are throwing in to boost the economy.

References

Aliaj, O., & Platt, E. (2021, February 1). Melvin assets drop 53% in January after Reddit assault. Financial
        Times (Europe), p. 6.
Armstrong, R. (2021, January 30). Redditors throw down challenge to watchdogs. Financial Times (Europe), p.
        12.
Badkar, M. (2021, January 29). Retail chain dragged into amateur traders’ war games on Wall Street: Co-
        ordinated effort by army of lay investors pushes GameStop to a 28bn market capitalisation. Financial
        Times (Europe), p. 8.
Fletcher, L. (2021, January 29). Tech rally pits old-school investors against followers of digital dream.
        Financial Times (Europe), p. 9.
FT. (2021a, February 13). Lex: GameStop: eye of the beholder. Financial Times (Europe), p. 20.
FT. (2021b, January 30). The wave of populism shaking Wall Street: Retail investors are using social media to
        take on the short sellers. Financial Times (Europe), p. 6.

Indian Institute of Management Calcutta
10
a₹tha (March 2021)
Mackenzie, M. (2021, January 30). Army of small traders rages at the short-sellers. Financial Times (Europe),
p. 18.
Martin, K., & Platt, E. (2021, January 29). Overheated Online brokers slam the brakes on extraordinary Reddit-
fuelled stock rally. Financial Times (Europe), p. 1.
Platt, E., Smith, C., Darbyshire, M., Kantor, A., & Wigglesworth, R. (2021, January 30). Reddit traders take on
Wall Street’s elite: WallStreetBets trade tipping forum rocks investment establishment with dizzying
rise in GameStop stock. Financial Times (Europe), p. 10.
Schroeder, S. (2021, Feb 1). Hedge fund Melvin Capital is down $4.5 billion after epic squeeze by Reddit
traders, report says. Mashable.com.
Smith, I., & Wigglesworth, R. (2021, January 30). Day traders learn to ‘weaponise’ dynamics. Financial Times
(Europe).
Stafford, P., Kantor, A., & Lewis, L. (2021, January 29). Reddit battle drives trading volumes past 2008 peak.
Financial Times (Europe), p. 9.
Stafford, P., & Rennison, J. (2021, January 30). Betting mania puts clearing houses in the spotlight. Financial
Times (Europe), p. 11.
Webb, M. S. (2021, January 30). Reddit investors’ real power is over WallStreet’s future behaviour. Financial
Times (Europe), p. 7.
Wigglesworth, R. (2021, January 28). ‘Weaponised’ options trading turbocharges equity rally: Unloved shares
are being propelled to record highs, raising fears of wider impact. Financial Times (Europe), p. 10.
*********
Indian Institute of Management Calcutta11
a₹tha (March 2021)
Return of the Market Stabilisation Scheme?
Balachandran R
Balachandran R is an alumnus of IIM Calcutta (1987-89) with extensive experience in corporate banking,
investment banking and product management.
The Indian economy saw a surge in capital inflows in 2020, despite the Covid-19 pandemic, through foreign
direct investment (for example, in Jio Telecom) and foreign portfolio investment (in the secondary markets).
Despite this, the Rupee was reportedly the worst-performing Asian currency in 2020. Blame it on the RBI!
Why would the Reserve Bank of India keep the exchange rate low, risking the United States' wrath by potentially
being labeled a currency manipulator? A Dollar deluge puts upward pressure on the Rupee. Imports become
cheaper while exports can become uncompetitive. India, with the rare exception of the current financial year
2020-21 (till date i.e. February 2021), has been running a perennial current account deficit; in other words, our
exports of goods and services and NRI remittances are not sufficient to meet our import bill. Exports are critical
to managing the current account. RBI, therefore, needs to step in to curb excessive Rupee appreciation (which
can make exports uncompetitive) in the face of capital inflows.
RBI’s intervention in the FX markets
RBI’s exchange rate policy is termed managed float. Unlike the developed market currencies (the US Dollar,
Euro, Japanese Yen, Pound Sterling, Swiss Franc, etc.), which float freely with market conditions, RBI intervenes
in the Foreign Exchange (FX) markets to curb volatility and speculative activity. In the scenario of excessive
capital inflows, RBI purchases Dollars and sells Rupees.
Unintended Consequences on Domestic Liquidity
RBI’s intervention in the FX markets leads to unintended consequences. In buying foreign currency assets (US
Dollars), RBI unleashes an equivalent amount of Rupee liquidity into the system; when purchasing Dollars, RBI
credits banks with Rupees, increasing the money supply. Where does RBI get the Rupees? It’s from thin air!
Indian Institute of Management Calcutta12
a₹tha (March 2021)
Central banks not only print fiat currency, but they also create electronic currency when paying for the purchase
of foreign currency assets and domestic assets (e.g., open market purchase operations of government securities).
The former Chairman of the US Federal Reserve Ben Bernanke acquired the nickname of “Helicopter Ben” for
his allusion to the central bank dropping money from a Helicopter!
Sterilization Operations
The Rupees infused into the system through RBI’s FX market intervention can be potentially inflationary and
cause short-term rates to fall below the policy repo rate. RBI has monetary policy tools for neutralizing or
“sterilizing” the excess domestic liquidity. It can conduct open market sale operations of government securities.
Such securities are purchased by banks and paid out of their “excess reserves.” Here the purchase consideration
is debited to their current account maintained with RBI, and the Rupees in the accounts of banks vanishes into
thin air. It moves out of the system, thereby negating the rupee liquidity injected through RBI’s intervention in
the FX market.
Such sterilization can impact the central bank’s surplus (profits). For example, RBI replaces higher yield domestic
government securities (about 6.20% now for 10-year Indian government security) with a lower yield foreign
currency asset (about 1.6% now for a 10-year US government Treasury bill).
Table 1 depicts the effect of RBI’s FX market intervention, both for purchase and sale of FX.
Table 1: The effect of RBI’s FX market intervention
Nature of Intervention Effect on Effect on Effect on Liquidity in
Foreign Domestic Assets the Banking
Currency Assets (Government System/Money
(FX Reserves) Securities) Supply
Non-Sterilized FX Increases No Impact Increases
Intervention (Purchase)
Sterilized FX Increases Decreases No Impact
Intervention (Purchase)
Non-Sterilized FX Decreases No Impact Decreases
Intervention (Sale)
Sterilized FX Decreases Increases No Impact
Intervention (Sale)
(Adapted from RBI's "Report on Currency and Finance")
Indian Institute of Management Calcutta13 a₹tha (March 2021) MSS scheme RBI has built up a war chest of about USD 600 billion of foreign currency assets through such interventions in the FX market. Continuous open market sale operations of domestic government securities to sterilize the consequent impact on Rupee liquidity can deplete RBI’s stock of such securities. Therefore, the Market Stabilisation Scheme (MSS) was envisaged by which the Central Government would provide RBI with adequate stock of government securities to undertake sterilization activity. In paying for its subscription to the securities, RBI credits a separate cash account of the Government held with RBI. The original idea was that the funds would be sequestered and not form part of the Consolidated Fund of India. In other words, the money is not for the Government’s use but for subsequent redemption of the securities issued under the MSS scheme. RBI can use the securities under MSS (on its balance sheet) to mop up the excessive domestic liquidity (arising from its FX market intervention) from banks. It is noteworthy that RBI does not appear to have conducted sterilization operations in the Covid-19 era, perhaps to keep domestic liquidity in surplus and mitigate the pandemic's impact on the economy. Demonetization RBI was not using MSS as a tool for a while, until demonetization. When Rs 500 and Rs 1000 currency notes were demonetized in November 2016, customers deposited the old notes into their savings accounts with banks. Next, banks deposited the demonetized currency with RBI, reducing the currency in circulation by a whopping amount of nearly Rs 9 lakh crores. When retail customers deposit currency notes into their savings account, their bank balance goes up accordingly. Subsequently, if banks deposit these currency notes with RBI their balances in their current accounts with RBI go up (in this case the balances went up by nearly Rs 9 lakh crores). Demonetization led to a strange situation: the economy was starved of physical cash, while the banking system was awash with an unprecedented amount of liquidity. The excess liquidity in the system could potentially cause the rates in the interbank call money market to fall to the lower end of the interest rate corridor (the reverse repo rate). This sharp decline would negate the objective of RBI’s day-to-day liquidity management operations to keep the weighted average call money rate around the repo rate. RBI initially used its monetary policy tool, reverse repo, to absorb the excess liquidity. In this operation, RBI sells government securities to banks, with an agreement to repurchase them within a short tenor (usually overnight). In the first leg of the transaction, banks pay for their purchase from their current account with RBI. Thus, funds will move out from the banking system, thereby meeting RBI’s objective of absorbing the excess liquidity created through demonetization. Open market sale operations are not the appropriate tool here since they Indian Institute of Management Calcutta
14
a₹tha (March 2021)

result in long-term draining of banking system liquidity; the need was to absorb temporary surplus liquidity
conditions until “remonetization” happens.

100% Incremental CRR

Reverse repo operations too are constrained on account of the finite availability of stock of government securities
on RBI’s balance sheet. RBI could absorb only about Rs 5 lakh crores through reverse repo auctions out of the
Rs 9 lakh crores excess liquidity in the system due to demonetization. Therefore, RBI used the ultimate weapon
in its armory: an incremental cash reserve ratio (ICRR) of 100 percent on the increase in net demand and time
liabilities (NDTL) of banks between September 16 and November 11, 2016, was applied. This drained the balance
excess liquidity of Rs 4 lakh crores. Along with the reverse repo operation, the 100% incremental CRR thus led
to the absorption of the entire excess liquidity of Rs 9 lakh crores created in the banking system on account of
demonetization.

However, the use of 100% incremental CRR led to fresh issues. CRR balances maintained by banks with RBI are
not remunerated. On the one hand, banks were paying interest on the savings account balances that had surged
due to demonetization. On the other hand, banks were not to allowed to lend or invest this amount, to the extent
of the incremental CRR. As a result, banks’ income was being hit for no fault of theirs. RBI was forced to roll
back its 100% incremental CRR mandate, leading back to excess banking system liquidity, to the extent not
absorbed by reverse repo operations.

Subsequently, in an unprecedented move, RBI deployed the MSS tool, which was originally conceived for a
different purpose: sterilizing banking system liquidity on account of intervention in the FX market. The
Government provided about Rs 6 lakh crores of securities under MSS to RBI. Armed with this, RBI sold the
securities to banks and absorbed the surplus liquidity. As “remonetization” in the economy happened over the
next few months, the securities issued under MSS were redeemed, and normalcy returned to RBI’s balance sheet.

In today’s context of surging liquidity on account of RBI’s intervention in the FX markets, talk of MSS is again
doing the rounds, with a notable mention in the latest “Report on Currency and Finance” published on RBI’s
website.1 However, neither RBI has endorsed the report as its official point of view, nor the Government has
made any statement on an agreement with RBI to provide securities under the MSS scheme.

1
    https://www.rbi.org.in/Scripts/BS_PressReleaseDisplay.aspx?prid=51187

Indian Institute of Management Calcutta
15
a₹tha (March 2021)
Standing Deposit Facility
Except for CRR, the other monetary policy tools of RBI for absorbing the excess liquidity in the banking system
depend on the availability of government securities, as RBI cannot “borrow” unsecured from banks. Therefore,
the Standing Deposit Facility (SDF) was announced in the Union Budget 2018-29, through which RBI can absorb
liquidity from banks without selling an equivalent amount of government securities.
Conclusion
With a sharp upswing in the yields on government securities post the February 2021 budget and an inadequate
market appetite to finance the massive government borrowing plans, open market operation purchases of
government securities may be the only option for RBI. The resultant surplus liquidity can be absorbed by the
Standing Deposit Facility. However, RBI is yet to activate this monetary policy tool, though the Governor alluded
to its use in a recent speech.
*********
Indian Institute of Management Calcutta16
a₹tha (March 2021)
Corporate Governance in India: Understanding the
History and Peeking into the Future
Asish K Bhattacharyya
Asish K Bhattacharyya is Distinguished Professor at Shiv Nadar University and Founder of Nonlinear
Insights. He was a Professor at the Indian Institute of Management Calcutta and Indian Institute of
Corporate Affairs. Also, he was Director of the Institute of Management Technology Ghaziabad and the
Head of the School of Corporate Governance, Indian Institute of Corporate Affairs. Dr. Bhattacharya
started the Centre for Corporate Governance at IIM Calcutta. He was a regular columnist for Business
Standard from 2008 to 2020.
(This article is Part II of the essay. Part I dealt with corporate governance practices in India from the colonial
period until the command capitalism – 1950 to 1990 – period; it was published in the previous issue of Artha.
Part III will be published in the next issue.)
CORPORATE GOVERNANCE POST ECONOMIC LIBERALISATION
With Economic liberalisation in 1991 India ushered into the market economy from a command economy. Indian
economy got integrated with the world economy. It opened up new opportunities and transformed the sellers’
market to buyers’ market with easy availability of foreign consumer products. The government dismantled the
license raj, opened up most sectors (including the infrastructure sector) for the private sector enterprises, and
liberalized foreign investment in Indian companies through foreign direct investment (FDI) and foreign portfolio
investment. All those policy changes opened up new avenues for Indian business and a vast Indian market for
foreign multinationals. Although the government adopted the policy of privatisation of or disinvestment in public
sector enterprises (PSE), existing PSEs continue to occupy dominating position and securities some of the large
well-run PSEs have been listed in stock exchanges.
Indian Institute of Management Calcutta17
a₹tha (March 2021)
During this period, business groups diversified into sectors that were earlier reserved for state-owned enterprises
and new business groups emerged. For example, the growth of Reliance Industries Limited (RIL), which was
established by ambitious Dhirubhai Ambani in 1973, accelerated only after 1991. Adani group, which was
established in 1988, is a name to recon in the infrastructure sector. Another example is the Bharti group, which
was incorporated in 1976. It established Bharti Airtel in 1995, which is now among the top three
telecommunication companies in India. During this period, multinational companies either established their
subsidiaries or collaborated (such as through joint ventures) with Indian companies to enter the market. In 1992
the government allowed FPI in Indian companies and FDI norms are being relaxed gradually. Figure 1 shows that
the inflow of FDI has increased sharply starting from 2004.
Figure: 1: FDI flow in India (Source: World Bank)
6E+10
5E+10
Net FDI inflows (current $)
4E+10
3E+10
2E+10
1E+10
0
2010
1970
1972
1974
1976
1978
1980
1982
1984
1986
1988
1990
1992
1994
1996
1998
2000
2002
2004
2006
2008
2012
2014
2016
-1E+10 2018
The opening up of the economy also increased competition in the product market and managerial labour market.
This resulted in the reversal of the trend of unrelated diversification (demerger and disinvestment) and started the
merger and consolidation of related businesses.
Capital market reforms
Securities and Exchange Board of India (SEBI), which was established in 1988 as a non-statutory body, became
an autonomous body on 12 April 1992. It was accorded statutory powers with the passing of the SEBI Act 1992
for protecting the interests of investors in securities and promoting the development of the securities market and
regulating the same. Capital Issue Control Act was repealed, and the control over volume and pricing of capital
Indian Institute of Management Calcutta18
a₹tha (March 2021)
issues was abolished. SEBI initiated several reforms after the mega security scam in 1992 perpetrated by Harshad
Mehta, a stockbroker. SEBI’s regulations are comparable with those in advanced economies.
National Stock Exchange (NSE), the digital stock exchange, was incorporated in 1992 and was recognised as a
stock exchange by SEBI in April 1993. In 1995, the Bombay Stock Exchange (BSE) switched from an open cry
floor trading system to an electronic trading system. The Indian capital market, particularly the equity market
(cash segment) has grown significantly after the liberalisation (Acharya, 2019). Acharya (2019) reported that
“segments of the Indian capital market are comparable with counterparts in many of the advanced economies in
terms of efficiency (price discovery), tradability (low impact cost), resilience (co-movement of rates across
product classes and yield curves), and stability.”
Figure 2: Growth of the Indian capital market (Source: Acharya, 2019)
Indian code of corporate governance – the emergence of the monitoring board
Only in 1976, the term corporate governance, the concept of monitoring Board and audit committee surfaced in
the U.S.A. (Cheffins, 2013). Earlier the Board of directors in the U.S.A. was a management board. Top executives
strongly influenced the selection of directors, and the Board was expected to be collegial and supportive to the
management. It acted only in a situation of outright crisis. The concept of corporate governance and monitoring
board caught the imagination of the government and stock market regulators of countries – other than the U.S.A.
and the U.K.– after the Cadbury Committee in the U.K. submitted its report in 1992. The Committee incorporated
its recommendation in the Code of Best Practices, which became the model for developing a code of corporate
governance in different countries. India was no different. SEBI, for the first time, issued the code of corporate
Indian Institute of Management Calcutta19
a₹tha (March 2021)
governance in 2000. Stock exchanges, under the direction of SEBI, incorporated the Code of corporate
governance in the Listening Agreement (Clause 49). This is the first time that the listed companies were required
to induct independent directors on their board and the boards to form an audit committee. Earlier, boards in India
were similar to the boards the U.S.A. had prior to 1976. The Code of corporate governance failed to improve the
functioning of the boards and corporate governance did not improve. Boards got transformed into ornamental
boards with big names, who used to lend their names. Promoting families invest money, time and emotions in the
company. They do not like outsiders to interfere in the management of the company. Therefore, they select
independent directors known and r sympathetic to the promoter family and the senior management. Most
companies take the ‘tick-the-box’ approach to comply with the corporate governance regulation.
Clause 49 was revised many times, and in 2015, it was replaced by the SEBI (Listing Obligation and Disclosure)
Regulation 2015. This too was revised on many occasions to incorporate emerging global best practices. Every
board is now required to constitute the Nomination and Remuneration Committee, but it does not function
independently of the controlling shareholder. The question, ‘how independent are independent directors’
continues, although the Companies Act 2013, which came into force on April 1, 2014, includes several provisions
for strengthening the institution of independent directors. It also introduced audit reforms like the rotation of
auditors in order to protect the interest of the company and minority shareholders.
CURRENT STATE OF GOVERNANCE
The corporate landscape
The National Stock Exchange (NSE) is ranked as the third largest stock exchange globally in terms of the number
of equity trades, as per the World Federation of Exchange (WFE) Report - 2019. NSE has over 1900 securities
listed on NSE with a market capitalisation of over Rs 154.32 lakh Crores (U.S. $ 2.10 trillion), as of Dec 2019.
The NIFTY 200 Index represents about 86.7% of the free-float market capitalization of the stocks listed on NSE
as of March 29, 2019.
I have analysed the shareholding pattern of companies in the NIFTY 200 index for understanding the
composition of the types of firms included in the index and getting insights into the shareholding pattern of those
companies. There are various definitions of family business (Diaz et al., 2019). Researchers use various
characteristics to define family business, and most use the ownership of ordinary shares and membership in the
board of directors. International studies on corporate ownership typically establish some minimum control
threshold such as 5%, 10%, or 20% (Villalonga, 2010). La porta et al. (1999) define a controlling shareholder as
having more than 20 percent voting rights. Using the 20 percent threshold, I have classified a company as family-
Indian Institute of Management Calcutta20 a₹tha (March 2021) controlled if the promoter holding is 20 percent or more. I have used the term professionally managed companies for other companies (i.e., companies with promoters holding less than 20 percent of shares). I have also treated the subsidiaries of professionally managed companies as professionally managed companies. The Nifty 200 index has 114 family-controlled companies (57%), 23 subsidiaries of multinationals (11.5%), 28 professionally managed companies (14%) and 35 state-owned enterprises (17.5%). If we go by the narrow definition, which uses an additional parameter in defining family business – the business should continue in the second generation, a few companies cannot be classified as family-controlled companies as they are controlled by the first-generation entrepreneur. Figure 3 shows that the promoters are tightening their grip on the companies controlled by them. However, some promoters are selling their shares to multinationals, venture capitalists and asset management companies. For example, ACC and Ambuja Cement were acquired by Lafarge Holcim 1n 2017. In 2016, New-York based Blackstone, an Alternate Asset Management company, acquired a 60.5% stake in IT service firm Mphasis Limited and subsequently sold 8 percent. Again in March 2020, it acquired 4.01 percent shares of the company. At present, it holds 56.21 percent shares of Mphasis. Another example is Crompton Greaves Consumer Electricals Limited. This company was born in 2016 when Crompton Greaves Limited (a Karan Thapar Group company) demerged the consumer goods business from power and industrial systems segment. Its September 30, 2020, shareholding report shows three foreign body corporates (promoters) are holding 26.19 percent voting rights. Startups As per Hurun Research Institute’s 2020 Report, India has 21 unicorns with an average age of seven years (two are less than four years old) and a total valuation of $73.2 billion. As per the report, almost all promoters Indian Institute of Management Calcutta
21
a₹tha (March 2021)

of these 21 unicorns are IIT and/or IIM graduates and some have completed their education in universities
abroad.

Usually, the promoters enjoy the venture's growth and share only a small portion of the enormous wealth
they create. A case in point is Housing and Development Finance Corporation Limited (HDFC). At the age
of 65 years, H.T. Parekh set up HDFC in October 1977, when the concept of housing loan was unknown
in India. ICICI promoted the company. Deepak Parekh, the nephew of H.T. Parekh, nurtured HDFC and
retired as its chairman in 2009 holds just 0.7 percent of the voting rights (Times of India, 2020). At present,
HDFC has no promoter. The company and its three subsidiaries are included in Nifty 200.

Institutional investments

The interest of foreign portfolio investors (FPI) in the Indian market is increasing. It is evident by the
number of FII registered with SEBI. It was 997 at the end of 2006-2007 and increased to 9,136 at the end
of 2017-2018. The research concludes that foreign portfolio investment improves corporate governance
(Aggarwal et. 2011; Gillan and Starks, 2003). I have examined the percentage of foreign portfolio
investment in different types of companies. Table 1 below provides a summary of the shareholding pattern
of Nifty 200 companies.

Table 3: Shareholding pattern Nifty 200 companies as at September 30, 2020

                                   Family-        Professionally      Public sector     Multinationals
                                  controlled         managed           enterprises
                                  companies         companies                            (percentage)
                                                                      (percentage)
                                 (percentage)      (percentage)
                               Mean       Median Mean     Median     Mean    Median Mean        Median
       Foreign portfolio       18.40      17.05   26.40    22.80     11.07     7.70    10.91     10.70
       investment (FPI)
       Mutual Fund              8.46       7.25   10.80     9.50     7.61      7.10     6.98     6.20
       Total                   26.86              37.20              18.68             17.89
       Other institutions       4.53       3.90   9.20      5.80     8.24      6.40     6.67     6.80
       Total institutional     31.40      28.20   46.40    51.20     26.91    29.20    24.57     25.40
       investment
       Public                  15.47      12.85   20.50    14.30     11.27     9.10    13.20     13.10
       Promoter                52.95      53.55   32.80    26.20     61.80    57.60    62.24     62.80
       Total*                   98.8              98.7               100.0             100.0
       * variation from 100 is due to approximation; Source: Compiled by the author

Indian Institute of Management Calcutta
22
a₹tha (March 2021)
Table 1 clearly indicates that the average FII shareholding in family-controlled companies (18.40 percent)
is non-trivial and total institutional holding at 31.40 percent is significant. Ther efore, intuitional
shareholders together can influence the corporate governance practices in family-controlled companies.
However, FPI holding was less than 15% in around one-half of all family-controlled entities included in
the Nifty 200 index percent(see figure 4).
Figure 4: Cumulative Distribution of FPI holding in
familty-controlled companies as at 30-09-2020
120
Cumlative % of firms
100
80
60
40
20
0
0 10 20 30 40 50 60 70
FII holding (%)
Figure 5: Cumulative Distribution of Mutual Fund holding in
family-controlled companies as at 30-09-2020
120
Cumulative % of firms
100
80
60
40
20
0
-5 0 5 10 15 20 25 30
Mutual Fund holding (%)
Average FPI holding in professionally managed companies is significant (26.40 percent), average total
institutional holding is very substantial (46.40 percent). However, around 35 percent of the professionally
managed companies have less than 15 percent of FPI investment (see figure 6).
Indian Institute of Management Calcutta23
a₹tha (March 2021)
Figure 6: Distribution of FII holding in professionally
companies as at 30-09-2020
Cumulative % of firms 120
100
80
60
40
20
0
0.0 10.0 20.0 30.0 40.0 50.0 60.0 70.0 80.0
FII holding (%)
Distribution of Mutual Fund holding in professionally
managed companies as at 30-09-2020
120
Cumulative % of firms
100
80
60
40
20
0
0.0 5.0 10.0 15.0 20.0 25.0 30.0
Mutual Fund holding (%)
Code of corporate governance
Indian corporate governance code (CG Code) embedded in the SEBI (Listing Obligation and Disclosure)
Regulations 2015 is a hard law (comply or else), whereas, in the U.K. and some other countries, it is a soft law
(comply or explain). SEBI tracks the emerging global best practices and incorporates them in the CG Code
without delay. CG Code was last revised in 2019.
In September 2017, the government amended the Companies Act 2013 to restrict step-down subsidiaries to two.
In counting the number of subsidiaries, one 100 percent subsidiary will be excluded. A company may have as
many direct subsidiaries as it desires. The new rule is applied prospectively. Therefore, companies are not required
to close down existing step-down subsidiaries. Although the primary aim of this rule is to plug the loophole for
Indian Institute of Management Calcutta24 a₹tha (March 2021) money laundering through shell companies, it will stop the use of the pyramid structure for controlling companies with low cash flow rights. The government created the National Financial Reporting Authority (NFRA) in October 2018 with a broad authority to oversee the auditing profession and punish the auditor found guilty of negligence. NAFRA has already taken penal actions against partners of one of the Big 4 firms. Effective from April 1, 2018, all listed companies must apply Indian Accounting Standards (Ind AS), which is a clone of International Financial Reporting Standards (IFRS). Indian Standards of Auditing are aligned with the international standards of auditing. Those initiatives have improved the quality of financial reporting and audit quality leading to improved corporate governance. In India, Stewardship Code has been implemented effective from July 1, 2020. Under the code, institutional investors need to monitor investee companies and intervene in their governance through meetings with the management. Also, they need to have a policy on voting and disclose the voting behaviour. SEBI mandated responsibility reporting by top 100 listed companies from 2012, top 500 listed companies from the financial year 2015-2016, and top 1,000 listed companies from the year 2019-2020. In 2017, SEBI recommended Top 500 companies to use of the Integrated Reporting Framework for annual reporting. Awareness has been created about the benefits of good corporate governance. Some companies have good governance practices. Still, many companies have adopted the ‘tick-the-box’ approach in implementing the code of corporate governance. The institution of independent directors has remained weak and demand for management-sympathetic independent directors continues. Most boards are somewhere between ‘rubber stamp board’ and advisory board. The Satyam scam (2009), Kingfisher airlines failure (2012) and IL&FS scam (2018) brought to the surface the poor corporate governance practices in companies in which big names were board members. It is not that the board members colluded with the management. They did not fulfill their responsibilities of applying due diligence while approving financial statements or strategies proposed by the controlling shareholder. The auditing profession is adjusting to the new reality that they can no more act as a friend, philosopher, and guide of the management. Shareholders, regulators and society expect the auditor to be their friend and demonstrate a very high level of independence. Family-controlled companies are yet to come out of the hangover of the managing agency system fully. However, the change is visible. India is at the cusp of transformational changes in corporate governance. In a nutshell In 1991, India transited from the command economy to the market economy: Licensing raj was dismantled; the capital market has been reformed to make it comparable with the capital markets in advanced countries in terms Indian Institute of Management Calcutta
25
a₹tha (March 2021)

of efficiency. FDI and FPI are encouraged; and the sellers’ market has been transformed into the buyers’ market.
A corporate governance code with the best corporate governance practices has been implemented. The
government has taken initiatives to improve the accounting and audit quality. A new corporate law (Companies
Act 2013) has been enacted and the government and regulators have taken steps to strengthen the institution of
independent directors. Moreover, the companies are now operating in a competitive environment and FPI
investment in Indian companies has increased.

All these measures have improved the corporate governance practices in only some of the companies. In general,
the family-controlled companies are yet to implement the corporate governance code in spirit. They have taken
the tick-the-box approach and look for management-friendly independent directors. In most companies, the audit
committee may be working at less than the desired level and the Nomination and Remuneration Committee may
be the most underrated committee. Still, a change towards the better is visible, and India is at the cusp of a
transformation in corporate governance.

References

Acharya, Viral V. Development of viable capital markets – the Indian experience. RBI Bulletin July 2019.
Aggarwal, Reena, Isil Erel, Miguel Ferreira, and Pedro Matos. "Does governance travel around the world?
Evidence from institutional investors." Journal of Financial Economics 100, no. 1 (2011): 154-181
Cheffins, Brian R. ‘The history of corporate governance’ in Oxford Handbook of Corporate Governance. Oxford
University Press (2013). Pp 47 (Kindle edition)
Gillan, Stuart, and Laura T. Starks. "Corporate governance, corporate ownership, and the role of institutional
investors: A global perspective." Journal of Applied Finance 13, no. 2 (2003).
La Porta, R., Lopez‐ de‐ Silanes, F. and Shleifer, A., 1999. Corporate ownership around the world. The Journal
of Finance, 54(2), pp.471-517.
Times of India (January 29, 2020)Deepak Parekh holds just 0.7% in HDFC that helped build. Available at:
https://timesofindia.indiatimes.com/business/india-business/deepak-parekh-holds-just-0-07-in-hdfc-that-he-
helped-build/articleshow/73717399.cms; Extracted on November 23, 2020
Villalonga, Belén, and Raphael Amit. "Family control of firms and industries." Financial Management 39, no. 3
(2010): 863-904

                                                   ********

Indian Institute of Management Calcutta
26
a₹tha (March 2021)
The Cost of Data Breaches
Yash Sharma
Yash Sharma is a Chartered accountant by profession, currently working with Swiggy. He cleared his CA in
2018 and is interested in the world of startups and ecommerce. Outside work, he likes badminton &
swimming.
Introduction
Instead of starting with a cliché statement, I will start with a fact. In the year 2020, the estimated loss to the global
economy due to data breaches is pegged at around $945 billion, or about 1% of global GDP. This is up about 80%
from two years ago and in addition to about $145 billion spent on cybersecurity in 2020. 2
ESTIMATED AVERAGE COST OF
CYBERCRIME (IN BILLIONS) $945
$523
$475
$300
2013 2014 2018 2020
Figure 1
Source: ‘The Hidden Costs of Cybercrime’ – report by McAfee
In this article, we understand what data and sensitive data mean, what incentivizes data breaches, and what does
it cost everyone, financially and otherwise. Besides, we look at some of the biggest data breaches in the past few
years and understand what is changing to prevent them in the future.
Data, Personal Data, and Sensitive Data
To understand why breaches (both intentional and unintentional) happen and why it sounds so serious, we need
to understand what data and its variants mean.
2
‘The Hidden Costs of Cybercrime’ – report by McAfee
Indian Institute of Management Calcutta27 a₹tha (March 2021) In simplest of terms, any activity which takes place -- from the level of a little ant nest to a gigantic planetary- scale -- generates data. In that sense, data is simply bits of information. Even our existence gives rise to many data like age, gender, residence, and the list is practically endless. But not every data piece is economically attractive. Personal data, on the other hand, means any detail through which one can identify, with some accuracy, a living person. However, every bit of personal information cannot be termed as personal data. For example, only by the name Yash Sharma you cannot identify me. There can be many others by the same name. If you however have the address and a phone number coupled with it, the name becomes a part of personal data. And finally, the last piece of the puzzle, sensitive personal data. If any person’s ethnic origin, political opinion, or similar detail can be identified by any information, it will be considered sensitive personal data. This data requires the highest level of scrutiny and security because it can bias judgment and opinion towards another person. To understand the importance of data privacy & security, imagining what could happen if someone with malicious intent or opportunistic mindset gets hold of your sensitive personal information. What are Data Privacy and Data Security? Access to sensitive data always yielded power. If someone knew any personal detail about you, he could have always used it for his gain or your loss. So, why the debates on the security of data now? Earlier, the data used to be collected and stored on paper and its summarization and use was a time-consuming process. As we entered the digital world, everything went paperless and you started getting notifications from shopping websites as soon as you googled any product. In that context, a plethora of data can be summarized in minutes and can be turned into tangible profits with a specific area of focus. The sheer volume and speed of availability of data are what makes data privacy and security more important today. Data privacy can be explained as policies and steps taken to ensure proper collection and usage of data. It is concerned with ensuring that the data is obtained with the user’s consent and is accessible only to people and for the purpose consented by the owner of data. Data security, on the other hand, is the method to ensure data privacy. These can include both physical controls, like locking the data servers in a cabin, as well as logical controls, like restricting access to limited authorized users. Suppose an organization collected my name and age through an online form. The bottom of the form described how the data would be used and who could use the data, and the organization asked for my consent for the same. Indian Institute of Management Calcutta
You can also read