The Use of Liquified Petroleum Gas (LPG) in Sudan - December 2010
←
→
Page content transcription
If your browser does not render page correctly, please read the page content below
The Use of Liquified
Petroleum Gas (LPG)
      in Sudan
      December 2010
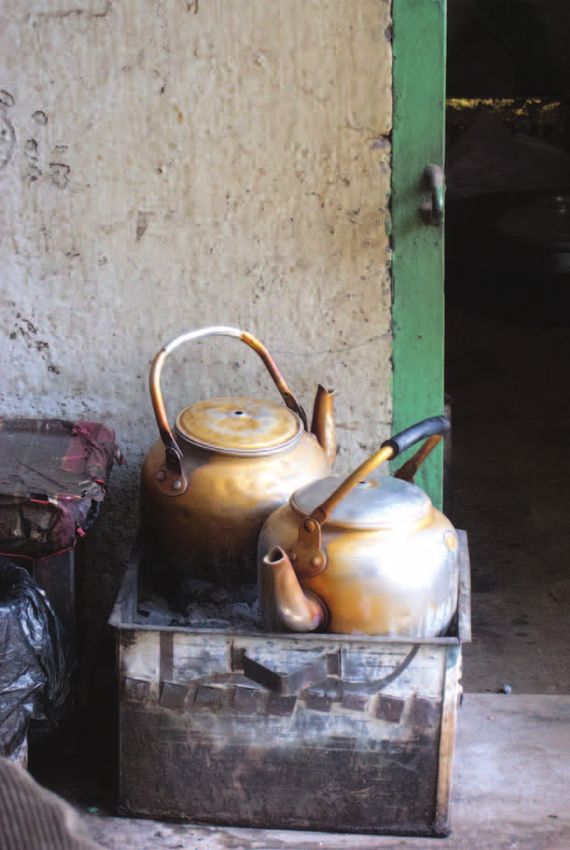
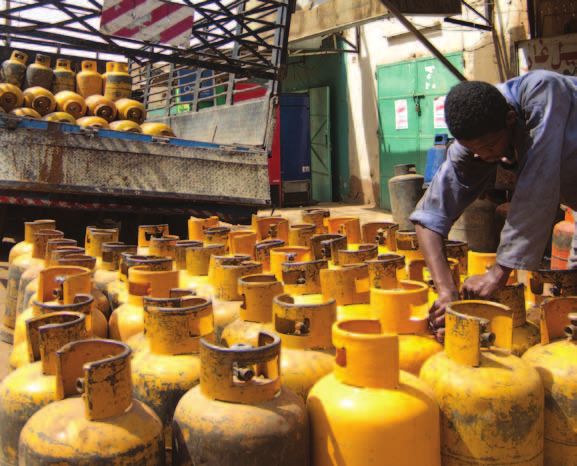
Cover image: Truck delivering gas cylinders in Khartoum

This report is available online at: www.unep.org/sudan

Disclaimer

This report was prepared by Dr. Ahmed Hassan Hood, on behalf of the United Nations Environment Programme. Any views expressed
within this document are the authors own, and may not necessarily represent those of the United Nations Environment Programme.
The Use of Liquefied Petroleum Gas
          (LPG) in Sudan

     United Nations Environment Programme
            Dr Ahmed Hassan Hood
                December 2010
Table of contents
Executive summary .  .  .  .  .  .  .  .  .  .  .  .  .  .  .  .  .  .  .  .  .  .  .  .  .  .  .  .  .  .  .  .  .  .  .  .  .  .  .  .  .  .  .  .  .  .  .  .  .  .  .  .  .  .  .  .  .  .  .  .  .  .  .  .  .  . 4
1.	Introduction .  .  .  .  .  .  .  .  .  .  .  .  .  .  .  .  .  .  .  .  .  .  .  .  .  .  .  .  .  .  .  .  .  .  .  .  .  .  .  .  .  .  .  .  .  .  .  .  .  .  .  .  .  .  .  .  .  .  .  .  .  .  .  .  .  .  .  . 6
2.	 Energy consumption in Sudan .  .  .  .  .  .  .  .  .  .  .  .  .  .  .  .  .  .  .  .  .  .  .  .  .  .  .  .  .  .  .  .  .  .  .  .  .  .  .  .  .  .  .  .  .  .  .  .  .  .  .  .  .  . 9
          2.1. Overall energy consumption. .  .  .  .  .  .  .  .  .  .  .  .  .  .  .  .  .  .  .  .  .  .  .  .  .  .  .  .  .  .  .  .  .  .  .  .  .  .  .  .  .  .  .  .  .  .  .  .  .  .  . 9
          2.2. Overall biomass energy consumption .  .  .  .  .  .  .  .  .  .  .  .  .  .  .  .  .  .  .  .  .  .  .  .  .  .  .  .  .  .  .  .  .  .  .  .  .  .  .  .  .  .  . 10
          2.3. Biomass energy consumption – household sector.  .  .  .  .  .  .  .  .  .  .  .  .  .  .  .  .  .  .  .  .  .  .  .  .  .  .  .  .  .  .  .  .  . 11
          2.4. Biomass energy consumption – Industrial and services sector.  .  .  .  .  .  .  .  .  .  .  .  .  .  .  .  .  .  .  .  .  .  .  .  . 13
          2.5. Other sources of energy consumed by the household sector .  .  .  .  .  .  .  .  .  .  .  .  .  .  .  .  .  .  .  .  .  .  .  .  . 14
3.	 Making the case for LPG – Environmental and health impacts of high dependence
    on biomass energy and benefits of LPG .  .  .  .  .  .  .  .  .  .  .  .  .  .  .  .  .  .  .  .  .  .  .  .  .  .  .  .  .  .  .  .  .  .  .  .  .  .  .  .  .  .  .  .  . 16
          3.1. Environmental impacts of high dependence on biomass energy.  .  .  .  .  .  .  .  .  .  .  .  .  .  .  .  .  .  .  .  .  . 16
          3.2. Health impacts.  .  .  .  .  .  .  .  .  .  .  .  .  .  .  .  .  .  .  .  .  .  .  .  .  .  .  .  .  .  .  .  .  .  .  .  .  .  .  .  .  .  .  .  .  .  .  .  .  .  .  .  .  .  .  .  .  .  .  .  . 18
          3.3. Environmental and health benefits of LPG to households.  .  .  .  .  .  .  .  .  .  .  .  .  .  .  .  .  .  .  .  .  .  .  .  .  .  .  .  . 20
4.	 Sudan’s energy policy .  .  .  .  .  .  .  .  .  .  .  .  .  .  .  .  .  .  .  .  .  .  .  .  .  .  .  .  .  .  .  .  .  .  .  .  .  .  .  .  .  .  .  .  .  .  .  .  .  .  .  .  .  .  .  .  .  .  . 22
          4.1. Key stakeholders in the energy sector.  .  .  .  .  .  .  .  .  .  .  .  .  .  .  .  .  .  .  .  .  .  .  .  .  .  .  .  .  .  .  .  .  .  .  .  .  .  .  .  .  .  .  . 22
          4.2. Energy policy .  .  .  .  .  .  .  .  .  .  .  .  .  .  .  .  .  .  .  .  .  .  .  .  .  .  .  .  .  .  .  .  .  .  .  .  .  .  .  .  .  .  .  .  .  .  .  .  .  .  .  .  .  .  .  .  .  .  .  .  .  . 24
          4.3. Government subsidies for LPG .  .  .  .  .  .  .  .  .  .  .  .  .  .  .  .  .  .  .  .  .  .  .  .  .  .  .  .  .  .  .  .  .  .  .  .  .  .  .  .  .  .  .  .  .  .  .  .  . 26
          4.4. A preliminary analysis of relevant policy issues .  .  .  .  .  .  .  .  .  .  .  .  .  .  .  .  .  .  .  .  .  .  .  .  .  .  .  .  .  .  .  .  .  .  .  .  . 28
          4.5.	Conclusions .  .  .  .  .  .  .  .  .  .  .  .  .  .  .  .  .  .  .  .  .  .  .  .  .  .  .  .  .  .  .  .  .  .  .  .  .  .  .  .  .  .  .  .  .  .  .  .  .  .  .  .  .  .  .  .  .  .  .  .  .  .  . 28
5.	 Efforts to substitute LPG for biomass fuels .  .  .  .  .  .  .  .  .  .  .  .  .  .  .  .  .  .  .  .  .  .  .  .  .  .  .  .  .  .  .  .  .  .  .  .  .  .  .  .  .  .  .  .  . 30
          5.1. Sudagaz/FNC project.  .  .  .  .  .  .  .  .  .  .  .  .  .  .  .  .  .  .  .  .  .  .  .  .  .  .  .  .  .  .  .  .  .  .  .  .  .  .  .  .  .  .  .  .  .  .  .  .  .  .  .  .  .  .  . 30
          5.2. Practical action – Kassala/El Fasher .  .  .  .  .  .  .  .  .  .  .  .  .  .  .  .  .  .  .  .  .  .  .  .  .  .  .  .  .  .  .  .  .  .  .  .  .  .  .  .  .  .  .  .  . 30
                    5.2.1 Kassala.  .  .  .  .  .  .  .  .  .  .  .  .  .  .  .  .  .  .  .  .  .  .  .  .  .  .  .  .  .  .  .  .  .  .  .  .  .  .  .  .  .  .  .  .  .  .  .  .  .  .  .  .  .  .  .  .  .  .  .  .  . 30
                    5.2.2 El Fasher – North Darfur .  .  .  .  .  .  .  .  .  .  .  .  .  .  .  .  .  .  .  .  .  .  .  .  .  .  .  .  .  .  .  .  .  .  .  .  .  .  .  .  .  .  .  .  .  .  .  .  .  . 32
          5.3. Sustainable Action Group (SAG) – Abu Shauk and El Salam IDP camps in El Fasher .  .  .  .  .  .  .  .  . 36
          5.4. Sudanese Organization for Building Materials and Construction (SOBMC).  .  .  .  .  .  .  .  .  .  .  .  .  .  .  .  . 38
          5.5. Green Bakery Project, Sayga.  .  .  .  .  .  .  .  .  .  .  .  .  .  .  .  .  .  .  .  .  .  .  .  .  .  .  .  .  .  .  .  .  .  .  .  .  .  .  .  .  .  .  .  .  .  .  .  .  .  . 38
          5.6. Other initiatives .  .  .  .  .  .  .  .  .  .  .  .  .  .  .  .  .  .  .  .  .  .  .  .  .  .  .  .  .  .  .  .  .  .  .  .  .  .  .  .  .  .  .  .  .  .  .  .  .  .  .  .  .  .  .  .  .  .  .  .  . 39
6.        Findings, conclusion and recommendations.  .  .  .  .  .  .  .  .  .  .  .  .  .  .  .  .  .  .  .  .  .  .  .  .  .  .  .  .  .  .  .  .  .  .  .  .  .  .  .  .  . 41
          6.1.	 Barriers to widespread use of LPG.  .  .  .  .  .  .  .  .  .  .  .  .  .  .  .  .  .  .  .  .  .  .  .  .  .  .  .  .  .  .  .  .  .  .  .  .  .  .  .  .  .  .  .  .  .  . 41
                    6.1.1 High upfront cost of LPG appliances and new technology.  .  .  .  .  .  .  .  .  .  .  .  .  .  .  .  .  .  .  .  .  .  . 41
                    6.1.2 Price competiveness of woodfuel .  .  .  .  .  .  .  .  .  .  .  .  .  .  .  .  .  .  .  .  .  .  .  .  .  .  .  .  .  .  .  .  .  .  .  .  .  .  .  .  .  . 41
                    6.1.3 Lack of adequate infrastructure.  .  .  .  .  .  .  .  .  .  .  .  .  .  .  .  .  .  .  .  .  .  .  .  .  .  .  .  .  .  .  .  .  .  .  .  .  .  .  .  .  .  .  . 42
                    6.1.4 Lack of information .  .  .  .  .  .  .  .  .  .  .  .  .  .  .  .  .  .  .  .  .  .  .  .  .  .  .  .  .  .  .  .  .  .  .  .  .  .  .  .  .  .  .  .  .  .  .  .  .  .  .  .  . 43
                    6.1.5 Social and cultural issues.  .  .  .  .  .  .  .  .  .  .  .  .  .  .  .  .  .  .  .  .  .  .  .  .  .  .  .  .  .  .  .  .  .  .  .  .  .  .  .  .  .  .  .  .  .  .  .  . 44
          6.2. Recommendations.  .  .  .  .  .  .  .  .  .  .  .  .  .  .  .  .  .  .  .  .  .  .  .  .  .  .  .  .  .  .  .  .  .  .  .  .  .  .  .  .  .  .  .  .  .  .  .  .  .  .  .  .  .  .  .  .  . 45
Annex 1. List of tables. .  .  .  .  .  .  .  .  .  .  .  .  .  .  .  .  .  .  .  .  .  .  .  .  .  .  .  .  .  .  .  .  .  .  .  .  .  .  .  .  .  .  .  .  .  .  .  .  .  .  .  .  .  .  .  .  .  .  .  .  .  .  . 47
Annex 2. List of figures .  .  .  .  .  .  .  .  .  .  .  .  .  .  .  .  .  .  .  .  .  .  .  .  .  .  .  .  .  .  .  .  .  .  .  .  .  .  .  .  .  .  .  .  .  .  .  .  .  .  .  .  .  .  .  .  .  .  .  .  .  .  . 48
Annex 3. Acronyms and abbreviations .  .  .  .  .  .  .  .  .  .  .  .  .  .  .  .  .  .  .  .  .  .  .  .  .  .  .  .  .  .  .  .  .  .  .  .  .  .  .  .  .  .  .  .  .  .  .  .  .  . 49
Annex 4. LPG consumption in the Sudanese states (1993-2006).  .  .  .  .  .  .  .  .  .  .  .  .  .  .  .  .  .  .  .  .  .  .  .  .  .  .  .  .  .  . 50
Annex 5. Summary of advantages and disadvantages of LPG.  .  .  .  .  .  .  .  .  .  .  .  .  .  .  .  .  .  .  .  .  .  .  .  .  .  .  .  .  .  .  . 52
Annex 6. References .  .  .  .  .  .  .  .  .  .  .  .  .  .  .  .  .  .  .  .  .  .  .  .  .  .  .  .  .  .  .  .  .  .  .  .  .  .  .  .  .  .  .  .  .  .  .  .  .  .  .  .  .  .  .  .  .  .  .  .  .  .  .  . 53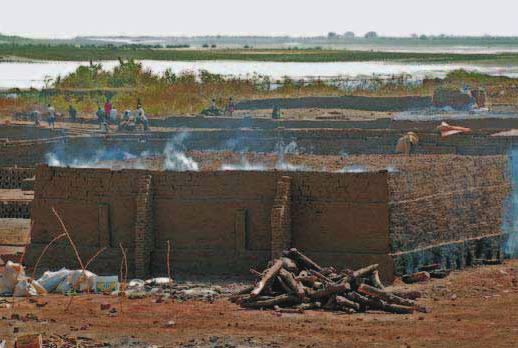
Executive summary

The depletion of forests in Sudan is a major challenge   and automotive sectors, amongst others. So as to
facing the countr y today. North and central             protect supplies and ensure its policy commitment
states of have lost 70% of their forest cover since      to supporting the household and services sectors
independence (UNEP, 2007). Recurrent droughts,           with clean energy, the government removed
desertification, over-grazing and expansion of           subsidies for LPG to the country’s industrial sector.
agricultural land, as well as the collection of timber
for firewood, charcoal production and other uses,        Despite the success in uptake, it is clear that the
are among the root causes of forest degradation.         benefits of LPG have not been equally spread.
The use of biomass fuels for household energy            Poor households in the peripheries of large towns
creates significant demand for forest products and       and rural areas still have little to no access to
leads to further degradation of an already scarce        clean energy. The consumption of LPG is largely
resource.                                                concentrated in Khartoum state, which constituted
                                                         about 75 percent of overall consumption in
The impacts of household reliance on wood based          2006. The other states had minor shares, with the
fuels are considerable. Poor peri-urban households       central states of Gezira and Sinnar accounting
spend a sizeable percentage of their income on           for 14 percent together; with the remaining states
purchasing firewood and charcoal, while rural            consuming the rest.
households collect fuelwood, sometimes in inse-
cure areas.                                              As cleaner renewable energy options are still
                                                         under development, LPG is presented as the
Biomass energy use has been shown to be highly           short-term solution in delivering clean modern
inefficient. In households across Sudan, biomass         energy for household use, and particularly for
fuels are burned in stoves that are often only 10 to     cooking applications. This study concludes that
15 percent efficient, wasting heat and releasing         there are clear benefits from the use of LPG over
excessive amounts of smoke. The latter contributes       the existing biomass fuels that are widely used by
to serious health problems for women and for chil-       the household sector across the country. These
dren below five years of age. Accordingly indoor air     include improved environmental conservation and
pollution measurements conducted in peri-urban           reduced deforestation, climate change mitigation,
households in Kassala, Eastern Sudan, showed that        improvement in women and children health and
the level of indoor air pollution caused by wood fires   wider socio-economic development.
is 20 times or more higher than standards specified
by WHO.                                                  This study demonstrates that LPG use in Sudan is on
                                                         a slow ascendancy, due in particular to govern-
In the face of these challenges, the rationale for       ment incentives, investment by LPG companies in
clean and efficient energies is clear. One of the        distribution infrastructure and dissemination efforts
options that has emerged in Sudan is liquefied           made by private, public and non-governmental
petroleum gas (LPG). Upon the onset of local             organizations.
production of LPG in Sudan, the Government of
National Unity adopted a fuel-switching policy           LPG use remains, however, concentrated in the cen-
to increase the uptake of LPG amongst the                tral region of the country. This has been attributed to
population. The price of LPG was reduced by 50           high population density, the high price of woodfuel,
percent and LPG appliances were exempted from            greater awareness and infrastructure development.
import duty tax. As a result of this intervention the
use of LPG, particularly by the domestic sector,         The study analyses a range of case studies of LPG
increased from about 31,000 metric tonnes in             promotion initiatives across Sudan and recognizes
2000 to 274,000 metric tonnes in 2006. In addition       the following as the main barriers for the widespread
there was significant uptake in use by the industrial    national use of LPG:

4                                                        The use of liquefied petroleum gas (LPG) in Sudan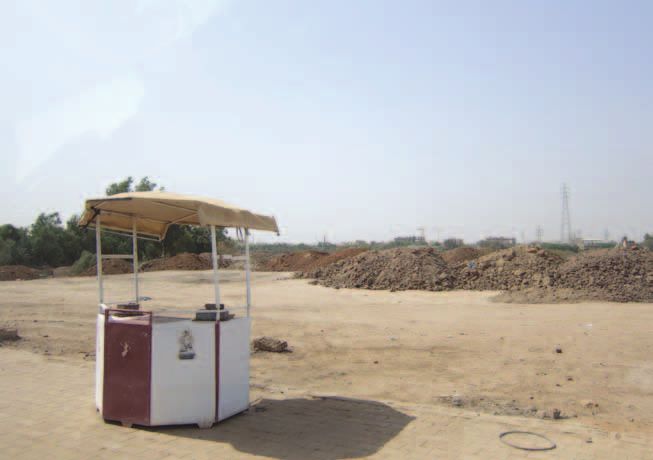
1.	 The relatively large initial investment needed to
    acquire LPG appliances (cylinders and stoves);

2.	 The higher price of LPG compared to woodfuel
    prices in parts of the country;

3.	 The lack of infrastructure for LPG distribution;

4.	 A general lack of information;

5.	 Social and cultural issues.

Based on the best practices and lessons learnt from
existing initiatives, four broad recommendations
are proposed. Together these should constitute the
building blocks of any strategy to scale up LPG use
in Sudan. The recommendations are:

1.	 Public awareness and consumer education on
    benefits of LPG and safety precautions of LPG
    use;

2.	 Government policies and initiatives to promote
    LPG market development, including strategy for
    full application of subsidies and national price
    stabilization;

3.	 Increased focus on women as primary ben-
    eficiaries in LPG scale-up activities, including
    capacity building support for WDAs;

4.	 Development of full cost recovery microfinance
    options to facilitate household access to clean
    modern energy such as LPG.

Expanding the use of LPG in Sudan is one clear
solution to help address the depletion of forest
resources and the associated risks and to set Sudan
on a Green Economy pathway.

The use of liquefied petroleum gas (LPG) in Sudan       5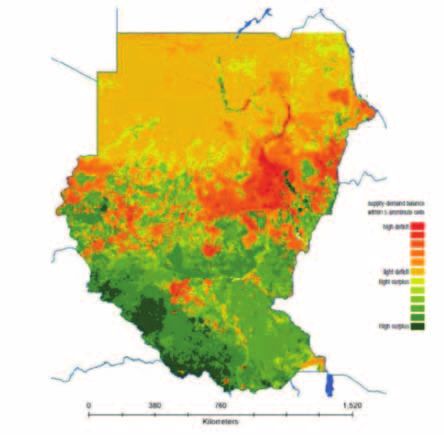
1. Introduction

The forestry sector is very important in Sudan – fuel-   climate change. The gum Arabic belt for example
wood and charcoal constitute the main domestic           (an area of 520,000 km2 between the latitudes of
energy sources, while timber is the country’s primary    10° and 14° north), covering one-fifth of Sudan’s
source of construction material. The forestry sector     land surface, protects 40 percent of the country
contributes as much as 13 percent to Sudan’s gross       from desert encroachment.
domestic product (GDP).
                                                         A large increase in the consumption of forest prod-
Sudan is confronted by a number of processes             ucts (mainly in Khartoum state where much of the
of change which significantly threaten its existing      population is concentrated), combined with the
natural resource base. Increasing urbanization,          uneven distribution of resources and changing
which has in places been compounded by con-              rainfall patterns, has led to serious inequalities in the
flict related displacement, coupled with a growing       supply of, and demand for, resources. The shortfall in
population has led to significant demand in house-       fuelwood in some areas is clearly demonstrated by
hold energy needs and for construction material.         the Woodfuel Integrated Supply/Demand Overview
Sudan’s population grew from 21 million in 1981          Mapping by FAO (Figure 1.1).
(1981 census) to 39.2 million in 2008 (4th Census in
2008), representing a growth rate of 2.8 percent         The green areas in the map represent areas with
according to the Central Bureau of Statistics. This      a high surplus in fuelwood, while the red areas
is recognized as one factor which has contributed        represent areas with a shortage of fuelwood. It is
to deforestation in Sudan. According to the UN           clear from this that the Khartoum area in particular
Food and Agriculture Organization (FAO, 2006),           as well as the Darfur states need to consider alter-
Sudan lost more than 5,500 km2 of forest per year        native energy sources and more efficient energy
between 1990 and 2000 – an annual deforestation          consumption, particularly in the context of the 2011
rate of 0.77 percent. This increased to 0.84 percent     secession of South Sudan.
between 2000 and 2005, meaning that since 1990
Sudan has lost 11.6 percent of its forest cover. UNEP    Alongside the natural and demographic factors
(2007) meanwhile estimates that given an annual          that impact energy supply and consumption in
rate of loss of 1.87 percent between 1973 and            Sudan, another contributing factor is the long period
2006, 48.2 percent of forest cover has been lost         of conflict the country has experienced. This has
in since 1973.                                           had a particular effect on energy consumption
                                                         patterns, the environment and livelihoods. With
At the same time, climate and rainfall patterns          large numbers of people forced to abandon their
have changed significantly. Statistics from Darfur       homes, internally displaced persons (IDP) and refu-
show that there is increased variability of rainfall     gee camps have become commonplace in some
and an increased likelihood of drought. In Darfur, it    parts of the country. People in these camps search
is acknowledged that 16 of the 20 driest years on        for firewood alongside the local population, often in
record have occurred since 1970. This pattern is in      situations where the conflict has cut off alternative
keeping with climate change models for the Sahel         fuel sources. This has significantly increased defor-
region and is likely to continue in the coming years.    estation and wrought significant changes in liveli-
                                                         hood patterns. For example, livestock rearing and
Stopping deforestation and protecting and                agriculture has ceased to provide the best option
increasing the area of land covered by forests is        and firewood collection has become more attrac-
a necessary component for any strategy to build          tive (Figures 1.2). At the beginning of the conflict,
resilience against the consequences of climate           collection of wood and charcoal production were
change. Forests not only convert carbon dioxide          only coping strategies, but now they have become
(CO2) into oxygen, thus slowing the pace of climate      viable long-term livelihood options – a seismic shift
change, but they also prevent soil erosion, helping      that needs to be reversed. In the event of failure to
to secure agricultural productivity and combat           respond, conflicts over timber resources will arise,

6                                                        The use of liquefied petroleum gas (LPG) in Sudan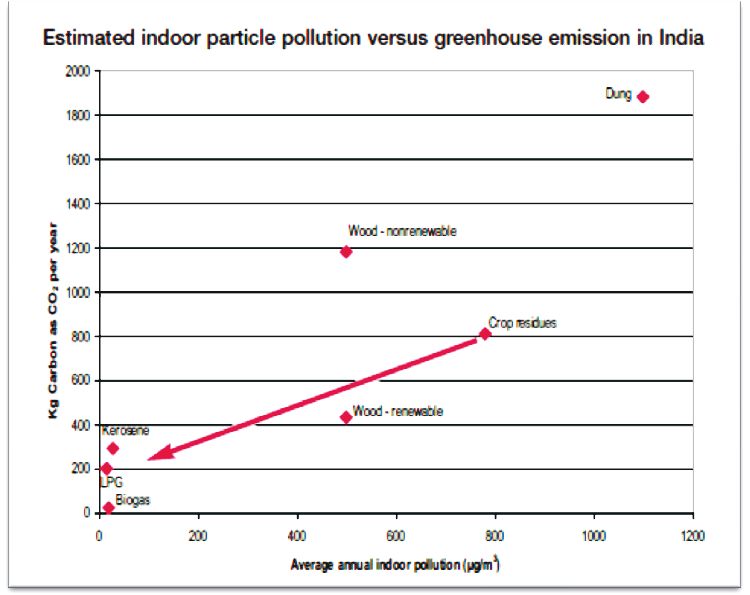
Figure 1.1. WISDOM – East Africa. Woodfuel Integrated Supply/Demand Overview Mapping (WISDOM)
Methodology.

Source: FAO (2005)

Figure 1.2. Shift in livelihood strategies (Arab Aballa in Barka Alla, North of Kutum, North Darfur)

Source: Tufts University (2009)

The use of liquefied petroleum gas (LPG) in Sudan                                                      7
particularly in the north-south Sudan border regions,     use was mainly limited to Khartoum, where only well-
where economic opportunities in timber trade are          off households and a few institutions, like the Uni-
high.                                                     versity of Khartoum boarding houses, were using it.
                                                          During the 1970s, other petroleum companies (Total
A switch to innovative, sustainable, clean energy         and Agip) entered the LPG market in Sudan. Despite
sources is, therefore, urgently needed for the            this, owing to the high price of (imported) LPG and
Sudanese people. Since the household sector is            the low cost of firewood and charcoal, LPG use
the largest energy consumer in Sudan, widespread          remained restricted to Khartoum state. During the
promotion and use of clean cooking technologies           late 1980s, firewood and charcoal prices increased
is essential. Among the options for clean fuel in         and this, combined with greater public awareness,
Sudan is Liquefied Petroleum Gas (LPG). LPG is a          saw the use of LPG expand beyond Khartoum to
mixture of gaseous hydrocarbons, primarily pro-           reach the capital cities of states in northern Sudan.
pane and butane, derived during natural gas and           However, bottlenecks in supply chains limited its
oil extraction and refining. It is a clean burning fuel   use beyond well-off households that could afford
which emits no smoke or residual particulate matter       to keep a stock of several cylinders.
and has relatively low pollutant emissions. It has a
number of advantages over traditional wood fuels          Following the inauguration of the Khartoum refinery,
including:                                                which used locally produced oil, availability of LPG
                                                          ceased to be an issue. The Government introduced
•   No soot, burners have a longer life and there-        a policy to incentivize the use of LPG by the domes-
    fore maintenance is low;                              tic sector which attracted several institutions to
                                                          engage in projects intended to scale up LPG use,
•   No spillage as it vaporizes at atmospheric tem-       particularly in the household sector, across Sudan.
    perature and pressure;
                                                          This report evaluates the efforts to date to support
•   Instantly controllable flame temperature;             the adoption of LPG use across the country, and
                                                          looks to highlight the constraints currently blocking
•   Avoids scaling and decarburizing of parts;            its widespread use.

•   Environmentally friendly fuel with minimal sul-       Work on this report was undertaken on the
    phur content and sulphur- free emissions;             recommendation of the Environmental Technology
                                                          Task Force (ENTEC), that was set up as a collaboration
•   Very high efficiency with direct firing system        between UN, donor and civil society organisations
    instant heat for faster warm-up and cool-down;        following the importance of this issue, identified
                                                          during the Darfur Joint Assessment Mission (DJAM)
•   Can be used for a variety of applications.            process in 2008. ENTEC’s central concern is to
                                                          introduce and scale-up alternative construction and
LPG can be easily stored, transported and used            energy technologies in Darfur to reduce the current
virtually anywhere from downtown urban areas to           rate of deforestation and projected deforestation
remote rural area. These properties have made it          in the future when IDPs eventually return and
a highly appealing global fuel option which both          reconstruction begins. The group is co-chaired
meets household energy needs and causes very              by UNEP with a focus on energy and UN-Habitat
low levels of pollution. While LPG also has potential     with a focus on construction technologies. More
downsides – it is highly inflammable at very low          information is available at www.unep.org/sudan.
concentrations, and gas is odourless so the addi-
tion of a pungent odorant is compulsory worldwide
to enable rapid detection of leakages – its use is
considered significantly safer for household pur-
poses than fuels.

The introduction of LPG in Sudan was pioneered by
the Shell Petroleum Company during the 1960s. Its

8                                                         The use of liquefied petroleum gas (LPG) in Sudan
2. Energy consumption in Sudan
2.1. Overall energy consumption percent in 2001 to 63 percent in 2009. Biomass
here refers to firewood, charcoal and residues
The last major national study on energy consump- from agriculture and animal waste.
tion in Sudan was published in 2001. Since then
however, Sudan has become a major oil producer The Second National Energy Assessment confirmed
and exporter. As a result the data in the 2001 the findings of the First National Assessment, in 1981,
national assessment cannot be said to accurately that biomass is the dominant source of energy
reflect the current situation as energy consumption in Sudan. Its contribution to national energy con-
patterns have undergone considerable changes. sumption, however fell from 83 percent in 1981
In particular three major changes since the Second to 78 percent in 2001 and to 63 percent in 2009.
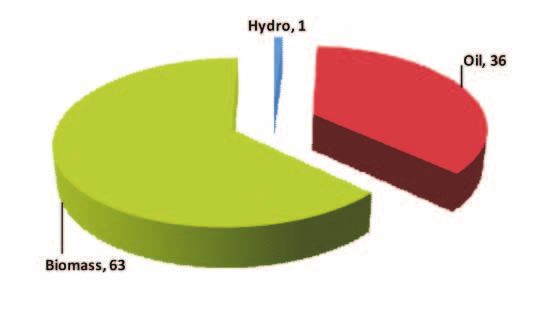
Energy Assessment can be noted: Sudan’s principal energy sources are hydropower
(one percent), locally produced crude petroleum
• Petroleum products have become widely (36 percent) and biomass (63 percent). (Figure 2.1)
available from local refineries, their share in Energy from biomass mainly constitutes the burning
the energy market having increased from 20 of firewood and charcoal.
percent in 2001 to 36 percent in 2009;
Figure 2.2 shows Sudan’s national energy balance.
• Power generation (both hydro and thermal) has Sudan’s primary energy supply in 2008 amounted
expanded considerably; to 14,908 kilo tonnes of oil equivalent (ktoe), while
energy consumption was 9,810 ktoe. This indicates
• LPG is produced at the Khartoum refinery and a high rate of energy loss from petroleum product
has been set aside for domestic consumption refining, electricity generation and distribution,
and power generation. Consequently, the bio- petroleum products distribution, and biomass con-
mass share in the energy market fell from 78 version (the production of charcoal).
Figure 2.1. Sources and percentages of national energy supply in Sudan, 2009
Hydro 1%
Oil 36%
Biomass 63%
Source: Ministry of Energy and Mining (2009)
The use of liquefied petroleum gas (LPG) in Sudan 9At 67 percent, the biomass conversion losses are percent increase in urbanization rate induced a 14
remarkably high. This is due largely due to the percent increase in charcoal consumption (Tanza-
characteristics of charcoal production technol- nia Association of Oil Marketing Companies, 2002).
ogy – earth mound kilns, which have a theoretical
efficiency of about 30 percent. Earlier research con-
ducted by the Energy Research Institute indicated
2.2. Overall biomass energy
reasonable efficiency figures (of about 25 percent) consumption
for large volume (>100 m³) earth mound kilns,
which are commonly used in Sudan. (ERI, 1987) The Second National Energy Assessment showed
total consumption of biomass energy in 1999 to
Figure 2.2 also shows energy consumption by be about 8 million toe. This fell to 6.5 million toe
the country’s main sectors. The household sec- in 2008. Firewood remains the dominant biomass
tor is the dominant consumer with 49 percent in fuel, over the years contributing 63 percent of total
2008, against 60 percent in 2001. This reduction is biomass energy consumption (Figure 2.2).
explained by the expansion in the consumption of
petroleum products, mainly in the transport sector. The main consuming sectors of biomass energy
Biomass represents 95 percent of the total energy (Figure 2.3) are: household (68 percent), com-
consumed by the household sector. Of particular mercial/services (21 percent) and industries (11
note is the consumption of charcoal by households percent). The commercial/services sector includes
in urban centres. Over the last 25 years, urbanization restaurants and schools, while the industrial sector
levels in Sudan have risen from 22.4 percent in 1985 is composed largely of brick-makers, lime-burning
to 45 percent in 2010. Studies have shown that a 1 enterprises and oil mills.
Figure 2.2. National energy balance (‘000 tonnes of oil equivalent [toe]), 2008
ENERGY BALANCE and FLOWS (000 TOE) - 2008
Energy Supply Conversion and Losses End Use Sectors - Consumption
Hydro-Power 14
126 474 368
1% 57 Agriculture
Transmission & Distribution
8 Losses 18%
4
3 (106)
Generation Losses (66%)
705
(531) 203
Industry 10%
8 47
7
Crude Production 8
23098
4707 3099 1309 Services 14%
36%
Petroleum 117 (Commercial &
4079 Government)
Exported (18391)
Crude
Refinery Losses 13%
Exported Petroleum Products (678) 2577
Imported Petroleum Products 996 Transport 26%
Distribution Losses (318)
Wood 4037 190
63%
262
9079 Agri-Residues 1167 6343
4329 H-Holds 49%
Biomass
Wood Converted
to Chacoal 3875
(2596)
Charcoal Converssion Losses 67%
Resources = Consumption + Losses
14280 = 9810 + 4470
Source: Ministry of Energy and Mining (2009)
10 The use of liquefied petroleum gas (LPG) in SudanFigure 2.3. Composition of biomass energy biomass sources which constitute 96 percent of
consumption, 2009 total energy consumed by the household sector
Residue in 2001. (Figure 2.4)
s
Firewood and charcoal at 59 percent and 24 per-
17%
cent respectively, are the main fuels consumed.
At more than 12 percent, biomass residues also
constitute a considerable share of total household
energy consumption. This is mainly in the form of
cotton stalk produced in large irrigated agricultural
schemes in central Sudan.
Charcoal
Wood Charcoal is the main cooking fuel for urban house-
20%
63% holds (used by more than 89 percent of house-
Source: Ministry of Energy and Mining (2009) holds), while firewood is the dominant cooking fuel
in rural areas (used by more than 81 percent of
households). Indicatively, Khartoum state has the
lowest urban consumption of firewood per capita
The consumption of biomass energy by Sudanese
states shows considerable variation dependant on
the size of the population and resource availability
Figure 2.4. Consumption (%) of biomass energy
(Table 2.1). South Darfur and Khartoum states are
by sector, 1999
the major consumers of biomass energy, at 13
percent and 10 percent of total national biomass
energy consumption respectively.
2.3. Biomass energy
consumption – household sector
Household sector consumption accounts for 49 per-
cent (2008) of total energy consumption in Sudan.
Household energy consumption meanwhile – used
chiefly for cooking – comes almost entirely from Source: Ministry of Energy and Mining (2009)
Table 2.1. Biomass energy consumption in some Sudanese states (‘000 toe), 2001
Woodfuel Total biomass
% of total Biomass % of total
State
Charcoal Firewood Total country residues Total country
consumption consumption
North Darfur 47 274 321 5 6 326 4
West Darfur 47 306 364 5 3 357 4
South Darfur 98 834 932 14 82 1,014 13
Khartoum 286 499 785 12 8 793 10
River Nile 46 102 148 2 28 176 2
North Kordofan 98 290 388 6 49 437 5
Source: Ministry of Energy and Mining (2009)
The use of liquefied petroleum gas (LPG) in Sudan 11and the highest urban charcoal consumption per charcoal meanwhile is 0.0667 tonnes (respec-
capita. Similarly, the percentage of rural households tively 0.0542 tonnes and 0.0913 tonnes for rural
using charcoal is very low in the three Darfur states and urban households). Households often use a
compared to other states.
combination of both fuels (Table 2.2). Firewood is
mostly used by both urban and rural households
The average national per capita consumption of
firewood is 0.273 tonnes (respectively 0.322 tonnes for cooking the main staple foods in the country:
and 0.176 tonnes for rural and urban households). Asida and Kisra1. Following the 1985 drought and
The national average per capita consumption of famines, the consumption of bread increased
Table 2.2. Households using a combination of different fuels for cooking purposes, White Nile state (%)
Type of fuel % of consumption
LPG 3.2
Firewood 2.4
Charcoal 4.0
LPG + firewood 2.4
Charcoal + firewood 4.8
Charcoal + firewood + LPG 17.4
Charcoal + firewood + LPG + agricultural residues 61.6
Charcoal + firewood + dung + agricultural residues 4.0
Other (agriculture residues, kerosene, gasoline, dung) 5.0
Source: Mahasin (2007)
Figure 2.6. Biomass energy consumption by the industrial sector in Sudan
Source: Ministry of Energy and Mining (2001)
1
Asida is the main staple food in rural areas of Sudan, particularly Darfur, a porridge made from millet flour and cooked in round
aluminum pots that only fit well on the 3-stone fire place as the cooking process demands rigorous stirring) Kisra (mainly in Central
Sudan, Kisra represents the main staple food, a sort of pancake cooked on a hot plate, which fits well on almost all sorts of stoves,
even large size charcoal stoves (including recently LPG).No measures have been made to compare the energy consumption of
cooking Asida and Kisra. The cooking of Kisra consumes less energy as it does not involve boiling the water.
12 The use of liquefied petroleum gas (LPG) in Sudansignificantly across Sudan. Bread production is now Figure 2.7. Biomass energy consumption by
visible in almost all villages of Sudan and in remote medium-sized industries (‘000 toe), 1998
rural areas. The availability, access and cost of fuels
determine a household’s choice of the energy mix
for cooking.
2.4. Biomass energy
consumption – industrial and
services sector
Biomass energy consumption by industry sectors is
shown in Figure 2.7. The main consumer of agro-
residues is the sugar industry, where bagasse (the
fibrous matter that remains after sugarcane or Source: Ministry of Energy and Mining (2001)
sorghum stalks are crushed to extract their juice) is
a biofuel used mainly to meet the industry’s heat
and power demands. date national statistics are unavailable, it is clear
that in the 15 years since then, the economic land-
Industrial use of firewood and agricultural residues scape of Sudan has witnessed significant change
is mainly dominated by rural oil mills and soap fac- led by increased national revenue due to oil export.
tories (Figure 2.7), small to medium-sized concerns The building industry has flourished, prompting an
scattered across rural towns. Inefficiently generated increased demand for bricks. Accordingly, the pro-
heat is the main end use of these biofuels. duction of bricks may have as much as doubled,
and production has expanded to reach new areas.
(i) Brickmaking Industry In addition, the impacts of conflict induced dis-
The brick-making industry is distributed across placement have caused the production of bricks to
Sudan, however it is particularly concentrated increase several fold. In particular, increasing rates of
in central Sudan, along the Blue Nile In 1994, urbanization through the influx of people displaced
the industry’s annual consumption of firewood from rural areas, combined with the increased pres-
amounted to 13,932,000 toe. While more up to ence of the international community (UN peace-
Figure 2.8. Number of bricks produced and taxed by Forestry National Corporation (FNC) in major
towns of Darfur, pre and post conflict
Source: Ministry of Energy and Mining (2001)
The use of liquefied petroleum gas (LPG) in Sudan 13Figure 2.9. Regional annual firewood consumption by bakeries, 1994, 2000 and 2005 (‘000 toe)
Source: Ministry of Council of Ministers (2005)
keepers and humanitarian agencies and NGOs) It is usually classified into two categories: formal
created significant demand drivers for construction (restaurants, boarding houses, schools and prisons)
and increased brick-making. (Figure 2.8) and informal (urban and roadside tea and food
vendors).
(ii) Other industries
The bread-making industry is a major consumer of 2.5. Other sources of energy
firewood. Since 1994 there has been a consistent consumed by the household
increase in firewood consumption across Sudan
(Figure 2.9). In 2005, firewood consumption by bak-
sector
eries amounted to 15,738,000 toe, with Khartoum
Other energy sources used in the domestic sector
state and the central regions of Sudan accounting
include electricity and petroleum products (kero-
for the highest consumption levels
sene/gasoil and LPG). Consumption of the latter,
and particularly of LPG by the household sector,
(iii) Commercial and services sector has increased considerably in recent years. This can
Commercial and services sector consumption of be attributed both to increasing availability from
biomass energy is quite considerable (Table 2.3). local production, and to government incentives.
Table 2.3. Annual firewood and charcoal consumption by the commercial/services sector, 1999
Charcoal consumption Firewood consumption
Commercial/Services
(tonnes) (tonnes)
Formal Sector 234,640 2,477,078
Informal sector 13,925.2 10,550
Total 248,565.2 2,487,628
Source: Ministry of Energy and Mining (2001)
14 The use of liquefied petroleum gas (LPG) in SudanFigure 2.10. Share of electricity consumption by the different sectors Source: Ministry of Energy and Mining (2009) Kerosene/gasoil is mainly used for lighting purposes, while LPG is mainly used for cooking in urban areas. The household sector consumes about 51 percent of total generated electric power (about 2.7 percent of total household energy consumption) (Figure 2.10). Only about 30 percent of the population enjoys this service however as the national electricity grid only covers central parts of the country. Other towns are supplied from isolated generation units, while rural areas of the country remain out of range of electricity services. The vast size of the country, coupled with distant rural settlements, have made investment in power infrastructure in rural areas prohibitive. The use of liquefied petroleum gas (LPG) in Sudan 15
3. Making the case for LPG – Environmental and
health impacts of high dependence on biomass
energy and benefits of LPG

3.1. Environmental impacts of high                      The demand for wood products is significant
                                                        and far exceeds the natural regrowth rate. The
dependence on biomass energy                            annual clearance of forest area in Sudan is
The environmental challenges posed by the high          about 36,975 hectares. This has led to a tangible
dependence on biomass as a source of household          deficit between the annual consumption of forest
energy are considerable in Sudan. The country has       products, 21 million m³, and the annual growth
witnessed an acute reduction in forest area, which      rate and reforestation of 10 million m³ annually.
has decreased from covering 36% of the country          The result of such a non-sustainable exploitation
in 1958 to 12% in 1998. (Forestry National Corpora-     of forest resources is a continuous depletion of
tion (FNC), 1998)                                       forest area.

Table 3.1. Risks associated with forest loss and degradation

     Function                               Process                               Implication

                               Rainfall diminishes over deforested     Prejudicial to agricultural and
     Climatic amelioration
                               land, but not greatly                   pastoral production

                               Unprotected soil loses fertility
                                                                       Highly prejudicial to agricultural
     Soil                      and/or rapidly erodes to a near-
                                                                       production
                               worthless condition

                               Deforested slopes release water         Water loss during rains; water
     Water catchment
                               rapidly                                 shortages during dry season

                               Heavy off-take of wood converts
                                                                       With less woodland, Sudan would
                               closed forest to open forests, and
     Habitat conservation                                              lose much of its wildlife and many
                               open forest to scrubland – leading
                                                                       rare species of plants
                               to desertification

                               Traditional culture depends heavily     Medicinal herbs and wood for
     Culture values
                               of forest products                      carving become harder to find

                               Most rural dwellers augment their       Wild fruits and honey become
     Subsistence
                               food supply with forest products        harder to find

                                                                       Diversion of government funds to
     Civil disorder            Competition for scarce resources        security and public order instead
                                                                       of development

Source: UNEP (2007)

16                                                      The use of liquefied petroleum gas (LPG) in Sudan
Figure 3.1. Regional distribution of the volume of growing forest stock and annual allowable cut, 1998
Source: FNC (1998)
Figure 3.1 shows that the Darfur and Kordofan and other deadwood. In contrast urban households
regions contain the bulk of remaining woody bio- primarily depend on fuel purchased from the mar-
mass stock in the Republic of Sudan. However, within ket. In general, commercial fuelwood is collected
these regions the distribution of remaining woody by organized, well-equipped traders who undertake
biomass stock can vary considerably – Northern large-scale tree felling to obtain bulk quantities of
Darfur and Northern Kordofan, for example are fuel which is then transported to urban areas. By
highly impacted by desert encroachment and clearing large forest areas annually without replant-
have significantly fewer forest resources than South ing trees, the harvesting of fuel for the urban markets
Darfur and South Kordofan. (FNC (1998) contributes to environmental degradation.
Urban demand for wood products is an important The industrial sector also contributes to the depletion
driver of deforestation in less populated states. of forest resources (Figure 3.2). Bakeries and brick-
Firewood and charcoal are presently hauled over makers are the main consumers of firewood in the
more than 1,000 km to supply major consump- industrial sector. Both industries employ traditional
tion areas in central Sudan (Khartoum and Central production processes characterized by using inef-
region) from as far off as South Kordofan. ficient wood burning techniques. The brickmaking
industry is considered highly polluting in nature and
The burning of non-renewable woodfuel is also energy intensive. Such highly polluting industries
responsible for emissions of greenhouse gases, are a major health hazard for not only the work-
including as CO2, CH4, CO, N2O and NOx. Given ers but also for the surrounding populations. This
that the household sector is responsible for consum- is particularly the case in Khartoum State, where
ing 68% of total biomass consumption in Sudan, brickmaking yards along the Blue and main River
it is clear that this sector is an important source of Niles are becoming enclosed within the residential
greenhouse gas emissions as it uses non-renewable areas. Smoke from the brick kilns accompanied by
woodfuel burned in inefficient stoves. However, a strong odour has become an inherent feature of
some studies (Ministry of Energy and Mining,1983) many residential areas of Khartoum. The burning
claim that households in the rural areas use renew- of cow dung contained in the bricks is the main
able wood as they usually collect fallen branches source of the odour.
The use of liquefied petroleum gas (LPG) in Sudan 17Figure 3.2. Annual fuelwood consumption by traditional industries and forest area cleared to meet the
demand
Source: Ministry of Council of Ministers (2005)
The inefficient burning of biomass fuels emits harm- 3.2. Health impacts
ful greenhouse gases which usually are referred to
as products of incomplete combustion (PIC). These Cooking and heating with solid fuels, such as dung,
are considered to be significantly larger contributors wood, agricultural residues, charcoal and coal,
to global warming than CO2 and include methane remains the most widespread traditional source of
(CH4), nitrous Oxide (N2O), carbon monoxide (CO) indoor air pollution exposure globally. Indoor smoke
and non-methane hydrocarbons (NMHC). (COM- contains a range of health-damaging pollutants,
PETE, 2009). such as small particles and CO, and particulate
pollution levels may be 20 times higher than
The burning of fuelwood is considered to be accepted guideline values (WHO 2004). Indeed,
among the highest contributors of PIC’s amongst indoor air pollution has been identified as being
other sources of domestic fuel. Due to incomplete responsible for 2.7 percent of the global burden
of disease (WHO, 2009).Nearly 2 million people die
combustion of fuelwood anywhere between 10 and
every year from household air pollution; 44 percent
20% of released carbon is PIC.
from childhood lower respiratory infections (LRI), 54
percent from chronic obstructive pulmonary dis-
Modern cooking fuels emit far less PIC than fuel-
ease and 2 percent from lung cancer. (WHO 2011)
woods which, due to incomplete combustion,
It has been found that children exposed to indoor
release 10 and 20% of released carbon as PIC. LPG
air pollution from household solid fuel use have a
on the other hand is far more efficient, with a release
2.3-fold higher risk of LRI, while women exposed to
rate of 2.3%.(COMPETE, 2009) Even where biomass
such indoor air pollution have a 3.2-fold higher risk
is harvested sustainably, the fuelwood would not be of COPD (Goldemberg, J. et al., 2004).
carbon neutral due to its incomplete combustion.
The situation is further exacerbated when fuelwood People cook with solid fuels at least once a day
is inefficiently burned on traditional stoves, as is the in around half of the world’s households (Desai et
case in Sudan. al., 2004). In rural areas of developing countries,
18 The use of liquefied petroleum gas (LPG) in SudanTable 3.2. Annual premature death and disability associated with indoor air pollution in Sudan
Premature deaths attributable Disability-adjusted life Share of total national burden
to use of fuelwood and years attributable to use of disease attributable to use
charcoal for cooking of fuelwood and charcoal of fuelwood and charcoal
4,400 79,000 0.7%
Source: IEA (2008)
the prevalence of solid fuel use is even higher. In national burden of disease attributable to the use of
Sudan, more than 70 percent of households use fuelwood and charcoal is estimated at 0.7 percent
solid fuels as their primary household cooking fuel (see Table 3.3). Monitoring of indoor air pollution
(SHHS, 2006). Combustion of solid fuels on inefficient in poor households in Eastern Sudan, meanwhile,
stoves in poor ventilation conditions results in large showed that concentrations of CO and particu-
exposure to indoor air pollution, particularly for
late matter were 20 times the WHO standard of
women and young children, who spend the greater
50 µg/m³ (Practical Action, 2006).
part of their time at home.
In Sudan premature deaths attributable to the use Figure 3.3 shows the emission of pollutants of differ-
of fuelwood and charcoal for cooking are esti- ent household fuels per cooked meal. As concerns
mated at 4,400 per year, while disability-adjusted the relative emissions per meal, LPG use is second
life years attributable to their use are estimated lowest for both carbon monoxide and hydrocar-
at 79,900 per year (IEA 2008). The share of total bons, and lowest for particulate matter.
Figure 3.3. Health-damaging pollutants per unit energy delivered: ratio of emissions to LPG
Smith, K.R et al. (2005)
The use of liquefied petroleum gas (LPG) in Sudan 193.3. Environmental and health iii. According to the IPCC, LPG is not a greenhouse
gas, meaning it is assigned a global warming
benefits of LPG to households potential factor of zero. The IPCC lists the global
LPG, a mixture of gaseous hydrocarbons produced warming potential factor of CO2 as 1 and C4
from natural gas and oil extraction as well as oil as 25 (IPCC, 2007).
refining, has three physical properties that are par-
In studies carried out in India, it was shown that the
ticularly relevant to its carbon footprint:
burning of LPG emits far less greenhouse gases
i. In comparison to most hydrocarbons, LPG has compared to other fossil fuels and non-renewable
a low carbon to hydrogen ratio, which means biomass fuels. Cooking with LPG at the household
that it generates lower amounts of CO2 per level emits 126 g/MJ CO2 and 0.002 g/MJ N2O,
amount of heat produced. while for the same amount of energy wood fuel
emits respectively 305g and 0.018 g of CO2 and
ii. While there is a degree of natural variation in N2O. Hence, the burning of LPG produces far less
heating values due to the specific proportions greenhouse gases compared to non-renewable
of butane and propane within a particular wood (Figure 3.4).
sample of LPG, it nevertheless has a comparably
high heating value, meaning it contains more In addition, LPG provides a safe alternative to
energy per kg than most competing fuels. traditional for household cooking. As highlighted
Figure 3.4. Co-benefits for climate and health of changes in household fuels in India
(For comparison, the health-based standard for particle air pollution is about 50 μg/m3. The arrow
illustrates a shift from crop residues to LPG for one household, which would decrease indoor air
pollution by 95 percent and greenhouse gas emissions by 75 percent)
Source: Kirk R. Smith et al. (2005)
20 The use of liquefied petroleum gas (LPG) in SudanTable 3.3. Airborne emissions for household cooking, India (g/MJ delivered energy)
Fuel CO2 N2O
LPG 126 0.002
Biogas 144 0.002
Kerosene 138 0.002
Wood fuel 305 0.018
Crop residues 565 0.028
Charcoal 710 0.018
Dung cake 876 0.022
Source: UNDP/World LP Gas Association (2003)
in Table 3.3 above, LPG emissions of the main
noxious gases are the lowest of all other cooking
fuels including biogas.
As a low carbon and particulate energy able to
replace less clean sources, LPG can contribute
to improving quality of life by helping to reduce
the social cost of energy use on the Sudanese
population.
Due to its characteristics LPG provides a useful
tool for national policy makers and international
actors. LPG is portable, multi-purpose and has a
high volume-to-energy yield ratio. As a result it can
rapidly be introduced in the aftermath of natural
disasters and humanitarian crises where local
availability of energy for heating, cooking or power
generation is required.
LPG can also play an important role in economic
and social development as it allows for activity
and development to take place throughout
Sudan, even in remote areas characterized by
low population density. In rural areas without
reliable access to petroleum products, LPG
serves as a reliable back-up to renewable energy
sources, thereby facilitating decentralized energy
production and accelerating the proliferation of
renewable technology.
The use of liquefied petroleum gas (LPG) in Sudan 214. Sudan’s energy policy
4.1. Key stakeholders in the into one ministry and then again in 2010 split into
three ministries (Oil, Mining and Electricity). Similarly,
energy sector the FNC, which was formerly under the Ministry of
Agriculture, is now under the Ministry of Environment,
A number of national institutions in Sudan have
Forestry and Physical Development.
mandates related to the energy sector. These are
summarised in Table 4.1 below. The main stakehold- In addition to the agencies listed above, the fol-
ers responsible for policy making as concerns LPG lowing bodies are also responsible for regulatory
are the Ministry of Petroleum and the FNC. activities relevant to the sector.
Over the past 10 years, the energy sector has seen • General Administration for Environment and
several changes with the creation of new ministries, Safety: This regulatory body within the petro-
and shifts of functions between existing ministries. As leum sector deals with environmental issues in
an example, the Ministry of Energy and Mining was the oil fields (explorations, refineries, transporta-
split in two ministries (Oil and Electricity), regrouped tion activities and legislations).
Table 4.1. Institutional structure of the energy sector in Sudan
Function Key Institution
Policy and Ministry of Petroleum (General Directorate of Energy Affairs)
Planning Ministry of Electricity and Dams
Forests National Corporation (Ministry of Environment, Forestry and Physical
Development)
Ministry of Finance and National Economy
National Council for Strategic Plan
Sudan Petroleum Corporation (Ministry of Petroleum)
Pipeline Companies and Transport (Ministry of Petroleum)
Khartoum Refinery (Ministry of Petroleum)
Energy Petroleum Exploration Companies
Supply National Electricity Corporation (Ministry of Electricity and Dams), now divided into
several companies
Forests National Corporation
Private sector companies and enterprises
Energy Research Institute, ERI, – National Centre for Research, Ministry of Science
and Technology
Training, Forestry Research Institute
Khartoum University and the Sudan University for Science and Technology – Ministry
Research and
of High Education
Development Sudan Academy for Science and Technology – Ministry of Science and Technology
General Directorate of Energy Affairs (responsible for undertaking National Energy
Assessments, planning, and policy)
Energy/ Higher Council for Environment and Natural Resources – Ministry of Environment,
Environment Forests and Physical Development
Protection/
Civil Defence Department – Ministry of interior Affairs
security
Source: Own table
22 The use of liquefied petroleum gas (LPG) in Sudan• FNC: Responsible for non-commercial fuel i.e. NEC: The NEC is responsible for electricity genera-
wood fuel resources. tion, transmission and distribution in Sudan. One of
NEC’s objectives is to diversify its electricity supply
• Higher Council for Environment and Natural options through greater use of renewable energy.
Resources: Operating within the Ministry of
Environment, HCENR is charged with regulatory SPC: The SPC is responsible for petroleum explora-
issues in environmental matters, including those tion, production, refining, transportation, marketing,
related to energy. financing, planning, arranging licenses, supervision
and new legislation. SPC is composed of several
departments, each responsible for specific man-
4.1.1 Ministry of Petroleum
date within the wider petroleum sector.
The Ministry of Petroleum consists of a number of
corporations and companies, the main ones being: The Nile Petroleum Company, (NPC) operating
under the Ministry of Petroleum, is responsible for
• The Sudanese Petroleum Corporation which is marketing petroleum products. The NPC has an
responsible for exploring, producing, refining, integrated system of storage and delivery from its
transporting, marketing, financing, planning, main depots in Al-Jaili, Al-Shajara, Port Sudan and
arranging licenses, supervision and the devel- Wad Medani. The NPC is responsible of supplying
opment of new legislation. This corporation petroleum products to a number of sectors includ-
is composed of several departments, each ing: Electricity Stations, Sugar Factories, Irrigated and
responsible for specific mandate within the Mechanical Agricultural Sectors, Irrigation Institutes,
Roads and Bridges, Service Sectors, Security and
wider petroleum sector.
various development projects. In addition to its
• Controlling more than 50 per cent of the major depots, ten regional depots (Port Sudan,
Medani, Atbara, Sennar, Kassala, Gedarif, Rabak,
market, the Nile Petroleum Company is con-
Al-Fasher, Nyala, Dongola and Al-Obeid) are distrib-
sidered to be the sole arm for the Ministry of
uted across Sudan to deliver gas cylinders.
Petroleum with the mandate of distributing and
marketing petroleum products. The Company
In conformity with the government’s directives at
is responsible of supplying petroleum products
naturalizing LPG services as an alternative for char-
to important strategic sectors like electricity sta-
coal and wood as a source of domestic energy,
tions, sugar factories, irrigated and mechanical
the NPC distributes gas tanks for bakeries free of
agricultural sectors, irrigation institutes, roads
charge, and provides the delivery service from
and bridges, service sectors, security and the its main depots to assist in providing clean and
various development projects in progress. healthy bread for the public. This comes through
commercial agreements and coordination with
4.1.2 Civil Defence the major companies working in the marketing
and distribution of wheat flour such as Sayga and
While Civil Defence has no engagement on Wheata Companies.
biomass fuels production and use, the depart-
ment establishes safety measures for the storage, FNC: The FNC is empowered to exercise technical
transportation, handling and end use facilities supervision over all forests throughout the country
of petroleum products. Actors in the sector must and entitled to issuing directives or take measures
obtain a license from Sudan Civil Defence prior to for protection and management of reserved and
establishing any petroleum product service facility. unreserved forests across the country. At the federal
level, FNC is the sole agency responsible of manag-
4.1.3 Public corporations ing the forestry sector. Through its state offices, FNC
manages the production, supply and marketing of
The energy sector is dominated by three public firewood and charcoal all over the country.
corporations: the FNC, Sudanese Petroleum Corpo-
ration (SPC) and the National Electricity Corporation In the early 1990s, the FNC launched its Gabatgaz
(NEC). Project which aimed at facilitating households’
The use of liquefied petroleum gas (LPG) in Sudan 23Brick kilns on the banks of the Blue Nile, in El Gezira state. The brick-making industry is a major market for
fuelwood.
accessibility to LPG and its appliances. This is dis- 4.2. Energy policy
cussed in detail below at section 5.1)
The Ministry of Petroleum has the responsibility for
4.1.4 Civil society organizations formulating and implementing the energy policies
in the country. The government formulates its energy
A number of NGOs concerned with environmental policies by using a participatory process between
conservation, food security and livelihoods have relevant ministries and stakeholders for each policy
implemented LPG promotion projects in different field e.g. oil, electricity. The national energy policy
parts of the country. These include: sets the direction for the development of the energy
sector in order to meet national development
• Practical Action in Eastern Sudan, PA, (Kassala goals in a sustainable manner. Through its General
and Gedaref States) Directorate of Energy Affairs, the Ministry of Energy
and Mining is responsible for:
• Sudanese Environment Conservation Society,
SECS, (Khartoum State) • Conducting National Energy Assessments;
• Formulating and implementing the strategic
• Plan Sudan (Kassala State)
national energy planning issues;
• Sustainable Action Group (IDP camps in North
• Promoting and disseminating renewable
Darfur) energy technologies; and
These initiatives are discussed in greater detail in • Conducting studies for conservation and envi-
Section 5 below. ronmental impacts issues.
24 The use of liquefied petroleum gas (LPG) in SudanThe First National Energy Assessment (1981) was • To conserve the environment through efficient
the first policy endeavour towards understanding and optimal utilization of local resources,
and planning the energy sector in Sudan. The especially forests, and to promote tree planting
main output was the first National Energy Plan, activities. The solution of the energy problem
1983, which placed significant emphasis on the should not be at the cost of deterioration of
environmental crisis facing the country given the natural resources.
high dependence on biomass energy. The main
policy directives were: • To conserve all energy types so as to generate
the highest economic value for energy and
• Improving the efficiency of biomass fuels con- minimize the cost to the economy.
version, particularly in the household sector
• To develop the energy sector institutions to
• Development of alternative fuels, mainly tar- ensure coordination between consumers and
geting the conversion of biomass residues into producers.
convenient fuels for the household sector
• To develop and promote local and/ or adapted
• Creation of new biomass resources – tree energy technologies particularly in the field of
plantations, and maximum use of available renewable energy resources.
resources, particularly woody biomass resulting
from mechanized farms clearing operations • To train qualified and adequate staff at all levels
to facilitate the development of energy sector.
• Development and dissemination of renewable
energy technologies use, particularly solar The government energy policy has the following
energy objectives for the energy sector, with emphasis on
energy security through:
In the wake of the National Energy Plan, several
projects were launched with international support • Efficient energy supply in an environmentally
aimed at realizing the above policy objectives. sustainable manner at feasible but socially
However, by the end of 1992 almost all of these acceptable prices;
projects had come to a standstill, largely due to
lack of funding. • De-monopolization and liberalization of the
energy market;
The Second National Energy Assessment (2001) did
not formulate a National Energy Plan. Oil produc- • Fostering competition in the energy market
tion and export had created new priorities in the where possible through privatization;
energy sector and all efforts were directed towards
more exploration with the objective of increasing • Establishing a regulatory framework; and
oil production and export. Following the inaugura-
tion of two oil refineries at Al Obeid and Khartoum, • Addressing market and institutional failures to
the country became energy self-sufficient, and an promote energy efficiency and renewable
exporter of petroleum products. energy resources and to protect the environ-
ment.
Given the changing energy environment, a revised
energy policy was articulated. The energy policy In realization of the above policy the prices of
within the overall development policy (as articu- petroleum products were subsidised at levels below
lated by the National Strategic Plan) is as follows prevailing international prices. Indicatively, at the
(NCSP, 2006): inauguration of the Khartoum refinery in 2001,
the price of LPG for domestic consumption was
• To provide an adequate and reliable supply of reduced by 50 percent and has remained fixed
energy from local resources to support sustain- since. In addition, LPG equipment was exempted
able development. from import duty tax.
The use of liquefied petroleum gas (LPG) in Sudan 254.3. Government subsidies for Promotion efforts to achieve widespread use of
LPG by the household sector were mainly directed
LPG towards facilitating households’ access to LPG
appliances (cylinders and gas burners). The main
As one of its components, the 2001 National Energy
Policy sought to encourage the widespread use of target was the formal sector, where institutions were
LPG by the household sector. This was done through: directed to facilitate employees’ access to LPG
appliances. Institutions purchased the LPG equip-
• Reduction of LPG price by 50 percent at refinery ment and employees repaid the cost through
gate; monthly installments from their salaries.
• Exemption of LPG equipment from import duty As a consequence of the above policy and dissem-
tax (although VAT applied); ination efforts the consumption of LPG increased
tremendously (Figures 4.1). The low price of LPG
• Commitment for consistent and sustainable relative to other petroleum products attracted other
supply of LPG for the domestic consumption; sectors, including the automobile and industrial
sectors, to switch to LPG use instead of gasoline
• Measures to ensure LPG price stability.
and fuel oil. However, faced with a steady growth
The government subsidy scheme for LPG did not of LPG consumption by the domestic sector, the
however involve any awareness campaign or government banned distribution for the automo-
promotional activity in order to further encourage bile sector, and stopped new authorizations for the
households to switch to LPG use instead of wood- industrial sector (2008). In addition, industries which
fuel. In addition, LPG subsidies are maintained only had already converted to LPG use were subject to
for the household and commercial/services sectors, pay a premium price of SDG 1,000 per tonne. For
and for bakeries, which together have been identi- the household sector, the price was maintained
fied as key biofuel users in need of intervention. at SDG 960 per tonne. Export of LPG was also
Figure 4.1. Development of LPG production, consumption and export, 2000-2006 (‘000 mt)
Source: Ministry of Energy and Mining, SPC- website
26 The use of liquefied petroleum gas (LPG) in SudanYou can also read