Quality Account 2019/20 - Our commitment to quality excellence - NHS
←
→
Page content transcription
If your browser does not render page correctly, please read the page content below
Quality Account
 2019/20

Our commitment to quality
excellence
Contents
Section/Chapter                                                                           Page

Part 1: Statement on Quality

1.1       Statement on quality from the Chief Executive                                       3

1.2       Introduction to the Quality Account 2019/20                                         4

1.3       Moorfields Hospital approach to improving quality                                   4

Part 2: Priorities for improvement and statements of assurance from the Board

2.1- Progress with 2019/20 quality priorities                                                 6
2.2- Core Clinical outcomes                                                                   14
2.3- Performance against key local indicators in 2019/20                                      16
2.4- Performance against 2019/20 national performance and core indicators                     19
      -   Referral to treatment (18 weeks) performance
      -   data quality
2.4.1- National core indicators                                                               23
      -   Readmission
      -   Family and friends test for patients
      -   Family and friends test for staff
      -   Venous Thrombo Embolism (VTE)
      -   Patient safety incidents (PSIs) including duty of candour (DOC) and learning from
          deaths
3- Statements of assurance from the Board                                                     37
3.1- Priorities for improvement for 2020/21                                                   48
3.2- Key indicators for 2020-21                                                               56

Part 3: Statements from commissioners, local Health Watch and Overview and Scrutiny
committee

      -   Statements from commissioners, local Health watch and Overview and Scrutiny
          Committee                                                                   60

      -   Statement of Directors’ responsibilities                                            61

      -   Limited assurance statement from external auditors                                  63

Page | 2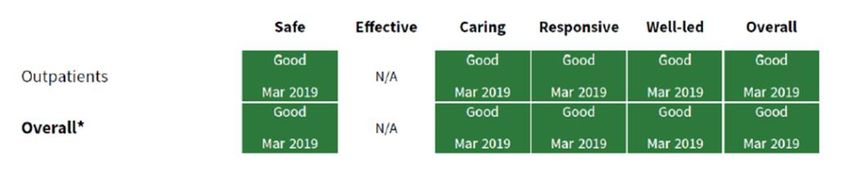
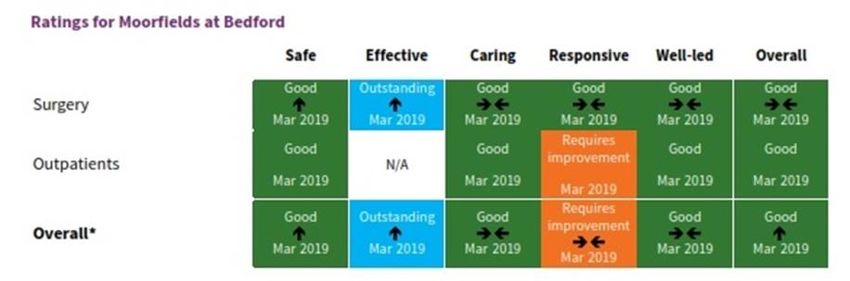
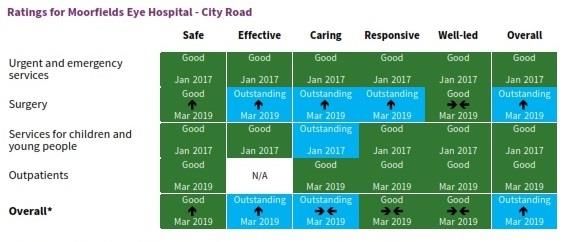
Part 1: Statement on quality
1.1 Statement on quality from the Chief Executive

   There are so many things that make me proud to work at Moorfields. Again during 2020/21
   I have been particularly struck by the extensive achievements, dedication and
   professionalism of our staff. We strive to provide the best quality care and we have again
   been recognised nationally and internationally for the high quality, safety and effectiveness
   of our services and like any true learning organisation we remain committed to do more to
   continually improve. Everything we do embodies our values of being caring, organized,
   excellent and inclusive. Despite these important achievements, what is likely to remain at
   the forefront of many people’s minds is the coronavirus pandemic. Whilst the outstanding
   dedication and commitment of our colleagues in response to the pandemic cannot be
   overstated, I would also like to pay tribute to their leadership and achievements throughout
   the year.

   This quality report sets out our approach to improving quality, safety and our patient
   experiences. It reflects on what we did and how we performed in 2019/20, and sets out our
   ambitions and aspirations for the year ahead. 2019/20 has been an important year for
   Moorfields which included a successful CQC inspection report, improving on our last
   inspection of 2016. The trust has been given a rating of ‘Good’ overall with the CQC rating
   the trust ‘Outstanding’ for being effective. City Road services were rated ‘Outstanding’
   overall which is a great achievement. Surgical services at City Road were also rated
   ‘Outstanding‘, testament to our surgical services being regarded internationally as world
   leading in many sub-specialty areas, and we remained ‘Outstanding‘ for ‘caring’ at City
   Road. All of our services were rated ‘Good’ for ‘safe’. Importantly, and in recognition of the
   hard work of the teams, Bedford and St George’s improved from ‘Requires improvement’ to
   ‘Good’ overall. The trust’s clinical outcomes and safety record remains excellent, with
   ophthalmic clinical outcome performance amongst the best in the world.

   In 2018 we launched our ‘Patient Participation Strategy’ following a period of consultation
   with our staff, stakeholders and most importantly, our patients. We have launched our
   quality governance framework which is a tool for measuring successful implementation of
   our quality strategy. This will help us to further embed quality within the organisation and in
   our journey from ‘Good’ to ‘Outstanding’.

   Our quality account reflects our quality performance in 2019/20. Overall we have made
   good progress with most of our indicators. In particular performance against national
   targets remains consistently excellent. We have made very good progress with improving
   use of the WHO surgical safety checklist and our team culture supporting this and we
   achieved the CQUIN targets for this objective. In 2020/21 we will be rolling out checklists in
   other areas where invasive procedures take place.

   We remain committed to being a learning organisation, to make sure we learn from good
   and less good events which can occur across the organisation. As we continue this
   process, it is pleasing to see the contribution our patient and carer forum has made to the
   development of our quality priorities for 2020/21.

   To the best of my knowledge the information in the document is accurate subject to the
   limitations explained later in this report.

   David Probert, Chief Executive
Page | 3
1.2 Introduction to the Quality Account 2019/20

Quality Accounts help NHS trusts improve public accountability for the quality of care they
provide. The Quality Account is a key mechanism to provide demonstrable evidence of
improving the quality of the trust’s services. The Quality Account also describes the
organisation’s quality priorities and aims for the coming year.

The Quality Account incorporates all the requirements of the Quality Accounts Regulations as
well as those of NHS Improvement’s (NHSI) additional reporting requirements. The purpose of
the account is to:

•     promote quality improvement across the NHS

•     increase public accountability

•     enable the trust to review its services

•     demonstrate what improvements are planned

•     respond and involve external stakeholders’ to gain their feedback including patients and
      the public

Our Quality Account provides an appraisal of achievements against our priorities and goals set
for 2019/20.

At Moorfields the quality of the services provided has always been at the heart of decisions
taken by the Board. Our quality strategy is a call to action for everyone to make a difference
and be part of the Moorfields journey from Good to Outstanding. Underpinned by the three key
drivers for quality, the trust’s ‘Quality Structure’ creates robust arrangements for driving
improvement and providing a clear and accountable process for scrutiny and assurance for
delivery of the Quality Account.

1.3      Moorfields Hospital approach to improving quality

At Moorfields our core belief is ‘people’s sight matters’ and our purpose is ‘working together to
discover, develop and deliver the best eye care’. We define quality as ‘providing safe care,
outstanding outcomes, and positive experience and involvement for all our patients’.

Quality is our core philosophy, and at the heart of every decision we make. In a time of rapid
technological advances, Moorfields’ expertise, reputation and network places us in a unique
position to lead the way in delivering quality eye care. We want to harness all of our skills and
enthusiasm for learning and sharing to deliver excellent clinical care and world-leading
research, so that we deliver the outstanding quality our patients deserve, and to truly live up to
our name as a world-leading organisation.

Our priorities are consistent with the objectives set out in our quality strategy and form an
important part of its implementation. It is both ambitious and aspirational by design.
Throughout the document, Moorfields sets out its priorities under the three well established
headings of Patient Safety, Patient Experience and Clinical Effectiveness.

The events following COVID 19 pandemic have had an impact on the majority of the KPIs both
locally and nationally within this report. This includes 2020/21 quality priorities where the
organisation may need to change its priorities as a result of our COVID 19 recovery response.
Moorfields will continue following advice and guidance from NHS Improvement and NHS
England to ensure patients continue to receive high quality care. NHS Improvement/NHS
Page | 4
England has confirmed that NHS providers are no longer expected to obtain assurance from
their external auditor on their quality account /quality report for 2019/20.

The Quality and Safety Committee on behalf of the Board takes responsibility for overseeing
the development and delivery of the Quality Account and quality priorities. For any information
on this quality account report please contact Niloufar Hajilou, Head of Quality and Safety at
niloufar.hajilou@nhs.net.

Page | 5
Part 2: Priorities for improvement and statements of assurance from
the Board
2.1 Progress with 2019/20 priorities
We set ambitious priorities to drive high quality care and respond to the challenge of meeting
the health needs of our diverse community. Moorfields identified six priority areas for 2019/20.
We developed these with patients, staff, and host commissioners, NHS Islington Clinical
Commissioning group and supported by the membership council. Trust’s governors have also
considered the contents of the quality report and were supportive of the quality priorities. Our
Patient and Carer Forum contributed their views to shaping the quality priorities and the staff
were also consulted through a staff survey. The rationale behind the priorities was based on
the progress made with the 2018/19 priorities as well as other key drivers such as staff and
patient feedback. The quality priorities were approved by the trust board on 4th April 2019.The
identified six priorities were based on three domains of quality: Patient Safety, Clinical
Effectiveness and Patient Experience.
Having set ambitious aims the trust has demonstrated progress against all targets although full
achievement has not always been possible. As a result, some priorities will continue into
2020/21, please see a list of 2020/21 priorities from page 53 onwards.
Summary of the 2019/20 quality priorities:
Domain No Description Priority continued from
2018/19
Safety 1 To support safer care for patients
undergoing invasive procedures
through developing LOCSSIPs
according to National
recommendations (NATSSIPs)
2 Ensure our quality governance New
framework is implemented and
embedded across the organisation.
3 Ensure that evidence of lessons New
learnt and changes to practice are
captured, recorded and disseminated
in a systematic way
Effectiveness 4 Embed a culture that supports New
ongoing changes to practice by
developing quality improvement
capabilities
Patient 5 To involve and engage our patients New
Experience across the organisation in true
participation activities including in
service reviews and developments
6 To ensure that from a patient New
perspective appointments
management is effective, efficient and
responsive
Page | 6Quality Domain: Safety
Priority 1: To support safer care for patients undergoing invasive procedures through
developing LOCSSIPs according to National recommendations (NATSSIPs)
Our priority for 19/20 1.1 Quarter 1: Identify all areas within the trust where invasive
is to (see data table procedures are performed.
below) :
1.2 Quarter 1 and 2: Develop a self- assessment form tool against
NatSSIPs
1.3 Quarter 4: Set up a programme of regular audits on NatSSIPs
compliance due to commence in 2020/21
What did we achieve to date?
Identification of areas in which invasive procedures are performed. This was informed by a
procedure list provided by the performance and information team.
Completion of a LocSSIP review and subsequent audit of:
o Intravitreal injections (all sites that perform injections) to ensure that practice is safe and
consistent across the whole organisation. The audit was undertaken in Q3 and the
report was shared in January 2020. An action plan is being developed and this has
been shared throughout the organisation
o Review of refractive laser process (private and NHS at City Road) to ensure that
practice is safe and consistent for all patients. An audit was completed by the service
and the report was shared with relevant teams in 2019/20.
o The head of clinical governance created an audit tool for the review of LocSSIP
compliance, which can be adapted for the review of other invasive procedures.
What will we do in 2020-21 to continue with progress?
Good progress has been made with this priority and due to the geographical spread of the
organisation and the number of invasive procedures taking place the trust has decided to
continue with this priority in 2020/21. This will ensure robust processes are in place to ensure
invasive procedures take place according to best practice and national guidance.
Page | 7Quality Domain: Safety
Priority 2: Ensure our quality governance framework is implemented and embedded across
the organisation.
Our priority for 2.1 Q1: Use of standardised minimum data sets in all quality forums
2019/20 has 2.2 Q1&Q2: All relevant quality dashboard users to have received Qliksense
been to: training so it can be used operationally to inform decision making,
2.3 Q1&Q2: Regular review of quality dashboards at divisional quality
forums (Q1 &2)
2.4 Q4: Existence of divisional exception reports for the divisional executive
performance review
What did we achieve to date?
The Quality Governance Framework (QGF) launched in April 2019 clearly sets the
expectations for divisions in ensuring standardisation of information shared within the quality
forums. This includes existence of minimum quality agenda items:
A standard agenda item has been developed and used by all divisions in their quality
forums.
The central quality team in collaboration with the performance and information (P&I)
team and quality partners reviewed and further developed the quality dashboards to
ensure relevance and accuracy of data within the dashboards. This review will continue
as dashboards are used to support the divisions in review and scrutiny of quality KPIs.
Central quality team and divisional quality partners have received Qliksense and quality
dashboard training.
The quality partners have been providing monthly reports to divisional boards about
relevant KPIs including minimum standardised agendas. Further scrutiny is undertaken
by the director of nursing and allied health care professionals and chief operating
officer at monthly divisional executive performance reviews.
A divisional self-assessment of implementation of the QGF was undertaken by
divisions to ensure gaps (if any) were highlighted and appropriate mitigations were in
place to support continuous compliance with the framework. Feedback about the self-
assessment has been very successful and will support the organisation in its journey to
outstanding in ensuring quality remains high priority across the networks.
What will we do in 2020-21 to continue with progress?
This priority has been achieved fully and will continue to be embedded across the organisation.
We will support use of the quality dashboards within the divisions by continuously developing
them to ensure relevancy of quality KPIs. We will further develop the QGF in response to the
national recommendations following implementation of national safety strategy.
Page | 8Quality Domain: Clinical Effectiveness
Priority 3: Ensure that evidence of lessons learnt and changes to practice are captured,
recorded and disseminated in a systematic way
Our priority 3.1 Existence of divisional newsletters to include learning from audits, SIs,
for 2019/20 incidents, complaints and PALs
has been to: 3.2 Timely review of risk registers at divisional quality forums
3.3 Programme of planned divisional and local walkabouts to cover all sites
and departments
3.4 Sharing learning and completing actions through the central data base
(Safeguard)
The central quality and safety team have been working with the divisions to ensure learning
from events continues to be high on the agenda. This has been supported by the QGF where
learning is a key item for discussion at the quality forums.
Development of a trust learning framework, which describes the opportunities that exist
within the trust for all staff, across the whole network and in all locations, to learn from
events that have resulted in harm as well as those events that have gone well.
Learning is shared through various methods such as:
o The LIFEline bulletin which is produced by the central quality team to share learning
specifically associated with serious incidents (SIs) or events (e.g. incidents, claims,
complaints) that have been discussed at the weekly SI panel;
o A quarterly central quality and safety team bulletin which includes shared learning from
events, in particular incidents, across the organisation;
o A quarterly clinical audit newsletter has been developed by the clinical audit team;
o The 3 NHS clinical divisions now have a newsletter, which is shared with divisional
staff. There is also a newsletter in the commercial division based in the United Arab
Emirates.
All risk registers are now electronic and managed through Safeguard system. The
divisions review their risk registers on a monthly basis at the quality forums and divisional
boards where relevant.
An annual programme of executive (listening, learning, and sharing) walkabouts was
developed. These take place over a 12-month rolling programme; executives have
planned their walkabouts using a multidisciplinary/peer review approach. These
walkabouts ensure executive visibility as well as supporting staff to raise concerns as well
as ideas for improvement and sharing areas of good practice.
The action module on Safeguard is now being actively used by the divisions, as is the
facility to be able to record learning. The learning that is highlighted within individual
records is used by the central quality team to inform the quarterly quality and safety report
which is presented to a sub-committee of the trust board.
A learning framework containing the principles of sharing learning across all our sites has
been developed and is going through staff consultation. This will include a hub to allow
staff to share learning in a safe environment.
What will we do in 2020-21 to continue with progress?
This priority has been achieved for 2019/20and to ensure learning is embedded across
the organisation we have decided to continue this priority into 2020/21. This priority is a
key element of our journey to excellence and implementation of the learning framework
will be a key objective in 2020/21.
Page | 9Quality Domain: Clinical Effectiveness
Priority 4: Embed a culture that supports ongoing changes to practice by developing quality
improvement capabilities
Our priority 4.1 All divisions to have identified quality service improvement champions
for 2019/20 4.2 All quality service improvement champions to have received training on
is to: QSIR training
4.3 All divisions to be working on 2-3 QI projects as identified by local service
improvement priorities
4.4 All divisions to be engaged with trust wide service improvement projects
What did we achieve to date?
The trust’s Quality Service Improvement & Sustainability priorities for 2019-2020 were:
Develop a trust culture and capability for change and improvement by QSIR training and
project delivery
Provide assurance and support the development of schemes to deliver the cost
improvement plan and embedding a PMO approach to CIP programme
Development and implementation of sub-specialty strategies for new models of care
Ongoing improvement and standardisation of administration processes.
Some of the key achievements of the 2019-20 programme include:
QSIR Fundamentals - 51 staff trained and will continue in the new financial year
QSIR Practitioner – 28 trained to date, this will continue in 2020
Staff accredited to teach – we currently have 3 staff accredited, with 3 more scheduled to
complete their assessment in April 2020
The initial feedback on the training is very positive, with 90.5% of those who have completed
their introductory training rating the day as good or very good and 100% of participants said
that they would recommend the training to a colleague.
In addition, 3 members of staff from both QSIS team and City Road Division, qualified in the
NHSI Demand and Capacity train the trainer programme, in July 2019. They are now
supporting the modelling of services to help us effectively plan our capacity and support
transformation of how we deliver our services.
Service Improvement
High volume cataract lists started; now running at City Road, Northwick Park & St Ann’s.
Plan to deliver lists in the South division.
Glaucoma gap analysis completed: following work supported by QSIS 25% of Glaucoma
patients in City Road are managed in non-medically led pathways. Progress is being
monitored against an action plan to support the South & North divisions, site by site to
embed non-medically led care.
In addition, 3 members of staff from both QSIS team and City Road Division, qualified in
the NHSI Demand and Capacity train the trainer programme, in July 2019. They are now
supporting the modelling of services to help us effectively plan our capacity and support
transformation of how we deliver our services.
High volume cataract lists started; now running at City Road, Northwick Park & St Ann’s.
Plan to deliver lists in the South division.
Glaucoma gap analysis completed: following work supported by QSIS 25% of Glaucoma
patients in City Road are managed in non-medically led pathways. Progress is being
Page | 10monitored against an action plan to support the South & North divisions, site by site to
embed non-medically led care.
All divisions have enrolled relevant staff including quality partners to be trained in QSIR
methodology (fundamentals and practitioner). Regular dates are available monthly and
continue into 2020/21.
All divisions are engaged in the trust wide service improvement projects:
- Cataract: in progress in City Road, North (St Ann’s, Northwick Park) & South (St
George’s, Croydon)
- Outpatient: in progress in City Road, North (Northwick Park, Mile End, Barking) & South
(Croydon, St George’s)
- A&E/UCC/ Ricin progress in City Road, North (Bedford) & South (St George’s &
Croydon)
- Clinical admin: in progress in all divisions with engagement from all at fortnightly clinical
admin transformation group meetings.
The QSIS team has continued to work in partnership with operational colleagues and
commissioners in Croydon and as part of NCL STP to support ophthalmology pathway
transformation work. This is to ensure both that change and improvement are supported
at pace and that any change implemented in one area of the trust is in line with trust-wide
standards and strategy.
What will we do in 2020-21 to continue with progress?
The objectives set within this priority has been achieved and will continue in 2020/21. Progress
is monitored through bimonthly QSIS meetings. Quality Improvement project updates are also
provided at Clinical Governance Committee which will support shared learning across all sites
and services.
Page | 11Quality Domain: Patient experience
Priority 5: To involve and engage our patients across the organisation in true participation
activities including in service reviews and developments
Our priority for 5.1 Q2&3 All major network sites and City Road services (16) will have
19/20 has been involved/engaged patients in at least one patient participation activity
to: during 2019-20. These are: City Road: External Disease, City Road:
Glaucoma, City Road: Medical Retina, City Road: Optometry, City
Road: Paediatrics, City Road: Uveitis, City Road: Vitreo-Retinal,
Bedford, Darent Valley (Ebsfleet), Ealing, Northwick Park, St Ann's,
Croydon, St George's, City Road Day Care, Accident and Emergency
5.2 Q4: All network sites and City Road services (as above) will have
established a patient reference group for their network site or service
by the end of 2019/20, Q4
5.3 Q2, Q3 and Q4: Divisions will establish two local service patient
experience KPIs in Q1 and measure and report them at the end of Q4
What did we achieve to date?
Patient participation and reference groups have been run in eleven network sites and city
road services during quarter three. These have included patient support groups, in your
shoes sessions and education forums. Several have engaged patients looking at the
introduction of new patient pathways and new ways of working. Some sites and services not
included in 5.1 have undertaken patient participation sessions and some such as A&E and
Moorfields North West have yet to establish groups. There have been 16 patient participation
events during 2019/20 across the trust with seven planned for the first two quarters of
2020/21.
The reference groups will be established as part of the participation events noted at 5.1.
Patient will be invited to return during 2020/21.
Moorfields North have established two criteria:
1. Reducing the number of cancelled out-patient appointments by end of Q4.
2. Reduction of cancelation of same day, day surgery patients by end of Q4
This measure is deferred due to Covid-19
Moorfields City Road have established two criteria:
1. A project to have letters normally written to the GP and copied to the patient changed, so
that letters are written to patients and copied to GPs. This work has not been implemented
although work is currently being undertaken by the QSIS team towards this. Patient focus
groups have been held to determine the format and content of these letters. A trial is
anticipated in the Glaucoma service.
2. To reduce, by end of Q4, the number of PALS concerns that convert to formal
complaints. This measure was discontinued due to the negligible number of complaints that
had previously been PALS concerns
Moorfelds South are working on establishing their measures following establishment of the
management team.
What will we do in 2020-21 to continue with progress?
As per 5.2, network sites and City Road services will establish reference groups to review the
work undertaken this year and those sites etc. that have yet to hold events will be encouraged
to do so and this may require the formation of ‘virtual’ patient and carer reference groups. One
of these has been held already.
Page | 12The letters project will continue into 2020/21. Work toward the reduction in surgery
cancellations in Moorfields North will continue.
Quality Domain: Patient experience
Priority 6: To ensure that from a patient perspective appointments management is effective,
efficient and responsive
Our priority 6.1 Set PALS key performance measures by end of Q2, 2019/20
for 19/20 has
been to: 6.2 KPI for PALS and Complaints numbers.
- A) 20% Reduction in the number of PALS enquiries around CR
appointments management by Q4.
-
- B) 50% Reduction in the number of complaints (all sites)
regarding appointments management by Q4 compared to
2018/19
- C) Establishment of patient portal or email facility by the end of
Q4, 2019/20.
6.3 City Road, MEH North and South divisions to show a reduction
of hospital cancelled appointments against a set KPI by end of
Q4, 2019/20
A) 100% reduction in the number of patients waiting over 52
weeks on an active RTT pathway by the end of Q2.
B) Reduction in the number of hospital patient cancelled
appointments to fewer than 3%.
C) Reduction in the number of patients whose surgery is
cancelled on the day and are rebooked over 28 days by the end
of Q4 to zero tolerance.
6.4 Access division to demonstrate telephone answering response
times and returned calls meet established criteria by the end of
Q3, 2019/20
- Average call waiting times to be reduced to less than 3 minutes
by the end of Q4
- Reduction in the number of abandoned calls per day by the end
of Q4 to 20%
What did we achieve to date?
Progress has been made with some of the key measurable and the organisation will
continue measuring progress with this priority in 2020/21. Please see a list of 2020/21
priorities from pages 53 onwards.
KPI for appointment, PALS and Complaints were identified as above
Reduction in the number of complaints by 48% against a target of 50%.
Potential providers for Patient Portal have been identified and proposals presented to
key stakeholders. This work has been impacted by COVID 19 pandemic and will
continue in 2020/21.
The trust has not declared a 52 week breach this financial year.
Average call wait times were 2.35 at the end of March 2020 and has remained
consistently below 03:00 minutes.
Number of abandoned calls for March was 18% reaching the set target.
Page | 13What will we do in 2020-21 to continue with progress?
The organisation will continue monitoring progress with this priority in 2020/21 as well as
specific priority to improve response time to patient calls. Continued focus on our
responsiveness to our patients particularly in light of COVID-19 response to focus on call wait
times and abandoned calls. Main focus will be on managing our large volume of cancelled
patients to ensure any risks are mitigated as much as possible.
2.2 Core clinical outcomes
Progress in 2019/20
The trust’s performance against the core outcome standards demonstrates excellent clinical
care, with almost every standard being met and many being far exceeded. The complete core
outcome data is tabulated below. Of particular note is that the majority of outcomes are for all
relevant patients across the trust over a full year. This increases the robustness of the data
when compared to sample audits. All services with modules for collecting electronic patient
records (EPR) should be commended for their increasing use of EPR which facilitates analysis
of larger amounts of data than is possible manually. This culture change is allowing more
comprehensive data analysis. The EPR system, linked in with performance and information in
many cases, allows generation of core clinical outcomes, at the ‘touch of a button’ for Cataract,
Medical Retina, Accident and Emergency, Cornea and Refractive services. Other services,
such as glaucoma, are looking to engage with EPR development to make routine analysis of
clinical outcome data possible electronically too.
The external diseases service previously circumvented delay in receiving corneal graft failure
rates from the NHS blood and transplant services by generating this data internally. This was
possible through the establishment of a specific post-graft follow-up clinic with collaborative
working to set up a database for measuring outcomes on these patients. Now Moorfields
provides the national organisation with the graft survival data prospectively rather than waiting
for retrospective analysis from them. This year, the core outcomes for corneal grafts are
compared with the national data from the previous year. The only core outcome in this section
which was not achieved was the survival of penetrating keratoplasties at Moorfields at 88%
compared to the national rate for the previous year of 89%. This reflects the fact that
Moorfields performs penetrating keratoplasties on a greater percentage of complex, high-risk
for failure cases and so is not a cause for concern.
The serious complications of strabismus surgery for every such operation across the trust was
0.70% (6 out of 852), slightly higher than previous years and the standard, but not significantly
different statistically (the 95% confidence interval for the value is 0.1%-1.3%). In relation to the
indicators about glaucoma tube surgery and ROP screening compliance the sample sizes are
smaller than in previous years and therefore these results are not statistically significant
compared to the standards. Both the mandatory use of EPR in the future and the hope of
resumption of more normal working should enable a more accurate assessment of these
metrics in the future.
Specialty Metric Standard 2017/8 2018/9 2019/20
Posterior capsule rupture (PCR)
Cataractsurgery
Good vision after cataract
Cataract >90% 91% 91% 92%
surgery*
Trabeculectomy (glaucoma
Glaucoma >85% 97% 96% 100%
drainage surgery) success
Tube (glaucoma drainage surgery)
Glaucoma >90% N/A 92.5% 89%
success
Glaucoma PCR in glaucoma patients* 80% 93.6% 90.3% 92.1%
macular degeneration*
MR PCR in Medical retina pts* 75% 78% 77% 80%
detachment surgery
VR Success of macular hole surgery >80% 85% 88% 87%
VR PCR in vitrectomised eyes* 90% 98.1% 96.8% 96.3%
at 12 months*
Ext Dis Corneal cross linking safety:
Same or better corrected vision at >97% 99.3% 98.1% 97.9%
12 months*
Ext Dis PK corneal graft survival rate* 89% 81% 85% 88%
Ext Dis DALK corneal graft survival rate* 94% 100% 94% 97.5%
Ext Dis DMEK corneal graft survival rate* 80% 91% 88% 86%
Page | 15Accuracy LASIK (laser for
Refractive >85% 93.4% 93.2% 92.3%
refractive error) in short sight*
Refractive Loss of vision after LASIK* 85% 94% 95% 95%
Adnexal Entropion surgery success >95% 93% 100% 100%
Adnexal Ectropion surgery success >80% 96% 95% 97%
*Indicators marked with an asterisk are based on a whole year’s data for all relevant
cases. All other indicators are based on a sample of cases collected over at least a 3
month period during 2019/20.
2.3 Performance against key local indicators for 2019/20
Overall, Moorfields has achieved good performance against its suite of quality indicators.
However in some areas, the performance indicators have been affected to some extent by the
impact of the COVID-19 pandemic. For completeness, all KPIs reflect the full year position
despite March data being a significant performance outlier in many instances.
Each of the indicators listed below was selected to provide comparable data over time but as
previously identified the impact of COVID-19 will distort that comparison. Some indicators were
new for 2019/20 and the rationale for changing or selecting new indicators was set out in the
2018/19 quality report.
2019/20 key indicators
2017/18 2018/19 2019/20 2019/20
INDICATOR SOURCE
RESULT RESULT Target RESULT
PATIENT EXPERIENCE
Reduce patient New=94 New=91 New=94
Internal
journey times in Indicator not minutes minutes minutes
(QSIS)
glaucoma and in use Follow-up= 90 Follow- Follow-
programme
medical retina minutes. up= 100 up= 101
Improve patient
experience Internal
Indicator not Indicator not
through digital (QSIS) 60% 26.7%*
in use in use
patient check-in programme
kiosks
Data
completeness Internal
Indicator not
for clinic (QSIS) 46.6% 80% 61.4%
in use
journey time programme
(Total)
Data
completeness Internal
Indicator not
for clinic (QSIS) 59.9% 80% 75.5%
in use
journey time programme
(Glaucoma)
Data Internal Indicator not 55.2% 80% 64.6%
Page | 16completeness (QSIS) in use
for clinic programme
journey time
(MR)
Reduce the %
of patients that Internal
do not attend performance 12.3% 11.6% ≤10% 11.8%
(DNA) their first monitoring
appointment
Reduce the %
of patients that
Internal
do not attend Indicator not
performance 10.4% ≤10% 10.5%
(DNA) their in use
monitoring
follow up
appointment
% of patients
whose journey
time through Internal
the A&E performance 78.4% 76.6% ≥80% 75.5%
department monitoring
was three
hours or less**
Theatre Internal
Indicator not
sessions performance 33.8% ≤33.8% 32.0%
in use
starting late monitoring
Theatre Internal
Indicator not
cancellation performance 7.1% ≤7.0% 6.8%
in use
rate (overall) monitoring
Theatre
cancellation Internal
Indicator not
rate (non- performance 0.8% ≤0.8% 0.76%
in use
medical monitoring
cancellations)
Number of
outpatient
appointments
subject to Internal
hospital performance 2.9% 3.52 ≤3% 4.58%
initiated monitoring
cancellations
(medical and
non-medical)
SAFETY
% overall
compliance
with equipment Internal
hygiene performance 99.6% 99.5% 95% 99.6%
standards monitoring
(cleaning of slit
lamp)
% overall
Internal
compliance
performance 95.7% 99% ≥95% 99.0%
with hand
monitoring
hygiene
Page | 17standards
Number of
reportable Internal
MRSA performance 0 0 0 0
bacteraemia monitoring
cases
Number of
Number of
reportable
reportable
clostridium 0 0 0 0
clostridium
difficile
difficile cases
cases
Incidence of
presumed Internal 0.16 (To
endophthalmitis performance 0.22 0.35 ≤0.6 Dec
per 1,000 monitoring 2019)
cataract cases
Incidence of
presumed
endophthalmitis Internal 0.10 (To
per 1,000 performance ≤0.15 0.17 ≤0.5 Dec
intravitreal monitoring 2019)
injections for
AMD
Incidence of
presumed
Internal 0.48 (To
endophthalmitis
performance N/A N/A ≤1 Dec
per 1,000
monitoring 2019)
Glaucoma
cases
Number of
serious Internal
Incidents (SIs) performance N/A N/A 0 0
open after 60 monitoring
days
CLINICAL EFFECTIVENESS
%
Internal
implementation
performance 98.7% 95.7% 95% 100%
of NICE
monitoring
guidance***
Posterior
capsule rupture
Internal
rate for cataract
performance 0.99% 1.13% ≤1.95% 0.85%
surgery
monitoring
(cataract
service)
Number of
registered Internal
clinical audits performance N/A N/A ≤10% 1.65%
past their monitoring
deadline date
Number of Internal
breached performance N/A N/A ≤10% 6%
policies monitoring
Page | 18* This is linked with the impact of COVID 19 leading to the trust only operating on an
emergency model
** A late start being a session that started more than 15 minutes later than the planned start
time.
*** The trust is 100% (110/110) compliant with all NICE publications identified as relevant to
the trust (including all guidelines and quality standards). This is based on data from April 2013
to 31st March 2020.
2.4 Performance against 2019/20 national performance and core indicators
Moorfields reports compliance with NHS Improvement’s requirements, the NHS Constitution
and NHS outcomes framework to the trust board both as part of monthly Integrated
Performance Report (IPR) and as specific, issue-focused papers. Moorfields Eye Hospital
NHS Foundation Trust considers that this data is as described in the sections and tables below
because of our internal and external data checking and validation processes, including audits,
but is subject to the caveats raised in the statement of directors’ responsibilities. An integral
part of the IPR process is to identify not just the performance against the numerical target but
to add value to the reporting process by articulating, through the use of Remedial Action Plans,
any corrective actions the Trust is taking to address areas of underperformance.
National performance data
All NHS foundation trusts are required to report performance against a set of core indicators
using data made available to the trust by NHS digital. Where the required data is made
available by NHS digital, a comparison has been made with the national average and the
highest and lowest performing trusts. The data published is the most recent reporting period
available on the NHS digital website and may not reflect the trust’s current position (please
note that the data period refers to the full financial year unless indicated).
Overall Moorfields achieves a very good performance against national performance indicators
as set out in the table below.
National Performance measures
Average for Highest Lowest
Description of Performance Target Performance applicable performing performing
target 2018/19 2019/20 2019/20 trusts trust trust
2019/20 2019/20 2019/20
Infection control
MRSA – meeting the 0.77 (to Jan 0 (to Jan 3.53 (to Jan
0 0 0
objective 2020) 2020) 2020)
Clostridium difficile
9.6 (to Mar 0 (to Mar 79.09 (to
year on year 0 0 0
reduction 2019) 2019) Mar 2019)
Screening all elective
100% 100% 100% N/A N/A N/A
inpatients for MRSA
Risk assessment of
hospital-related
96.36% (to 99.89% (to 71.59% (to
venous 98.2% 95% 98.4%
thromboembolism Q3 19/20) Q3 19/20) Q3 19/20)
(VTE)
Waiting Times
Two-week wait from 92.71% 100% 65.4%
urgent GP referral for 94.3% 93% 96.4% (As at Oct (As at Oct (As at Oct
suspected cancer to 2020) 2020)) 2020)
Page | 19Average for Highest Lowest
Description of Performance Target Performance applicable performing performing
target 2018/19 2019/20 2019/20 trusts trust trust
2019/20 2019/20 2019/20
first outpatient
appointment
Cancer 31-day waits
97.51% 100% 80.85%
–diagnosis to first 97.8% 96% 99.2%
(Apr-Dec) (Apr- Dec) (Apr-Dec)
treatment
All 62 days from
84.26% (As 100% (As 22.73% (As
urgent GP referral to
100% 85% 85.7% at Oct at Oct at Oct
first definitive 2019)
2019) 2019)
treatment
Four-hour maximum
82.85% (As 100% (As 63.05% (As
wait in A&E from
98.4% 95% 98.5% at Feb at Feb at Feb
arrival admission, 2020)
2020) 2020)
transfer or discharge
Patients on
incomplete non-
emergency pathways 85.0% (As 98.46% (As 66.07% (As
92%
(yet to start 94.5% 94.1% at Jan at Jan at Jan
treatment) should national 2020)
2020) 2020)
have been waiting no
more than 18 weeks
Maximum 6 week 98.26% (As 100% (As 69.69% (As
wait for diagnostic 100% 99% 99.9% at Jan at Jan at Jan
procedures 2020) 2020) 2020)
Other
28-day Emergency
readmission rate
(over 16 years old) – 2.92% 2.64% 2.81% N/A N/A N/A
excluding retinal
detachment
28-day Emergency
readmission rate
(over 16 years old) – 7.88% n/a 7.09% N/A N/A N/A
retinal detachment
only*
28-day readmission
0% n/a 3.33% N/A N/A N/A
rate (0-15 years old)
*The readmission rate for retinal detachment is recognised to be higher than overall surgical re-
admission rates; therefore this is shown separately in the table above. The NOD reported
benchmark UK-NOD Jackson et al. Eye 2013 is 13%.
Referral to treatment (RTT 18 weeks) performance
The ways the trust is required to report RTT18 are:
The incomplete standard is the sole measure of patients’ constitutional right to start
treatment within 18 weeks
The Number of New Clock Starts
The admitted and non-admitted operational standards were abolished in 2015/16, but
the trust continues to report this information.
Page | 20The table below identifies the performance of our full suite of RTT waiting time measures for
the financial year and with a quarterly breakdown.
Year end
Measure Target Q1 Q2 Q3 Q4
2019/20
18-weeks referral to
treatment 92% 94.31% 94.61% 94.50% 92.9% 94.1%
incomplete*
18-weeks referral to
treatment
N/A 83.74% 84.51% 85.63% 81.8% 83.9%
incomplete with
DTA**
18-weeks referral to
≥ 90% 77.47% 76.47% 76.78% 79.0% 77.4%
treatment admitted*
18-weeks referral to
treatment non- ≥ 95% 94.12% 94.15% 94.29% 94.1% 94.2%
admitted*
New RTT periods
(clock starts) all N/A 37754 37457 37074 32063 144348
patients ***
*As reported in the Integrated Performance Report (IPR) for March
**No longer a reportable KPI and removed from the IPR
***Taken from RTT weekly submission
Performance of the measure of the RTT18 incomplete pathway (the key RTT18 performance
indicator) has exceeded the annual target but has decreased when compared to the previous
year’s figure of 94.5%. Performance has decreased for the admitted (which was 79.9% for
2018/19) and for the non-admitted pathways (which were at 94.5%). The decrease in admitted
performance since the last financial year was due to reporting and operational issues on the St
George’s site and capacity issues in the North directorate. . Numbers of patients waiting
significantly over 18 weeks have reduced to lowest levels in several years. The North division
has continued to see an exponential increase in cataract referrals particularly within the North
West sites and Darent Valley Hospital site.
The measurement and reporting of performance against these targets is subject to a complex
series of rules and guidance published nationally, but the complexity and range of the services
offered at Moorfields means that local policies and interpretations are required, including those
set out in our access policy. Moorfields is also challenged by the geographical distance
between sites, as moving patients to provider care outcomes sooner is often possible, but
patients are reluctant to attend a different site. This particularly affects the smaller sites, as
while some have capacity issues; some have spare capacity that cannot be utilised due to the
above issue.
As a tertiary provider receiving onward referrals from other trusts, a key issue is reporting
pathways for patients who were initially referred to other providers. We are required to report
performance against the 18-week target for patients under our care, including those referred
from other providers.
Depending on the nature of the referral and whether the patient has received their first
treatment, this can either ‘start the clock’ on a new 18-week treatment pathway, or represent a
continuation of their waiting time, which began when their GP made an initial referral. To
report waiting times accurately, we need other providers to share information on when each
patient’s treatment pathway began.
Page | 21Although providing this information is required under the national RTT rules, and there is a
defined inter-provider administrative data transfer minimum data set to facilitate sharing the
required information, we do not always receive this information from referring providers
despite extensive chasing. This means that for some patients we cannot know definitively
when their treatment pathway began. The national guidance assumes that the clock start can
be identified for each patient pathway and does not provide guidance on how to treat patients
with unknown clock starts in the incomplete pathway metric.
While internal and external audits have shown instances of this to be markedly reducing, it is
still an issue for Moorfields as a tertiary centre.
Our approach for reporting the indicators is as follows:
Incomplete: we include these patients in the calculation with some form of assumption
about the start date.*
Admitted: we exclude from the calculation and report as unknown clock starts in
national data submission.
Non-admitted: we exclude from the calculation and report as unknown clock starts in
national data submissions.
*For incomplete pathways, the trust makes the performance calculation on the assumption the
pathway is started on the date the referral is received by the trust. These referrals are then
investigated to see whether an earlier ‘clock start’ date is required to measure the whole
pathway. If we cannot ascertain an accurate clock start, the pathways are counted as
unknown.
Performance Indicator Data Quality
A vital pre-requisite to robust governance and effective service delivery is the availability of
high quality data across all areas of the organisation. The organisation requires high quality
data to support a number of business objectives, including safe and effective delivery of care,
and the ability to accurately demonstrate the achievement of key performance indicators. The
trust Data Quality Policy sets out the specific roles and responsibilities of staff and
management in ensuring that data is managed effectively from the point of collection, through
its lifecycle until disposal.
The trust continues to utilize the Data Quality Assurance Framework which has previously
been identified as good practice by external auditors. This process comprises of a regular
review of a range of information sources used within the Trust and is carried out by the Data
Quality Manager on a rolling program across the year.
Data Quality has been given a higher profile this year with the inclusion of a greater range of
directly related Key Performance Indicators published within the Integrated Performance
Report which is presented to the Board each month. These KPIs now include:
Data Quality - Ethnicity recording (Outpatient and Inpatient)
Data Quality - NHS Number recording (Outpatient and Inpatient)
Data Quality - GP recording (Outpatient and Inpatient)
Data Quality - Ethnicity recording (A&E)
Data Quality - NHS Number recording (A&E)
Data Quality - GP recording (A&E)
In addition, the Data Quality audit team have designed and implemented a new audit process.
This is a process whereby the Trusts external data submission processes will be subject to
systematic audit. This will help to assure the organisation that all data submissions to bodies
such as NHS Improvement, NHS England and NHS Digital are of a continued high standard.
Page | 22The team are also working closely with the Operational teams to develop a process which
supports the Trust-wide implementation of standard operating procedures by undertaking a
series of compliance audits. This will ensure that information capture processes are
standardized and adhering to guidance and thus ensure accuracy and completeness.
2.4.1 National Core Indicators
No Prescribed information NHS outcomes Framework Domain
1 Readmission rate (within 28 days) for patients Helping people to recover from episodes
aged of ill health or following injury
I : 0-15: and
II: 16 and over
2 The trust’s responsiveness to the personal Ensuring that people have a positive
needs of its patients during the reporting experience of care
period
3 Percentage of staff who would recommend Ensuring that people have a positive
the trust as a provider of care to their family or experience of care
friends
4 Patients admitted to hospital who were risk Treating and caring for people in a safe
assessed for venous thromboembolisms environment and protecting them from
(VTE) avoidable harm
5 C-difficile infection rate per 100,000 bed days Treating and caring for people in a safe
environment and protecting them from
avoidable harm
6 Rate of patient safety incidents; and number Treating and caring for people in a safe
and percentage that resulted in severe harm environment and protecting them from
or death avoidable harm
28 day emergency readmission rate
The information below is gathered on our internal dataset. The trust is unable to provide
national comparative data for this measure due to data not being available on the NHS Digital
website.
The trust considers that this data is as described for the following reasons:
The trust has a robust clinical coding and data quality assurance process and readmission
data is monitored through the trust management committee on a monthly basis.
2016/17 2017/18 2019/20
28 days Readmission rate
(Adult: 16+)- excluding 3.57% 3.98% 2.81%
retinal detachment
28 days Readmission rate
(Adult: 16+)- retinal 6.27% 6.70% 7.09%
detachment only
28 days Readmission rate
2.60% 0% 3.33
(Child: 0-15)
Moorfields hospital intends to/or has taken the following actions to improve this indicators and
so the quality of its services by:
Page | 23 improving electronic data capture using our improved electronic systems.
continuing to audit data capture and use the results to improve data recording accuracy
through monthly monitoring.
further improving standard operating procedures and maintaining staff training
programmes which is being led by the A&E service.
using the data assurance framework to strengthen data capture across several defined
criteria
Emergency readmissions are reviewed on a monthly basis by the Deputy Clinical
Director for City Road.
Our dedicated information management & data quality group which supports improvement
meet on a monthly basis and will monitor readmission rates.
The trust’s responsiveness to the personal needs of its patients during the
reporting period (2019/20 FFT performance)
Friends and family Test (FFT):
Since April 2015 all patients seen within the Moorfields network, whether they are inpatients,
outpatients or attended the A&E department, have been asked to rate the care they received.
They are also asked to provide feedback regarding their experiences, in response to the
question ‘What would have made your visit better?’
During 2019/20 over 100,000 Moorfields patients undertook the test, the results of which are
reported to NHS England monthly. In October 2019, a process by which patients are texted the
question (as opposed to completing a card), was introduced which increased the response rate
notably and increased the number of comments that could be themed and used for service
improvement. It has also freed up the reception and nursing staff time allowing them more time
to interact with patients.
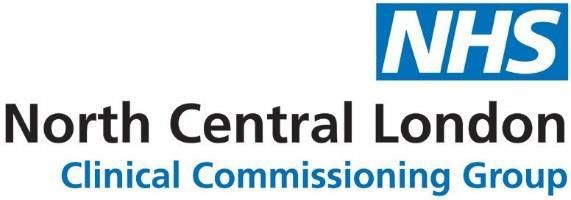
The majority of comments praise staff for their friendly, caring, professional attitude suggesting
individualised care is one of the trust’s strengths. There are also areas for improvement
identified, around waiting times in clinic, communication (being kept informed of delays, being
told what to expect etc.), and the environment (all issues related to delays). Work being
undertaken by the QSIS team looking at patient pathways continues. Local changes have
included A&E patients being better informed of refreshments available whilst waiting.
Page | 24Fig 1.FFT by response rate and satisfaction score: 2019/20 (green=would recommend) KPI: A&E 20% OPD 15% Day-care 30% Positive satisfaction score 90% NHS National Surveys There were a number of national surveys which Moorfields took part in the latter part of 2018 which were then reported in the autumn of 2019. CQC Emergency and Urgent care survey 2018 Overall, the results of the CQC survey were positive and very similar to the previous survey in 2016, with a good performance compared to other trusts and scoring particularly high on questions relating to information giving and discharge from the department. For 57% of comparable questions there was either a marginal improvement or the result was the same as the previous survey. Where the department was less strong was in the questions around delays in initially being seen and examined, being informed of waiting times, communication regarding side effects of medication and taking patients home situation into account prior to discharge. When compared to other trusts, Moorfields was better in 12 of the 34 questions. For 21 of the questions the trust scored 8 or above (out of a possible 10) and only 1 scored lower than 5. An action plan has been developed within the A&E team to address the issues where improvement could be made. CQC Children and young People’s Inpatient and Day Case Survey (2018) The survey asked 54 questions about all aspects of the care pathway for children and young people undergoing day care treatment at Moorfields (parents were also asked). Overall, Moorfields is identified as performing ‘better than expected’ for both the experiences of children aged 0 to 7 and the experiences of children aged 8 to 15. This is because, for both age groups, the proportion of respondents who answered positively to questions about their care, was significantly above the other 129 other trust average. There is very little change against the previous survey, which was also very good. The trust was shown to be ‘Better’ than expected when compared with other trusts in 22 of the 54 questions and ‘worse’ than expected for none. Moorfields scored particularly well in several aspects of information giving and the friendliness of staff. Areas where improvements identified were around appointments management and Wi-Fi provision. Page | 25
NHS Cancer Survey 2019
The national patient cancer survey is an annual survey which monitors national progress on
cancer care to drive local quality improvements, assist commissioners and providers of cancer
care, and inform the work of the various charities and stakeholder groups supporting cancer
patients. The survey asked adult patients from the Moorfields oncology and adnexal oncology
services a range of questions about their treatment pathway and the support they received. 40
questions were relevant to Moorfields and of these, 21 received a positive score of 80% or
above, and 11 of the questions scored higher than the national average score.
Areas in which Moorfields did particularly well include that Patients felt that they were involved
as much as they wanted to be in decisions about their care and treatment. Patients said that
they were given the name of a Clinical Nurse Specialist who would support them through their
treatment. Patients felt that it had been ‘quite easy’ or ‘very easy’ to contact their Clinical Nurse
Specialist. Overall, the patient’s average rating of care out of ten (very good) was 8.3.
Patient Participation
In 2018 Moorfield’s patient participation strategy was launched which has been promoted
across the trust at meetings, clinical governance half days and divisional and quality
meetings. The main element of the patient participation strategy, involving and engaging our
patients across the organisation in participation activities including service reviews and
developments, has continued throughout 2019/20. Actions have arisen following sessions
which are being implemented by local teams. Examples of patient participation forum where
patients are involved in developing services include:
Adnexal Service: Botulinum service (blephrospasm) patient pathway review
Croydon /Purley: Joint working between MEH and Croydon Community
Ophthalmology
Bedford: AMD Patient Group
CR ECLO’s: Living with sight loss
Glaucoma, City Road: newly diagnosed glaucoma patients
Uveitis, City Road: New service review
Trust Quality Priorities: External stakeholder forum
RDCEC / Research: Young People’s Advisory Group (YPAG)
Mile End: Patient Reference Group (Review of service)
St Ann’s: Patient Reference Group and open day
Darent Valley: Patient Reference Group and open day
City Road Optometry: LVA Service review
Ocular Prosthetics: Patient Reference Group
Trust QSIS project reference
The Patient and Carer Forum, chaired by a trust governor, oversees the implementation of
patient participation at Moorfields and has been meeting quarterly since March 2018. It
reviews and advises on how patients are engaged with at Moorfields on issues such as local
trust participation activities, project oriel, and trust wide tender processes i.e. transport,
catering and research.
The Patient Participation and Experience Committee, is a committee, chaired by the director
of quality and safety, comprising of senior divisional managers, divisional quality partners
and the patient experience team. It reviews patient feedback from all sources and reviews
the actions taken in response, both to specific issues and wider trust wide approaches.
Page | 26You can also read