Nitrogen Pollution and the European Environment - IN-DEPTH REPORT Science for Environment Policy
←
→
Page content transcription
If your browser does not render page correctly, please read the page content below
Science for Environment Policy

IN-DEPTH REPORT
Nitrogen Pollution and
the European Environment
Implications for Air Quality Policy
            September 2013

               Environment
Science for Environment Policy                         This In-depth Report is written and edited by the Science
                                                       Communication Unit, University of the West of England
Nitrogen Pollution and the European Environment
                                                       (UWE), Bristol
Implications for Air Quality Policy
                                                       Email: sfep.editorial@uwe.ac.uk

Contents                                               Acknowledgements
                                                       We wish to thank Prof Mark Sutton of the Centre for Ecology
                                                       and Hydrology for his input to this report. Final responsibility
Executive summary				                             3    for the content and accuracy of the report, however, lies solely
                                                       with the author.
Introduction                                      5
1. The economic cost of the ecological
                                                       Images
   impacts of nitrogen pollution                  9    Page 3: ©istockphoto.com/chukov
2. The relative importance of reduced                  Page 6, Figure 1: Rockström et al., 2009a
                                                       Page 6, Figure 2: INI, 2010
   and oxidised nitrogen pollutants               12
                                                       Page 7, Figure 3: Erisman et al., 2011
3. Nitrogen and climate change                    15   Page 8, Figure 4: Sutton and Billen, 2010
4. Potential co-benefits from improved 		              Page 9, Figure 5: Brink et al. 2011
                                                       Page 14, Figure 6: Stevens et al., 2011
   nitrogen efficiency in agriculture             18   Page 9, Table 1: Brink et al. 2011
5. The potential for new air quality                   Page 9, Table 2: Brink et al. 2011

   limits on ammonia to help achieve
   objectives of the Habitats Directive           24
In conclusion                                     26

                                                         About Science for Environment Policy

                                                         Science for Environment Policy is a free news
                                                         and information service published by the European
                                                         Commission’s Directorate-General Environment,
                                                         which provides the latest environmental policy-
                                                         relevant research findings.

                                                         In-depth Reports are a feature of the service,
                                                         introduced in 2012, which take a comprehensive
                                                         look at the latest science for key policy topics.
                                                         In addition to In-depth Reports, Science for
                                                         Environment Policy also publishes a weekly
                                                         News Alert which is delivered by email to
                                                         subscribers and provides accessible summaries
                                                         of key scientific studies.
                                                         http://ec.europa.eu/science-environment-policy

                                                         Keep up-to-date

                                                         Subscribe to Science for Environment Policy’s
                                                         weekly News Alert by emailing:
                                                         sfep@uwe.ac.uk
The contents and views included in Science for
Environment Policy are based on independent              Or sign up online at:
research and do not necessarily reflect the position     http://ec.europa.eu/science-environment-policy
of the European Commission.
3

Executive summary

Nitrogen Pollution and the
European Environment
Nitrogen pollution’s wide-ranging impacts include contributions to global warming, acid rain and eutrophication. Scientists
have suggested that societal capture of atmospheric nitrogen needs to be reduced to around a quarter of its current volume
if we are to avoid crossing a ‘deleterious or even catastrophic… planetary boundary’ (Rockström et al., 2009b). To achieve
this, EU Member States, who collectively emit more than the global average, would need to make an even greater cut in
emissions.

                         Around 10,638 gigagrams of nitrogen are added to soils as synthetic fertilisers each year in the EU-27. Much of this is lost to the
                         atmosphere as gaseous emissions.

                         This In-depth Report from Science for Environment                   Nitrogen and the environment
                         Policy summarises scientific studies and research results           Disturbance to the global nitrogen cycle receives less
                         on nitrogen pollution in the European environment.                  attention than disturbance to the carbon cycle, but
                         Of the many aspects of nitrogen pollution, five specific            the nitrogen cycle is at least as, if not more, out of
                         topics are addressed:                                               balance. A comprehensive approach to managing
                                                                                             nitrogen pollution is a challenge for EU policymaking.
                         •    Evaluation of the economic impacts of nitrogen
                              pollution                                                      The nitrogen cycle and our influences on
                         •    The relative importance of reduced and oxidised                it are complex. Seventy eight per cent of
                              nitrogen pollutants                                            the     world’s   atmosphere    is    composed      of
                         •    Nitrogen and climate change                                    di-nitrogen gas (N2), which is relatively unreactive.
                         •    Potential co-benefits of improved nitrogen                     Plants, animals and various industrial activities need
                              efficiency in agriculture                                      nitrogen in reactive forms. We have learnt to acquire
                         •    The potential for new air quality limits on ammonia            reactive nitrogen through the industrial Haber-Bosch
                              to help achieve objectives of the Habitats Directive           process, which captures di-nitrogen gas and converts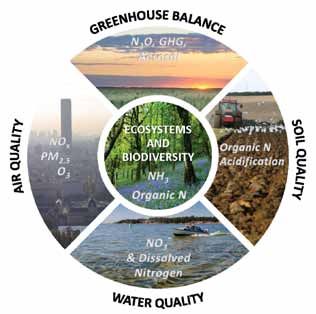
N itrogen          P o l l u tion     A N D   the      E u ropean         E n v iron m ent
  4

it into ammonia (NH3). However, humankind’s increasing use of               nitrogen, such as the CO2 emissions during the Haber-Bosch process.
reactive nitrogen in fertilisers, plastics, explosives, among many other    Future estimates of the EU’s net nitrogen effect could differ markedly.
products, leads to problems as most of the nitrogen is leaked back into     Even with a net cooling effect, much can be done to reduce certain
the environment.                                                            nitrogen pollutants’ warming impacts and contribute to efforts to
                                                                            tackle climate change.
Nitrogen can be emitted in various forms to air and to water, and is
                                                                            4. Potential co-benefits of improved
also deliberately applied to land as fertiliser. Once emitted, its form
may change, passing back and forth through various reactions in the
                                                                            nitrogen efficiency in agriculture
atmosphere, waters, soils, and life-forms.                                  Vast quantities of reactive nitrogen are used in agriculture to generate
                                                                            food. However, most of it is never converted into food, but is instead
1. Evaluation of the economic impacts of                                    wasted due to a low nitrogen use efficiency. By improving efficiency in
                                                                            agriculture, various co-benefits may be achieved, including economic
nitrogen pollution                                                          savings from reduced input costs (such as synthetic fertilisers) and
The total annual cost to the EU of nitrogen pollution’s environmental       reduced externalised costs (e.g. de-polluting water costs), environmental
impacts has been estimated to be between €70 billion and €320 billion.      improvements from reduced pollution, and social benefits, such as
This raises questions as to the cost-effectiveness of our use of reactive   increased food security and more jobs.
nitrogen. For example, costs to the EU from nitrogen pollution from
fertilisers could equal or exceed the economic benefits. The robustness     The techniques available to increase efficiency of nitrogen use
of such economic analyses is questionable, however, as they use             range from minor alterations, to industrialised agriculture to the
some contentious methods, such as ‘willingness to pay’ techniques.          incorporation of what may be considered more sustainable agriculture,
Nonetheless, analysts suggest the economic costs of reducing nitrogen       such as agro-ecology and permaculture. The pursuit of co-benefits
pollution should generally be offset by the economic benefits, although     raises important questions, for example, on the links between policies
greater clarification of costs and benefits would prove useful in           on nitrogen pollution, agriculture, and broader sustainability for the
presenting a more accurate picture. Currently, the costs of nitrogen        EU.
pollution are often ‘externalised’; the polluters do not bear the costs,
and they are passed on to the rest of society.                              5. The potential for new air quality limits
                                                                            on ammonia to help achieve objectives
2. The relative importance of reduced and                                   of the Habitats Directive
oxidised nitrogen pollutants
                                                                            Nitrogen pollution threatens existing commitments to safeguard
There is increasing concern that we do not distinguish clearly enough in    biodiversity. For example, 60% of sites protected by the EU Habitats
research and policy between types of nitrogen pollution, in particular      Directive could exceed critical loads for nitrogen pollution. However,
between ‘reduced’ and ‘oxidised’ nitrogen pollutants. Ammonia is a          the impacts of nitrogen pollution on these protected areas often go
reduced form of nitrogen pollution and is now seen as particularly          unaddressed.
problematic, warranting more specific pollution abatement policies.
Furthermore, more details are needed to understand the response of          One proposed solution is to establish local air quality limits for Natura
different ecosystems to different forms of nitrogen pollution.              2000 sites based on levels of ammonia that are compatible with
                                                                            favourable status. Such local air quality limits would need to operate
3. Nitrogen and climate change                                              in conjunction with appropriate emissions ceilings at national levels.

Different forms of nitrogen pollution vary in their impacts on the          In conclusion
global climate, with some having a warming effect (e.g. nitrous oxide)
released by fossil fuel combustion and after nitrogen fertilisers come      The EU’s use of reactive nitrogen occurs on a massive scale and involves
into contact with soils), and some having a cooling effect (such as the     many industries and increasingly threatens ecosystem services. Serious
aerosols formed from ammonia emissions from livestock facilities).          efforts are required to reduce nitrogen pollution levels sufficiently,
A recent attempt to summarise a ‘net nitrogen effect’ on climate has        but there is much potential good practice available, with various
suggested a slight overall cooling impact from the EU’s combined            possible avenues for further exploration. Current revisions to the EU’s
nitrogen pollution. However, this study excluded many aspects of            air quality framework represent a timely opportunity to initiate this
nitrogen pollution and the broader climate implications of our use of       progress.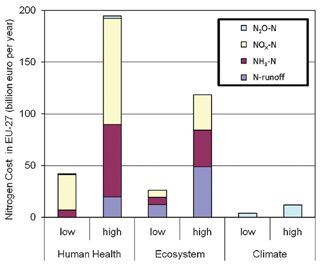
N itrogen           P o l l u tion         A N D    the     E u ropean           E n v iron m ent
                                                                                                                                                          5

Introduction
Nitrogen pollution is a significant environmental issue in Europe and
around the world. The European Commission is currently reviewing
                                                                                      ‘Over the last decade, you have surely heard
key strands of its approach to air quality including the National
Emission Ceilings Directive (Dir.2001/81/EC) and Ambient Air                          many views as to why you should worry
Quality Directive (Dir.2008/50/EC).                                                   about carbon and climate change. But the
                                                                                      chances are you’re not worrying about
Tackling nitrogen pollution also requires trans-national cooperation
beyond European borders. To this end, the Gothenburg Protocol of the                  nitrogen. In fact, there is a global nitrogen
Convention on Long Range Transboundary Air Pollution (CLRTAP)                         threat out there, yet the world seems not
has also been reviewed, coordinated by the United Nations Economic
                                                                                      to notice.’
Commission for Europe (UNECE). The CLRTAP involves Member
States of the EU and other nations, including the USA, Canada, and                    Centre for Ecology and Hydrology (CEH), 2008
the Russian Federation.

Scope of this report
This report focuses on the environmental implications of nitrogen                  the nitrogen cycle is also profoundly disrupted by human activities.
pollution. Whilst the health implications of nitrogen pollution are                According to Aber (as cited by Fields (2004)), ‘the nitrogen cycle has
also a key concern, they are not addressed in this report. The report              been altered more than any other basic element cycle’. This disruption
considers particular topics identified by a panel of experts1 as being             brings a range of impacts, from influencing global climate to creating
particularly relevant at the current time.                                         oceanic dead zones.
The report considers nitrogen pollution as relevant to the EU. However,
                                                                                   The nitrogen and phosphorus cycles are recognised by Rockström et al.,
the ‘transboundary’ nature of much nitrogen pollution means the issue
                                                                                   (2009b) as one of nine crucial ‘planetary processes’ which humankind
is inevitably one of wider geographical scope. It also highlights material
                                                                                   must keep within certain environmental limits to avoid destabilising
which can usefully inform air quality policies, given the air quality
focus of the policy framework under review. This involves a broader                conditions for life and causing ‘detrimental or even catastrophic [impacts]
consideration of the nitrogen cycle, and the movement of nitrogen                  for large parts of the world’. They state that the nitrogen cycle is already
between air, water, organisms and soils (Galloway et al., 2003). For               disrupted beyond safe limits, second only to biodiversity loss as an
instance, nitrogen initially released to the air through burning fossil            Earth process out of balance.
fuels may then be deposited into soils and water bodies, and the
                                                                                   Central to ‘the Rockström analysis’ is the identification of ‘human
nitrogen initially added to soils as fertiliser may then be released to
the air.                                                                           fixation of N2 from the atmosphere as a giant ‘valve’ that controls a
                                                                                   massive flow of new reactive nitrogen’ (Rockström et al., 2009b). Human
                                                                                   conversion of unreactive atmospheric nitrogen (as di-nitrogen (N2))
The nitrogen challenge in a nutshell
                                                                                   into reactive nitrogen occurs primarily through the production of
The conundrum we face globally, and in the EU, is that a range of                  ammonia (NH3) via the Haber-Bosch process, and also through
human activities increase the flow of reactive nitrogen into global                fixation by leguminous plants and emissions from the burning of fossil
nitrogen cycles in concerning ways. Some of these flows are accidental,            fuels and biomass.
such as the nitrous oxide (N2O) released from burning fossil fuels,
and some are deliberate, as when nitrogen is removed from the air in               Human-caused production of reactive nitrogen through these means
the Haber-Bosch process and used to make chemicals, fertilisers, and               now exceeds the entire nitrogen fixation achieved by natural processes
many other useful products. Some of our biggest industrial enterprises             (Rockström et al., 2009a), and global reactive nitrogen production has
and activities are currently linked to nitrogen pollution: agriculture             more than doubled during the last century as a result of human activity
depends on nitrogen, largely in synthetic fertilisers, and transport and           (Sutton et al., 2009).
wider industry continue to depend largely on fossil fuels for energy,
emitting reactive nitrogen as a by-product. The question is therefore:             Rockström et al. (2009b) suggest we need to ‘contain the flow of new
how do we continue to source enough nitrogen to meet our needs                     reactive nitrogen to 25% of its current value’. This is ‘a first guess’ at
without dangerously disrupting the nitrogen cycle?                                 an environmental limit for reactive nitrogen and they acknowledge
                                                                                   that more research is needed to establish an authoritative figure.
Human alterations of the nitrogen cycle                                            Nonetheless, it is a powerful indication of the scale of the challenge.
The carbon cycle usually receives more attention than the nitrogen                 The importance of meeting this challenge is vital because the nitrogen
cycle, due to the pivotal role of CO2 in climate change. However,                  cycle influences almost all the other ‘global processes’ identified as

1. Convened during 2012 by the European Commission’s Directorate General for the Environment.
N itrogen P o l l u tion A N D the E u ropean E n v iron m ent
6
Figure 1. Environmental limits as defined by nine ‘planetary boundaries’, from Rockström et al (2009).
Note, the inner green circle represents estimated planetary safe boundaries. The nitrogen cycle is already disrupted beyond safe
operating limits. Rockström et al (2009). consider nitrogen and phosphorus as one ‘planetary boundary’ owing to similarities
in their impacts (such as causing eutrophication), though they discuss each element’s cycle separately.
critical by Rockström et al., (2009b), such as climate change and sources: Haber-Bosch industrial nitrogen fixation, nitrogen fixation by
biodiversity loss (see Figure 1). cultivation of leguminous crops and combustion of fossil fuels.
Nitrogen pollutants affect climate change, ocean acidification, Since 2000, these data have been updated as follows (Galloway et al.,
stratospheric ozone depletion, biodiversity loss, water eutrophication, 2008):
groundwater pollution and toxic, ground-level ozone pollution. The • Haber-Bosch industrial nitrogen fixation: The largest
use of reactive nitrogen also plays a part in changes in land use. The proportion of anthropogenic reactive nitrogen is ‘fixed’ by the
global community must therefore address its use of reactive nitrogen if Haber-Bosch process which creates ammonia from di-nitrogen
the stable environmental conditions experienced over the last 10,000 (N2) gas for use in an array of products including agricultural
years are to continue. fertilisers and ammunitions. The Haber-Bosch process fixes
Sources of nitrogen pollution around 121 teragrams of nitrogen per year (Tg N/yr). Most of
this is used in fertiliser production (70% of the EU’s reactive
Figure 2 illustrates the rising global trend of reactive nitrogen generation nitrogen use (Sutton and Billen, 2010)).
since the industrial revolution to the year 2000 from the three principal
The scale and pace of change are startling
and worrisome: In only two generations,
humans have become the dominant
influence on global nitrogen cycling, and
no slowdown is in sight. New approaches
are urgently needed - indeed, they are
fundamental to society’s struggle to
achieve environmental sustainability.’
Townsend and Palm, 2009
Figure 2. Global reactive nitrogen creation rate (teragrams of nitrogen per year) up to
the year 2000. Source: INI, 2010N itrogen P o l l u tion A N D the E u ropean E n v iron m ent
7
• Nitrogen fixation by cultivation of leguminous crops: Forms of nitrogen pollution and their
Leguminous crops fix around 40 Tg N/yr of nitrogen through impacts on the environment
partnering with nitrogen-fixing bacteria.
This report defines nitrogen pollution as nitrogen containing
• Combustion of fossil fuels: The burning of fossil fuels releases compounds which contribute to disruption of the nitrogen cycle and
around 25 Tg N/yr (in transport and energy generation) as the various problems this can lead to, such as eutrophication or radiative
nitrogen oxides (NOx). forcing. The particular forms of nitrogen regarded as ‘pollution’ may
occur naturally in nature, but become pollution when the quantity
Usage and emissions of nitrogen and/or location of their flows become problematic.
The industrial sector with the highest nitrogen use is agriculture. In The most abundant form of nitrogen on Earth is the least reactive form:
addition to the nitrogen fixed by legumes in agricultural systems, most di-nitrogen gas (Sutton et al., 2009). Di-nitrogen naturally constitutes
reactive nitrogen from Haber-Bosch process is used in agriculture 78% of our atmosphere. However, reactive nitrogen is the main cause
through the application of synthetic fertilisers to grow crops that feed of nitrogen pollution. Reactive nitrogen in short supply in the natural
people and livestock and, increasingly, biofuel crops (Galloway et al., nitrogen cycle usually remains contained within the cycle. It is when
2008). Livestock, such as pigs and cattle, release reactive nitrogen (e.g. reactive nitrogen is supplied in excess that it becomes lost from the
as ammonia and nitrous oxide) through their manure, sometimes cycle to the wider environment as pollution (Sutton et al., 2009).
resulting in hotspots of air and water pollution. This nitrogen originates
from nitrogen previously fixed by the Haber-Bosch process to create Reactive nitrogen compounds occurring as gaseous air pollutants are
synthetic fertiliser for growing livestock feed (see Van der Voet et al., ammonia (NH3), nitrogen oxides (NOx) and nitrous oxide (N2O),
1996; Leip, 2010). and ammonium and nitrogen oxides can also contribute to air
pollution when part of aerosol particles. Reactive nitrogen also occurs
Europe is a major user and emitter of reactive nitrogen. EU-27 nations as water pollution in the form of nitrites (NO2-), nitrates (NO3-), and
are estimated to produce 10% of global anthropogenic reactive ammonium (NH4+) and dissolved organic nitrogen, affecting soil pH
nitrogen, even though this region covers less than 3% of the world, and water quality through surface run-off and leaching into surface
in terms of surface area (Sutton and Billen, 2010). Butterbach-Bahl, and groundwaters. Airborne and waterborne nitrogen pollution are
Nemitz and Zaehle (2011), estimate that the EU emits around 10.6% not completely separate, since air pollution can be deposited onto
of the global nitrous oxide. vegetation, soils and water bodies and dissolve to become water
Figure 3. An overview of the nitrogen cycle and anthropogenic impacts upon it. Source: Erisman et al., 2011N itrogen P o l l u tion A N D the E u ropean E n v iron m ent
8
pollution. Likewise, waterborne nitrogen pollution may be converted According to Galloway et al., (2008), in the absence of human influence,
into gases (see Figure 3). around 0.5 kg of nitrogen is generally deposited to ecosystems per
hectare per year. However, for many areas of the world, the average
Air pollutants can be deposited on land, water and plants, either nitrogen deposition rates exceed 10 kg nitrogen per hectare per year.
through wet deposition, as when dissolved in rain or mist, or dry
deposition, when the gas comes into direct contact with a receiving The majority of nitrogen leached from agricultural soils is in the form
object. Both the reduced and the oxidised forms of nitrogen pollution of nitrate and originates from synthetic fertilisers, as well as from
can be deposited as wet or dry deposition depending on climate. For livestock manure (Leip, 2010). Localised peaks in pollution may
example, wet deposition dominates in Scandinavia, where rainfall is also be associated with run-off from urban spaces (Sutton and Billen,
high, while dry deposition is dominant in the dryer climate of the 2010), for instance, from poorly treated sewage and industrial sources
Mediterranean (Stevens et al., 2011). (WRI, 2013).
‘Excess reactive nitrogen represents a
major environmental threat that is only now
beginning to be fully appreciated. At a global
level, humans have more than doubled the
production and cycling of reactive nitrogen,
leading to a plethora of impacts that interact
across all global spheres: atmosphere,
biosphere, hydrosphere and geosphere.’
Sutton et al., 2009
Figure 4. Threats from nitrogen pollution. Source: Sutton and Billen, 2010N itrogen P o l l u tion A N D the E u ropean E n v iron m ent
9
1. The economic cost of the ecological impacts of nitrogen
pollution
Environmental impacts • Combined costs to the European economy of ecosystem, climate
and health impacts amount to between €70 billion and €320
The various forms of reactive nitrogen pollution affect all stages of the billion.
nitrogen cycle. A single atom of nitrogen may move around the cycle
• Per person, this equates to a ‘welfare loss’ of between €150 and
taking on different forms and creating various environmental impacts,
€740 each year, amounting to 0.8-3.9% of the average disposable
a process referred to as the ‘nitrogen cascade’. For example, a single
income per capita. This represents 1-4% of the average citizen’s
molecule of reactive nitrogen may undergo many forms, including
income.
ammonia, nitrogen oxide, nitric acid, nitrate and organic nitrogen, and
may therefore lead to a number of environmental, health and social • Costs due to nitrogen pollution represent more than double the
impacts (IGBP, 2009). extra income gained from the use of synthetic nitrogen fertilisers
in European agriculture (one of the main sources of reactive
nitrogen pollution).
Introduction
Determining the economic cost of the impacts of reactive nitrogen These costs represent the combined environmental and socio-economic
pollution on Europe’s ecosystems is a complex task, as it is not costs, rather than costs linked to the pollution of ecosystems. About
something that is accounted for on either company or national balance 60% of the damage costs calculated by the ENA were estimated to
sheets. However, initial estimates provide us with a starting point. be related to human health, 35% to ecosystem health and 5% to the
effects on the greenhouse gas balance. The ENA estimates costs to
1.1 Total costs of European nitrogen ecosystems of between €25 billion and €115 billion per year. Figure
pollution 5 illustrates the distribution of these costs; the wide range of estimates
highlights the difficulty in making this evaluation.
The first attempt to determine the cost of European nitrogen pollution
was presented by Brink et al., (2011) in the European Nitrogen
Assessment (ENA). The study considered the impacts on ecosystems,
1.2 Costs and benefits of polluting activities
climate and human health of air-borne emissions of nitrogen oxides The high costs of nitrogen pollution, as estimated by the ENA, may
(NOx), ammonia (NH3) and nitrous oxide (N2O), and water-borne cancel out the economic gains of nitrogen-releasing activities. For
emissions of nitrate (NO3-) and ammonium (NH4). The report instance, Blottnitz et al. (2006) estimated the externalised costs (costs
concluded, based on data from the year 2000, that: not borne by the polluter, but by society) of nitrogen fertiliser use
Table 1: Estimates of overall social damage costs in the EU-27 as a result of environmental reactive nitrogen emissions. Source: Brink et al. 2011
Table 2: Estimated cost of different reactive nitrogen threats in Europe per unit of reactive nitrogen emitted. Source: Brink et al. 2011N itrogen P o l l u tion A N D the E u ropean E n v iron m ent
10
1.3 Improving the valuation of nitrogen
pollution
One proposal for improving the scientific basis of economic evaluations
is to use ‘dose-response value chains’ which analyse the impact or
‘response’ of a particular concentration or ‘dose’ of pollutant. An EU
programme, ECLAIRE2 , has been established to explore this in more
depth for airborne nitrogen pollution. While ECLAIRE’s findings
are not yet available, some of the issues which it may encounter are
considered here.
Dose-response relationships currently play a crucial role in European
(and wider) approaches to regulating nitrogen pollution. They provide
the core science which underpins the setting of critical levels and critical
loads – the concentrations (or doses) of pollutants beyond which there
are significant adverse impacts on ecosystems.
Figure 5. Distribution of costs from nitrogen pollution in Europe. Source: The dose-response value chain builds on the logic of dose-response
Brink et al. (2011) relationships. A dose-response relationship plots the dose of a particular
input (such as a form of nitrogen pollution) against its impact (i.e. a
by farmers (mainly through climate change impacts) as €0.3 per kg ‘response’). The response of the receptor usually varies depending on
compared to the (then) market price of €0.5 per kg of fertiliser. The the strength of the dose and this response is typically plotted on a
ENA suggested that overall the benefits of reactive nitrogen fertiliser graph to create a dose-response curve. This approach is used in fields
did not outweigh the costs. The benefit to the farmer was estimated such as ecotoxicology and epidemiology, often to describe the toxicity
as €1-3 per kg of nitrogen fertiliser, but the total environmental costs of a pollutant to a species.
were considered to be greater.
Critical levels are set to describe the level of air pollution beyond which
Sutton et al. (2011b) suggest that if the nitrogen pollution costs of impacts are observed on ecosystems. Critical loads perform the same
intensive agriculture in north-western Europe were to be internalised, role, but for pollution deposited at ground level (e.g. from dry or wet
the economically optimal rate of annual nitrogen application would deposition of airborne pollution). To determine critical levels and
drop by 50kg per hectare: 30% lower than the private economic loads, the vast majority of ‘receptors’ in such studies have been plants,
optimum rate for the farmer who typically externalises these costs. In usually those considered to be sensitive to nitrogen impacts. Species
Blottnitz’s view (2006), farmers would face only minor revenue losses diversity of plants is also commonly used as the indicator (Bobbink
if free pollution permits were allocated by the government, but would and Hettelingh (eds), 2011).
experience more substantial losses if they had to pay a pollution tax or
A dose-response ‘value chain’ differs from a dose-response curve by
trade pollution permits on a market.
taking the curve and seeking to quantify the economic costs of the
Considering all sources of European nitrogen pollution (not just response. In the case of nitrogen pollution, dose-response value chains
fertilisers), and their externalised costs to society as a whole, the ENA should be used to discern how European ecosystems are affected by
concluded that over a diverse range of efforts to reduce air and water different pollutants, and how these various pollutants act as part of a
pollution across sectors, the financial benefits would outweigh the mixture of pollutants and other pressures on ecosystems. Immediate
costs. questions include:
However, in some cases (such as winter wheat production) farm • Should we test pollutants in isolation or in combination?
incomes and yields may be adversely affected even if overall costs • Should we test their toxicity against sensitive species from
and benefits to society favour measures such as lower application of ecosystems? (In which case, bacteria, fungi, plants, animals?)
synthetic fertilisers. • Should we look beyond individual responses and try to understand
responses at population, community, or ecosystem levels?
Some caution should be applied when interpreting such results. • Should we do such tests in controlled laboratory models or out
The ENA study is particularly reliant on ‘willingness to pay’ (WTP) in the field, or both?
estimations, which are much debated. WTP can be derived by asking
• Should we standardise our approaches across EU nations so
people the extent to which they would be willing to forego money
that every country assesses the impacts of nitrogen pollutants in
in order to avoid particular costs of pollution, or how much they
the same way to enable comparison, or do ecological responses
would pay to fix a problem. WTP studies therefore do not necessarily
to nitrogen pollution differ sufficiently to warrant different
demonstrate costs to the economy that are actually paid, or the costs
methodologies?
which would occur if ecological impacts were effectively internalised.
Instead, they serve as a survey of attitudes, using money as a surrogate Such questions pose significant scientific challenges. Nonetheless,
measure of concern about pollution problems. dose-response relationships have played an important role in EU policy
2. ECLAIRE - Effects of Climate Change on Air Pollution Impacts and Response Strategies for European Ecosystems (2011-2015), with funding from the European Union
7th Framework ProgrammeN itrogen P o l l u tion A N D the E u ropean E n v iron m ent
11
and there is potential for further benefits by increasing the depth and • Analysing pollutant mixtures. More sophisticated dose-response
breadth of dose-response studies. studies are needed to model the interactions between specific
nitrogen pollutants and other pollutants or stressors, and the
The science of dose-response relationships can be improved in various impacts of these, in a more systems-based manner (i.e. towards
ways to provide better economic evaluation of nitrogen pollution. ‘causal networks’) (Niemeijer, 2008).
Several significant gaps in knowledge have been identified as follows:
• Moving beyond ‘dose-response’ where necessary. Assessment
• Keeping information up-to-date. For example, recent
of ecosystem dose-response is usually averaged out over time (e.g.
developments have suggested that critical levels for ammonia
per year) and used to inform setting of critical loads/levels. This
have been set too high, an observation resulting in their revision
can miss the potential fluxes of concentrations to which receptors
(Hicks et al., 2011a).
may be exposed within this duration of time. Pearce and van der
Wal (2006) suggest that unacceptable habitat change may not
• More detail on different forms of nitrogen pollution. Currently
only be due to critical load exceedance, but also exposure to high
critical loads and levels are based on total kilograms of nitrogen
nitrogen concentrations.
deposited per hectare (Bobbink and Hettelingh (eds), 2011),
which may assume that all forms of nitrogen are equal in their
impacts. There are now calls for critical levels and loads to be 1.4 Conclusion
set more specifically for a range of different nitrogen pollutants Initial estimates suggest the ecosystem impacts of nitrogen pollution
(Bobbink, Hettelingh and (eds),(2011), Hicks et al., (2011a), cost the EU-27 between €25 billion and €115 billion a year, and total
Jarvis et al., (2011)). costs (including those from health and climate change impacts) could
amount to €320 billion a year. These costs underline the importance
• Use of critical levels and loads. Currently critical loads are used
of considering the full costs of all forms of pollution and support
more than critical levels, neglecting consideration of the airborne
integrated policy measures.
phase of nitrogen pollution. Jarvis et al., (2011) argue that the
critical level for ammonia may be below the critical load set for The balance between costs and benefits of nitrogen polluting activities,
total nitrogen deposition, and highlight the importance of using such as fertiliser use, is called into question with research suggesting
both critical loads and levels. that the societal costs of fertilisers outweigh the benefits. Were farmers
to pay the costs of nitrogen pollution, their use of synthetic fertiliser
• Covering all ecosystems. Different ecosystems respond to
might fall by 30%.
nitrogen pollutants in different ways. There are also gaps in
the provision of critical loads and levels data for several types Such economic evaluations could usefully be further developed. This
of European habitats (such as marine habitats; coastal habitats; would in turn be assisted by advances in the dose-response science
inland surface water habitats; and mire, bog and fen habitats3). which underpins the monitoring of nitrogen pollution’s ecological
impacts.
• Basing data on a wider range of receptors. The current
emphasis on plants could be considered an overly simplistic
indicator of ecosystem health and could be widened, potentially
to include microbial communities, animals and species diversity
or abundance of vulnerable species, amongst others.
3. Habitats A, B, C and D of the EU EUNIS classification.N itrogen P o l l u tion A N D the E u ropean E n v iron m ent
12
2. The relative importance of reduced and oxidised
nitrogen pollutants
Introduction An increased NHx:NOy ratio is expected irrespective of whether total
nitrogen pollution levels rise or fall. Galloway et al. (2004) foresaw
When assessing humanity’s impact on the nitrogen cycle, it is an increase in both reduced and oxidised forms of nitrogen pollution,
important to account for the many types of nitrogen, as different forms suggesting that by 2050, terrestrial oxidised nitrogen deposits will
have diverse chemical and physical properties, and disperse differently. have increased by up to 70% from levels in the 1990s, while reduced
However, most ecological studies on the environmental impacts of nitrogen deposits will increase by 133% over the same period.
nitrogen have assessed ‘nitrogen’ pollution as a collective term (Stevens
et al., 2011). Similarly, the critical loads approach to assessing the It is probably too early to predict confidently the exact effects of a
impact of nitrogen pollution on ecosystems has treated all forms of change in NHx:NOy ratio; the scientific community’s explorations are
reactive nitrogen deposition equally (Nordin et al., 2011). in their early stages. What is understood is that reduced and oxidised
nitrogen forms enter plants through different means, and this varies
One way of categorising types of nitrogen pollutants is according to between types of plants. The ratio change may also affect plant growth
whether they are ‘reduced’ or ‘oxidised’(see Box 1 below for definitions). levels and competitiveness. Furthermore, different taxa of species may
Large changes in the ratio of oxidised and reduced nitrogen inputs are be affected differently (plants, animals, etc), and the impacts may
taking place globally and in Europe (Stevens et al., 2011). cascade through entire food webs.
The ratio of reduced to oxidised nitrogen in the environment is There are also implications of the ratio change for soil health. Soil
significant to policy because their main sources are distinct and could structure may be affected by interactions between forms of nitrogen
therefore be subject to different policy responses. They also have and carbon. Effects on the availability of soil toxins are also possible,
different fates in the environment, and concentrations of oxidised and for instance, where high ammonium (NH4+) levels acidify soils and
reduced nitrogen pollutants vary from place to place, as well as over increase levels of aluminum and iron. In addition, the availability of
time (Holland et al., 1995, cited by Stevens et al., 2011) – further soil nutrients can fall as positively charged ammonium ions can bind
reasons to consider their respective characteristics. with negatively charged soil particles allowing positively charged
nutrients, such as calcium and magnesium, to be lost from the soil
A higher proportion of nitrogen pollution is believed to come from
through leaching.
reduced nitrogen than oxidised nitrogen. An increase in the proportion
of reduced nitrogen pollution, referred to as an ‘increased NHx:NOy
The leaching of oxidised nitrogen pollutants causes different ecosystem
ratio’, has been observed in Europe. Fagerli and Aas (2008) found that
impacts again, such as eutrophication of aquatic ecosystems.
oxidised nitrogen deposition decreased between 1990 and 2005 as a
Furthermore, forms of nitrogen can change into each other as part
result of a change from coal burning to gas or nuclear power in Europe,
of the nitrogen cascade, for instance, ammonium oxidises into nitrate
while reduced nitrogen deposition stabilised after 1995, increasing the
in soils, in a process called ‘nitrification’. The acidity of soil may also
NHx:NOy ratio.
influence the effects of a change in the NHx:NOy ratio (Stevens et al.,
2011).
Although work to date on the effects of reduced and oxidised nitrogen
Box 1 pollutants has mainly been limited to small scale studies of terrestrial
Reduced and Oxidised nitrogen: definitions plants (Stevens et al., 2011), some key threads are emerging from these
enquiries.
In simple terms, the ‘reduced’ forms of nitrogen
pollution contain hydrogen and the oxidised forms 2.1 Ammonia as a neglected priority
contain oxygen. The environmental impacts of oxidised nitrogen pollutants are better
known than the impacts of reduced pollutants, such as ammonia,
The reduced nitrogen pollutants include ammonia even though the instances of exceedances of nitrogen critical loads
(NH3), which is a gas, and ammonium (NH4+), which have tended to be caused by high levels of ammonia (NH3) emissions
is an ion existing in water. Collectively, these reduced from livestock facilities, for instance, in livestock-intensive areas of the
nitrogen pollutants are referred to as NHx. Netherlands, Italy, Germany and Denmark (Erisman et al., 2007).
Ammonia can be toxic to plants as a gas, entering into leaves irrespective
The oxidised nitrogen pollutants include the nitrogen
of whether or not the plant uses it as a nutrient, which may be the case
oxides such as nitrogen dioxide (NO2) and nitrous oxide at low enough doses. High ammonia levels are considered to ‘cause
(N2O), nitric acid (HNO3), and nitrate (NO3). Collectively, detrimental plant physiological effects, probably on the majority of
the oxidised nitrogen pollutants are referred to as NOy. species’ (Nordin et al., 2011). The deposition of ammonia can lead
to soil acidification and leaching of soil nutrients, and also contributeN itrogen P o l l u tion A N D the E u ropean E n v iron m ent
13
to eutrophication and groundwater pollution. Reduced nitrogen can • In ecosystems with acid soils (pH 4.5 or lower) there is little
pass through the nitrogen cascade until it becomes oxidised pollutants conversion of ammonium into nitrate (through ‘nitrification’) and
(Erisman et al., 2007). so ammonium levels can build up to potentially toxic levels.
Therefore, plants which are best adapted to acid conditions will
These impacts of reduced nitrogen pollution warrant more particular have a distinct advantage over others. In contrast, species present on
attention than a blanket approach to ‘nitrogen pollution’ allows, with these soils which are less well adapted to the acid conditions could
a critical level for ammonia required at a level ‘well below’ the general be most at risk. Therefore, on acid soils, deposition of ammonium
critical load set for total nitrogen deposition (Hicks et al., 2011a). could lead to species loss. Such effects have been observed in acid
heathlands (Stevens et al., 2011).
Research suggests that the current critical load in Europe for ammonia
of 8mg of ammonia per m3 has been set too high, and should be • In more neutral soils (pH 6.0 to 7.5), an increase in the NHx:NOy
reduced to 1mg per m3 if impacts on the most sensitive plants (lichens ratio would result in rapid conversion of ammonium into nitrate
and bryophytes) are to be avoided, and 3mg per m3 where lichens and (i.e. turning the reduced form into an oxidised form). This would
bryophytes are not under consideration (Cape et al., 2009). not only prevent ammonium toxicity from occurring, but could
result in a fertilising effect on plants which prefer their nitrogen as
Recent reports consider dry-deposited reduced nitrogen (ammonia) nitrate. The deciding influence on vegetation is likely to be the
to have greater negative effects than dry-deposited oxidised or wet- degree to which species can respond to an increased level of total
deposited nitrogen on plant communities (Centre for Ecology and nitrogen (including as nitrate). Community responses could include
Hydrology, 2009) (see also Hicks et al., 2011a). Ammonia is considered the rapid growth of species which cast shade and exclude smaller
more damaging to ecosystems than nitrogen oxides (NOx) and is most plants (see Clark et al., 2007 and Stevens et al., 2011). Legume
damaging when deposited dry rather than wet (Hicks et al., 2011b). plants on these soils may also be disadvantaged, because their ability
Nevertheless, oxidised nitrogen pollutants remain a problem. to fix their own nitrogen from the air would be less of an advantage
given greater levels of soil nitrogen (Suding et al., 2005).
2.2 Effects of a changing NHx:NOy ratio With deposition of ammonium, nitric acid and other acidifying
Few studies have looked at the NHx:NOy ratio in depth, and these pollution, such as sulphur dioxide (SO2), the ecosystems which are
have mainly focused on terrestrial ecosystems (Stevens et al., 2011). At only ‘slightly buffered’ are likely to become more acidic. In such cases,
present, only tentative conclusions can be drawn. The NHx:NOy ratio ‘the acid-intolerant species... might be dramatically affected by a shift from
in soils is often different to the ratio in air, because inputs from the air a nitrate dominated system towards an ammonium dominated ecosystem
are modified by soil transformations (Stevens et al., 2011). in combination with acidification’ (van den Berg et al., 2008).
Different plants and ecosystems are likely to exhibit different responses 2.3 Conclusion
to a given balance of reduced and oxidised pollution, and it is possible
that local ecologies are specially adapted to certain ratios (Stevens et Further research is needed on the NHx:NOy ratio that goes beyond
al., 2011). For example, the microbiology (e.g. bacteria and fungi) of consideration of a limited range of plants and explores a wider sample
a given soil may be more adapted to a high or low NHx:NOy ratio, of plant species, other life forms, habitat types (including aquatic),
with fungal-dominated soils generally more acidic than bacterial soils conservation sites, ecosystem services, and interactions with other
(Lowenfels and Lewis, 2010). pollutants.
Although there are exceptions to, and possible inconsistencies in the The discussion of the relative impacts of reduced and oxidised nitrogen
following findings, studies have suggested that: pollution does not seek to define an optimal ‘balance’ of pollution and
should not detract from efforts to reduce total nitrogen pollution, with
• High concentrations of ammonium have been found to be toxic cuts in both reduced and oxidised pollutants. Nonetheless, policies and
to many herbaceous plants, whereas increased concentrations of procedures should distinguish between the management of nitrogen
nitrate have been found to stimulate growth (van den Berg et al., oxides and ammonia and future research should assess the relative
2008). impacts of different nitrogen forms (Hicks et al., 2011a).
• Fast growing annual plants and pioneer species are more likely to Additionally, while critical loads for nitrogen deposition are currently
prefer nitrate, whereas slower growing perennial plants are likely to based on total reactive nitrogen deposition, devising habitat specific
prefer ammonium (Stevens et al., 2011). critical loads for the components of deposition and NHx:NOy ratio
could be beneficial in some ecosystems (Stevens et al., 2011).
Attempts to establish guiding principles like these can inform tentative
conclusions about the possible effects of changes in the NHx:NOy
ratio on plant communities. Examples, based on soils with distinctly
different acidity (largely based on Stevens et al., 2011), are:N itrogen P o l l u tion A N D the E u ropean E n v iron m ent
14
Figure 6. Hypothetical relationships between the background soil pH and the mechanisms regulating plant community composition responses to
nitrogen addition. Source: Stevens et al., 2011N itrogen P o l l u tion A N D the E u ropean E n v iron m ent
15
3. Nitrogen and climate change
Introduction or in the form of manure. These fertilisers increase the reactive nitrogen
The predominant form of nitrogen on our planet, di-nitrogen (N2), available to denitrifying microbes which release gaseous nitrous oxide
is not a greenhouse gas (GHG). However, forms of reactive nitrogen into the atmosphere (as well as di-nitrogen).
pollution have various warming and cooling effects on global climate.
When nitrogen and climate change are considered together, it is often A total of around 10,638 Gg of nitrogen is added to soils as synthetic
with reference to the impacts on climate arising from oxidised nitrogen fertilisers each year in the EU-27, and 11,302 Gg as manures. The
gases, namely nitrous oxide (N2O) and the nitrogen oxide (NOx) gases. knock-on effects of reactive nitrogen fertilisers include the leaching
However, these nitrogen pollutants have different impacts on climate. of nitrates into water bodies, which in turn affects the extent to which
downstream ecosystems act as a source for releasing nitrous oxide.
Nitrous oxide is considered a ‘direct’ GHG, since it traps solar The Intergovernmental Panel on Climate Change (IPCC, cited in
radiation in the atmosphere and has a warming effect. Nitrogen oxide the ENA) estimate that, globally, 1% of applied nitrogen is released
emissions, however, have indirect effects through their contributions directly as nitrous oxide and another 0.4% indirectly (later in the
to atmospheric reactions which generate ozone (O3). Ozone has a nitrogen cascade). In Europe, the conversion of nitrogen into nitrous
warming effect when in the lower atmosphere (the troposphere), oxide from synthetic fertilisers has been estimated at 3-5%.
but a cooling effect when in the upper atmosphere (the stratosphere)
(Galloway et al., 2008). European cattle, pigs and poultry are all considerable contributors
of atmospheric nitrous oxide derived from nitrogen in their manure
This section summarises current thinking regarding the warming and and urine. 177 kilotons of nitrous oxide are estimated to have been
cooling impacts of nitrogen pollution, focusing on emissions from the released in 2000 from animal manure in the EU-27.
EU. The first attempt to assess Europe’s overall impact on warming/
cooling (i.e. the ‘net nitrogen effect’) was prepared by Butterbach-Bahl To summarise nitrous oxide’s impacts from agriculture, three studies
et al. (2011) as Chapter 19 of the European Nitrogen Assessment cited by the ENA respectively suggest that EU agriculture emits a
(ENA). While this assessment is preliminary, it forms the basis of total of 377 Gg, or 400 Gg, or 493 Gg of nitrous oxide per year.
much of our understanding of European emissions’ contribution to These may be underestimates as they do not include other potential
climate change. Unless otherwise stated, all information in this section sources of nitrous oxide, such as the conversion of peatland soils
is taken from this source. to arable land in some EU nations. This is a notable omission as
peatland conversion has been estimated to cause 3-10% of some EU
3.1 Warming effects of nitrogen pollution Member States’ GHG emissions (through both nitrous oxide and
CO2).
Nitrous oxide
Nitrous oxide is released in large amounts each year and has a positive Nitrous oxide from sewage treatment and waste management
radiative forcing, i.e. its molecules store thermal radiation from the Nitrous oxide is emitted as a result of bacterial processing of
sun, thus contributing directly to the warming of the atmosphere. nitrogen in wastewater. The amount released depends on the levels
Per unit of weight, nitrous oxide is a more powerful GHG than CO2.
of oxygen in the process, being highest at relatively low oxygen
Galloway et al., (2007) calculate that, over a 100-year period, nitrous
levels but decreasing at either very low or very high oxygen levels.
oxide has a global warming potential 296 times larger than an equal
mass of CO2. Annual nitrous oxide emissions from wastewater treatment have been
estimated at 25.7 Gg of nitrogen, representing about 5% of total
Estimates vary as to how much nitrous oxide is released by the EU European nitrous oxide emissions.
each year4. The United Nations Framework Convention on Climate
Change estimates 819 gigagrams (Gg) per year, but this figure does not The burning of sewage sludge also releases nitrous oxide, but available
include emissions from EU rivers, continental shelf and estuaries, nor data for this sometimes includes emissions from the combustion of
indirect emissions following nitrogen deposition and leaching. These various other solid wastes. The combined release of nitrous oxide
indirect emissions of nitrous oxide have themselves been estimated at from waste incineration is estimated at 4.98 Gg (in the year 2000),
71.1 gigagrams (Gg) and 34.6 Gg per year. representing 0.8% of European nitrous oxide emissions.
Other summary totals conclude a range varying between 579 and 1438
Nitrous oxide from fossil fuel combustion
Gg of nitrous oxide released by the EU-27 per year. If converted into
a CO2-equivalent (CO2e), this would be 269-669 teragrams (Tg) of Combustion of fossil fuels in energy production, industry and
CO2e. The key sources of nitrous oxide are outlined as follows: transportation, can result in releases of nitrous oxide - particularly
at medium temperatures (500-600ºC). Whilst combustion of
Nitrous oxide and agriculture fossil fuels is notorious as a key emitter of CO2, it is considered to
The major driver for changes in atmospheric nitrous oxide be only a minor source for nitrous oxide emissions. The European
concentrations is the increased use of reactive nitrogen fertiliser in Environment Agency (cited by Butterbach-Bahl et al., 2011) reports
agriculture, mainly through emissions from soils that have been power stations emit quantities of nitrous oxide equivalent to 7.6 Tg
applied with reactive nitrogen – either in the form of synthetic fertiliser of CO2. They calculate transport combustion (of diesel and gasoline)
4. Summarised in Table 19.1 by Butterbach-Bahl et al. (2011)N itrogen P o l l u tion A N D the E u ropean E n v iron m ent
16
to release 13.4 Tg CO2e, a small fraction of the agricultural emissions Whereas in the troposphere, reactive nitrogen causes increased ozone
of nitrous oxide. production and thus trapping of solar heat, in the stratosphere it
causes destruction of ozone and reduced trapping of solar heat. In
Large industrial facilities can also be major sources of nitrous oxide the stratosphere, ultraviolet light breaks up nitrous oxide, producing
and should not be overlooked for potential mitigation measures. Key nitric oxide (NO), which in turn breaks down ozone (Fields, 2004).
industrial emitters of nitrous oxide tend to be processes utilising
nitric acid to produce particular chemicals, such as adipic acid Emissions of nitrous oxide are expected to continue to be the
and glyoxal. There are a very limited number of such installations main anthropogenic emission of a (stratospheric) ozone-destroying
in Europe, but they do cause high down-wind concentrations of compound for the foreseeable future (Portmann, Daniel and
nitrous oxide. Mitigation measures have become available at very low Ravishankara, 2011; Chipperfield, 2009). However, efforts to
costs and installation of these has already seen sharp reductions in assess the global warming implications of reactive nitrogen in the
nitrous oxide emissions from these sources within Europe. However, stratosphere are said to be ‘fraught with uncertainty due to the
production of nitric acid in Europe remains significant, resulting complexities of stratospheric ozone chemistry’ (Butterbach-Bahl, Nemitz
in 50 Gg of CO2e emissions from nitrous oxide, representing as and Zaehle, 2011). The ENA considers the cooling influence of
much as a quarter of the direct emissions of nitrous oxide from soils. Europe’s nitrous oxide emissions on stratospheric ozone to be
Abatement is possible but more costly than for the aforementioned ‘comparatively small’.
processes, although emissions trading increases the desirability of
mitigating emissions from nitric acid production. Aerosols containing reactive nitrogen
Aerosols are suspensions of tiny particles of solids or liquids, held in
Overall, the emissions of nitrous oxide from combustion have the air by gas, and are present in clouds and smog (Beresford Kroeger,
been estimated at between 261 Gg and 461 Gg of nitrogen per 2011).
year. Nitrous oxide can also be released during efforts to reduce
emissions of nitrogen oxides (NOx). This illustrates the need to take Aerosols, including those from sulphur pollution, may cool the
a comprehensive overview of nitrogen pollution. atmosphere in two ways – reflecting sunlight and interacting with
cloud formation in ways that influence temperature. Various types
Nitrous oxide emissions from natural and semi-natural ecosystems
of aerosols formed from nitrous oxide, nitrogen oxides and ammonia
Ecosystems emit nitrous oxide to the atmosphere through natural are considered to have a cooling effect, particularly through scattering
processes of denitrification. However, the rate at which they do so has sunlight. The cooling impact of nitrogen aerosols has been estimated
been modified by human activity increasing the quantity of reactive at between -27.5 and -5.5mW/m2 (an average estimate being
nitrogen in those ecosystems, for instance, following leaching of -16.5mW/m2).
reactive nitrogen from agricultural systems or deposition of reactive
nitrogen from air pollution. 3.3 Further climate impacts of nitrogen:
Summary of nitrous oxide emissions’ direct contribution to carbon sequestration and methane
climate change emissions
The warming impact of Europe’s nitrous oxide emissions has likely
Reactive nitrogen, tropospheric ozone and carbon sequestration
been underestimated. Butterbach-Bahl et al. consider the IPCC’s
Nitrogen contributes to the formation of tropospheric ozone.
emission factor for nitrous oxide of 1% for indirect emissions from
This affects the carbon cycle, as tropospheric ozone impedes
soils following Nr deposition to be too low and propose it should be
photosynthesis and thus reduces carbon sequestration. Galloway
at least doubled. The total radiative forcing of European nitrous oxide
(2008) raises this possibility and draws attention to uncertainties
emissions is considered to be approximately 17mW/m2 (miliwatts per
in how tropical ecosystems will respond to rising reactive nitrogen
square metre).
inputs, as most research has been undertaken in northern latitudes.
Nitrous oxide and ozone in the troposphere This is an important question given that tropical ecosystems are
expected to receive ‘the most dramatic increases’ in reactive nitrogen
In addition to the direct warming impact of nitrous oxide on the
in the future, and are already under pressure from a warming climate.
Earth’s atmosphere, the climate change impacts of nitrous oxide
are exacerbated by its chemical reactions with ozone in both the
Reactive nitrogen and methane
troposphere and stratosphere. In the troposphere, nitrous oxide
A significant issue for the carbon cycle is how reactive nitrogen
undergoes ‘photolysis’ in which ozone is created and acts as a GHG
pollution affects methane (CH4) levels. Methane is a GHG over
with a modest warming effect of 2.9 W/m2. However, this warming
twenty times more powerful than CO2 (over a 100-year period).
effect in the lower atmosphere is thought to be partly counteracted
Just as reactive nitrogen can influence levels of soil carbon and
by the cooling effect that ozone has when it is in the stratosphere (see
oxidation processes which release CO2, so can it influence levels of
Section 3.2).
methane released by soils. Furthermore, the use of reactive nitrogen
in agriculture can also affect the methane released by livestock, cattle
3.2 Cooling effects of nitrogen pollution in particular. These issues are outlined below. The impacts of reactive
Nitrous oxide and ozone in the stratosphere nitrogen on methane may be substantial, but the evidence is not
Conversely to its effects in the troposphere, the impacts of ozone in yet clear. Owing to this uncertainty, impacts on methane were not
the stratosphere may have a cooling effect (Galloway et al., 2008). factored into the ENA’s final figure for net nitrogen effect.You can also read