Does the Airline Industry Suffer From Overcapacity? - Eric Amel, Daniel M. Kasper and Darin Lee
←
→
Page content transcription
If your browser does not render page correctly, please read the page content below
Does the Airline
Industry Suffer From
Overcapacity?

 Eric Amel, Daniel M. Kasper and Darin Lee
     Technical Appendix by Professor Jan K. Brueckner
                                        6/3/2013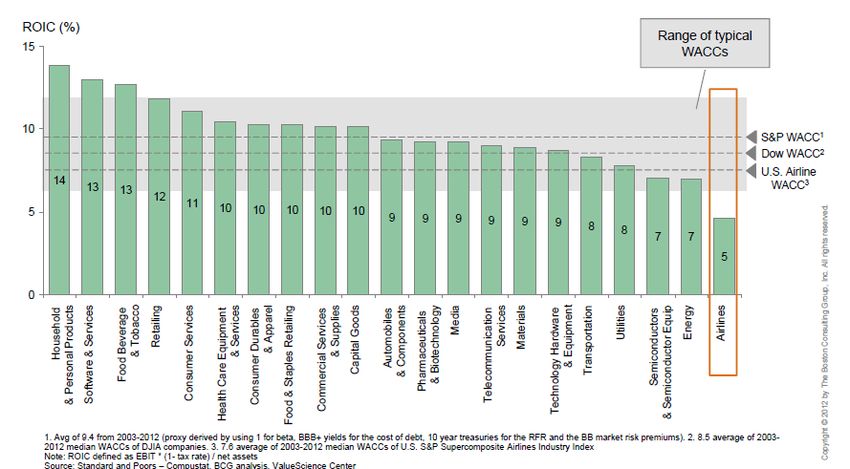
CONTRIBUTOR BIOGRAPHIES

Eric Amel is a Vice President at Compass Lexecon and a Lecturer in Economics at the Boston University
School of Management. He has twenty years of experience in the airline industry and consulting to the
airline industry, and has served as the Chief Economist at both Delta Air Lines and Continental Airlines.
Prior to that he taught finance at Arizona State University College of Business. He earned his Ph.D. in
Economics from Washington University in St. Louis.

Daniel M. Kasper is a Senior Consultant for Compass Lexecon. He has extensive experience in airline
and aviation economics, including over 30 years of consulting experience in the airline and aerospace
industries. He has also served on the faculties of the Harvard Business School and the University of
Southern California School of Business Administration where he focused on the economics and
regulation of airlines and other industries. Between 1979 and 1983, he served in several positions at the
United States Civil Aeronautics Board, advising the Board on all matters pending before the agency and
then as the Director of International Aviation. In 1993, he was appointed as one of 15 members of the
National Commission to Ensure a Strong and Competitive Airline Industry, a body created by Congress to
evaluate and make recommendations on how to improve the performance of the U.S. airline and
aerospace industries. In addition, Mr. Kasper has served as a consultant to the U.S. Departments of
Transportation, State and Defense on various aviation industry matters, and has also testified as an expert
on airline and aviation industry matters before courts and federal administrative agencies, as well as
legislative bodies and antitrust authorities both in the United States and abroad. He earned his M.B.A.
and J.D. degrees from the University of Chicago.

Darin Lee is an Executive Vice President at Compass Lexecon and has published numerous articles on
various aspects of airline economics in journals such as The Journal of Law & Economics, the Journal of
Labor Economics, Economics of Transportation, and the Journal of Air Transport Management. Dr. Lee
is also editor of the book series Advances in Airline Economics, published by Elsevier. Dr. Lee has
advised numerous airlines on matters such as alleged anti-competitive behavior, bankruptcy
reorganization, codesharing, joint ventures and antitrust immunity, labor disputes, business interruption
and the Internet travel industry and has frequently testified as an expert on the airline industry in U.S.
Federal Court and before numerous arbitration panels. Dr. Lee holds a Ph.D. in Economics from Brown
University, an M.A. in Economics from Queen’s University and a B.Sc. in Economics from the
University of Victoria.

Jan K. Brueckner is Professor of Economics at the University of California, Irvine and holds an A.B. from
UC Berkeley and a Ph.D. from Stanford University. Professor Brueckner has served as visiting professor
at UC Santa Barbara and UC San Diego, and has been a visiting scholar at many foreign universities.
Professor Brueckner has published over 25 articles on the economics of the airline industry in leading
peer-reviewed economic journals including the American Economic Review, the Review of Economics
and Statistics, the Journal of Law & Economics, and the International Journal of Industrial Organization.
Professor Brueckner’s early work on the airline industry provided some of the first economic analysis of
hub-and-spoke networks, demonstrating the efficiency gains from operation of such networks. More
recently, Professor Brueckner has written on the economics of airline alliances, showing both
theoretically and empirically that alliances lead to lower fares for interline passengers. Other recent work
by Professor Brueckner deals with the economics of airport congestion.
Dos the Airline Industry Suffer from Overcapacity?

                                                TABLE OF CONTENTS
I.              OVERVIEW .............................................................................................................................1

II.             OVERCAPACITY AND ITS CAUSES .........................................................................................4

     A.            An Overview of the Economics of Overcapacity: Supply and Demand ...........................4
     B.            Reasons for Extended Periods of Overcapacity .................................................................9
          i.               Large and Irreversible Capital Investments ..............................................................10
          ii.              Long Planning Horizons for Capital Assets ..............................................................11
          iii.             Incentives for Firms to Wait to Adjust Capacity ......................................................12
          iv.              Subsidies to Select Competitors ................................................................................12
     C.            Identifying Overcapacity in an Industry ............................................................................13
          i.               Profitability over a Business Cycle ...........................................................................13
          ii.              Return on Invested Capital vs. Weighted Average Cost of Capital ..........................14
          iii.             Frequency of Bankruptcies and Reorganizations ......................................................15
          iv.              Capacity Utilization ..................................................................................................16
III.            DOES THE AIRLINE INDUSTRY SUFFER FROM OVERCAPACITY? .........................................16

     A.            The Airline Industry Has the Characteristics of Industries Subject to Extended
                   Periods of Overcapacity .....................................................................................................17
          i.               Large and Irreversible Capital Investments ..............................................................17
          ii.              Long Planning Horizon for Capital Assets ...............................................................17
          iii.             Incentives for Firms to Wait to Adjust Capacity ......................................................18
          iv.              Subsidies to Select Competitors ................................................................................19
     B.            The Airline Industry Exhibits Each of the Key Indicators of an Industry
                   Suffering from Overcapacity .............................................................................................28
          i.               Profitability over a Business Cycle ...........................................................................28
          ii.              Return on Invested Capital vs. Weighted Average Cost of Capital ..........................31
          iii.             Frequency of Bankruptcies and Reorganizations ......................................................34
          iv.              Capacity Utilization ..................................................................................................36
     C.            Does Current Airline Industry Overcapacity Extend to Widebody Aircraft? ...................39

                                                                      i
Dos the Airline Industry Suffer from Overcapacity?
IV. IS EXCESS WIDEBODY CAPACITY LIKELY TO PERSIST? .....................................................41
A. Widebody Orders ...............................................................................................................41
B. Overcapacity Forecast........................................................................................................44
C. Emirates Airlines, Etihad Airways and Qatar Airways .....................................................46
V. CONCLUSIONS ........................................................................................................................50
APPENDIX...........................................................................................................................................A-1
1.Introduction .................................................................................................................................A-1
2. Model .........................................................................................................................................A-3
2.1 Excess Capacity in the Absence of Capital Subsidies .........................................................A-3
2.2 The Effect of Capital Subsidies ...........................................................................................A-7
3. Conclusion .................................................................................................................................A-10
iiDos the Airline Industry Suffer from Overcapacity?
LIST OF EXHIBITS
Exhibit 1: Supply and Demand ............................................................................................ 5
Exhibit 2: Overcapacity Resulting from an Unanticipated Drop in Demand ...................... 6
Exhibit 3: Overcapacity Resulting from an Increase in Input Costs .................................... 8
Exhibit 4: Overcapacity Resulting from Subsidies to Select Competitors .......................... 9
Exhibit 5: Widebody Deliveries vs. Change in Global GDP ............................................... 18
Exhibit 6: Top Recipients of ECA Financing 2000-2012 .................................................... 21
Exhibit 7: Widebody Deliveries to Top ECA Recipients .................................................... 22
Exhibit 8: Widebody ASMs of Top ECA Recipients and Other Carriers ........................... 23
Exhibit 9: Capacity Regression Results ............................................................................... 26
Exhibit 10: Largest 35 State Owned Airlines ...................................................................... 27
Exhibit 11: Worldwide Airline Net Profits .......................................................................... 29
Exhibit 12: Air Travel Industry Economic Profits/Losses ................................................... 30
Exhibit 13: Global Airline Industry ROIC vs. WACC, 1993-2013 ..................................... 32
Exhibit 14: Comparison of ROICs in the Air Travel Sector ................................................ 33
Exhibit 15: Comparison of ROICs Across U.S. Industries .................................................. 34
Exhibit 16: Major Airline Bankruptcies and Reorganizations Since 2000 .......................... 35
Exhibit 17: Blockhour Utilization of Worldwide Widebody Passenger Aircraft ................ 37
Exhibit 18: Growth of Widebody International ASMs, Other ASMs and Global GDP...... 40
Exhibit 19: U.S. Carriers’ Net Margins: Domestic vs. International ................................... 41
Exhibit 20: Widebody Aircraft Historical/Scheduled Deliveries vs. Worldwide GDP:
Top ECA vs. Other Carriers ................................................................................... 42
Exhibit 21: Widebody Aircraft Historical/Scheduled Deliveries vs. Airline Industry
ROIC: Top ECA vs. Other Carriers ...................................................................... 43
Exhibit 22: Widebody Net Deliveries .................................................................................. 44
Exhibit 23: Actual/Forecasted Versus Predicted Worldwide Capacity ............................... 46
Exhibit 24: ASM Growth of Emirates Airlines, Etihad Airways, and Qatar Airways ........ 47
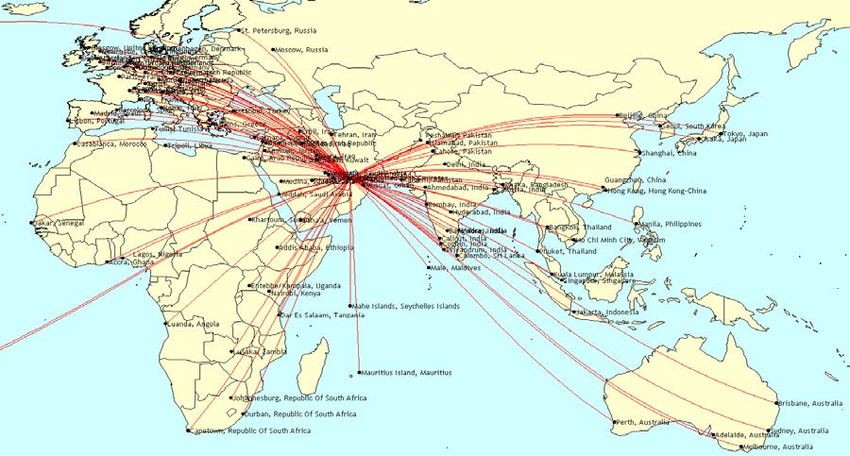
Exhibit 25: Emirates Airlines Route Map............................................................................ 48
Exhibit 26: Current Widebody Orders ................................................................................. 50
iiiDos the Airline Industry Suffer from Overcapacity?
I. OVERVIEW
Under the Export-Import Bank’s (“Ex-Im” or “Bank”) governing statute, the Bank must
publish “methodological guidelines to be used by the Bank in conducting economic
impact analyses….” 1 The “Economic Impact Procedures and Methodological
Guidelines” promulgated by the Bank following the enactment of this legislation state
that “[t]he first stage of an economic analysis consists of an analysis of the long-term
supply/demand balance of the global airline industry (likely differentiating between wide-
body and narrow-body aircraft). This analysis determines whether a long-run structural
oversupply exists in the industry….” 2
This white paper assesses whether there is currently structural overcapacity in the global
airline industry. Our analysis begins by examining what it means for an industry to have
overcapacity and the conditions that are likely to cause and/or exacerbate overcapacity. 3
We start with a review of basic economic principles and demonstrate that overcapacity
occurs when underlying demand and/or supply conditions lead to prices too low to cover
the industry’s full costs, including the cost of capital over a business cycle. We also
show how subsidies can not only cause overcapacity but can also exacerbate overcapacity
that may have been caused by other factors. We then examine how and why industries
with certain characteristics—including large and irreversible capital investments, long
planning horizons for capital investments, or subsidies to selected competitors—can
experience extended periods of overcapacity. The Appendix to this report also contains a
rigorous economic model by Professor Jan K. Brueckner that more formally demonstrates
1
See Export-Import Bank Reauthorization Act of 2012, Pub. L. No. 112-122, 126 Stat. 357
§12(a).
2
See Export-Import Bank of the United States Economic Impact Procedures and Methodological
Guidelines, April 2013, p. 13.
3
Throughout this report, we use the terms “oversupply,” “overcapacity,” and “excess capacity”
interchangeably.
1Dos the Airline Industry Suffer from Overcapacity?
the conditions under which the airline industry would experience an extended period of
overcapacity.
Our analysis then discusses a number of indicators that can signal when an industry
suffers from overcapacity. Because overcapacity results in prices that are too low for
firms to collectively cover their full economic costs, industries with excess capacity
typically suffer from extended periods of negative economic profits, i.e., where the
industry fails to earn a return on capital high enough to justify the levels of investments
that have been made. Hence, chronic sub-par returns are perhaps the most reliable
indicator of an industry with excess capacity. Likewise, industries with excess capacity
tend to experience an increase in financial restructurings—typically (but not exclusively)
via bankruptcy—and to experience low rates of asset or capital utilization.
We then turn to the airline industry itself and show that it has the characteristics of
industries that are susceptible to overcapacity. In particular, we show that the airline
industry has high fixed capital costs, long lead times between ordering and actually
obtaining its large capital assets, incentives for carriers to wait before reducing capacity,
and some competitors that have received subsidies. Using these indicators of
overcapacity, we then show that the airline industry currently suffers from overcapacity.
In particular, we show that:
• The worldwide airline industry has consistently (including in 2012)
generated negative economic profits, i.e., returns consistently below
the industry’s cost of capital, which is a compelling indicator of
industry overcapacity.
• Even when measured against the less stringent accounting
profitability measure (which does not include the full cost of capital),
the airline industry has been unprofitable for six out of the last
eleven years (2002-2012) and has lost a cumulative $14.1 billion
over that period.
2Dos the Airline Industry Suffer from Overcapacity?
• Notwithstanding the airline industry’s abysmal economic/financial
performance, the industry’s capacity has continued to increase. For
example:
1. Net of retirements, 5,699 new aircraft—1,014 wide body
aircraft (“widebodies”) and 4,685 narrow body aircraft
(“narrowbodies”)—were delivered over the period 2002 to
2012; 4
2. International widebody capacity (as measured by available seat
miles (“ASMs” 5)) increased by 55% between 2002 and 2012,
compared to the worldwide GDP growth of 30%. 6
• Moreover, manufacturers have reported orders of approximately
2,400 additional new widebodies to be delivered over the next five
years, 36% more than were delivered over the decade between 2002
and 2012. 7 With these orders, the estimated number of widebodies
worldwide (net of retirements) would grow by 5.4% per year
compared to a growth in widebody aircraft of only 1.9% per year
from 2002 to 2012. 8 As we explain in Section IV below, even
allowing for projected growth in world GDP, this rapid expansion in
widebody capacity is likely to exacerbate the problem of returns that
do not cover the industry’s cost of capital.
• One of the key factors contributing to airline industry overcapacity is
subsidized (i.e., below-market rate) aircraft financing provided by
the Export Credit Agencies (“ECA”) including Ex-Im and the
European ECAs. 9
4
Source: Avitas. Avitas’ website describes the company as “… the leading aircraft expert
advisor to airlines, financial institutions, maintenance facilities, manufacturers, government
agencies and law firms.” See http://avitas.com/company_profile.jsp.
5
An ASM is a standard airline industry measure of capacity defined as one seat flown one mile.
6
Sources: OAG and Avitas.
7
Source: Ascend.
8
Source: Avitas.
9
There are three European ECAs that finance Airbus aircraft: Export Credits Guarantee
Department (“ECGD”) in the United Kingdom; Compagnie Française d’Assurance pour le
Commerce Extérieur (“COFACE”) in France; and Euler Hermes Kreditversicherungs-AG
(“HERMES”) in Germany. Airbus aircraft are also produced in Spain, but the Spanish ECA,
Grupo CESCE (“CESCE”), does not presently finance aircraft purchases.
3Dos the Airline Industry Suffer from Overcapacity?
In addition, we have undertaken a regression-based analysis that controls for changes in
GDP, fuel prices, and the after-effects of September 11th on airline demand. That
analysis confirms the fact that airline industry capacity began to deviate from its
historical relationship to these other factors during a period that coincides with a notable
increase in ECA-based financing.
In sum, our analysis indicates that the airline industry currently suffers from
overcapacity, including for widebodies. Further, we show that current orders for
widebodies are so robust, particularly among the carriers that have received substantial
ECA financing (including three Middle East-based carriers that we examine in more
detail later in this report), that the overcapacity now plaguing the airline industry is likely
to persist for the foreseeable future. Simply put, our analysis indicates that the airline
industry currently suffers from structural overcapacity due to the very factors identified
by Professor Brueckner’s model (contained in Appendix A) as being key causes of
structural overcapacity.
II. OVERCAPACITY AND ITS CAUSES
A. AN OVERVIEW OF THE ECONOMICS OF OVERCAPACITY: SUPPLY AND DEMAND
The overcapacity phenomenon can be illustrated using a simple supply and demand
analysis (a formal analysis of the graphical illustrations described in this Section is
contained in the Appendix). Exhibit 1 depicts a basic supply and demand graph, with
industry output on the horizontal axis and price on the vertical axis. The industry’s long-
run supply curve (which indicates the quantity supplied at different prices) is given by S0.
The horizontal nature of the curve reflects an assumed constant marginal cost of
supplying additional output. 10 The demand for the industry’s output is given by the
demand curve D0. The demand curve is downward sloping because consumers demand
more as price falls. The market equilibrium, where the demand equals the supply, lies at
10
As discussed in detail in the Appendix, all of the results described in this Section generalize to
the case of an upward sloping long-run supply curve.
4Dos the Airline Industry Suffer from Overcapacity?
the intersection of the supply and demand curves. The equilibrium price (i.e., the price at
which the quantity supplied equals the quantity demanded) is p0 and the equilibrium
output is Q0. In long-run equilibrium, firms are earning non-negative economic profits.
EXHIBIT 1: SUPPLY AND DEMAND
p
(price) S0: Long Run Supply
D0: Demand
p0 S0
D0
Q0 Q
(output)
To illustrate the causes of overcapacity and its consequences, suppose there is an
unanticipated drop in demand, with the demand curve falling to D1, as shown in Exhibit
2. In the airline industry, negative demand shocks can be caused by (among other
factors) wars or terrorist attacks. 11 If the industry could quickly shed enough capacity to
move to the long-run equilibrium, output would drop to the level Q2, where the new
lower demand curve intersects the supply curve S0. But if an industry’s capacity is
largely fixed in the short run (as is the case in the airline industry), 12 output cannot be
11
See, for example, Harumi Ito and Darin Lee, “Comparing the Impact of the September 11th
Terrorist Attacks on International Airline Demand,” International Journal of the Economics of
Business, Vol. 12, No. 2, July 2005, pp. 225–249 and Harumi Ito and Darin Lee, “Assessing the
Impact of the September 11th Terrorist Attacks on U.S. Airline Demand,” Journal of Economics
and Business, Volume 57, No. 1, 2005, pp. 75-95.
12
See Section III.A.i below and the Appendix.
5Dos the Airline Industry Suffer from Overcapacity?
quickly reduced to this level (as illustrated by the relatively steep short-run supply curve
S*). Under these circumstances, capacity will be reduced along the short-run supply
curve to Q1. 13 For this output to be absorbed under the new lower state of demand, price
must fall to p1, the price level where S* and D1 intersect. At this lower price, however,
the industry cannot cover its cost of capital, and it incurs economic losses.
EXHIBIT 2: OVERCAPACITY RESULTING FROM AN UNANTICIPATED DROP IN
DEMAND
p
(price) S* S0: Initial Long Run Supply
S*: Short Run Supply
D0: Initial Demand
D1: New Demand
p0
S0
p1
D0
D1
Q2 Q1 Q0 Q
(output)
The fact that the industry is unable to lower capacity enough to avoid losses as demand
drops results in a state of overcapacity in the industry. In the long run, capacity would be
withdrawn to adjust to the new conditions and industry output would fall to Q2. At that
point, enough capacity/capital would have been withdrawn so that the industry could
cover its full costs, including its cost of capital. During the time it takes to make these
13
Firms could always shut down, but so long as by continuing to operate they generate sufficient
revenues to cover slightly more than their variable costs, it will be more profitable for them to
operate than to shut down. See William F. Samuelson and Stephen G. Marks, Managerial
Economics, 7th Edition, John Wiley & Sons, Inc., 2012, pp. 257-259.
6Dos the Airline Industry Suffer from Overcapacity?
capacity adjustments, however, overcapacity will persist and the industry will continue to
incur economic losses. In short, the length of time it takes for the industry to move to the
new long-run equilibrium determines how long the industry will experience overcapacity
(other things equal). For industries like airlines—with high fixed costs, long-lived and
specialized capital assets and with incentives that discourage firms from making
immediate capacity reductions—overcapacity can persist for an extended period of time.
Overcapacity can also occur if one or more important input costs rise unexpectedly. Such
a cost increase is reflected by the upward shift in the long-run supply curve from S0 to S'
in Exhibit 3. Assuming that demand has not changed (i.e., that the demand curve remains
at D0), equilibrium could be restored if industry output decreased to Q', as the price rose
to p' to cover the higher costs. However, the industry’s inability to fully reduce capacity
to equilibrium in the short run prevents a reduction in output to the new long-run
equilibrium level (Q') and, therefore, output would decrease by less than is required to
reach Q'. Likewise, the price would not increase in the short run to p' (the new long-run
equilibrium price). 14 But with prices below p', the industry once again cannot cover its
full cost, including the cost of capital. 15 Thus, an unanticipated increase in input costs
can also lead to overcapacity. And just as with an unexpected decrease in demand, for
industries with high fixed costs, long lead times for capital assets, and/or incentives for
individual firms not to immediately adjust, overcapacity can remain for an extended
period and become structural.
14
The most the industry could reduce output in the short-run is to Q1, which would generate a
price (using D0) of between p0 and p'.
15
See Appendix, pages A-6 and A-7.
7Dos the Airline Industry Suffer from Overcapacity?
EXHIBIT 3: OVERCAPACITY RESULTING FROM AN INCREASE IN INPUT COSTS
p S*
(price) S0: Initial Long Run Supply
S': New Long Run Supply
S*: Short Run Supply
D0: Demand
p' S'
p0 S0
D0
Q' Q1 Q0 Q
(output)
Likewise, governmental subsidies for capital purchases can also lead to and/or prolong
periods of overcapacity. 16 Suppose that the demand curve is again D0 and that a subset of
firms starts receiving capital subsidies. Their supply curve (reflecting their lower capital
costs) is S2. 17 In the presence of these subsidized firms, price falls to p2 and industry
output rises to Q2, with the new equilibrium given by the intersection of D0 and S2. In the
short run, the non-subsidized firms lower their capacity from Q0 to Q', while the
subsidized firms supply the difference between Q2 and the non-subsidized firms’ output.
16
See, for example, Bruce A. Blonigen and Wesley W. Wilson, “Foreign Subsidization and
Excess Capacity,” Journal of International Economics, 80, 2010, pp. 200-211, who develop a
model demonstrating that subsidies can create “structural excess capacity” (pp. 201-203). They
also “demonstrate that such foreign subsidization can exacerbate cyclical excess capacity effects.”
(p. 201).
17
This is their long-run supply curve after they have adjusted their fixed capital to take advantage
of the subsidies. S* then represents the short-run supply curve of the non-subsidized firms.
8Dos the Airline Industry Suffer from Overcapacity?
With the price below p0, however, the non-subsidized firms would incur losses and fail to
cover their cost of capital while the industry as a whole experiences overcapacity. 18
EXHIBIT 4: OVERCAPACITY RESULTING FROM SUBSIDIES TO SELECT
COMPETITORS
p
(price) S*
S0: Initial Long Run Supply
S2: New Long Run Supply
S*: Short Run Supply
D0: Demand
p0 S0
p2 S2
D0
Q' Q0 Q2 Q
(output)
B. REASONS FOR EXTENDED PERIODS OF OVERCAPACITY
As shown above, excess capacity can result from shifts in either supply or demand such
that firms are unable to make economic profits at the new short-run equilibrium. If the
industry is able to move quickly to the new long-run equilibrium, the duration of the
overcapacity will be limited. However, some industries have inherent characteristics that
limit or prevent firms from making rapid capacity adjustments, thus resulting in extended
periods of overcapacity. 19 In particular, since a firm has to pay the ownership costs for
18
The long-run equilibrium would depend on the ability of the non-subsidized firms to match the
lower costs of the subsidized firms.
19
Two industries that can be used to validate the reasons for—and indicia of—overcapacity
discussed in this Section are steel and dry bulk shipping. Overcapacity in both industries has
9Dos the Airline Industry Suffer from Overcapacity?
its assets regardless of its level of production (e.g., interest on debt issued to finance the
asset), if a large proportion of its assets (and costs) are fixed, so long as the price it
receives for the output produced by those assets covers the variable costs of production,
the firm is better off economically continuing to use those assets than it would be if it
stopped using them, even though the price it receives does not cover the full costs of
production (i.e., even if the firm is not profitable). 20
i. Large and Irreversible Capital Investments
As demonstrated in greater depth in the Appendix, overcapacity can persist in an industry
for an extended period when the capital investments in that industry are large and
difficult to reverse (i.e., once the plants are built, they can only be used to produce a
single product). 21 For example, capital costs of constructing a steel mill are borne by the
firm long after the plant is constructed because the steel producer is responsible for
been observed by many analysts. See, for example: “BMI expects dry bulk shipping’s troubles to
continue for some time to come, with overcapacity putting continued downside pressure on
rates,” (“Research and Markets: No Recovery for Dry Bulk Shipping as Overcapacity Cloud
Hangs Low,” Reuters, August 22, 2011); and “‘…due to the magnitude of excess supply over
demand, we believe a sustained recovery in bulk freight prices will take longer to materialize,’”
(“Dry Bulk Recovery Forecast by 2015,” Seatrade Global, April 4, 2013). In steel
manufacturing, a recent report noted that “[d]espite demand growth witnessed during 2010 and
2011….[t]here is now significant over-capacity in the global steel sector which is putting pressure
on operators’ profitability,” (“Global Steel – 2011 Trends, 2012 Outlook,” Ernst & Young,
January 2012, p. 1). Similarly, “steelmakers worldwide are suffering a steady decline in their
profit margins although global steel demand is widely expected to keep rising for the foreseeable
future…. This is because Chinese steelmakers have rapidly increased their output capacities
since 2000…” (Makoto Danjyo, “Oversupply in Asia Depressing Worldwide Steel Prices,”
Nikkei Asian Review, June 27, 2012).
20
See Footnote 13 above.
21
For example, neither steel mills nor shipping vessels are easily used for other purposes,
particularly in the short run, and both represent large fixed costs that are essential for production
in those industries. The cost of constructing a new steel mill can be expected to be $1 billion.
See Mark Carter and Lance Turner, “Big River Steel Announces $1.1B Mill for Osceola, Will
Employ 525,” Arkansas Business, January 29, 2013. Similarly, for dry bulk carriers, the cost of
purchasing a large vessel is over $100 million. See Maritime Knowledge Centre, “International
Shipping Facts and Figures – Information Resources on Trade, Safety, Security, Environment,”
International Maritime Organization, March 6, 2012, p. 9.
10Dos the Airline Industry Suffer from Overcapacity?
servicing the debt incurred to build and equip that factory. Thus, even if there is an
unexpected reduction in the demand for steel, many producers would be better off
continuing to make and sell the output produced by their plants even though the revenues
generated may not be sufficient to cover their full costs, because any price the firm can
get that exceeds the variable costs of production will help defray the fixed costs of the
plant. 22
ii. Long Planning Horizons for Capital Assets
Industries in which firms must make large and irreversible capital investments to compete
also tend to have long planning horizons for the acquisition of the capital assets. For
example, it takes several years to build a steel mill and start production once a
commitment is made to begin construction. 23 Likewise, dry bulk shippers and airlines
typically face a significant lag between order and delivery of vessels and aircraft,
respectively. If an industry with long planning horizons such as these finds itself in a
state of overcapacity (regardless of the cause), the delivery of previously ordered capital
assets can further extend the time required to eliminate excess capacity. For example, the
recent delivery of shipping vessels that had previously been ordered when operators were
more optimistic about the industry’s prospects is a well-understood reason why the
shipping industry has been plagued by overcapacity in recent years. 24
22
See Samuelson and Marks, op. cit. pp. 257-259. See also Mary E. Deily, “Exit Barriers in the
Steel Industry,” Federal Reserve Bank of Cleveland Economic Review, 1988 Q1 at p. 12 noting:
“Because most production processes do involve fixed costs, the decision to close a plant usually
will involve a period of operation and disinvestment before shutdown. The optimal closing point
will not occur until the net revenue, which is the return to continued operation of the capital in
place, equals the return that could be earned on the salvage value.”
23
A new mill can take 20 months from the start of construction (i.e. after planning, land
acquisition, etc.) to completion. See Mark Carter and Lance Turner, “Big River Steel Announces
$1.1B Mill for Osceola, Will Employ 525.” Arkansas Business, January 29, 2013.
24
See, for example, UNCTAD Secretariat, Review of Maritime Transport 2012, United Nations,
2012, page xiii: “This year’s Review notes that world seaborne trade grew by 4 per cent in 2011,
whereas the tonnage of the world fleet grew at a greater rate, by almost 10 per cent, as shipowners
took delivery of vessels that had been ordered before the economic crisis began.” See also
11Dos the Airline Industry Suffer from Overcapacity?
iii. Incentives for Firms to Wait to Adjust Capacity
Even when an industry has substantial excess capacity, it is often the case that no
individual firm has an incentive to reduce its output unless all firms in the industry do the
same. To illustrate, suppose there is a decrease in demand such that it would require a
10% reduction in total industry output for the industry to return to profitability. For any
given firm, the best outcome would be for other firms to reduce their output sufficiently
to reduce industry output by 10% without having to reduce its own output. If, on the
other hand, a firm reduced its output by 10% but other firms maintained their output,
then the firms that maintained their output would benefit while the firm that reduced its
output would suffer all the costs (i.e. loss of revenue). In short, the industry faces a
“prisoner’s dilemma.” 25 And, as a result, capital tends to exit the industry slower than
optimally and possibly not until the capital assets reach the end of their useful lives.
Thus, when an industry suffers from overcapacity, it can—and often does—take many
years before sufficient capacity exits the market and the industry’s returns are once again
sufficient to cover its cost of capital, even when each individual firm in the industry is
making economically rational decisions.
iv. Subsidies to Select Competitors
In several industries, some (but not all) firms are the recipients of subsidies. Subsidies
lower the recipients’ costs vis-à-vis their non-subsidized competitors and thereby
Maritime Knowledge Centre, International Shipping Facts and Figures - Information Resources
on Trade, Safety, Security, Environment, International Maritime Organization, March 6, 2012, p.
10: “As a result of orders placed prior to the 2008 crisis, new building deliveries [in 2010]
reached a new record in the history of shipbuilding.”
25
See, for example, Dennis W. Carlton and Jeffrey M. Perloff, Modern Industrial Organization,
nd
2 edition, HarperCollins College Publishers, 1994, pp. 254-256 and Robert Gibbons, Game
Theory for Applied Economists, Princeton University Press, 1992, pp. 2-8. See also “Industry
Primer: A Bad Business Getting A Bit Better,” Bank of America Merrill Lynch, September 27,
2011, p. 4, noting, “In game theory, prisoner’s dilemma explains how individually rational
behavior can lead to a collectively irrational outcome. A similar phenomenon occurs in the
airline industry: Because of the perceived benefits of growing… the industry ends up creating
excess supply…”
12Dos the Airline Industry Suffer from Overcapacity?
encourage firms receiving the subsidies to expand more than they would have absent the
subsidies in the expectation that lower costs will allow them to gain market share at the
expense of non-subsidized competitors. 26 As shown in Exhibit 4 above (and formally in
the Appendix), government subsidies to select firms in an industry can both cause and
perpetuate overcapacity. 27
C. IDENTIFYING OVERCAPACITY IN AN INDUSTRY
Having examined key factors contributing to overcapacity, we now turn our attention to
various indicators that—if present—would provide compelling evidence that an industry
suffers from overcapacity.
i. Profitability over a Business Cycle
Overcapacity exists when prices are insufficient for an industry to cover its costs,
including the cost of capital, over a business cycle. That is, an industry suffering from
overcapacity will generate negative economic profits as long as the overcapacity
persists. 28 Thus, one way of ascertaining the existence of overcapacity in an industry is
to determine whether the industry has lost money over an entire business cycle. If an
26
For example, the Chinese government has provided large subsidies to develop their steel
production capacities. See Jonathan Katz, “Report: Chinese Steel Subsidies Out of Control,”
Industry Week, July 30, 2007.
27
See, for example, Bruce A. Blonigen and Wesley W. Wilson, op. cit. Moreover, international
trade theory shows that, in general, such selective export transfers have a net negative impact on
the incomes of the countries providing the export funding. See, for example, Mary Bohman,
Colin A. Carter, and Jeffrey H. Dorfman, finding that “[t]he model fails to provide justification
(on national welfare grounds) for widespread use of targeted export subsidies…” in “The Welfare
Effects of Targeted Export Subsidies: A General Equilibrium Approach,” American Journal of
Agricultural Economics, Vol. 73, No. 3, August 1991, p. 693.
28
Economic profits are the profits above the level required for owners to earn their required rate
of return. See Samuelson and Marks, op. cit., p. 229. While the correct measure would be
economic profits (i.e., including the cost of invested capital), we use here the accounting
measures of profits as a proxy. If a firm was unprofitable using accounting metrics, it would
necessarily be unprofitable using the economic metric. See Richard A. Brealey, Stewart C. Myers,
and Franklin Allen, Principles of Corporate Finance, 11th Edition, McGraw-Hill Companies,
Inc., 2014, pp. 306.
13Dos the Airline Industry Suffer from Overcapacity?
industry’s profits are negative (on average) over a business cycle, that is compelling
evidence of overcapacity. 29
ii. Return on Invested Capital vs. Weighted Average Cost of Capital
If an industry suffers from overcapacity, the returns on the capital invested in that
industry will be below the level that would be required to induce investors to provide
capital to that industry or to an industry with a similar risk profile. 30 For the reasons
described above, this situation can persist for an extended period. A standard measure of
investment returns in an industry is the industry’s return on invested capital (“ROIC”). 31
To determine if returns have, ex-post, compensated investors, they are compared to the
capital costs of the investments, typically measured using the weighted average cost of
capital (“WACC”). 32 Thus, the spread between an industry’s ROIC and WACC is used
to measure of the sufficiency of returns on capital compared to their costs. 33 For an
industry suffering from overcapacity, its WACC will exceed its ROIC. 34
29
See, for example, UNCTAD Secretariat, Review of Maritime Transport 2012, United Nations,
2012, page xiii: “With supply outstripping demand, freight rates fell even further, to unprofitable
levels for most shipping companies.” See also Makoto Danjyo, “Oversupply in Asia Depressing
Worldwide Steel Prices,” Nikkei Asian Review, June 27, 2012: “steelmakers worldwide are
suffering a steady decline in their profit margins although global steel demand is widely expected
to keep rising for the foreseeable future…. This is because Chinese steelmakers have rapidly
increased their output capacities since 2000…”
30
Put differently, in an industry with overcapacity, profits will not be sufficient (ex post) to
justify the investments that have been made.
31
The ROIC is the ratio of earnings (often measured by after-tax operating income) to a measure
of invested capital. See, for example, Aswath Damodaran, “Return on Capital (ROC), Return on
Invested Capital (ROIC) and Return on Equity (ROE): Measurement and Implications,” Stern
School of Business, July 2007.
32
See Brealey, Myers, and Allen, op. cit., 11th Edition, McGraw-Hill Companies, Inc., 2014, pp.
725-727.
33
Ibid.
34
For instance, for both steel and dry bulk shipping, we found that since entering the most recent
period of overcapacity in 2009, WACC has been above ROIC. Source: Analysis of Bloomberg
Data for the top 50 firms by revenue in both industries.
14Dos the Airline Industry Suffer from Overcapacity?
iii. Frequency of Bankruptcies and Reorganizations
Because overcapacity results in firms not generating sufficient returns to cover their costs
(including the cost of capital), it follows that an industry with excess capacity needs
either to reduce its capital stock or lower its non-capital costs enough to restore
profitability. One way firms in industries with excess capacity can reduce their costs and
the amount of invested capital is through a financial reorganization. In many countries,
reorganizations commonly take place under a bankruptcy code which allows firms to
lower their costs by voiding uneconomic contracts and eliminating uneconomic capacity
(e.g., by renouncing leases) and/or by renegotiating capital (and other) obligations
thereby lowering fixed—and potentially variable—costs. As a result, industries that
suffer from long-term overcapacity are often characterized by bankruptcies and/or out-of-
court reorganizations, even among the industry’s largest firms. 35 Hence, if an industry is
experiencing an increased rate of bankruptcies and reorganizations, it is often an
indication of an industry suffering from overcapacity.
35
Steel and dry bulk shipping have both experienced significant numbers of bankruptcies and
major reorganizations. For example, during the period of steel overcapacity in the late
1990s/early 2000s, over 30 U.S. steel firms went bankrupt including both Bethlehem Steel and
National Steel. (See Stephen Cooney, The American Steel Industry: A Changing Profile,
Congressional Research Service, February 14, 2003). (See also, Kevin Nevers, “Bethlehem Steel
Corporation Dissolves at One Minute to Midnight New Years Eve,” Chesterton Tribune, January
5, 2004, and “US Steel to Buy National Steel,” Chesterton Tribune, January 9, 2003). More
recently, Chinese steel manufacturing has been undergoing restructuring, “in an effort to address
the long-standing problems of overcapacity…” (Hu Yang, “Steel Industry to Continue
Restructuring,” China Daily, February 8, 2010). In dry bulk shipping, it was noted that “[a]s
freight rates plunged over 90.0% from their summer highs, the number of companies filing for
bankruptcy protection kept piling up.” (See Ruthie Ackerman, “The Dry-Bulk Domino Effect,”
Forbes.com, February 10, 2009). Dry bulk shippers filing for bankruptcy include Sanko
Steamships, a large Japanese based carrier, who declared bankruptcy in 2012, U.S.–based
General Maritime Corp., Netherland-based Marco Polo Seatrade and Greece-based Omega
Navigation Enterprises Inc. (See O. Tsukimori, “Japan’s Sanko Steamship Files for Bankruptcy.”
Reuters. July 2, 2012; and Heide B. Malhotra, “Shipping Industry Facing Economic Distress,”
Epoch Times, August 19, 2012). Likewise, Eagle Bulk Shipping (the largest U.S.-based owner of
Handymax dry bulk vessels) barely avoided bankruptcy by undertaking a major debt restructuring
in 2012. (See “Eagle Bulk Shipping Inc. Reaches Comprehensive Agreement With Lenders,”
Eagle Bulk Shipping Inc. New Release, June 20, 2012).
15Dos the Airline Industry Suffer from Overcapacity?
iv. Capacity Utilization
Finally, when an industry suffers from excess capacity, firms can sometimes reduce the
utilization of existing capital assets (e.g., factories, aircraft, etc.) as a way to
incrementally reduce output. It is important to emphasize that evaluating capacity
utilization in a given industry requires one to focus on the appropriate measure of
utilization, specifically the rate at which the industry’s principal capital assets are being
used. In some industries (e.g., automobile manufacturing), identifying the rate at which
the principal capital assets (i.e., factories) are being used is relatively straightforward.
For example, if car factories are operating at 60% of their collective capacity, this would
suggest the existence of industry overcapacity, while high utilization of automobile plant
capacity would imply the absence of excess capacity. 36 In other industries, however,
identifying the appropriate measure of capital asset utilization may be less obvious. 37
III. DOES THE AIRLINE INDUSTRY SUFFER FROM OVERCAPACITY?
We now turn to the question of whether the airline industry is currently suffering from
overcapacity, and, in particular, if there is currently overcapacity for international
36
The utilization of steel manufacturing capacity has also decreased from over 90% in 2008, to
between 73% and 80% currently. (See World Steel Association, Press Releases: “World crude
steel output decreases by -8.0% in 2009,” January 22, 2010; “World crude steel output increases
by 15% in 2010,” January 21, 2011; “World crude steel output increases by 6.8% in 2011,”
January 23, 2012; “World crude steel output increases by 1.2% in 2012,” January 22, 2013;
“April 2013 Crude Steel Production,” May 21, 2013). The dry bulk shipping industry has also
experienced a marked decrease in capacity utilization with capacity utilization rates dropping
from a peak of near 100% in 2008 to just above 80% in 2012. (See O. Hammer, “Commodity
Shipping Markets; Status and Outlook,” Presentation to RS Platou Seminar, Singapore,
December 7, 2012).
37
For example and as discussed below, in the case of airlines, the appropriate measure of capacity
utilization is the industry’s fleet utilization rate rather than the industry’s “load factor,” which
measures the percentage of seats filled. Load factors are not a reliable indicator of the existence
of excess capacity because they do not indicate how intensively airlines are operating their
“factories” (i.e., aircraft) or if the seats have been sold at a price sufficient to cover their cost of
production. Rather, high load factors simply reflect the “perishable” nature of an airline’s output
and the fact that the combination of high airline industry fixed costs and low marginal costs of
carrying an additional passenger creates strong economic incentives for airlines to fill empty seats
even when the prices they charge for those seats do not cover airlines’ full costs.
16Dos the Airline Industry Suffer from Overcapacity?
widebody aircraft. We begin by assessing whether the airline industry exhibits the
characteristics described in Section II-B above to see if it is an industry that could be
prone to prolonged periods of overcapacity (i.e., structural overcapacity).
A. THE AIRLINE INDUSTRY HAS THE CHARACTERISTICS OF INDUSTRIES SUBJECT TO
EXTENDED PERIODS OF OVERCAPACITY
i. Large and Irreversible Capital Investments
In order to enter and remain in business, airlines must make large capital investments—
and thus incur high fixed costs—for aircraft, assets that can only be used in the airline
industry. As a result, once those investments in aircraft are made, the assets have little or
no use outside of the airline industry. Moreover, airlines pay the fixed costs of aircraft
ownership regardless of whether or not its aircraft are flying. Consequently, the speed at
which airlines are able to profitably reduce capacity in times of overcapacity is limited,
and leads to extended periods of overcapacity. 38
ii. Long Planning Horizon for Capital Assets
In addition to their high fixed costs, commercial aircraft typically must be ordered well in
advance of delivery so that an aircraft order covers deliveries many years into the
future. 39 As a result, even though aircraft may have been ordered when the industry was
38
See, for example, Severin Borenstein and Nancy L. Rose, “How Airline Markets Work... Or Do
They? Regulatory Reform in the Airline Industry,” 2013, forthcoming in N. Rose ed., Economic
Regulation and Its Reform: What Have We Learned?, University of Chicago Press., p. 40: “…the
fundamental economics of the industry–volatile demand, high fixed costs, and slow supply
adjustment–combine to create an environment in which profits are likely to be change [sic]
quickly and drastically.” Moreover, these same factors also result in capacity that is clearly
uneconomic in the sense of covering its full costs of capital remaining in the industry. For
example, TWA, Eastern, and Pan American (among other airlines) each continued to operate for
many years without earning economic profits (covering their costs including capital) before
finally exiting the airline industry.
39
The average passenger widebody delivered since 2002 was ordered 3.4 years in advance.
Source: Ascend. In addition, according to recent reports, the two newest widebodies (the Boeing
787 and the yet to be delivered Airbus A350 XWB) have large back orders so that orders today
could not be delivered any time soon. For example, Airbus’ sales chief was quoted as saying “I
could sell many more if I had the production slots.” (Source: Robert Wall, “Airbus’s Biggest
17Dos the Airline Industry Suffer from Overcapacity?
not experiencing overcapacity, they may be delivered at a time of industry overcapacity
making it even more difficult to reduce capacity when needed. For example, Exhibit 5
shows widebody deliveries by year and demonstrates that even when the economy went
into a deep recession in 2009 (i.e., when the industry would have required a decrease
capacity to restore equilibrium) widebody deliveries continued at a high rate. The
inability of the industry to better adjust the timing of the deliveries of aircraft means that
capacity can continue to increase even as demand weakens. 40
EXHIBIT 5: WIDEBODY DELIVERIES VS. CHANGE IN GLOBAL GDP
250 247 5%
214 219
197
200 180 182 4%
169 171 168 168
158 161
Number of Widebodies Delivered
148 154
144
Worldwide GDP Growth Rate
150 132 137 131 3%
124 128
100 2%
50 1%
0 0%
-1%
-2%
-3%
Deliveries Worldwide GDP
Sources: Ascend; Avitas.
Note: Includes passenger aircraft only.
iii. Incentives for Firms to Wait to Adjust Capacity
The airline industry is also characterized by incentives that discourage carriers from
decreasing their capacity by the full amount needed for the industry to return to
profitability during periods of overcapacity. Because fares are determined by the overall
A350 Vindicated by BA Jet Order,” Bloomberg Businessweek, April 22, 2013) and British
Airways recently ordered additional 787s for delivery starting in 2017. (Source: “IAG Orders
More Boeing 787 Dreamliners,” Dow Jones Newswires, April 3, 2013).
40
While individual airlines can and do routinely defer scheduled aircraft deliveries for a later
date, the deferred aircraft are typically delivered to another airline that was not originally
scheduled to receive them at that time.
18Dos the Airline Industry Suffer from Overcapacity?
level of supply and demand, and because each individual carrier accounts for a relatively
small proportion of supply in any particular geographic region, individual carriers stand
to benefit from the capacity reductions made by their competitors. For example, if there
is a decrease in demand such that the industry as a whole requires 10% less output to
return to profitability, an individual carrier has the incentive to wait and see if other
carriers will decrease their output before reducing its own output. By adopting a “wait
and see” strategy, an airline can potentially benefit from the decrease in output by other
carriers without reducing its own, a characteristic observed by many airline industry
analysts. 41 In sum, even when the airline industry is experiencing overcapacity, the
incentives for individual airlines are such that some carriers will tend to be slow to adjust
capacity. 42
iv. Subsidies to Select Competitors
The airline industry has also been impacted by subsidies that are available to only a
subset of carriers. One of the primary subsidies has been financing guarantees by ECAs
that provide some airlines with below-market financing for the purchase of aircraft from
Boeing and Airbus. The eligible purchasers of Boeing aircraft receive subsidized
41
See, for example, Air Transport World, October 1990, p. 62: “Things are likely to get worse
before they get better… [U]nless some airlines begin retiring older jets… but no one wants to be
the first to cut capacity” (as quoted in Eldād Ben-Yôsēf, The Evolution of the US Airline Industry,
Springer, 2005, p. 94); and Scott McCartney, “Which Airline Will Blink First And Close a
Money-Losing ‘Hub,’” The Wall Street Journal, May 28, 2003: “What's clearly not simple in the
airline industry, though, is how air carriers can actually reduce their capacity. Some hubs have to
go. But no airline wants to go first.” Similarly, an analyst report noted that, “In game theory,
prisoner’s dilemma explains how individually rational behavior can lead to a collectively
irrational outcome. A similar phenomenon occurs in the airline industry: Because of the
perceived benefits of growing … the industry ends up creating excess supply ….” (Source:
“Industry Primer: A Bad Business Getting A Bit Better,” Bank of America Merrill Lynch,
September 27, 2011, p. 4).
42
One academic researcher surveyed airline managers to determine what barriers they perceived
to exiting unprofitable markets. In the survey, 65% responded that one barrier was that “Exit
might improve competitor’s strategic position.” See Mirko C.A. Schnell “Existence and
effectiveness perceptions of exit-barrier factors in liberalised airline markets,” Transportation
Research Part E, 42, 2006, p. 235.
19Dos the Airline Industry Suffer from Overcapacity?
financing through the Bank and purchasers of Airbus aircraft receive subsidized
financing through at least one of the three European ECAs that currently finance Airbus
purchases. 43 These ECAs operate according to an Aircraft Sector Understanding
(“ASU”) 44 as well as an informal agreement which precludes them from providing
financing assistance to carriers based in a country that is a primary manufacturer for
Boeing or Airbus aircraft (i.e., the United States, France, Germany, Spain, and
England). 45 Hence, while British Airways cannot obtain subsidized financing to
purchase either Airbus or Boeing aircraft, Ryan Air (based in Ireland) has received over
$6 billion of Ex-Im backed financing to purchase Boeing Aircraft. Exhibit 6 shows the
top recipients of ECA financing. 46 Because some airlines are both in the top 20 for Ex-
Im and European ECA financing, there are a total of 30 carriers that are defined as top
recipients.
43
See footnote 9 above.
44
“Sector Understanding on Export Credits For Civil Aircraft,” Organisation for Economic Co-
operation and Development, September 1, 2011. The 2011 ASU is a revision to the 2007 ASU
and that took effect February 1, 2011. However, aircraft that were purchased on or before
December 31, 2010, and delivered on or before December 31, 2012, were not subject to the new
rules. Therefore, the new ASU largely did not affect aircraft financing until January 1, 2013.
The 2011 ASU introduces risk premia and may lessen the advantage to ECA financing in the
future. See David Knibb, “IN FOCUS: How New Export Credit Rules Will Change Aircraft
Finance,” Airline Business, January 22, 2013.
45
See David Knibb, op. cit.
46
For the purposes of our study, we define the top ECA recipients as being either one of the top
20 recipients of Ex-Im financing (from 2000 through 2012) and/or one of the top 20 recipients of
ECGD (one of the three European ECAs) financing (from 2000 through 2011). Of the European
ECAs, only ECGD lists the recipients and the purpose of the financing.
20You can also read