Environmental Assessment and Regulatory Aspects of Cold Ironing Planning for a Maritime Route in the Adriatic Sea
←
→
Page content transcription
If your browser does not render page correctly, please read the page content below
Article

Environmental Assessment and Regulatory Aspects of Cold
Ironing Planning for a Maritime Route in the Adriatic Sea
Tobia Piccoli 1, Matteo Fermeglia 2, Daniele Bosich 1,*, Paolo Bevilacqua 1 and Giorgio Sulligoi 1

 1 Department of Engineering and Architecture, University of Trieste, 34127 Trieste, Italy;
 tobiapiccoli@gmail.com (T.P.); paolo.bevilacqua@dia.units.it (P.B.);
 gsulligoi@units.it (G.S.)
 2 Faculty of Law, Hasselt University, 3500 Hasselt, Belgium; matteo.fermeglia@uhasselt.be

 * Correspondence: dbosich@units.it

 Abstract: The technology of cold ironing (or shore‐to‐ship power) can meaningfully reduce green‐
 house gases and air pollutant emissions from ships at the berth by powering the vessels from the
 electrical shore grid. While cold ironing constitutes an effective and affordable solution in northern
 Europe and America, economic, legal, and environmental factors still render this technology less
 attractive in southern Europe. This paper aims to unpack and analyze the economic, regulatory, and
 environmental factors that can foster cold ironing as a standard installation in the Mediterranean
 Sea. Based on a model design for the port of Trieste (Italy) as applied to a cluster of target ports in
 the Adriatic Sea (in Italy, Croatia, and Greece), this article evaluates the cold ironing payback period
 by comparing costs of shore side‐plants with environmental externalities and O&M costs. Moreover,
 the paper addresses key regulatory bottlenecks arising in different European jurisdictions with re‐
 gard to the setting‐up and development of cold ironing, while appraising the legal and economic
 consequences of deploying cold ironing in light of the future inclusion of the maritime sector in the
 EU Emission Trading System.
Citation: Piccoli, T.; Fermeglia, M.;
Bosich, D; Bevilacqua, P.; Sulligoi,
 Keywords: cold ironing; shore‐to‐ship power; port electrical grid; environmental externalities; CO2
G.; Environmental Assessment and
 emissions; social cost of carbon; ETS
Regulatory Aspects of Cold Ironing
Planning for a Maritime Route in the
Adriatic Sea. Energies 2021, 14, 5836.
https://doi.org/10.3390/en14185836
 1. Introduction
Academic Editor: Andrea Mariscotti Air pollution and climate change pose serious risks to public health [1–4]. It is neces‐
 sary to activate integrated policies aimed at combating air pollution and mitigating cli‐
Received: 27 July 2021 mate change by encouraging forms of clean‐sustainable energy production [5,6]. The ad‐
Accepted: 7 September 2021 vantages that can be obtained are greater than the costs necessary for their implementa‐
Published: 15 September 2021
 tion. The present paper wants to explore this trend towards energy transition in the con‐
 text of large ship‐powering. This work focuses on a possible intervention to reduce air
Publisher’s Note: MDPI stays neu‐
 pollution and greenhouse gas (GHG) emissions concerning maritime transportation [7–
tral with regard to jurisdictional
 9]. The cold ironing (also known as shore connection) is a port‐based emission‐reduction
claims in published maps and institu‐
 technology that reduces emissions generated from the auxiliary engines of a ship using
tional affiliations.
 shore‐based electric power. As the ship is supplied from the land during the cold ironing’s
 berthing, the polluting‐GHG emissions are completely avoided. When the required en‐
 ergy is given by renewable sources, the ship becomes sustainable, thus ready for the tran‐
Copyright: © 2021 by the authors. Li‐ sition towards the green era. In particular, this paper considers the implementation of this
censee MDPI, Basel, Switzerland. system in the Mediterranean context, which is the second largest cruise market in the
This article is an open access article world in terms of turnover and passengers, although the implementation of this technol‐
distributed under the terms and con‐ ogy proceeds with difficulties. While the shipping sector plays an essential role in the EU
ditions of the Creative Commons At‐ economy and still represents one of the most energy‐efficient modes of transportation, it
tribution (CC BY) license (http://crea‐ accounts for 3–4% of all EU CO2 emissions, totaling to around 138 million tons of CO2 in
tivecommons.org/licenses/by/4.0/). 2018 [10]. Future outlooks project emissions from transportation to increase by 32% by

Energies 2021, 14, 5836. https://doi.org/10.3390/en14185836 www.mdpi.com/journal/energies
Energies 2021, 14, 5836 2 of 32

 2030 if mitigation measures are not swiftly introduced, with international maritime trans‐
 portation topping to 155 million tons of CO2 in 2030 [10]. To this end, in the broader policy
 context of European Green Deal, the European Commission is championing the inclusion
 of the shipping sector in the European Union Emission Trading System (EU ETS), which
 operates as the pivotal carbon pricing mechanism in the EU [11,12]. As a market‐based
 mechanism, the ETS aims to foster investments in more energy‐efficient and less GHG‐
 intensive technologies, while posing additional economic burdens on GHG‐intensive ac‐
 tivities [13]. To embed the maritime sector in ETS, however, is all but an easy task, as it
 can trigger undesired feedback loops as an economic impact on shipping companies [14].
 The present paper is organized in the following way. The study in Section 1 gives an
 overview of shore connection platforms, while Section 2 reviews the methodology fol‐
 lowed in this study. As a first example of cold ironing, Section 3 investigates a shore con‐
 nection design for the cruise port of Trieste. The same approach introduced for this first
 case is later applied on several ports in an Adriatic route crossing some ports in Italy,
 Croatia, and Greece. Then, Section 4 and 5 introduce an advanced model for the calcula‐
 tion of atmospheric pollution emitted by auxiliary ship engines. The proposed model can
 evaluate the environmental externalities saved if the cold ironing technology is applied in
 the docks to replace the use of internal combustion engines for the ships supply. Section
 6 adopts the procedure explored in Section 4, highlighting a database that is developed to
 evaluate and quantify the effect of cold ironing for the entire cluster of ports of the Adriatic
 route. Section 7 navigates the legal and policy context for the inclusion of shipping in the
 EU ETS, while pinpointing the role of cold ironing technologies for the purposes of the
 sound application of the same ETS. Thus, this paper also investigates the legal framework
 supporting the adoption and up‐scaling of shore connection within the context of the fu‐
 ture inclusion of maritime transportation in the European Union Emission Trading Sys‐
 tem. In this context, the paper elaborates on and contributes to the growing body of legal
 scholarship dealing with the regulation of pollutants and greenhouse gas (GHG) emis‐
 sions from shipping, with specific regard to cold ironing as an emission reduction tech‐
 nique. Section 8 concerns the impact of CO2 emissions and social cost of carbon. The role
 of cutting‐edge technologies such as cold ironing should be duly appraised to ensure that
 the several environmental, economic, and social benefits delivered by its application are
 duly reflected in the application of market‐based approaches to CO2 emission mitigation
 in the EU. Section 9 proposes a results discussion, while the conclusions are in Section 10.

 2. Methodology
 The methodology is aimed at drafting a cost/benefit analysis of cold ironing in a clus‐
 ter of ports. To correctly formalize the analysis, the study is based on two references: a)
 the “guidelines for the preparation of cost‐benefit analyzes issued by the European Com‐
 mission” for the economic part and b) the “guidebooks issued by the European Environ‐
 ment Agency” for the emissions estimation. The procedure identifies the benefits (e.g.,
 avoided environmental externalities), costs (e.g., installation, O&M), and ETS contribu‐
 tion. To this aim, ten steps are necessary. Regarding benefits: (1) to define a cluster of
 cruise piers/ports along a maritime route; (2) to determine fuel consumption and hourly
 emissions at mooring for all cruises arriving in these ports; (3) to determine the avoided
 emissions in these ports due to cold ironing; and (4) to identify the avoided environmental
 externalities in these ports due to cold ironing. Regarding costs: (5) to size each shore con‐
 nection installation; (6) to establish installation/operating costs of cold ironing based on
 market research regarding the best players; and (7) to quantify the cost of each platform
 to be installed along the route. Regarding the ETS: (8) to define different CO2 exchange
 targets on the EU ETS (past, present, and future); (9) to combine the targets with the
 avoided CO2 emissions; and (10) to observe/quantify how the CO2 market can impact the
 shore connection feasibility in the cluster. Finally, the legal analysis carried out in Section
 7 consists of desk‐based research to review the main legal documents and available liter‐
 ature on the ETS and the shipping sector.

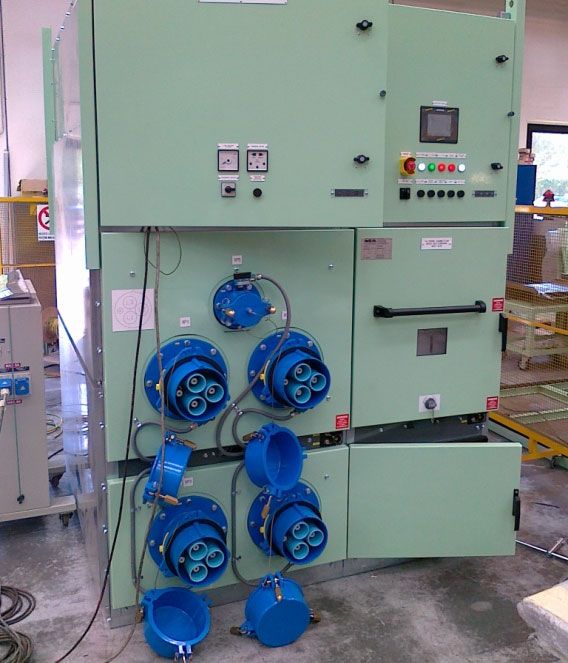
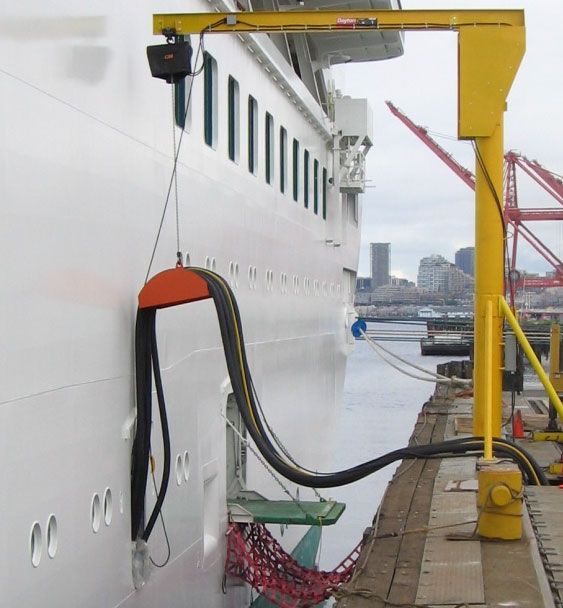
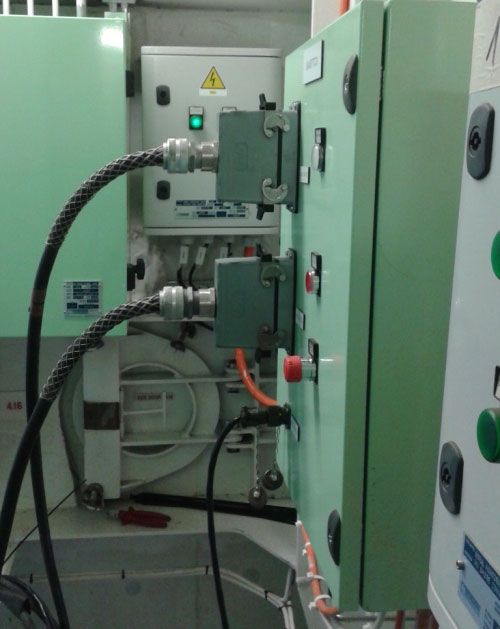
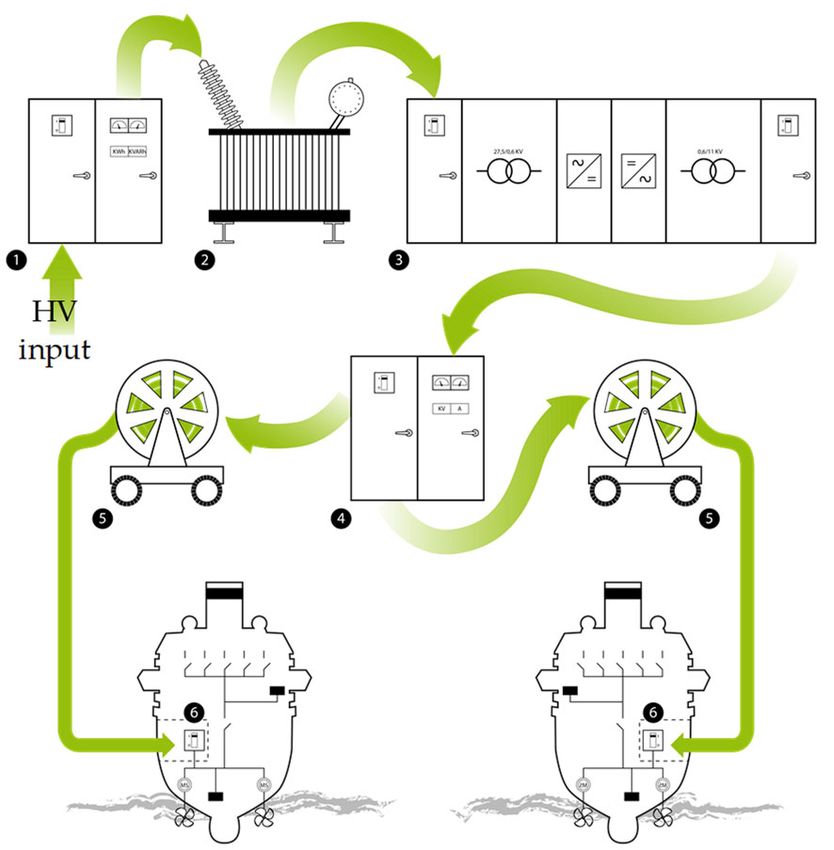
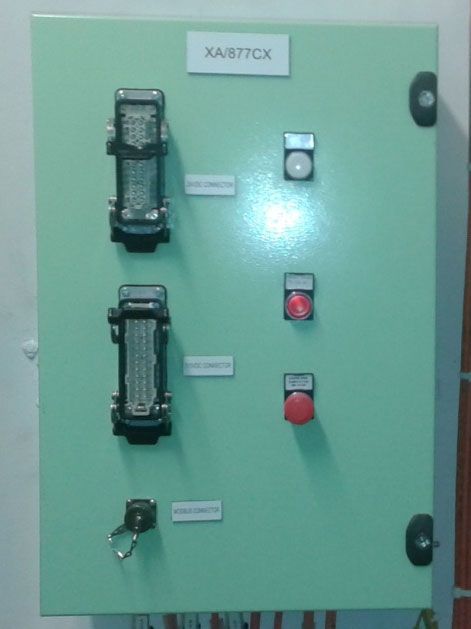
Energies 2021, 14, 5836 3 of 32

 3. Overview of Shore Connection Platforms
 In recent years, the challenge towards sustainability is becoming crucial also in the
 marine sector. Such a trend is not only observable in the design of large all‐electric ships
 [15] but also in the development of port facilities [16]. If high‐efficiency motors, controlled
 drives, and electrical propulsion can greatly reduce the onboard carbon impact, innova‐
 tive solutions are also investigated to lower or even avoid the emissions during mooring
 [17,18]. Conventionally, a ship at berth adopts the onboard generators to feed the technical
 services and hotel loads, whose total power demand can reach 10–15 MW for each large
 vessel. As a consequence, during berthing, the ship becomes a point‐source of air pollu‐
 tion (i.e., NOx, SOx, and particulate matter) [2] and GHG emissions [19]. To solve this
 matter, the so‐called cold ironing can locally remove emissions by supplying the moored
 ship from the terrestrial electrical grid [20–22]. Although such a technique is well‐known
 in the supply/recharge of small low‐voltage (LV) ships [23,24], environmental awareness
 has moved the focal point to large‐power demanding vessels [7–9]. In this case, the appli‐
 cation takes the name of high‐voltage shore connection (HVSC), as the supply voltage to
 deliver a considerable power (i.e., tens of MW) to the onboard loads during the ship berth‐
 ing is high [25]. To define technical issues and solutions to enable the high‐power cold
 ironing, not only IEEE standards [7–9] but also several scientific publications [17,18,20–
 22,25–30] have largely investigated the HVSC topic in the last years.
 At a glance, the HVSC is quite a standard high‐voltage high‐power platform to feed
 the stationary shipboard loads, while challenges arise when considering the limitations in
 capacity, both in port distribution and in port supply line [25]. Secondly, galvanic corro‐
 sion [31] and high‐touch voltages during phase‐to‐ground faults [32,33] are also important
 issues to be faced in a HVSC system. As the HVSC system aims to switch‐off the polluting
 diesel–electrical generators at mooring, alternative LNG solutions [34] or even renewable
 sources [35] are to be taken into account when foreseeing the land electrical power pro‐
 duction. To understand the HVSC structure [7–9], a functional scheme is presented in Fig‐
 ure 1. Here, several subsystems that deliver power to the berthed vessel are depicted: (1)
 HV input (port grid); (2) HV/MV transformer (port grid); (3) AC/AC power converter (e.g.,
 50/60 Hz 16 MVA); (4) MV distribution cabinet (optional); (5) Cable dispenser; and (6) ship
 MV cabinet. Therefore, the HV port supply (>100 kV, 132 or 220 kV in Italy) is transformed
 into the MV medium‐voltage level (i.e., 20–40 kV, 27.5 kV in Italy) at step (2). Then, the
 power conversion at step (3) is necessary for interface systems with different frequencies,
 thus the land grid is at 50 Hz and shipboard system is at 60 Hz. This subsystem is consti‐
 tuted by three components: a step‐down transformer (27.5/0.6 kV), an AC‐DC diode rec‐
 tifier in the middle, a DC‐AC inverter to make available the AC voltage at 600 V, and
 finally a step‐up transformer to provide the final voltage at 11 kV. Step (4) is the distribu‐
 tion cabinet for powering the cable dispenser at step (5). Finally, at step (6), the cable is
 connected to the shipboard power grid, usually operated at 11 kV. Evidently, different
 ratios characterize the electrical components when the ship presents the main distribution
 at 6.6 kV. During the hours in which a hypothetical cruise ship is fed by the cold ironing
 infrastructure, a particular crane (Figure 2) is adopted for the interconnection among land‐
 ship grids. In order to specify all the recommendations when performing the HVSC, the
 IEEE standards [7–9] not only provide the online diagram (Figure 3) but also the signals
 whose coordination/management ensures the correct supply (Figure 4). Specific for a
 cruise liner, electrical cabinets are to be installed onboard to guarantee the interface to‐
 wards the land grid. In this regard, Figure 5 shows the switchboard, while the control
 cabinet is depicted in Figure 6. Besides the standard infrastructure described so far, Figure
 7 highlights the eventuality of single‐phase fault at the delivery point. This case deserves
 attention in terms of electrical safety, as the ship behaves as a peculiar appendix of the
 port–earth system; thus, possible issues of touch voltages during faults can arise. To con‐
 veniently understand the overall interest in HVSC platforms, the Table 1 provides infor‐
 mation [36–38] on worldwide cold ironing installations in the period of 2000–2017.
Energies 2021, 14, 5836 4 of 32

 Figure 1. High‐voltage shore connection system.

 Figure 2. Dedicated crane [25].
Energies 2021, 14, 5836 5 of 32

 Figure 3. One‐line diagram of the HVSC plant [25].

 Figure 4. Signals managed by the HVSC control cabinet [25].
Energies 2021, 14, 5836 6 of 32

 Figure 5. Switchboard for shore connection purposes [25].

 Figure 6. Shore connection control cabinet [25].

 Figure 7. Port with a HVSC system supply by a HV > 100 kV primary line with a single‐phase fault at delivery point [25].

 Table 1. HVSC installations worldwide: 2000–2017 period [36–38].

 Year Port Country Capacity (MW) Frequency Voltage (kV) Ship Type S
 2000 Gothenburg Sweden 1.25–2.5 50 & 60 6.6 & 11 RoRo, RoPax
 2000 Zeebrugge Belgium 1.25 50 6.6 RoRo
 2001 Juneau USA 7–9 60 6.6 & 11 Cruise
 2004 Los Angeles USA 7.5–60 60 6.6 Container, cruise
 2005 Seattle USA 12.8 60 6.6 & 11 Cruise
 2006 KEMI Finland 50 6.6 RoPax
 2006 KotkaI Finland 50 6.6 RoPax
 2006 Oulu Finland 50 6.6 RoPax
 2008 Antwerp Belgium 0.8 50 & 60 6.6 Container
 2008 Lübeck Germany 2.2 50 6.6 RoPax
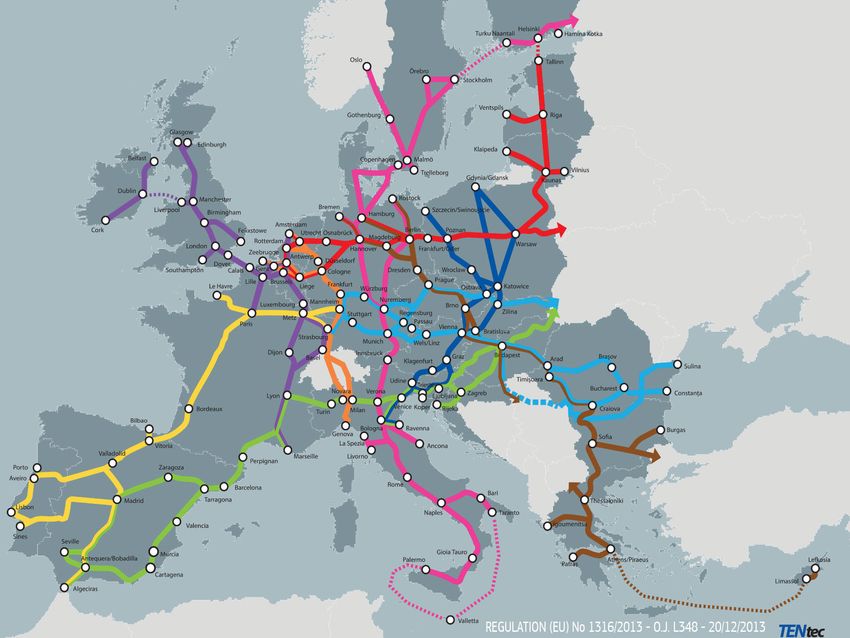
Energies 2021, 14, 5836 7 of 32

 2009 Vancouver Canada 16 60 6.6 & 11 Cruise
 2010 San Diego USA 16 60 6.6 & 11 Cruise
 2010 San Francisco USA 16 60 6.6 & 11 Cruise
 2010 Karlskrona Sweden 2.5 50 11 Cruise
 2011 Long Beach USA 16 60 6.6 & 11 Cruise
 2011 Oakland USA 7.5 60 6.6 & 11 Container
 2011 Oslo Norway 4.5 50 11 Cruise
 2011 Prince Rupert Canada 7.5 60 6.6 Container
 2012 Rotterdam Netherlands 2.8 60 11 RoPax
 2012 Ystad Sweden 6.25 50 & 60 11 Cruise
 2015 Bergen Norway 1 50 & 60 0.440/0.690
 2017 Marseille France 4 60 11 Ferry
 S: RoRo (i.e., Roll‐on/Roll‐off) and RoPax (Roll‐on/roll‐off Passengers).

 4. Shore Connections on the Adriatic Route
 To follow the global requests in system sustainability and eco‐friendliness, impres‐
 sive developments are expected to be applied also on port infrastructures. Here, not only
 are wise energy management [39], peak‐shaving solutions [40], or new port cranes supply
 [41] day‐by‐day becoming a reality, but even innovative microgrid architectures play a
 decisive role when the overall energy management is to be improved [42–46]. Nowadays,
 such a modernization is foreseeable in the industrial ports with real‐time measurements
 of energy flows [47,48], as well as in the cruise ships port, in which conversely the main
 goal is the emissions removal during berthing [20–25]. This work investigates the last
 above aspect, for which a shore connection design for the cruise port of Trieste is taken as
 an example to develop a methodology to be further applied on the several ports in the
 Adriatic route. Although the present cold ironing installations in Europe (Table 1) are
 mainly gathered in the north part (e.g., Finland, Norway, and Sweden), the present paper
 is aimed at opening a shore connections scenario also for the countries in the Mediterra‐
 nean region. To do this, the expected advantages and challenges of cold ironing are to be
 extended to an entire route which crosses the seas of Italy, Croatia, and Greece.

 4.1. The Trieste Cruise Port Case Study
 Trieste is a city located in the north‐eastern part of Italy. Such a position in the heart
 of Europe near the border to Slovenia and Croatia is crucial when concerning commercial
 flows, business, and tourism. Trieste has based its life and success on the industrial port,
 which now is the first Italian port in freight traffic [47,48]. The depth of the backdrop from
 up to 18 m constitutes the luck on which national/international finance and politics sectors
 have invested in, especially in the last years. As a matter of fact, Trieste is an intermodal
 hub as the EU N°1315/2013 regulation considers its port as one of the Trans‐European
 Transport Network (TEN‐T) core ports. All over Europe, the TEN‐T is a wide network of
 railway lines, roads, inland waterways, maritime shipping routes, ports, airports, and rail‐
 road terminals. In such a context, the core network (Figure 8) includes the most important
 connections, then linking the most important nodes.
 If the industrial port in the periphery makes Trieste an important hub for the move‐
 ments of goods and oil towards northern Europe [47,48], tourism is developed in the city
 center’s port. Here, the cruise ships find their location when mooring in front of the main
 square. In the following, the Trieste cruise port is an example on which to design a com‐
 plete shore connection platform. Once the study methodology is developed for the single
 cold ironing in Trieste, it can be replicated/tailored for the other ports of the Adriatic route.
 The initial data/method are previously determined by some authors of this paper as part
 of their research activity. Whether the focus is on a single port or on a route, the goals are
 the following.
Energies 2021, 14, 5836 8 of 32

 a. To evaluate emissions (polluting and GHG) and environmental costs pre/post the
 shore connection installation in the Trieste cruise terminal (Tables 2 and 3).
 b. To estimate the HVSC plant costs and running costs (operation, maintenance, and
 employees) during the entire plant life.
 c. To define costs for ship‐owners.
 d. To find the payback period when implementing the Trieste cold ironing.
 Firstly, the analysis at point (a) rests on the following assumptions:
 1. the NOX, SOX, NMVOC, PM10, and PM2.5 are the considered pollutants;
 2. CO2 is also taken into account as a GHG;
 3. the electrical supply of the shore connection platform is assumed to be based on re‐
 newables sources, otherwise the pollutants abatement is only partial; and
 4. the pollutant costs to define the externalities are reported in [49] from the EEA (Eu‐
 ropean Environment Agency, 2011) and in [50] from the EEA (2014).

 Figure 8. Core network corridors (https://ec.europa.eu/transport/themes/infrastructure/ten‐t_en).

 In order to identify emissions and environmental externalities, a convenient proce‐
 dure follows the steps from (A) to (D). In the following, each step is explained:
 A. To collect the mooring data (i.e., vessel name, gross tonnage, and day and hour of
 arrival and departure) for the port under study.
 B. To empirically determine [51] the Cmooring/day daily fuel consumption at berth (2) for
 each vessel. The gross tonnage is named GTon, while C100 is the average daily con‐
 sumption with full power (100%) as in (1).

 16.904 0.00198 ⋅ ton⁄day (1)

 / ⋅ 0.32 ton⁄day (2)

 C. To calculate the yearly emission of each pollutant (tons) for all the vessels (3), where
 Ei,p means port/pollutant emission, i identifies the specific pollutant, p represents the
 port, and k represents the vessel. Then, tk,p is the mooring time of the k‐th vessel in
 port p and Fi represents the emission factor of the i‐th pollutant.
Energies 2021, 14, 5836 9 of 32

 , / ⋅ , ⋅ ton⁄day (3)

 D. To determine the monetary (EUR) externalities Qi,p correlated to each port/pollutant
 (4). In the last equation, i is the pollutant, p identifies the port, and X is the cost per
 tons of emitted pollutant for each cruise vessel.

 , , ⋅ , EUR (4)
 Once Equation (4) is calculated, the environmental externalities (i.e., EUR 1.58 mil‐
 lion/year positive input in the cash flow), costs of the HVSC platform, and O&M for 25
 years life (i.e., negative inputs) are to be specified. The latter are in Tables 4 and 5 for a
 cold ironing installation in the Trieste cruise port when the HV delivery from TSO is as‐
 sumed to be available, thus its purchase is out from the study. It is important to point out
 that plant costs (about EUR 4 million) are obtained by cross‐checking the datasheets from
 international electrical companies. In addition, the assessment of O&M costs (about EUR
 6 million) is based on an evaluation with the local DSO and historical price data in the
 past 25 years. When the inputs are ready, the cash flow of Figure 9 can establish a remark‐
 able payback period of 3 years. The investment sustainability is thus evident.

 Figure 9. Avoided externalities vs. installation and O&M costs (Trieste cold ironing, 25 years of plant life).

 Table 2. Emissions abatement with cold ironing in Trieste (2015).

 Δ NOX Δ 2.7% 1 SOX Δ 1.5% 1 SOX Δ 0.5% 1 SOX Δ CO2 Δ VOC Δ PM10 Δ PM2.5
 Location ton ton ton Ton ton ton ton ton
 Trieste 52.9 67.8 37.7 12.6 4019.5 7.3 11.5 11.5
1The study considered the SOX abatement with different sulfur tenor, assuming possible regulatory restrictions (i.e., SECA
areas).

 Table 3. Environmental externalities per year reduced by adopting cold ironing in Trieste.

 Case 2.7% SOX Case 1.5% SOX Case 0.5% SOX
 Δ min 1 Δ max 1 Δ min 1 Δ max 1 Δ min 1 Δ max 1
 Location Million euros Million euros Million euros Million euros Million euros Million euros
 Trieste 2.39 7.40 1.95 6.08 1.58 4.90
1 Minimum and maximum values are due to different evaluation methods to determine the environmental costs.
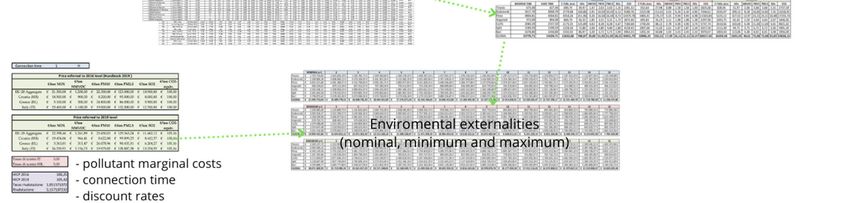
Energies 2021, 14, 5836 10 of 32

 Table 4. HVSC plant costs (hypothesis for Trieste, 2015).

 Element Cost (EUR)
 MT switchgears 32.00 k
 Converter 16 MVA 11 kV 60 Hz 3450.00 k
 Cable dispenser 150.00 k
 Design and construction (20%) 726.40 k
 Total 4358.40 k

 Table 5. HVSC O&M costs (hypothesis of 25 years of life).

 Element Cost (EUR)
 MV substation 1111.80 k
 Converters and cable dispenser 4512.50 k
 Total 5624.30 k

 4.2. The Three EU Countries’ Adriatic Route
 As a matter of fact, the cold ironing infrastructures are mainly installed in the north‐
 ern seas [26–28]. The reasons of this trend include the high energy costs, which, in south‐
 ern Europe, penalize the ship supply from land at berth. Secondly, environmental regula‐
 tion [2] may also not be able to effectively force this technology in the Mediterranean Sea,
 albeit the enchanting natural beauty. To overcome this issue, one possibility is the cluster‐
 ing, thus a practical way to extend risks but also benefits towards different countries. Con‐
 cerning the Adriatic Sea, a first idea can consider three EU European countries, namely
 Italy, Croatia, and Greece. The choice of the cruise terminals to be included in the cluster
 considers a route for which Trieste (Italy) plays as a home‐port. Then, Split and Dubrovnik
 are the stops in Croatia, while Corfù, Argostoli, and Piraeus are the terminals for Greece,
 and the final stop is in Bari (Italy) before the way back to Trieste. The cluster is surely a
 key factor to foster cold ironing as a standard technology also in southern Europe seas.
 Indeed, when several are electrified terminals, the onboard implementation becomes eco‐
 nomically viable for ship‐owners due to the increased utilization factor. On one hand, the
 coordinated implementation of shore connections in a cluster needs to develop common
 strategies, but on the other hand, it allows to speed up the cold ironing spread. From a
 perspective of a fully integrated European energy market, massive purchasing of energy
 to power the cold ironing’s cluster can allow for energy price reduction, pushing up the
 HVSC penetration.

 5. Model for Evaluating the Environmental Externalities
 Without cold ironing technology, cruise ships must keep auxiliary engines turned on
 during berthing in order to feed, among others, the HVAC services. The consequent neg‐
 ative effects of pollution (e.g., health effects, crop losses, material/building damages, and
 biodiversity loss) are impressive [1,2,25], while the new iniative to cut GHG emissions [3]
 additionally forces a change in the energy paradigm. Since these negative effects are not
 reimbursed by ship‐owners, ship emissions directly have an impact on collectivity as ex‐
 ternalities [25]. In such a regard, national/international best practices [52,53] recognize
 these externalities as key factors when assessing the HVSC feasibility. In general, the esti‐
 mation of environmental cost is not an easy activity to be performed. In the case of those
 related to transports, the European Commission has provided procedures to evaluate the
 “user pays‐polluter pays” in EU states [54], as well as the marginal external costs of all
 transportation modes. The costs in Table 6 are express the 2016 price levels, hence updated
 to the 2019 year by the HICP (Harmonized Index of Consumer Price) as in (5).
Energies 2021, 14, 5836 11 of 32

 To calculate the P2019 environmental cost of 2019, the HICP2019 is to be subdivided by
 the HICP2016. The result is then multiplied by the P2016 cost in order to finally harmonize
 the calculus. In (5), both HICP are obtained from the EU‐28 Eurostat database, in which
 HICP2016 = 100.25 and HICP2019 = 105.42. As to the countries in the Adriatic route (CR‐GR‐
 IT), the initial data (2016) are reported in Table 6, whereas the values updated by (5) are
 in Table 7. In both tables, the environmental costs are referred to as NOX, NMVOC, SO2,
 PM2.5, PM10, and CO2. The vessel damage (i.e., environmental externalities) is finally found
 by multiplying the cost parameters (Table 7) by the polluting‐GHG emissions from a spe‐
 cific source (e.g., cruise ships). The following step‐by‐step procedure provides all the in‐
 formation to precisely quantify the negative factors to be avoided by the HVSC.

 ∙ EUR/ton (5)

 Table 6. Environmental costs for CR‐GR‐IT (2016, PM2.5 referred to urban areas) [54].

 EUR/ton EUR/ton
 EUR/ton NOX EUR/ton PM2.5 EUR/ton PM10 EUR/ton CO2eq
 NMVOC SO2
 EU‐28 Aggregate 21,300.00 1200.00 10,900.00 123,000.00 22,300.00 100.00
 Croatia (CR) 18,500.00 900.00 8000.00 95,000.00 8200.00 100.00
 Greece (GR) 5100.00 300.00 5900.00 86,000.00 24,800.00 100.00
 Italy (IT) 25,400.00 1100.00 12,700.00 132,000.00 19,000.00 100.00

 Table 7. Environmental costs for CR‐GR‐IT (2019, data used in this paper).

 EUR/ton EUR/ton
 EUR/ton NOx EUR/ton PM2.5 EUR/ton PM10 EUR/ton CO2eq
 NMVOC SO2
 EU‐28 Aggregate 22,398.46 1261.89 23,450.03 129,343.24 11,462.12 105.16
 Croatia (CR) 19,454.06 946.41 8622.88 99,899.25 8412.57 105.16
 Greece (GR) 5363.01 315.47 26,078.96 90,435.11 6204.27 105.16
 Italy (IT) 26,709.91 1156.73 19,979.85 138,807.38 13,354.95 105.16

 Step‐by‐Step Procedure to Quantify the Cluster Emissions and Environmental Costs
 A. Select the ports forming the cluster. Here, the cruise ships are supposed to be stopped
 for the time at which they produce polluting‐GHG emissions.
 B. Collect the available data [55–62] on cruise moorings for each cluster’s port in the
 reference year (2019, the last before COVID‐19). The necessary information are in Ta‐
 ble 8, for which the cold ironing time is obtained by Equation (6). The latter takes into
 account the time at which the ship is supposed to be fed by the HVSC system. In
 Equation (6), one hour is generally considered the standard time for plug‐in and
 plug‐out operations. Without the HVSC infrastructure, the time in Equation (6) is
 spent powering the ship by fuel (i.e., marine diesel oil), thus increasing the polluting‐
 GHG emission outcome.

 1 hour (6)

 C. Determine the emission factor of each undesired substance (NOX, NMVOC, PM10,
 PM2.5, and CO2), which reflects the quantity emitted when burning a ton of fuel. Evi‐
 dently, the factors are strictly dependent on the engine type, fuel type, and navigation
 phase (cruise, maneuvering, and hoteling). As these data are not completely available
 for all the vessels (Table 8), weighted average emission factors are calculated to sim‐
 plify the analysis. For the considered substances, the average in Equation (7) weighs
 the emission factors for every engine type depending on the incidence of that engine
 in respect to the cruise world fleet [63]. In Equation (7), each i‐th undesired substance
 is quantified by the Fi emission factor, a dimensionless term (i.e., g emissions/ton
Energies 2021, 14, 5836 12 of 32

 fuel), whereas the index e represents the engine type and we is the percentage of the e
 engine type in respect to the world cruise fleet (Table 9). When “fuel” is not reported
 in the mass unit of measure, the related quantity is to be intended as a polluting‐GHG
 emission. Conversely with “fuel”.

 ∑ , ∙
 ∑ g/tonfuel (7)

 D. To increase the comprehension, it is important to observe that the method in Equa‐
 tion (7) follows the same methodology commonly used when determining Cspec (i.e.,
 specific fuel consumption of the cruise fleet). Indeed, in Equation (8), the term we has
 the same meaning already observed in Equation (7), while Ce is the specific fuel con‐
 sumption. Evidently, the calculus in Equation (8) is fundamental when seeking the
 specific fuel consumption at the mooring.

 ∑ ∙
 ∑ gfuel/kWh (8)

 E. Only the emission factor for sulfur oxides (SOx) is assessed by a different approach.
 As it depends on only the fuel, in Equation (9), the undesired substance is weighed
 by adopting the S percentage of the sulfur content in the fuel. In our case, the last
 number is equal to 0.1 as in the European moorings’ regulations.

 20 ∙ S kg/tonfuel (9)

 F. For the five substances under consideration, Table 10 provides the emission factors
 of the main/auxiliary engines. As all this data have a sensitive margin of error, the
 results take into account the “rated” value, but also “minimum‐maximum” values
 correlated to uncertainties (Table 11).

 Table 8. Dataset for each port of the cluster.

 Date Vessel Time of Arrival Time of Departure Mooring Time Cold Ironing Time

 Table 9. Statistical distribution of engine and fuel types for the Mediterranean cruise fleet.

 MSD
 GT BFO GT MDO HSD BFO HSD MDO MSD BFO SSD BFO SSD MDO ST BFO ST MDO
 MDO
 3.29% 4.79% 1.76% 3.68% 76.98% 5.68% 3.81% 0.00% 0.02% 0.00%

 Table 10. Emission factors for the different undesired substances (main/auxiliary engines).

 Pollutant‐GHG Unit Main Engines Auxiliary Engines
 NOX g/kWh 9.80 13.45
 NMVOC g/kWh 1.38 0.40
 PM10–2.5 g/kWh 2.14 0.75
 SOX kg/ton fuel 2.00 2.00
 CO2 g/kWh 750.00 750.00
 Table 11. Estimated uncertainties given as a percentage related to the emission factors.

 Pollutant‐GHG At Sea Maneuvering Mooring
 NOX ±20% ±40% ±30%
 SOX ±10% ±30% ±20%
 NMVOC ±25% ±50% ±40%
 PM10–2.5 ±25% ±50% ±40%
 CO2 ±10% ±30% ±20%
 [Fuel Consumption] ±10% ±30% ±20%
Energies 2021, 14, 5836 13 of 32

 G. Build the vessel database, whose structure is reported in Tables 12 and 13. This data‐
 base plays a crucial part in this work as it contains all the data regarding consump‐
 tion, power, and emission for the considered ships. This information is used to esti‐
 mate the abatement due to the cold ironing implementation. When Pmain,100% and
 Paus,100% are not directly available from literature, Table 12 can be completed by using
 Equations (10) and (11) from [63].
 .
 , % 42.966 ∙ MW (10)
 , % 0.27 ∙ , % MW (11)
 Conversely, the berth values Pmain,mooring and Paux,mooring are 20% and 40% of the rated
 values, respectively [63]. As the main engines operate for only 5% of the mooring time,
 the specific fuel consumption at the berth results as in Equation (12). Equation (13) is
 needed to verify the units of measurement:
 ∙ , % ∙ 0.05 , % ⁄10 ton/h (12)
 gfuel 1 tonfuel
 ∙ MW ∙ 10 (13)
 kWh 10 h
 H. The use of the HVSC platform can abstain the emissions of undesired substances (Ta‐
 bles 14 and 15). For the ones whose emission factor is found at step F., the Ei,p avoided
 emissions are given by Equation (14), while Equation (15) checks the units of meas‐
 urement. The avoided sulfur is weighted in Equation (16), whereas the units verifi‐
 cation is conducted in Equation (17).
 1
 , , % 10 ∙ 0.05 ∙ , , % 10 ∙ , ∙ ton (14)
 10
 g g 1
 MW ∙ 10 ∙ MW ∙ 10 ∙ ∙ ∙ h ton (15)
 kWh kWh 10
 1
 , ∙ ∙ ∙ ton (16)
 10
 kg 1 tonfuel
 ∙ ∙ h ton (17)
 ton fuel 10 h
 I. The last step is the external costs determination, obtained by multiplying each emis‐
 sion by the relative cost as reported in Table 7.

 Table 12. Vessel database structure—part 1.

 Rated Values
 Vessel GT Pmain,100% Paus, 100% Paus, mooring Pmain,mooring Cmoor. NOx NMVOC PM10 PM2.5 SOx CO2
 name ton MW MW MW MW ton/h ton/h ton/h ton/h ton/h ton/h ton/h

 Table 13. Vessel database structure—part 2.

 Minimum Values Maximum Values
 Cmoor. NOx NMVOC PM10 PM2.5 SOx CO2 Cmoor. NOx NMVOC PM10 PM2.5 SOx CO2
 ton/h ton/h ton/h ton/h ton/h ton/h ton/h ton/h ton/h ton/h ton/h ton/h ton/h ton/h

 Table 14. Database of the substance emitted (for each port)—part 1.

 Rated Values
 Mooring HVSC
 Ship Date Arrive Departure Cmoor. NOx NMVOC PM10 PM2.5 SOx CO2
 time time
 h h h h ton ton Ton ton ton ton ton
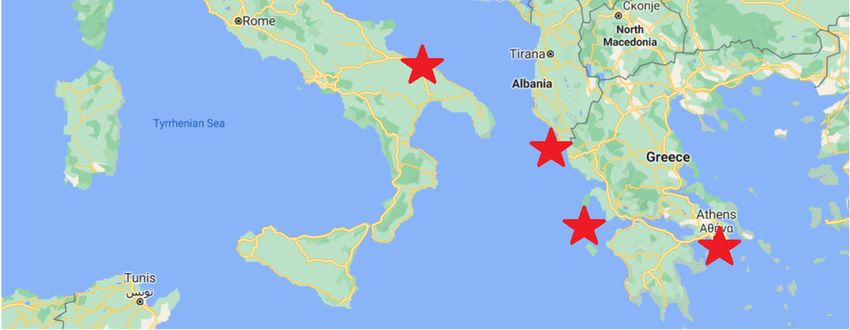
Energies 2021, 14, 5836 14 of 32

 Table 15. Database of the substance emitted (for each port)—part 2.

 Minimum Values Maximum Values
 Cmoor. NOx NMVOC PM10 PM2.5 SOx CO2 Cmoor. NOx NMVOC PM10 PM2.5 SOx CO2
 ton ton ton ton ton ton ton ton ton Ton ton ton ton ton

 6. Evaluation of Environmental Externalities and HVSC Feasibility in the Adriatic
 Route
 By adopting the step‐by‐step procedure already explored, a consequent database is
 developed to evaluate and quantify the effect of cold ironing for the entire cluster of ports.
 To match all the possible combinations and intersections between the input data, the da‐
 tabase is constituted by 15 sheets and about 58,500 elements. Along the selected Adriatic
 route from Italy to Croatia and Greece (Figure 10), a database is capable of weighing the
 emissions that are saved due to the HVSC platforms in the ports. In Figure 11, a represen‐
 tation of the database is provided to explain both the potentiality and complexity. Emis‐
 sions indicate externalities for the collectivity, thus representing the positive incomes to
 be pondered in the cash flow. Once all the cruise ships in the Adriatic route (more than
 one hundred) are selected, the database can give the specific hourly consumptions and
 emissions (i.e., polluting substances and GHG) by applying Equations (6)–(9). This result
 is noteworthy as it precisely represents the emission contribution of each vessel. Hence,
 by combining this information with the mooring data and arrival–departure hour of each
 ship, the database gives the global emissions/externalities in each port, as disclosed by the
 procedure. It is then possible to query the database in order to check the feasibility of each
 HVSC installation. The Adriatic route’s outcome is summarized in Tables 16–21, present‐
 ing diverse rated, minimum, and maximum values.

 Table 16. Avoided emissions in the cluster with cold ironing (yearly rated values).

 Rated Values (tons Emitted)
 Mooring HVSC
 Port C Fuel NOX NMVOC PM10 PM2.5 SOX CO2
 Time Time
 Trieste 673.40 627.40 690.79 39.97 1.47 2.63 2.63 1.38 2281.32
 Dubrovnik 3417.70 3060.70 2779.98 160.86 5.91 10.59 10.59 5.56 9180.76
 Piraeus 4804.81 4364.81 4354.26 251.96 9.26 16.58 16.58 8.71 1,4379.78
 Argostoli 972.00 864.00 869.79 50.33 1.85 3.31 3.31 1.74 2872.46
 Corfù 2660.50 2337.50 2175.55 125.89 4.63 8.28 8.28 4.35 7184.68
 Split 1569.50 1399.50 1259.50 72.88 2.68 4.80 4.80 2.52 4159.45
 Bari 1678.80 1450.80 1501.21 86.87 3.19 5.72 5.72 3.01 4957.68
 GLOBAL 15,776.71 14,104.71 13,632.80 788.87 29.00 51.92 51.92 27.27 45,021.79

 Table 17. Avoided emissions in the cluster with cold ironing (yearly minimum values).

 Minimum Values (tons Emitted)
 Port
 C Fuel NOX NMVOC PM10 PM2.5 SOX CO2
 Trieste 552.64 27.98 0.88 1.58 1.58 0.88 1825.06
 Dubrovnik 2223.98 112.61 3.55 6.34 6.34 3.56 7344.61
 Piraeus 3483.41 176.37 5.55 9.94 9.94 5.57 11,503.83
 Argostoli 695.83 35.23 1.11 1.98 1.98 1.11 2297.96
 Corfù 1740.44 88.12 2.78 4.96 4.96 2.78 5747.74
 Split 1007.60 51.02 1.61 2.87 2.87 1.61 3327.56
 Bari 1200.97 60.81 1.92 3.43 3.43 1.92 3966.15
 GLOBAL 10,906.24 552.21 17.39 31.11 31.11 17.45 36,017.43
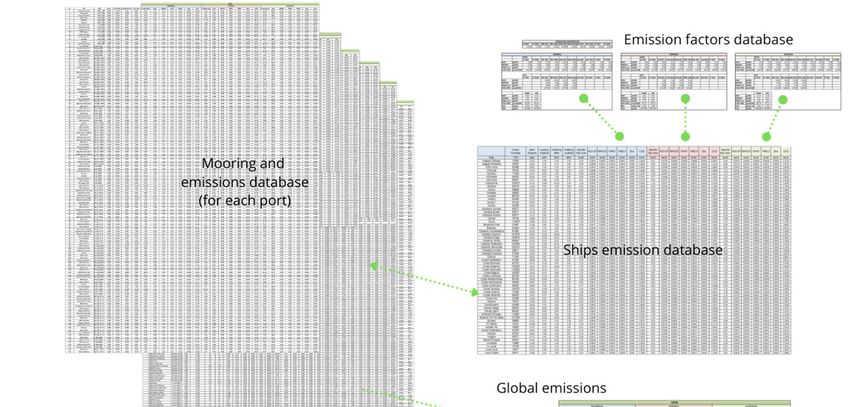
Energies 2021, 14, 5836 15 of 32

 Table 18. Avoided emissions in the cluster with cold ironing (yearly maximum values).

 Maximum Values (tons Emitted)
 Port
 C Fuel NOX NMVOC PM10 PM2.5 SOX CO2
 Trieste 828.95 51.97 2.06 3.68 3.68 1.99 2737.59
 Dubrovnik 3335.97 209.12 8.28 14.82 14.82 8.01 11,016.91
 Piraeus 5225.12 327.55 12.97 23.21 23.21 12.54 17,255.74
 Argostoli 1043.75 65.43 2.59 4.64 4.64 2.51 3446.95
 Corfù 2610.66 163.66 6.48 11.60 11.60 6.27 8621.62
 Split 1511.40 94.75 3.75 6.72 6.72 3.63 4991.34
 Bari 1801.45 112.93 4.47 8.00 8.00 4.33 5949.22
 GLOBAL 16,359.36 1025.53 40.61 72.68 72.68 39.26 54,026.15

 Table 19. Avoided environmental costs in the cluster per polluting‐GHG substance (yearly rated values).

 Rated Values (Values in EUR)
 Port NOX NMVOC PM10 PM2.5 SOX CO2
 Trieste 1,067,680.88 1700.04 52,560.67 365,158.34 18,451.05 239,897.12
 Dubrovnik 3,129,477.30 5597.59 91,287.96 1,057,604.36 46,773.47 965,422.37
 Piraeus 1,351,275.53 2922.49 432,439.11 1,499,587.24 54,030.0 1,512,136.57
 Argostoli 269,926.03 583.79 86,382.51 299,552.25 10,792.8 302,059.06
 Corfù 675,147.98 1460.19 216,062.81 749,250.08 26,995.4 755,520.19
 Split 1,417,845.97 2536.05 41,359.07 479,159.91 21,191.2 437,395.80
 Bari 2,322,889.87 3698.68 114,353.13 794,453.32 40,142.8 521,929.91
 GLOBAL 10,234,243.56 18,498.83 1,034,445.26 5,244,765.51 218,376.9 4,734,361.03

 Table 20. Avoided environmental costs in the cluster per polluting‐GHG substance (yearly minimum values).

 Minimum Values (Values in EUR)
 Port NOX NMVOC PM10 PM2.5 SOX CO2
 Trieste 747,376.62 1019.39 31,492.90 218,792.76 11,808.67 191,917.69
 Dubrovnik 2,190,634.11 3356.48 54,697.21 633,687.21 29,935.02 772,337.90
 Piraeus 945,892.87 1752.41 259,105.53 898,511.10 34,579.22 1209.709.26
 Argostoli 188,948.22 350.06 51,758.01 179,483.41 6907.42 241,647.25
 Corfù 472,603.59 875.57 129,458.85 448,929.87 17,277.08 604,416.16
 Split 992,492.18 1520.69 24,781.21 287,099.34 13,562.41 349,916.64
 Bari 1,626,022.91 2217.84 68,517.22 476,014.40 25,691.42 417,543.93
 GLOBAL 7,163,970.49 11,092.45 619,810.92 3142,518.09 139,761.25 3,787,488.82

 Table 21. Avoided environmental costs in the cluster per polluting‐GHG substance (yearly maximum values).

 Maximum Values (Values in EUR)
 Port NOX NMVOC PM10 PM2.5 SOX CO2
 Trieste 1,387,985.15 2380.06 73,584.94 511,221.68 26,569.51 287,876.54
 Dubrovnik 4,068,320.49 7836.63 127,803.14 1,480,646.10 67,353.80 1,158,506.85
 Piraeus 1,756,658.19 4091.49 605,414.76 2,099,422.14 77,803.26 1,814,563.89
 Argostoli 350,903.84 817.30 120,935.51 419,373.15 15,541.70 362,470.88
 Corfù 877,692.37 2044.26 302,487.94 1,048,950.11 38,873.43 906,624.23
 Split 1,843,199.76 3550.48 57,902.69 670,823.88 30,515.42 524,874.96
 Bari 3,019,756.83 5178.15 160,094.38 1,112,234.65 57,805.70 626,315.89
 GLOBAL 13,304,516.63 25,898.37 1,448,223.36 7,342,671.71 314,462.81 5,681,233.24
Energies 2021, 14, 5836 16 of 32

 Figure 10. Adriatic route (Trieste, Split, Dubrovnik, Corfù, Argostoli, Piraeus, and Bari).

 Figure 11. Database structure and correlations (15 sheets, about 58,500 elements).

 By multiplying the last results by the cost shown in Table 7, the yearly environment
 costs are finally found. Then, to prove the profitability of the HVSC in the cluster, the
 yearly avoided costs are to be evaluated by taking into account the entire service life of
 the installation. To this aim (Tables 22 and 23), a reference period of 15 years is used by
 following the provisions in Annex I of commission delegated regulation (EU) n. 480/2014
 of 3 March 2014. When performing the economic analysis, Equation (18) provides Clife,p,
 which is the cost of emission in port p during the entire lifetime. To find such a value, the
 cost of emission in port p in the 2019 reference year (i.e., C1,p) is adopted, as well as the t
Energies 2021, 14, 5836 17 of 32

 year of reference, the i polluting/GHG substance, and the r discount rate. For the discount
 rate, the commission implementing regulation EU 2015/207 of 20 January 2015 suggests
 3% for Italy and 5% for Greece and Croatia as beneficiaries of the cohesion funds.
 ,
 , 1 /100 EUR
 (18)

 To precisely testify the HVSC economic feasibility, the avoided environmental exter‐
 nalities (i.e., benefits from cold ironing) are to be compared with the construction and
 O&M costs of implementing the HVSC infrastructure. With reference to the plant costs,
 the first hypothesis is the availability of a high‐voltage connection in the harbor area. As
 a matter of fact, this assumption is mostly satisfied as the ports usually host energy‐inten‐
 sive utilities. By observing Figure 1, the system under study is therefore constituted by
 the elements from step 3 to step 5. A detailed market research between several producers
 finally produces the present quote for a single HVSC installation (Table 24) whose values
 actually update the previous ones (2015 as the reference year) discussed in Table 4. As the
 number of stops in moorings has a large variability in the considered ports for the Adriatic
 route, the HVSC supplying points to be installed are decided on a case‐by‐case basis (Ta‐
 ble 25). From the daily medium mooring, the actual stops are consequently rounded.

 Table 22. First year avoided externalities: overall summary.

 Port Rated (EUR) Minimum (EUR) Maximum (EUR)
 Trieste 1,745,448.10 1,202,408.03 2,289,617.87
 Dubrovnik 5,296,163.05 3,684,647.94 6,910,467.01
 Piraeus 4,852,390.99 3,349,550.40 6,357,953.72
 Argostoli 969,296.50 669,094.36 1,270,042.39
 Corfù 2,424,436.69 1,673,561.11 3,176,672.34
 Split 2,399,488.07 1,669,372.46 3,130,867.19
 Bari 3,797,467.75 2,616,007.72 4,981,385.59
 GLOBAL 21,484,691.14 14,864,642.02 28,117,006.11

 Table 23. Lifetime discounted avoided externalities (15 years): overall summary.

 Port Rated (EUR) Minimum (EUR) Maximum (EUR)
 Trieste 20,887,884.43 14,389,290.60 27,399,997.43
 Dubrovnik 55,224,559.64 38,420,845.00 72,057,354.27
 Piraeus 50,597,225.36 34,926,690.10 66,296,145.10
 Argostoli 10,107,123.13 6,976,832.33 13,243,083.92
 Corfù 25,280,273.11 17,450,685.46 33,124,042.72
 Split 25,020,126.94 17,407,009.22 32,646,419.68
 Bari 45,444,529.30 31,305,924.75 59,612,546.71
 GLOBAL 232,561,721.90 160,877,277.46 304,379,589.84

 Table 24. Shore connection costs (single plant).

 Element Cost (EUR)
 MT switchgears 32,000.00
 Converter 16 MVA 11 kV 50–60 Hz 4,500,000.00
 Cable dispenser 1,200,000.00
 Design and construction (25%) 1,433,000.00
 Total 7,165,000.00
Energies 2021, 14, 5836 18 of 32

 Table 25. Number of assumed cold ironing points and related costs.

 Port Daily Medium Mooring Assumed Plants Cost of HVSC (EUR)
 Trieste 1.14 1 7,165,000.00
 Dubrovnik 1.82 2 1,4330,000.00
 Piraeus 2.05 2 14,330,000.00
 Argostoli 1.25 1 7,165,000.00
 Corfù 2.25 2 14,330,000.00
 Split 1.28 1 7,165,000.00
 Bari 1.55 2 14,330,000.00
 GLOBAL 15.00 11 78,815,000.00

 Secondly, O&M costs are examined to complete the analysis. In terms of the plant
 costs, also the assessment of O&M (Tables 26 and 27) is based on market research and
 historical/standard price data in a period of 15 years. These costs include the maintenance
 for low/medium voltage switchgears, costs of remote control, air conditioning, inspection,
 earth measurements, costs for new staff, UPS battery replacement, cleaning, cable dis‐
 penser, and so on. By combining the avoided externalities (i.e., rated, minimum, and max‐
 imum scenarios) and plant/O&M costs, the economic feasibility of the HVSC Adriatic clus‐
 ter is estimable. For the sake of clarity, this comparison among externalities/costs is based
 on the discounted cash flow, a methodology in which the only incoming/outgoing cash
 flows are examined, thus without amortization, provision, VAT, taxes and subsides, etc.
 As in Figure 12, the payback time for the cluster is only 5 years in the rated case, while 3.5
 years in the maximum and 8 years in the minimum scenarios. In contrast, the economic
 feasibility is case‐dependent. For example, the Argostoli cruise terminal (Figure 13) has a
 payback time of 15 years (i.e., technical life) in the rated case, thus the economic feasibility
 is not reached in the minimum case. Although this can appear odd based on the high
 mooring hours (more than Trieste in Tables 16–18), the discrepancy depends on the mar‐
 ginal costs of each emission/country (Table 7). In order to encourage ship‐owners to adopt
 the onboard HVSC infrastructure, incentives are to be put in place to ensure the payback
 also in the underdog ports. Trieste in Figure 14 is the benchmark, while the Dubrovnik
 case is depicted in Figure 15 as the most profitable solution.

 Table 26. Operation and maintenance costs (values for first year).

 Element Amount (EUR)
 MT substation 42,402.00
 Power converter 90,000.00
 Cable dispenser 60,000.00
 Staff 46,339.00
 GLOBAL 238,741.00

 Table 27. Lifetime discounted O&M costs (15 years): global summary.

 Port Plants Assumed O&M Costs (EUR)
 Trieste 1 2,857,028.18
 Dubrovnik 2 5,714,056.36
 Piraeus 2 5,714,056.36
 Argostoli 1 2,857,028.18
 Corfù 2 5,714,056.36
 Split 1 2,857,028.18
 Bari 2 5,714,056.36
 GLOBAL 11 31,427,310.00
Energies 2021, 14, 5836 19 of 32

 170

 120
 M€

 70

 20

 ‐30 1 2 3 4 5 6 7 8 9 10 11 12 13 14 15

 ‐80

 PLANT COSTS O&M COSTS AVOIDED MINIMUM AVOIDED NOMINAL
 AVOIDED MAXIMUM NET MINIMUM NET NOMINAL NET MAXIMUM

 Figure 12. Cash flow in rated, minimum, and maximum scenarios for all ports.

 4

 2

 0
 1 2 3 4 5 6 7 8 9 10 11 12 13 14 15
 M€

 ‐2

 ‐4

 ‐6

 ‐8
 PLANT COSTS O&M COSTS AVOIDED MINIMUM AVOIDED NOMINAL

 AVOIDED MAXIMUM NET MINIMUM NET NOMINAL NET MAXIMUM

 Figure 13. Cash flow in rated, minimum, and maximum scenarios in Argostoli (GR).

 17

 12
 M€

 7

 2

 ‐3 1 2 3 4 5 6 7 8 9 10 11 12 13 14 15

 ‐8

 PLANT COSTS O&M COSTS AVOIDED MINIMUM AVOIDED NOMINAL
 AVOIDED MAXIMUM NET MINIMUM NET NOMINAL NET MAXIMUM

 Figure 14. Cash flow in rated, minimum, and maximum scenarios in Trieste (IT).
Energies 2021, 14, 5836 20 of 32

 55

 45

 35

 25
 M€

 15

 5

 ‐5 1 2 3 4 5 6 7 8 9 10 11 12 13 14 15
 ‐15
 PLANT COSTS O&M COSTS AVOIDED MINIMUM AVOIDED NOMINAL

 AVOIDED MAXIMUM NET MINIMUM NET NOMINAL NET MAXIMUM

 Figure 15. Cash flow in rated, minimum, and maximum scenarios in Dubrovnik (CR).

 7. Embedding Cold Ironing in the Context of the EU Emission Trading System for
 Maritime Transport
 Within the broader policy context of the European Green Deal, the abatement of GHG
 emissions from the shipping sector stands out as one of the main priorities of the European
 Commission. As this paper has explained, the maritime sector has a significant abatement
 potential and therefore can deliver substantial environmental and climate change benefits.
 Due to the global nature of international shipping and the difficulty to allocate GHG emis‐
 sions amongst countries, maritime GHG emissions are not tackled in the international cli‐
 mate change regime, although the International Maritime Organization (IMO) has also
 been deemed as the ideal forum to this end [11]. Over the past decade, an increasing de‐
 bate has lingered on the opportunity to adopt market‐based instruments to the maritime
 sector [12,64]. At the international level, efforts have been pursued by the International
 Maritime Organization (IMO) to both address GHG emissions and set carbon efficiency
 targets. In 2011, the IMO adopted a new regulatory framework on energy efficiency. Since
 then, the IMO adopted in April 2018 an initial strategy on the reduction of greenhouse gas
 emissions from ships, albeit without support from all States. It sets a greenhouse gas emis‐
 sion reduction objective of at least 50% by 2050 compared to 2008 levels, coupled with a
 vision for the full decarbonization of the sector as soon as possible in this century. It also
 sets an objective to reduce carbon intensity, as an average across international shipping,
 by at least 40% by 2030, pursuing efforts towards 70% by 2050 as compared to 2008. In
 November 2020, the IMO approved a technical and operational measure for existing ships
 with a view to implement the IMO strategy and complement existing energy efficiency
 policies. Despite such progress being made, however, the above measures are not deemed
 sufficient to achieve a decarbonization of international shipping consistent with the path‐
 way envisaged under the pivotal Paris agreement objectives.
 In the EU, the flagship of carbon pricing is the EU Emission Trading System (EU ETS).
 Established through Directive no. 2003/87/EC (henceforth called the ETS Directive), the
 EU ETS is the second cap‐and‐trade system worldwide, comprised of more than 15,000
 stationary installations operating in energy and GHG‐intensive sectors as well as (from
 2008) 1500 aircraft operators. After a long journey of consultations and internal appraisal,
 and also in light of the inadequate efforts at the international level, the European Com‐
 mission adopted on July 14, 2021 a proposal for an amendment of the EU ETS Directive to
Energies 2021, 14, 5836 21 of 32 fully include the maritime sector into the scheme (COM (2021) 551 final), which will be discussed below. The economic impact on the maritime sector from its inclusion in the EU ETS is deeply influenced by the design elements of the system. The EU ETS as a cap‐and‐trade mechanism relies on the concept of scarcity to leverage market forces towards adequate market prices for ETS allowances, with a view to induce investments at a lower marginal cost to reduce GHG emissions [13]. In this respect, to adopt a pricing mechanism for GHG emissions from the maritime sector is likely to result in higher shipping costs and lower shipping speeds as the GHG emissions cap decreases over time [14]. The overall increase of logistic costs for ship‐owners (as comprising net transportation costs and time at sea) as a result of the application of market‐based schemes such as the EU ETS may range from 1.7% to 7.2% depending on different scenarios [65]. In contrast small‐sized vessels running short‐sea shipping routes have been found to be more negatively affected as compared to larger ships travelling longer distances [65]. As shown by previous research on the avia‐ tion sector, in assuming the constant increase of ETS allowance prices, shipping compa‐ nies will be forced to develop a long‐term sustainability strategy to maintain their com‐ petitiveness through investments in clean technologies, including the use of alternative fuels and energy sources [66]. This will allow for flexibility regarding the choice of tech‐ nical and operational measures to improve vessels’ performance in terms of energy con‐ sumption and GHG emissions. Thus, the cost‐effectiveness rationale behind different CO2‐abatement options for the shipping industry will rationally equal the emission allow‐ ance price, as ship operators will seek to minimize the additional cost from CO2 emissions. In particular, the following ETS design elements are relevant for the maritime sector, as addressed by the recent European Commission’s proposal to amend the ETS Directive: emission cap setting; material and geographical scope of application; method of allocation of EU ETS allowances to vessels owners; and monitoring, reporting, and verification (MRV). As for the emission cap setting, the European Commission is proposing that emis‐ sions from the current EU ETS sectors (including the maritime sector) be reduced by 61% by 2030, compared to 2005 levels (as compared to the current ‐43% contribution from the system to the EU’s climate target). To this end, the Commission envisages a steeper annual emissions reduction cap of 4.2% (as compared to the current 2.2%/year), following a one‐ off reduction of the overall emissions cap by 117 million allowances (s.c. “re‐basing”). As for the material scope of application, the envisaged EU ETS reform applies to CO2 emissions from all maritime transportation activities of ships above 5000 gross tonnage‐ performing voyages with the purpose of transporting passengers or cargo for commercial purposes; this is with the exception of warships, naval auxiliaries, fish‐catching or fish‐ processing ships, wooden ships of a primitive build, ships not propelled by mechanical means, or government ships used for non‐commercial purposes pursuant to Regulation 2015/757/EU. As emphasized by [67], an important parameter to be considered in relation to extending the EU ETS to include shipping is the heterogeneity of the maritime industry, which is composed of maritime segments that present large differentiations at their tech‐ nical and operational features, at the market structure, and in terms of the elasticity of demand. The implementation of an ETS for the abatement of CO2 emissions from shipping will have a differential impact on the various maritime segments due to their distinct char‐ acteristics [12]. Two consequences must be stressed in this respect. First, given the fairly high elasticity of demand for short sea shipping services in comparison to deep sea seg‐ ments, for example, this could lead to a modal shift from sea to land‐based modes of trans‐ portation if the transportation cost of these services would increase due to the additional cost of CO2 emissions for shipping. The situation is remarkably different for deep sea ship‐ ping, which cannot easily be replaced by road transport. Second, the increased operational
Energies 2021, 14, 5836 22 of 32

 cost for vessels operating or crossing EU territorial waters resulting from the application
 of the EU ETS could lead to the distortion of competition [68].
 As for the geographical scope of application, the EU ETS shall apply, in respect of
 50% of the CO2 emissions from ships departing from a port under the jurisdiction of a
 Member State and arriving at a port outside the jurisdiction of a Member State, 50% of the
 CO2 emissions from ships running voyages departing from a port outside a Member State
 and arriving at a port under the jurisdiction of a Member State. In addition, the EU ETS
 shall apply 100% of the CO2 emissions from ships running voyages departing from and
 arriving to ports under the jurisdiction of a Member State; arriving at a port under the
 jurisdiction of a Member State; and from ships at berth in a port located in a EU Member
 State (Article 3g).
 Next comes the issue of the method of allowances allocation. The EU ETS tradition‐
 ally allocates allowances based on auctioning or free allocation (Article 9–10 ETS Di‐
 rective). According to the European Commission’s proposal, all ETS allowances shall be
 allocated to the maritime sector by auctioning. As underscored by previous research, the
 existing notable differences among the vessels covered by the EU ETS as to the fuel con‐
 sumption could result in a disproportionate economic burden as even a full auctioning
 allocation system would be based on the type of fuel used and consumption thereof [14].
 The envisaged ETS reform endorses a step‐wise approach to the obligation, imposed on
 ship‐owners, to surrender ETS allowances. Accordingly, ship‐owners are obliged to sur‐
 render allowances equaling 20% of verified CO2 emissions reported for 2023; 45% of veri‐
 fied CO2 emissions reported for 2024; 70% of verified CO2 emissions reported for 2025;
 and 100% of verified CO2 emissions reported for 2026 and each year thereafter (Article 3
 ga). In the case of non‐compliance, in addition to the general EU ETS rules on penalties,
 ships can be denied entry to EU ports where the responsible shipping company failed to
 surrender the necessary allowances for two or more consecutive years.
 Last on MRV, a proposal is tabled to amend Regulation 1757/2015/EU in order to
 oblige shipping companies to report aggregated emissions data at the company level and
 submit for approval their verified monitoring plans and aggregated emissions data at the
 company level to the responsible administering authority. Under the current European
 Commission’s proposal, all data monitored, reported, and verified under Regulation
 2015/757/EU should be submitted to and verified by a national competent authority (Ar‐
 ticle 3gb of the proposal).
 Given the above context, it is important hence to position the adoption of cold ironing
 technologies in such a regulatory and policy framework. It is noteworthy in this respect
 that that the application of cold ironing technologies would deliver immediate CO2 reduc‐
 tions considering the application of electricity to replace fuel engines for ships. As demon‐
 strated in Section 6, the application of cold ironing throughout the selected passenger
 route would deliver 36,017.43–54,026.15 tCO2‐eq emission reductions (Tables 17 and 18),
 moreover resulting in EUR 3787,488.82–5681,233.24 avoided costs only from CO2 emis‐
 sions (Tables 20 and 21). Under the current ETS setup, particular importance is posed on
 the role of technologies and activities that provide net GHG emission reductions and more
 broadly contribute to mitigating climate change [69]. Therefore, economic and environ‐
 mental benefits generated by cold ironing as applied by shipping companies should be
 integrated and duly remunerated within the EU ETS, in particular as embedded in the
 market price of ETS allowances, in order to both mitigate the increased operational costs
 for ship‐owners and ensure compliance with the scheme (see Section 8 below).
 Second, cold ironing technology should be financed through the revenues accrued
 through the ETS. The ETS‐driven Innovation and Modernisation funds come into play in
 this respect (as introduced by Directive no. 2018/410/EU).
 Regarding the Innovation Fund, according to Article 10a, paragraph 2 of the ETS Di‐
 rective, at least 50% of the revenues generated by the auctioning of ETS allowances should
 be directed to a set of activities contributing to the EU’s mitigation action, including,
 among others:
You can also read