Asian Development Bank Institute - ADBI Working Paper Series Housing Policies in Singapore
←
→
Page content transcription
If your browser does not render page correctly, please read the page content below

ADBI Working Paper Series

Housing Policies in Singapore

Sock-Yong Phang and Matthias Helble

No. 559
March 2016

Asian Development Bank Institute
Sock-Yong Phang is Celia Moh Professorial Chair and Professor of Economics,
 Singapore Management University.
 Matthias Helble is a Research Fellow at the Asian Development Bank Institute, Tokyo.
 The views expressed in this paper are the views of the author and do not necessarily
 reflect the views or policies of ADBI, ADB, its Board of Directors, or the governments
 they represent. ADBI does not guarantee the accuracy of the data included in this paper
 and accepts no responsibility for any consequences of their use. Terminology used may
 not necessarily be consistent with ADB official terms.
 Working papers are subject to formal revision and correction before they are finalized
 and considered published.

The Working Paper series is a continuation of the formerly named Discussion Paper series;
the numbering of the papers continued without interruption or change. ADBI’s working
papers reflect initial ideas on a topic and are posted online for discussion. ADBI encourages
readers to post their comments on the main page for each working paper (given in the
citation below). Some working papers may develop into other forms of publication.

Suggested citation:

Phang, S.-Y., and M. Helble. 2016. Housing Policies in Singapore. ADBI Working Paper 559.
Tokyo: Asian Development Bank Institute. Available:
http://www.adb.org/publications/housing-policies-singapore/

Please contact the authors for information about this paper.

Email: syphang@smu.edu.sg; mhelble@adbi.org

Asian Development Bank Institute
Kasumigaseki Building 8F
3-2-5 Kasumigaseki, Chiyoda-ku
Tokyo 100-6008, Japan

Tel:      +81-3-3593-5500
Fax:      +81-3-3593-5571
URL:      www.adbi.org
E-mail:   info@adbi.org

© 2016 Asian Development Bank Institute
ADBI Working Paper 559                                                   Phang and Helble

Abstract

Singapore has developed a unique housing system, with three-quarters of its housing stock
built by the Housing & Development Board (HDB) and homeownership financed through
Central Provident Fund (CPF) savings. As a result, the country’s homeownership rate of
90% is one of the highest among market economies. At different stages of its economic
development, the Government of Singapore was faced with a different set of housing
problems. An integrated land–housing supply and financing framework was established in
the 1960s to solve the severe housing shortage. By the 1990s, the challenge was that of
renewing aging estates and creating a market for HDB transactions. Housing subsidies in
the form of housing grants were also introduced. Recent challenges include curbing
speculative and investment demand, as well as coping with increasing income inequalities
and an aging population. These have brought about carefully crafted macroprudential
policies, targeted housing grants, and schemes to help elderly households monetize their
housing equity. This paper analyzes key pillars of the housing policy, specifically land
acquisition, the HDB–CPF system, the role of markets, housing market interventions, the
Ethnic Integration Policy, and the Lease Buyback Scheme. It concludes with lessons learned
for other countries.

JEL Classification: R21, R31, R38
ADBI Working Paper 559                                                                                          Phang and Helble

Contents

1.        Introduction ................................................................................................................ 3

2.        The Land Acquisition Act, 1966 ................................................................................. 5

3.        The HDB–CPF Housing Framework .......................................................................... 8

4.        The Role of Markets ................................................................................................ 11

5.        Supply-Side vs. Demand-Side Interventions ............................................................ 12

6.        Promoting Racial Integration: The Ethnic Integration Policy ..................................... 17

7.        Land Lease System and the Lease Buyback Scheme ............................................. 18

8.        Conclusion: Lessons Learned for Other Asian Countries ......................................... 21

References ......................................................................................................................... 24
ADBI Working Paper 559                                                                      Phang and Helble

    1. INTRODUCTION
In 2015, Singapore’s population was 5.54 million, of which 3.38 million were citizens, 0.53
million were permanent residents, and 1.63 million were foreigners. One-fifth of its land area
of 719 square kilometers (km2) comprised reclaimed land (Table 1). Land scarcity and high
population density (over 7,600 persons per km2) provide justification for the dominance of
the state in land ownership and housing provision, and the high level of intervention in the
housing sector. The homeownership rate for the resident population has been above 90%
since the early 1990s. Among resident employed households, the 2014 median household
income from work was S$8,292 per month, 1 or S$99,504 per year. 2 The median house type
is a four-room (approximately 90 m2) flat sold by the Housing & Development Board (HDB),
the government housing agency, on a 99-year leasehold basis. The median house price
(market values) to annual household income ratio for 2015 was estimated at 5.0
(Demographia 2016).
             Table 1: Population, Land Area, and Density of Singapore, 1970–2015
Year        Land Area            Population                  Total           Singapore         Proportion of
                 2
              (km )                Density                 Population        Residents          Foreigners
                                         2
                                  (per km )                                                        (%)
1970                 586                   3,540                 2,074,507      2,013,563                      3
1980                 618                   3,906                 2,413,945      2,282,125                      5
1990                 633                   4,814                 3,047,132      2,735,868                     10
2000                 683                   5,897                 4,027,887      3,273,363                     19
2010                 712                   7,130                 5,076,732      3,771,721                     26
2015                 719                   7,698                 5,535,002      3,902,690                     29
           km2 = square kilometer.
           Source: Government of Singapore, Department of Statistics.

Table 1 shows the increase in population and its changing composition by nationality status.
The foreign component of Singapore’s population has increased significantly, from 10% in
1990 to 19% in 2000, and was 29% in 2015. Permanent residents (who are not citizens)
accounted for another 10% and citizens comprised 61% of the population in 2015. These
statistics on changes in population composition are relevant for housing policy as the
housing market in Singapore is highly segmented according to households’ nationality
status.
In the decades since the first elections were held in 1959 for self-government and since
independence in 1965, Singapore has been ruled by the People’s Action Party (PAP). The
successful public housing program is “a foundation stone upon which … the PAP … builds
its legitimacy among Singaporeans” (Chua 1997, preface). The unique housing system has
75% of the housing stock in 2015 classified as “public housing” built predominantly by the
HDB; 82% of the resident population live in HDB estates, of which 79% lived in HDB-sold
flats. Demand for homeownership is driven by the housing pension fund system introduced
in 1968 when Central Provident Fund (CPF) savings were allowed to be used for down
payment and mortgage payments for HDB flats.
The HDB–CPF framework established in the 1960s has transformed the urban form of
Singapore and remains largely intact 5 decades on. Between 1960 and 2013, the ratio of
housing investment to gross domestic product (GDP) averaged 7%, with the ratio of housing
investment to total investment averaging 23% (Figure 1). These ratios are high by

1
    Statistics are from Singapore government agency websites and Singapore Department of Statistics (2015).
    The exchange rate on 5 February 2016 was S$1.41 ≡ US$1.00.
2

                                                             3
ADBI Working Paper 559 Phang and Helble
international standards and reflect the policy attention and resources channeled into the
housing sector.
Figure 1: Housing Investment Ratios in Singapore, 1960–2013
(%)
50
45
40
35 I/GDP
30
25
20 HI/ I
15
HI/ GDP
10
5
0
1960
1962
1964
1966
1968
1970
1972
1974
1976
1978
1980
1982
1984
1986
1988
1990
1992
1994
1996
1998
2000
2002
2004
2006
2008
2010
2012
GDP = gross domestic product, HI = housing investment, I = total investment.
Data source: Government of Singapore, Department of Statistics website.
HDB rental and direct purchases (one unit per household) are restricted to citizens, with
current monthly gross household income caps at S$1,500 for rental and S$12,000 for direct
purchase, respectively. The Executive Condominium scheme, a hybrid public–private
housing scheme for citizen households, has a household income cap of S$14,000. The
resale HDB sector is available to citizens and Singapore permanent residents (SPRs).
However, the HDB housing grants are made by taking into account to citizenship, marital
status, and household income of purchaser households. The private housing sector is
dominated by transactions by higher-income Singapore citizens, SPRs, expatriates, and
foreign investors. Table 2 shows the distribution of resident households by dwelling type and
average monthly household incomes. Of the 1.2 million resident households in 2014, 80%
resided in HDB-built flats.
Table 2: Resident Households by Dwelling Type and Household Income in Singapore,
2014
Average Monthly Household
Income from Work among
Resident Resident Employed Households
Dwelling Type Households (S$)
Total 1,200,000 = 100%
Total HDB 80.4%
1- and 2-room flats 5.3% 2,313
3-room flats 18.3% 5,805
4-room flats 32.2% 8,293
5-room and executive flats 24.4% 11,606
Private House Types
Condominiums and other
apartments 13.5% 19,843
Landed properties 5.8% 27,363
HDB = Housing & Development Board.
Note: Average HDB flat sizes estimated from 2015 resale transaction data: 1-room 33 m2; 2-room 45 m2; 3-room 73
m2; 4-room 96 m2; 5-room 115 m2. Private housing has much wider variation in sizes and amenities.
Source: Government of Singapore, Department of Statistics (2015).
4ADBI Working Paper 559 Phang and Helble
The housing policy in Singapore has evolved over time in response to different housing
challenges. Phang (2015c, 12) states that “in the 1960s, the political turbulence of self-
government, merger with Malaysia, and unexpected independence were not conducive to
attracting long-term investments. On the housing front, the government was faced with a
largely immigrant and growing population, a chronic housing shortage as well as insufficient
private-sector resources and capacity to provide adequate solutions.” Measures that had
previously been undertaken by the British colonial government in town planning and the
provision of rental houses and flats proved wholly inadequate. Public housing built by the
Singapore Improvement Trust (SIT) 3 housed 8.8% of the population by 1959, with the
majority living in overcrowded prewar rent-controlled apartments lacking access to water and
modern sanitation. Others faced housing conditions comparable to today’s slums. Given this
lack of adequate housing, the newly elected government made it a priority to provide homes
on a large scale. The government developed its housing policies based on three pillars: the
establishment of the HDB in 1960, the enactment of the Land Acquisition Act in 1966, and
the expansion of the role of the CPF to become a housing finance institution in 1968.
By the 1970s, the HDB–CPF housing framework, representing a tightly integrated land–
housing supply and financing system, was working effectively to channel resources into the
housing sector. With the HDB–CPF system in place, the housing shortage was resolved by
the 1980s. In the 1990s, the challenge was that of renewing aging estates and of creating a
market for HDB transactions as households upgraded to larger flats and private housing.
Housing subsidies on the demand side in the form of housing grants were also introduced.
The more recent (since 2000) housing policy challenges include the need to curb the
speculative and investment housing demand, the increase in income inequalities, as well as
an aging population. These have brought about the introduction of carefully crafted
macroprudential policies, targeted housing grants to assist low- and middle-income
households, and schemes to help elderly households monetize their housing equity. 4
Sections 2–7 of this paper analyze the key pillars of Singapore’s housing policy, specifically
land acquisition, the HDB–CPF system of homeownership, the role of the market, housing
market interventions, the ethnic integration policy, the land lease system, and the Lease
Buyback Scheme. Section 8 concludes with lessons learned for other Asian countries.
2. THE LAND ACQUISITION ACT, 1966
Singapore, a former British colony, held its first general elections as a fully self-governing
state in 1959, joined the Federation of Malaysia in 1963, and became an independent
republic in 1965. The housing situation prior to independence was one of acute shortage,
resulting in overcrowding, misery, slums, and squatter settlements. It was during such a
period of political uncertainty and housing crisis that legislation and amendments for urban
and housing sector transformations were passed. Recognizing that the prerequisite for a
successful public housing program was the availability of inexpensive land, the government
paid much attention to amending legislation on land acquisition by the state from the early
1960s. The Land Acquisition Act of 1966 was a crucial step in Singapore’s housing policies
and economic development and has had major redistribution effects (Phang 1996, 2015a).
3
See Phang (1992, Chapter 3) for a description of the SIT and other public sector agencies involved in housing
development in the 1960s and 1970s.
4
See Phang (1992, 2007, 2015c) for historical accounts and updates of housing policies.
5ADBI Working Paper 559 Phang and Helble
In 1964, the Land Acquisition Bill was debated in the legislative assembly while Singapore
was a part of the Federation of Malaysia. Then Prime Minister Lee Kuan Yew explained that
the approach to determining compensation for land acquired by the government should be
the prevention of economic windfalls to landowners (Singapore Parliamentary Reports, 10
June 1964):
“First, that no private landowner should benefit from development which had taken
place at public expense; and secondly, the price paid on the acquisition for public
purposes should not be higher than what the land would have been worth had the
Government not contemplated development generally in the area.” 5
On the matter of land acquisition, the views expounded by the Prime Minister were,
however, inconsistent with Article 13 of the Malaysian Constitution, which provides for the
right to adequate compensation in the event of compulsory acquisition. Upon independence
in August 1965, the Singapore Parliament adopted all the provisions of the Malaysian
Constitution regarding fundamental rights except for Article 13.
The Land Acquisition Act, enacted in 1966, gives the state broad powers to acquire land:
(a) for any public purpose;
(b) by any person, corporation or statutory board, for any work or an undertaking
which, in the opinion of the Minister, is of public benefit or of public utility or in the
public interest; or
(c) for any residential, commercial or industrial purposes.
Landowners cannot object to the decision, and appeals on compensation can only be made
to an Appeals Board and not to the courts. Initially, almost all legal owners appealed the
compensation awards and, in 1973, the concept of a statutory date was introduced. In the
words of the Prime Minister (K.Y. Lee 2000, 118–119):
“Later, I further amended the law to give the government the power to acquire land
for public purposes at its value on a date fixed at 30 November 1973. I saw no
reason why private landowners should profit from an increase in land value brought
about by economic development and the infrastructure paid for with public funds.”
Between 1975 and 1990, the annual GDP growth rate averaged 8%. The private housing
price index grew at an average real rate of 10% per year. Land prices would have increased
by much more than housing prices. Many private landowners were, however, unable to avail
themselves of this high rate of return as the government acquired land not at market prices
but at compensation fixed at the lower of 1973 prices or market values for most of that
period. Compensation was capped at 1973 levels for about 14 years between 1973 and
1987, with no allowance being made for market valuation or the landowner’s purchase price.
Exceptions were made on a case-by-case basis.
Singapore has since moved to a more market-based approach for compensation of acquired
land. Subsequent amendments to the Land Acquisition Act changed the statutory date for
purposes of valuation for compensation to 1 January of 1986, 1992, and 1995. In 2007, the
use of a historical statutory date was removed by Parliament, and compensation has since
been pegged to full market value.
State land, as a proportion of total land, grew from 44% in 1960 to 76% by 1985, and was
about 90% by 2005. 6 A significant portion of the increase in state land can be attributed to
land reclamation. Land acquisition was an important step in Singapore’s housing policies.
However, it meant that existing owners had to be expropriated. In most other countries, such
clearance would have encountered strong resistance by dwellers. This was also the case in
5
See also Centre for Liveable Cities (2014, 12–18).
6
Phang (1992: 24) and Singapore Land Authority website (http://sla.gov.sg; accessed on 25 Oct 2005).
6ADBI Working Paper 559 Phang and Helble
1960s Singapore when resettlement was initially viewed with hostility and suspicion (Centre
for Liveable Cities 2014, 21). To overcome resistance, the government’s policy was to
provide suitable alternative accommodation for all businesses and persons affected by its
land acquisition programs. Planners at that time estimated that for every slum structure
demolished then, seven new flats were required to relocate families affected (Choe 1975).
This meant that the processes for public housing construction, land acquisition, slum
clearance and resettlement, and urban renewal in Singapore were closely interrelated. Chua
(1997, 132) shows how commitment to universal provision of housing “allowed the PAP
government to take the strong moral high ground on acquisition of land for public housing.”
A detailed study of land acquisition and resettlement can be found in Centre for Liveable
Cities (2014). The study highlights several reasons for the relative success of land
acquisition and resettlement in Singapore as compared with obstacles and resistance in
other countries. These included the following factors:
(i) Legal and constitutional mandate as well as clear processes in the form of the Land
Acquisition Act that established legitimacy and the rule of law in the conduct of public
officials carrying out these duties.
(ii) Meticulous and detailed processes for record keeping and calculation of
compensation for squatters’ assets at market value.
(iii) The superiority of alternative accommodation, business premises, and environments
offered by the government to affected people to replace the land or property that had
been taken from them—although squatters had no legal interest in the affected land,
they were compensated for improvements (such as shacks, vegetable plots, and
livestock) and were also given priority allocation of new land in the case of farmers or
HDB flats.
(iv) Effective forward planning and coordination to ensure smooth resettlement due
largely to the integrated housing, resettlement, and estate planning functions of the
HDB because the Resettlement Department was housed within the HDB from 1963.
Subsidiary legislation in the form of the State Land Rules, 1968 provided that titles for state-
owned land should be for terms not exceeding 99 years. Through the Land Acquisition Act,
the government cleared low-density housing, slums, villages, and squatter areas, and
assembled land parcels. State land was leased to government agencies for the development
of high-rise “public” housing which were sold on a 99-year leasehold basis to eligible
households, as well as for the development of industrial estates, educational institutions, and
other urban public amenities. Up to half of the land acquired by the state since the
enactment of the act has been allocated for housing development by both the public and
private sectors (Phang 1996).
Singapore’s land policies can be described as land reform in an urban setting. It involved a
massive transfer of land resource from private landowners to the state in the first 2 decades
after independence. That large plots of land in Singapore were owned by a small number of
wealthy landowners during the 1960s helped explain why acquiring land from this group was
regarded as fair by Parliament (Centre for Liveable Cities 2014, 7). 7 Chua (1997, 134) writes
that “the popularity of the government’s action among the overwhelming propertyless
electorate enabled it to bear the rejection of this very small minority.” The major acquisition
and redistribution of a critical resource contributed to the development of industrial estates,
the financial district, commercial developments, the large public housing program, and public
sector infrastructure development. The Land Acquisition Act of 1966 thus underpinned the
successful economic development of Singapore (Phang 1996).
7
Large agricultural plots outside the city were owned by wealthy individuals and British private companies.
7ADBI Working Paper 559 Phang and Helble
Public land leasing for private sector development generally falls under the term Government
Land Sales in Singapore. 8 Much urban redevelopment in Singapore has been achieved
through this land sales program, administered mainly by the Urban Redevelopment Authority
and, to a lesser extent, the HDB. Under the program, the government amalgamated or
reclaimed land, inserted infrastructure, provided planning and urban design guidelines, and
released the land for sale to private (including foreign) developers (Phang 2005). Sites are
usually sold on 99-year leases for commercial, hotel, and private residential development,
whereas leases for industrial sites are usually for 60 years or less. The lease tenure for other
types of sites varies depending on the uses. The usual sale method is through public tender.
Proceeds from land sales do not constitute part of the government’s operating revenue but
are instead channeled into government reserves. Singapore’s public wealth is estimated to
be more than 2.5 times its GDP. These are the net assets of the two sovereign wealth funds
(Temasek Holdings and the Government Investment Corporation) and the Monetary
Authority of Singapore. Investment incomes from these institutions contribute to the
government’s annual operating revenue.
3. THE HDB–CPF HOUSING FRAMEWORK
The HDB is the key pillar of Singapore’s housing system. The achievements of the HDB,
including its dominant role in Singapore’s housing sector, have been extensively
documented elsewhere. 9 This section draws from the existing literature and provides a brief
summary of the main features of the framework.
The HDB began operations on 1 February 1960. It replaced the SIT and was set up as a
statutory board to provide “decent homes equipped with modern amenities for all those who
needed them” (Teh 1975, 6). A target of 110,000 dwelling units to be built was set for 1960–
1970. On 25 May 1961, a huge fire broke out in the Bukit Ho Swee squatter district which
rendered about 16,000 people homeless. Housing the victims of the fire became the HDB’s
first major challenge. The government compulsorily acquired the burned-out land as a site
for 12,000 low-cost flats and promised to complete the first blocks of flats within 9 months.
The first five blocks of flats were completed by February 1962 and all 16,000 people who
had lost their homes in the fire had been rehoused on the same site by the end of 1964 (see
Latif 2009, 81–84). 10
In its initial years of operation, the HDB followed the British public housing model of
providing only rental units. It began offering housing units for sale on 99-year leasehold
basis from 1964 under its Home Ownership for the People scheme. 11 The HDB priced
housing units affordably for households with incomes not exceeding S$800 a month and
offered loans such that owners paid less in monthly mortgage payments than they would
have done in rents.
Price subsidies and housing grants are given to eligible households at the point of purchase
and not deferred. Government support for the HDB is in the form of (i) annual grants from
the current budget to cover its deficits incurred for development, maintenance, and
upgrading of estates; (ii) loans for mortgage lending and long-term development purposes;
and (iii) land allocation for HDB housing and comprehensive HDB town planning.
8
See Urban Redevelopment Authority web page at https://www.ura.gov.sg/uol/land-sales.aspx
9
Notable government publications include Yeh (1975), Wong and Yeh (1985), Fernandez (2011), and Centre for
Liveable Cities and HDB (2013). Academic publications include Chua (1997), Phang (1992, 2007, 2013a,
2015c), and Kim and Phang (2013).
10
As a consequence of the fire, an amendment was passed to allow land that had been devastated by fire to be
acquired at not more than one-third of the value of the vacant site, unless the minister specified otherwise. The
one-third figure was to ensure that landowners did not benefit from an appreciation in the value of their land
that would then be free from encumbrances.
11
See references in footnote 9, and HDB website at http://www.hdb.gov.sg
8ADBI Working Paper 559 Phang and Helble
The HDB brought about a transformation on the housing supply side. Table 3 shows the rate
of increase in population and the stock of housing from 1970 to 2015. Housing units
increased by about 50% in each decade from 1970 to 2000, outstripping population growth.
In particular, HDB housing displaced private housing as low-density shophouses, squatter
settlements, and villages were acquired by the government and demolished to make way for
high-rise flats. The homeownership rate doubled within 1 decade, from 29% in 1970 to 59%
in 1980, and reached 88% by 1990. From 2000 to 2010, the pace of housing construction
slowed dramatically and was below the population growth rate of 26% (Table 3).
Table 3: Housing Stock, Housing Supply, and Homeownership Rate, 1970–2015
Population Total Housing HDB Private Persons per HDB Resident
(’000) Stock Housing Housing Dwelling Dwellings as Home-
Unit Proportion of ownership
Housing Stock Rate
1970 2,075 305,833 120,138 185,695 6.8 39% 29.4%
1980 2,414 467,142 337,198 129,944 5.2 72% 58.8%
1990 3,047 690,561 574,443 116,118 4.4 83% 87.5%
2000 4,017 1,039,677 846,649 193,028 3.9 81% 92.0%
2010 5,076 1,156,732 898,532 258,200 4.4 78% 87.2%
2015 5,535 1,296,304 968,856 327,448 4.3 75% 90.3%
% Change
1970–1980 16% 53% 181% –30% –24% 84% 100%
1980–1990 26% 48% 70% –11% –15% 15% 49%
1990–2000 32% 51% 47% 66% –12% –2% 5%
2000–2010 26% 11% 6% 34% 14% –5% –5%
2010–2015 9% 12% 8% 27% –3% –4% 4%
HDB = Housing & Development Board.
Sources: Data from Singapore government publications and websites.
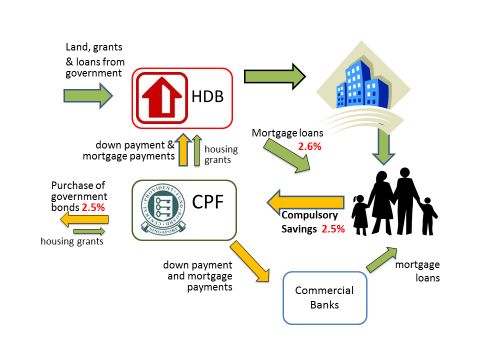
A major policy innovation in 1968 was for the government to utilize the CPF as a vehicle for
housing finance. In 1968, a new law was introduced to allow withdrawals from the fund to
finance the purchase of housing sold by the HDB. Both employers and employees
contributed a certain percentage of the individual employee’s monthly salary toward the
employee’s personal and portable account in the fund. When the CPF was established in
1955, the contribution rate was 10% (5% each by employees and employers) of the monthly
salary. With the new law in 1968, the contribution rates were raised steadily, and by 1984,
they were 25% of wages. The contribution rates in 2016 are 20% of wages for employees
and 17% of wages for employers, up to a monthly salary ceiling of S$6,000. 12
Figure 2 shows a schematic view of the mobilization of domestic savings for housing finance
through the CPF. Between 1968 and 1981, CPF savings could only be for payments related
to the purchase of public-sector-built housing (such as down payment or stamp duties). At
the beginning of the 1980s, the scheme was gradually liberalized, allowing for withdrawals
for other, non-housing-related purposes, such as medical expenditures. The interest rate on
CPF Ordinary Account savings yields a minimum of 2.5%. 13
The HDB receives government loans to finance its mortgage lending and pays interest at the
prevailing CPF savings rate. The HDB uses the loans to provides mortgage loans and
mortgage insurance to buyers of its leasehold flats (both new and resale). The typical loan
represents 80% of the price of the flat. The maximum repayment period is limited to 25
12
For details, see the CPF web page at https://mycpf.cpf.gov.sg/employers/employerguides/employer-
guides/paying-cpf-contributions/cpf-contribution-and-allocation-rates.
13
From 1 January 2008, an extra 1% interest per year is paid on the first S$60,000 of a member’s combined
balances. See the CPF web page on details of interest rates payable for various accounts at
https://mycpf.cpf.gov.sg/Members/AboutUs/about-us-info/cpf-interest-rates. Historical interest rates can be
found at https://mycpf.cpf.gov.sg/Assets/common/Documents/InterestRate.pdf.
9ADBI Working Paper 559 Phang and Helble
years. Every household can apply for a maximum of two HDB loans. The mortgage interest
rate charged by the HDB is pegged at 0.1 percentage point above the CPF ordinary account
savings interest rate. (The latter is based on savings rates offered by the commercial banks,
subject to a minimum of 2.5%.)
Figure 2: Mobilization of Domestic Savings for Housing through the CPF
CPF = Central Provident Fund, HDB = Housing & Development Board.
Sources: Modified from Phang (2007, 2013a).
Table 4 shows data for net assets, contributions, and withdrawals made by CPF members
as a proportion of GDP for 2014. Net assets of the CPF are 71% of GDP, contributions by
members comprise 7% of GDP, and net withdrawals are 4% of GDP. Withdrawals for the
purpose of housing payments dominate and comprised 55% of total net withdrawals.
The integrated HDB–CPF framework contributed to the growth of housing loans and the
development of the mortgage sector as homeownership rates increased. The ratio of
housing mortgage loans to GDP was only 4% in 1970; it increased to 10% by 1980 and to
62% by 2000. In 2014, the resident households’ housing mortgage loans to GDP ratio was
55.5%. Between 1970 and 2000, HDB outstanding mortgage loans accounted for more than
50% of total housing loans (Phang 2001). In 2002, the government amended its policy to
allow banks instead of the CPF to have first claim on a property should a borrower default on
his or her mortgage loan (Phang 2003). This paved the way for commercial banks to enter
the HDB mortgage market from 2003. With the low interest rate environment in recent years,
commercial banks have been able to offer loans at rates below the HDB mortgage loans’
2.6% interest floor. Financial institutions have since increased their share of outstanding
housing mortgage loans to more than 80% of the total (see Table 4).
10ADBI Working Paper 559 Phang and Helble
Table 4: CPF Assets, Contributions and Withdrawals by Purpose, 2014
S$ million % of GDP
GDP 390,089 –
Resident households’ outstanding mortgage
179,578 46.0
loans with financial institutions
Resident households’ HDB mortgages 37,178 9.5
CPF net assets 277,778 71.2
CPF contributions by members 27,917 7.2
CPF total withdrawals (net of refunds) 17,298 4.4
Purpose of Withdrawal S$ million % of CPF total net
withdrawals
HDB housing 6,892 39.8
Private housing 2,706 15.6
Attained the age of 55 years* 4,266 24.7
Medisave and medical insurance 2,162 12.5
Purchase of life-long annuity 2,069 12.0
CPF = Central Provident Fund, GDP = gross domestic product.
* Or leaving Singapore and West Malaysia permanently, as well as on grounds of death or permanent incapacitation.
Sources: Singapore Department of Statistics and CPF Financial Statements, 2014.
4. THE ROLE OF MARKETS
In a heavily state-dominated and highly regulated sector, marketization of HDB flats has
taken place in phases. In the 1960s and 1970s, when there were long waiting lists for HDB
flats, the HDB allocated flats with priority given to households affected by resettlement and
on a first-come-first-served basis for other households. Separate waiting lists were
maintained for rental and sale flats, and applicants could state their preferred zone and type
of flat desired. The waiting lists averaged 70,000 households per year between 1971 and
1985 (Phang 1992, 166). During this period of general shortage, there was policy concern
that HDB dwellings should not become a vehicle for speculation by allowing the price
subsidies to be capitalized on a secondary market. There were thus numerous regulations
concerning the resale of HDB flats which restricted household mobility.
Restrictions on resale took the following forms:
- Ban on market transactions prior to 1971: The HDB required owners who wished to sell
their flats to return them to the HDB at the original purchase price plus the depreciated
cost of improvements.
- Minimum occupancy period: In 1971, HDB allowed owners who had resided in their flats
for a minimum of 3 years to sell their flats at market prices to buyers of their choice who
satisfied the eligibility requirements for HDB homeownership. The minimum occupancy
period before resale was increased to 5 years in 1973 and has remained in place since.
- Debarment period: In 1971, when resale became permitted, those who sold their flat
were debarred from buying another HDB flat for a year. The debarment period was
increased to 2.5 years in 1975. The debarment period did not allow for household
mobility within the HDB sector and was a great deterrent for any household considering
sale of its dwelling. This was abolished in 1979, thereby greatly facilitating transactions
within the public housing sector.
- Resale levies: In 1979, in place of the debarment period, a 5% levy on the transacted
price of the dwelling was imposed on the seller to “reduce windfall profits.” A system of
graded resale levies, based on flat type, was introduced in 1982. Rules regarding
11ADBI Working Paper 559 Phang and Helble
circumstances under which levies could be waived were fine-tuned in the 1980s. The
resale levy system in its current form ensures that the subsidy on the second new flat
purchased by the household from the HDB is smaller than that for the first-time HDB flat
buyer.
Only citizens, non-owners of any other residential property, households with a minimum size
of two persons with household incomes below the income ceiling set by the HDB, were
eligible to purchase new or resale HDB flats prior to 1989. These rules restricted mobility
even as household incomes increased. Phang (1992) found that, in 1981, 31% of multiple-
worker HDB households with length of tenure greater than 5 years were no longer eligible to
purchase HDB flats. The consequence for commuting time was that, on average, workers
residing in HDB housing commuted greater distances by 2.2 minutes of auto time or 5.6
minutes of transit time, as compared with those residing in private apartments.
As the housing shortage eased and households sought to upgrade their housing or change
their location, there was a need to amend resale regulations on the eligibility of buyers in
order to facilitate household mobility within the HDB sector, as well as from the HDB to the
private sector and vice versa. Facilitating the development of a HDB resale market through
deregulation speeded up in the late 1980s and early 1990s. This could also be considered to
be in line with the then worldwide trend toward privatization and deregulation.
The following restrictions on purchasers of HDB resale flats were relaxed in 1989:
- Income caps for buyers: The income ceiling restriction was removed for buyers of HDB
resale flats.
- Nationality status of buyers: Permanent residents were allowed to purchase HDB resale
flats for owner-occupancy.
- Private housing ownership: Private housing owners were allowed to purchase HDB
resale flats for owner-occupancy. HDB flat-owners, who could not own any other
residential property before, could also invest in private-sector-built dwellings.
From 1991, single citizens above the age of 35 years were allowed to purchase HDB resale
flats for owner-occupancy. This was the first instance of HDB’s recognition of the needs of
single citizens to own their own homes independently. 14 In 1993, measures to deregulate
HDB financing for resale flats were introduced. At that time, the HDB was the only source of
finance for buyers of resale HDB flats.
The volume of transactions of resale HDB flats increased from fewer than 800 units in 1979
to 13,000 units in 1987 and 60,000 units in 1999. The number of resale transactions was
31,000 in 2004 and 37,000 in 2009; it declined to 17,000 in 2014 (a 10-year low)—a result of
numerous interventions to “cool” the property market. 15 The effects of these policy measures
on housing prices are further discussed in the next section.
5. SUPPLY-SIDE VS. DEMAND-SIDE INTERVENTIONS
Consistent with the shift toward a greater reliance on the market, the government introduced
CPF housing grants for the purchase of resale HDB flats in 1994. This demand-side policy
was a shift from the previous supply-side interventions. The subsidy was provided to eligible
first-time applicant households and deposited in their CPF accounts. The grants, however,
carried the risk that they could be capitalized into housing prices. The risk was exacerbated
14
The CPF housing grant was extended to single citizens (age 35 and above) in 1998. Since 2013, eligible single
citizens above 35 can buy a new 2-room HDB flat direct from the HDB. They may also apply for Additional and
Special Housing Grants. See: http://www.hdb.gov.sg/cs/infoweb/residential/buying-a-flat/new/single-singapore-
citizen-scheme
15
Resale volume data from HDB Annual Reports and HDB website at:
http://www.hdb.gov.sg/fi10/fi10321p.nsf/w/BuyResaleFlatNumberofResaleApplications?OpenDocument
12ADBI Working Paper 559 Phang and Helble
by the simultaneous deregulation of the resale market, in particular the removal of the
income ceiling and citizenship restrictions, and the resale HDB prices indeed started to
increase. Figure 3 shows the rate of increase in price indices for both private housing and
HDB resale flats from 1991. Following housing finance deregulation in 1993, HDB resale
prices increased sharply (by 71%) within the same year. The HDB resale prices rose further
after the introduction of CPF housing grants in 1994. This price increase had to be expected,
because resale public and private housing markets had become less segmented since high-
income citizens as well as permanent residents could purchase HDB resale flats.
Figure 3: Changes in Housing Price Indices, 1991–2015
80%
60%
40%
20%
0%
1991
1992
1993
1994
1995
1996
1997
1998
1999
2000
2001
2002
2003
2004
2005
2006
2007
2008
2009
2010
2011
2012
2013
2014
2015
-20%
-40%
HDB Resale Price Index Private Housing Price Index
HDB = Housing & Development Board.
Sources: Data from Urban Redevelopment Authority and HDB websites.
The government reacted by an increase in the HDB supply of new housing, the introduction
of a new Executive Condominium scheme, as well as an increase in government land sales
for private housing development. However, the housing prices continued to soar, with HDB
resale price increases much higher than private housing price increases in the 1993, 1995,
and 1996 (Figure 3). To bring prices down, the government introduced a package of anti-
speculation measures on 15 May 1996. These measures included capital gains taxes on the
sale of any property within 3 years of purchase, stamp duty on every sale and subsale of
property, limitation of housing loans to 80% of property value, as well as limiting foreigners to
non-Singapore-dollar-denominated housing loans. The HDB also changed various
regulations to bring demand down, such as limiting HDB flat buyers to two loans from the
HDB where there had been no limit before.
The effects of these measures coincided with the onset of the Asian economic crisis in 1997
and housing prices fell sharply. The decline in HDB resale prices was less than the decline
in private housing prices in 1998. In order to avoid too steep a fall, the government stopped
land sales and reduced stepwise the CPF housing grants. As a consequence, both the
private and public housing sectors were confronted with a situation of unsold units. As
described in Phang (2007), in early 2002, the HDB suspended its Registration for Flats
(queuing) System and ensured that new flats were only built when there was sufficient
demand for them. Other major restructuring measures followed, which resulted in a sharp
curtailment of the HDB building program; from 2000 to 2010, the number of HDB dwelling
units increased by a mere 6% (Table 3).
During the global financial crisis of 2008, HDB prices were remarkably resilient and
continued to increase while private housing prices fell. In the post-2008 global financial crisis
period, limited supply, rapid population increase, the low interest rate environment, and high
global liquidity, resulting from accommodative monetary policies of central banks in
13ADBI Working Paper 559 Phang and Helble
developed economies, led to accelerated price increases of Singapore property. Over the
decades, the upward trend in Singapore real estate prices had caused housing (both HDB
and private) to be viewed as an attractive investment class as compared with other asset
classes. This view has been reinforced by official statements from the government that HDB
flats are assets which it commits “to upgrade” and “whose value can be unlocked for
retirement, if needed” (Ministry of National Development 2011b). This approach raises
intergenerational equity implications and questions about the longer-term sustainability of
relying on appreciating house prices to finance retirement (Phang 2012).
The continuous upward trend in prices and the economic and political risks of a housing
bubble and increasingly unaffordable housing compelled the government to intervene. Since
2006, the Government of Singapore has announced several consecutive rounds of “cooling”
measures to curb investment demand for housing. Over the same period, to enhance
housing affordability, housing grants which allowed the HDB to better price-discriminate
based on household incomes became a feature of the HDB pricing policy. As eligibility for
HDB new subsidized flats and CPF Housing Grants (of S$40,000) extended to over 80% of
Singapore citizen households, subsidies needed to be better calibrated to household
incomes.
The Additional CPF Housing Grant (AHG) was introduced in 2006 (and enhanced in 2007
and 2009) to allow families with lower incomes to receive a higher grant amount which could
be used for either a new flat or a resale flat. The amount of the AHG depends on the
average gross monthly household income. Households with monthly household incomes
less than S$5,000 are eligible for the AHG. The AHG ranges from S$5,000 (for households
with incomes from S$4,501 to S$5,000) to S$40,000 (for households with incomes below
S$1,500).
The Special Housing Grant (SHG) was introduced in 2011 to help households buy four-room
or smaller new flats in non-mature estates directly from the HDB. The SHG was enhanced in
2012, significantly expanded in 2013, and expanded again in 2015. 16 The amount of the
SHG depends on the average gross monthly household income. Households with household
incomes less than S$8,500 per month are eligible for the grant. The amount of the grant
ranges from S$5,000 for households with incomes from S$8,000 to S$8,500, to S$40,000 for
households with incomes below S$5,000.
A Step-Up Housing Grant (of S$15,000) was introduced in 2013 to help families in
subsidized two-room HDB flats in non-mature estates upgrade to purchase three-room HDB
flats in non-mature estates. The net effect of these several housing grants is to allow the
HDB to price its flats based on a household’s ability-to-pay thus ensuring that almost all
employed citizens can afford to own a home.
From independence, homeownership affordability has always been a very visible symbol of
the government’s “ability to fulfil its promise to improve the living conditions of the entire
nation” (Chua 1997, 139). The ratio of the price of a new HDB four-room flat to median
household income was generally 4.0 or less prior to 2005 (Phang 2009, 2010). HDB resale
prices are generally higher than new flat prices as they are market-determined and there is
no waiting period for construction to be completed. Figure 4 shows the ratio of the median
HDB 4-room flat resale price to median resident employed household annual income. The
ratio was generally below 4.5 prior to 2008 and rose to above 5.0 from 2010 to 2012. As
prices in the HDB resale market rose, new HDB flat prices followed a similar trend,
outstripping income growth. Although the median-income household would be able to easily
afford a new HDB five-room flat in a new town location at around 4 times the annual income
in 2006, the price had increased to closer to 6 times the annual income by 2011 (Phang
16
In August 2015, the government increased the maximum grant amount from S$20,000 to S$40,000. The
income ceiling for households to qualify to receive the SHG was raised from S$6,500 to S$8,500.
14ADBI Working Paper 559 Phang and Helble
2012). The introduction of new housing grants enhanced affordability but contributed to
house price increases during the period when new HDB housing supply was minimal.
Moreover, what is affordable may not be available, as new HDB build-to-order (BTO)
projects were reportedly oversubscribed (e.g., by up to 5 times in a February 2011 exercise).
Dissatisfaction over rising prices and difficulties in securing HDB housing were among the
factors that contributed to a 6% swing in votes against the PAP in the May 2011 elections
(from the 2006 elections) to 60%, its lowest since independence. The opposition Workers’
Party won six seats in Parliament, including a Group Representation Constituency of five
seats, the first time a Group Representation Constituency had been won by an opposition
party. In what may be interpreted as a response to these developments, the government
increased the household income ceiling for the purchase of new HDB flats from S$8,000 a
month to S$10,000 a month in August 2011 (Ministry of National Development 2011a). The
income ceiling for eligibility to purchase an Executive Condominium was also increased,
from S$10,000 to S$12,000. In August 2015, the government further increased the monthly
household income ceilings from S$10,000 to S$12,000 for purchasing a new HDB flat, and
from S$12,000 to S$14,000 for a new Executive Condominium (H.L. Lee 2015). These
changes enable even more young Singaporean households to enjoy housing subsidies for
homeownership—the median household income among all employed households was
S$8,292 in 2014 according to the Department of Statistics.
Figure 4: Median HDB 4-Room Flat Resale Price to Median Household Income Ratio
5.5
5.1 5.1
5.0 5.0
4.7 4.8
4.5 4.5 4.4
4.2
4.3
4.2 4.3
4.0
3.9 3.9 3.9
3.8
3.5
3.0
2000 2001 2002 2003 2004 2005 2006 2007 2008 2009 2010 2011 2012 2013 2014
HDB = Housing & Development Board.
Sources: Calculated from data from government websites.
In what can be described as a retreat from the market, new HDB flats have since 2013 been
offered at prices that are “delinked” from market prices. In 2013, the Minister for National
Development announced that he aimed to bring down BTO prices from about 5.5 times
applicant households’ median annual income to 4 times their median annual income. In
2014, after grants, three-room BTO flats cost 4.57 times the annual median applicant
households’ annual income (Table 5). Four- and five-room flats were at prices that are at
5.26 times and 5.36 times applicant households’ annual incomes, respectively (The Straits
Times, 17 November 2014).
Numerous measures have been introduced to cool the housing market between 2006 and
2013. The measures introduced include the following: 17
17
For details of these measures, see Lee et al. (2013) and http://www.srx.com.sg/cooling-measures
15ADBI Working Paper 559 Phang and Helble
- Prohibiting developers from allowing purchasers to defer stamp duty and interest
payments to a later date
- Prohibition of interest-only housing loans
- Seller stamp duty
- Loan-to-value ratio limits
- Additional buyer stamp duty
- Tenor restriction limit
- Three-year waiting period before new SPRs are eligible to purchase resale HDB flats
- Mortgage service ratio limit
- Total debt service ratio limit
Table 5: Price Affordability of HDB Flats in 2014
Applicants’
Median Annual Ratio of Price
HDB Flat Average BTO Average BTO Household (after Grants)
Type Price Price after Grants Income to Income
2-room $110,000 $55,000 $19,200 2.86
3-room $187,000 $137,000 $30,000 4.57
4-room $295,000 $265,000 $50,400 5.26
5-room $386,000 $386,000 $72,000 5.36
BTO = build-to-order, HDB = Housing & Development Board.
Note: BTO refers to HDB flats. Prices are for BTO flats in non-mature estates.
Source: The Straits Times, 17 November 2014.
With the numerous market intervention measures introduced since 2006, it is difficult to
isolate the price effects of a particular cooling measure or the extent to which housing grants
were capitalized (Lee et al. 2013). The measures to cool the market can be viewed as
macroprudential policies to stabilize housing prices, reduce the returns for housing investors,
and pre-empt a housing bubble from developing.
The housing tax and subsidy framework in Singapore is highly progressive. The basic idea is
that wealthy property owners and investors are taxed and the receipts used to subsidize
homeownership of lower-income groups. Table 6 provides a simplified picture of the
progressivity of the housing tax and subsidy framework at the point of purchase. The
housing wealth redistribution is codified in a complex law. Aiming for a fair and targeted
outcome, the effective housing subsidy is based on multiple criteria. For example, in 2015,
the Proximity Housing Grant (PHG) was set up to enhance grants for households purchasing
a resale HDB flat close to their parents or children.
16ADBI Working Paper 559 Phang and Helble
Table 6: Progressivity of Housing Purchase Taxes and Subsidies
Residency/Incomes/Housing Types Additional Buyer Stamp Duty (+)
Price Subsidy (–)
Foreigners 15%
SPR investors 10%
Singaporean investors 7%
SPR homeowners 5%
Singaporean high-income homeowners 0%
Executive Condominium –10%
HDB 5-room –12%
HDB 4-room –20%
HDB 3-room –35%
HDB 2-room –50%
HDB = Housing & Development Board, SPR = Singapore permanent resident.
Note: Estimates of price subsidies based on difference between resale market prices and new flat prices.
In order to further curb the housing demand, the government has been increasing the supply
of HDB flats since 2011. With the increase in supply of both HDB and private housing, the
shortage of housing has started to decline. The government, however, aims to ensure that
housing remains an attractive investment; one reason being that the wealth of many citizens
is locked into housing and a sudden fall of housing prices would have considerable negative
wealth effects.
6. PROMOTING RACIAL INTEGRATION: THE ETHNIC
INTEGRATION POLICY
Singapore hosts citizens from different racial and religious backgrounds. The HDB’s
objective has always been to integrate the various income and racial groups within the public
housing program and to avoid the emergence of low-income or ethnic ghettos. This policy
was a consequence of events in the 1960s, when there were episodes of ethnic violence
between the Chinese and the Malays that resulted in several deaths and injuries. Racial
harmony has since been a goal of the government (Ooi, Siddique, and Soh 1993). Beginning
in the 1970s, the HDB allocated new flats in a manner that would give a “good distribution of
races” to different new towns. However, by 1988, a trend of ethnic regrouping through the
resale market was highlighted as a social problem which could lead, over time, to the re-
emergence of ethnic enclaves.
In 1989, the government implemented an Ethnic Integration Policy under which racial limits
were set for the HDB blocks and neighborhoods. 18 The Chinese, Malay, Indian/Others
neighborhood limits were set at 84%, 22%, and 10%, respectively. 19 The block quotas were
3% above each neighborhood limit. For new flats, a particular ethnic group will not be able to
buy a flat from the HDB if the quota for that group has been reached for the particular block
or neighborhood (Centre for Liveable Cities and HDB 2013, chapter 5). For the resale
market, when the set ethnic group limits for a particular block or neighborhood are reached,
those wishing to sell their HDB flats in the particular block or neighborhood are constrained
18
Dodge (2006) devotes a chapter to Singapore’s Ethnic Integration Policy in his book on Thomas Schelling.
Schelling’s models on the neighborhood “tipping” phenomenon that would quickly lead to total segregation of
different ethnic groups were influential in the Singapore government’s adoption of policies to control the
movement of population groups in the public housing sector.
19
In March 2010, in response to changing demographics, the neighborhood limit for Indian/Others was raised to
12%.
17ADBI Working Paper 559 Phang and Helble
to sell them to another household of the same ethnic group. The government had
emphasized that “our multiracial policies must continue if we are to develop a more
cohesive, better-integrated society. Singapore’s racial harmony, long-term stability, and even
viability as a nation depend on it” (quoted in Ooi, Siddique, and Soh 1993, 14).
The HDB for its housing estates has worked remarkably well in Singapore and has
contributed to social integration of the different races. In a May 2015 interview, Deputy Prime
Minister Tharman Shanmugaratnam described this policy as “the most intrusive policy in
Singapore” which “has turned out to the most important.” 20
However, the restriction in selling to the same ethnic group has resulted in some market-
distortionary effects. In a careful study, Wong (2013) matched more than 500,000 names in
the phone book to ethnicities to calculate ethnic proportions at the apartment block level.
She then investigated transaction price and time-on-market duration differences for
constrained and unconstrained blocks using 35,744 transactions between April 2005 and
August 2006. On average, Wong (2013) found the transaction prices for Chinese
constrained units to be 5% higher than transactions in comparable unconstrained blocks.
Conversely, the prices for Malay and Indian constrained units were 3% lower. 21 She also
estimated longer time-on-market durations of between 1 and 1.4 months for constrained
sellers.
In March 2010, in response to the increase in the number of SPRs living in public housing
estates, the HDB introduced a new SPR quota for non-Malaysian SPR families buying flats
to facilitate better integration and to prevent new SPR enclaves from forming in public
housing estates. The SPR quota is set at 5% and 8% at the neighborhood and block levels,
respectively. Malaysian SPR buyers are not subject to the SPR quota as they are
considered to have close cultural and historical similarities with Singaporeans. 22
7. LAND LEASE SYSTEM AND THE LEASE BUYBACK
SCHEME
Land Lease System
With about 90% of the land owned by the state, all HDB flats and most high-rise private
condominiums are sold on a 99-year leasehold basis. The limited number of freehold
properties command a premium over comparable leasehold properties as the value of
leasehold properties at the termination of the lease is expected to fall to zero. The Singapore
Land Authority provides a Leasehold Table which expresses the value of the residual tenure
as a percentage of freehold value of land. 23
Capozza and Sick (1991) have shown that leasehold landowners will redevelop earlier and
at a lower intensity as compared with freehold owners, because the value of the developed
20
“An Investigative Interview: Singapore 50 Years after Independence”, 45th St Gallen Symposium, May 2015.
See https://www.youtube.com/watch?v=hpwPciW74b8.
21
Using an average price of units sold (S$234,000), Wong (2013) estimated these price differences to represent
5 times the median monthly income of the Chinese (S$2,335) and 3 times the median monthly income of the
Malays (S$1,790) and the Indians (S$2,167).
22
A non-Malaysian SPR household buyer must satisfy both the ethnic proportion and SPR quota to qualify to buy
a resale HDB flat. The ethnic proportions and SPR quota are updated on the first day of every month and
buyers/sellers can check the status of a unit online. See HDB web page at
http://www.hdb.gov.sg/fi10/fi10296p.nsf/PressReleases/C515273FA068DD58482576DD00169155?OpenDocum
ent.
23
The Leasehold Table is used together with the Table of Development Charge for the computation of differential
premiums payable when state title restrictions involving change of use and/or increase in intensity of use for
leasehold land are lifted. See
http://www.sla.gov.sg/Portals/0/Services/Land%20Lease%20Conditions/DP%20policy%20wef%2031%20Jul%
202000.pdf
18You can also read