THE WESTERN CAPE PROPERTY REPORT 2018/19 - Wesgro
←
→
Page content transcription
If your browser does not render page correctly, please read the page content below
WESGRO

THE
WESTERN
CAPE
PROPERTY
REPORT
2018/19
This report is brought to you by WESGRO,             trade and investment promotion initiatives,
                            the official tourism, trade and investment           and facilitate the links between business and
                            promotion agency for Cape Town and the               government decision makers.
                            Western Cape.                                           To this end, we are often the first port of
                               Our overall mandate is to promote economic        call for foreign buyers, local exporters and all
                            activity and facilitate job creation by marketing    investors looking towards the ever-growing
                            Cape Town and the Western Cape as                    potential of our region.
                            a competitive business and leisure destination          This publication is produced by the Research
                            globally. We do this by attracting and retaining     as well as the Marketing and Communications
                            foreign direct investment, landing film and media    divisions within Wesgro as an analytical introduction
                            productions, growing exports, and ensuring more      into the opportunities to be found in the Western
                            business and leisure tourists visit our province.    Cape across the commercial, retail, industrial and
                            And we do this by facilitating important dialogues   residential property sectors.
                            between the private and public sectors in our
                            region and beyond.                                   For the full range of research and documentation
                               We look to align the Western Cape with            produced by Wesgro, and for further information
                            national priorities in terms of economic growth,     on our organisation, please visit www.wesgro.co.za

           02 Forewords                              THE CAPE WINELANDS DISTRICT:                51	More good reasons to invest in
CONTENTS

           04 Welcome to this report                 STELLENBOSCH, PAARL                             Saldanha Bay and Vredenberg
           05 A guide to the research                & FRANSCHHOEK                               52	Commercial property
                                                     40	Introducing the Cape Winelands          53	Industrial property
           THE CITY OF CAPE TOWN                         District                                54	Residential property
           06	Introducing the City of Cape Town     41	Spotlight on economic sectors
           07	Spotlight on economic sectors         41	More good reasons to invest             THE GARDEN ROUTE DISTRICT:
           07	More good reasons to invest               in the Cape Winelands                   GEORGE
               in Cape Town                          42	Commercial property                     58	Introducing the Garden Route
           09	Introduction to the City of Cape      45	Industrial property                         District and George Municipality
               Town property market                  46	Residential property                    59	Spotlight on economic sectors
           10	Commercial property                                                               59	More good reasons to invest
           23	Industrial property                   THE WEST COAST DISTRICT:                        in George
           31	Residential property                  SALDANHA BAY & VREDENBURG                   60	Commercial property
                                                     50	Introducing the West Coast District     61	Industrial property
                                                     50	Understanding the Industrial            62	Residential property
                                                         Development Zone (IDZ)
                                                     51	Spotlight on economic sectors           	Acknowledgements and credits
FOREWORDS

            Forewords
            FOREWORD BY                                          the private and public sector in determining
            MINISTER DAVID MAYNIER                               future investments as well as the building of
            MEC for Finance & Economic Opportunities             infrastructure, and will play a significant role as
            in the Western Cape                                  the Western Cape moves towards its vision for
            The growth of the Western Cape economy               sustainable economic growth in our province.
            and the all-important creation of more jobs
            is the engine that drives the work of the
            Western Cape Government. But that engine             FOREWORD BY
            requires a physical space; a place to set up         ALDERMAN JAMES VOS
            shop; to provide offices and factory space;          Mayoral Committee Member for Economic
            on which to build homes for its employees.           Opportunities and Asset Management,
            This physical space is property, and it is           City of Cape Town
            often the foundation, quite literally, on which      Making up the most significant contribution to this
            investment is built.                                 publication, are the property values to be found
              The Ministry for Finance & Economic                within the City of Cape Town, demonstrating not
            Opportunities therefore welcomes the first           only the diversity of commercial, retail, industrial
            edition of Wesgro’s Property Report on the           and residential opportunities to be found in our
            Western Cape. It is the first publication of         metropole, but its contribution to the economy of
            its kind in South Africa that brings together        the Western Cape as a whole.
            statistical information and analysis on                We look forward, as a City, to the value this
            a number of districts, across all property           publication will add to the many other initiatives
            sectors within those districts. It will therefore,   which drive investment into our municipality, and
            no doubt, be an invaluable tool for both             have no doubt that it will strengthen the work of

                                                   2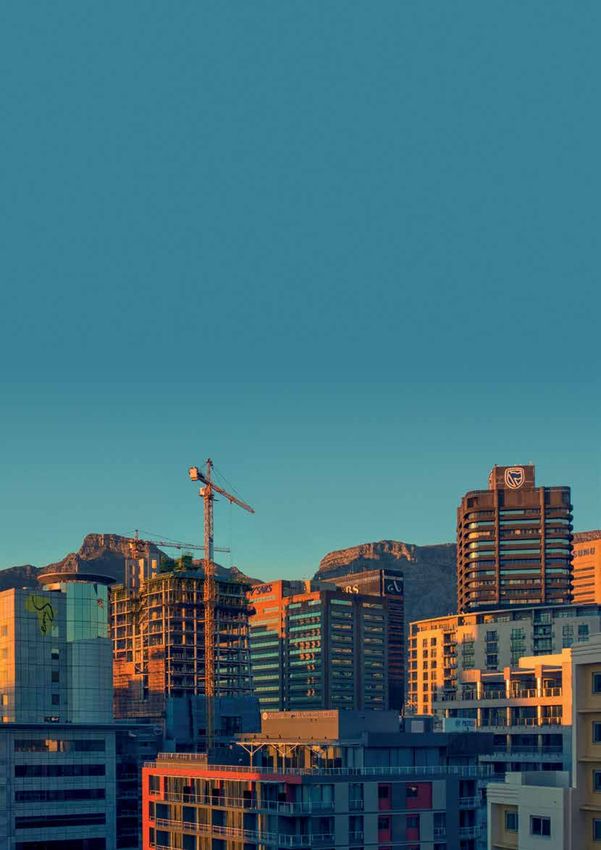
WESGRO THE WESTERN CAPE PROPERTY REPORT 2018/19

our own Invest Cape Town Initiative to build       fluctuations in our national economy, our
our city’s brand.                                  region nevertheless remains an investment
  There are many reasons why Cape Town has         destination which will continue to appreciate
clocked up the accolades that have come its        steadily. There are few destinations in the
way, and one of the reasons is that it is often    world to rival ours on its geographic, economic
the first with innovative projects that set a      and natural qualities.
standard for other cities and provinces – in         A property industry also requires the highest
South Africa and beyond – to follow. This          levels of co-operation between government
publication is one such example, and we            and the private sector. To ensure investment,
congratulate Wesgro on another research            this also requires co-operation in terms of
milestone attained.                                the collection and sharing of data – facts and
                                                   figures that enable investors to make educated
                                                   decisions.
FOREWORD BY                                          The WCPDF therefore applauds Wesgro
DEON VAN ZYL                                       for taking the initiative in producing this
Chairperson, Western Cape Property                 publication, both to attract investment to the
Development Forum                                  province, and to reassure current property
A country’s property market reflects the state     owners across all property sectors that
of a country’s economy, and confidence and         fixed capital investment is receiving serious
security in this market sector reflects investor   attention. The WCPDF looks forward to this
confidence in the future.                          publication becoming an annual investment
  To this end, while Cape Town and                 report that reflects the state of the Western
the Western Cape are not immune to                 Cape’s growth-economy.

                                                            3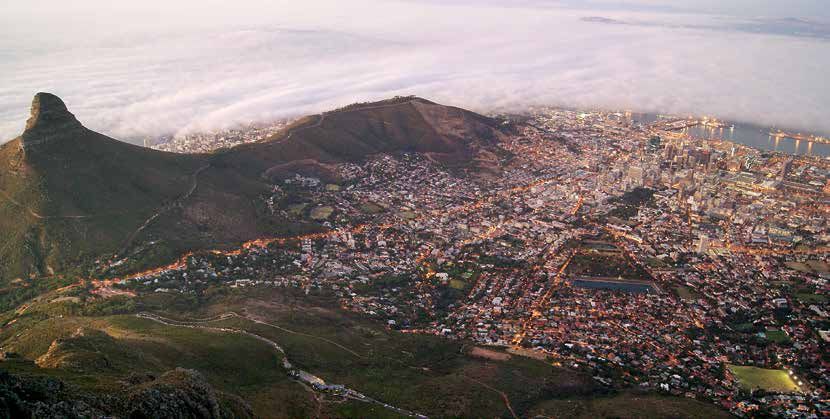
WELCOME

          Welcome to the first edition
          of our Property Report
          on the Western Cape
          LOCATION, LOCATION, LOCATION                        Vredenburg which form part of the West
          A primary objective of Wesgro is to provide         Coast District. The map opposite indicates
          research and data, customised for the Western       where these are to be found in the Western
          Cape, to assist both current and future             Cape province.
          investors to make key decisions around the
          various markets and sectors in our region.          For each of these areas, we have divided
            However, we believe these markets and             our research into:
          sectors have a common denominator in the             A brief overview of the area, the key
          value of property – the fixed capital asset           economic sectors to be found in it, and

                                                                                                                        PHOTOGRAPH Sam Fourie courtesy of Western Cape Property Developement Forum
          that the lion’s share of investors will require       a variety of good reasons to consider it
          to make their investment visions a reality,           for investment
          whether that asset falls into commercial,             Property values for the 2018/19 financial
          retail, industrial or residential property.            year in terms of
            In other words, we believe that property is              Vacant land for sale (commercial and
          a key driver of investment into any region, and             industrial)
          often the first consideration that investors will           Commercial properties values, for sale
          make when deciding on their locale. Just as it               and to rent
          is true for property across the globe location               Retail property values, for sale and to rent
          really does count, and the Western Cape offers                 Industrial property values, for sale and
          some of the best locations in the world.                        to rent
            To this end, we bring you the inaugural edition               An overview of the residential property
          of what will become our annual Western Cape                       market.
          Property Report, focusing our attention this year
          on the City of Cape Town, the Municipality of       A BUYER’S MARKET
          George located in the Garden Route District,        While the phrase is usually used most
          the three towns of Stellenbosch, Paarl and          commonly to describe a point in time in a
          Franschhoek that fall within the Cape               residential property cycle, in the case of this
          Winelands District, and Saldanha Bay and            publication we believe that the Western Cape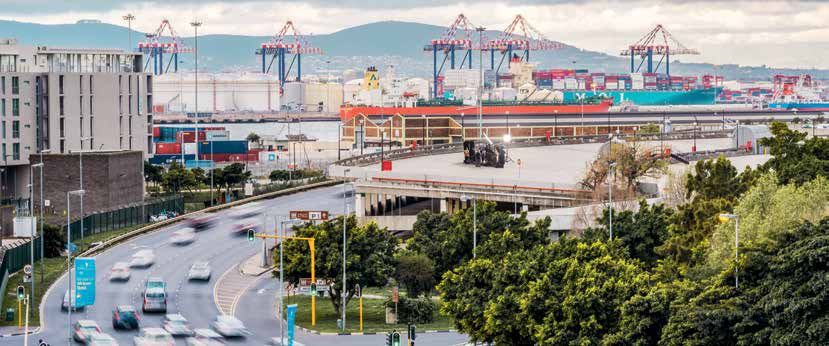
WESGRO THE WESTERN CAPE PROPERTY REPORT 2018/19

                                                                          A GUIDE TO THE RESEARCH
                                                                          The following outlines the primary sources that
                                                                          have been used through this report.

            WEST                                                          In terms of municipal data on each region:
            COAST
                                                                          Apart from data provided by Wesgro’s own
           Vredenberg                                                     Research division, information has been sourced
Saldanha
   Bay                  Paarl                                             from the Municipal Economic Review and
                                                                          Outlook (MERO), 2018 produced by the Western
                                Franschhoek
               Stellenbosch                         GARDEN ROUTE          Cape Provincial Government; the South African
      CITY OF       CAPE WINELANDS                    George              Economic Indicators Database, Quantec EasyData
      CAPE                                                                and the Economic Performance Indicators for Cape
      TOWN                                                                Town (EPIC), 2018 (Q3 and Q4), produced by the
                                                                          City of Cape Town.
                                                                             Other secondary sources of data are credited in
                                                                          the publication as per the footnotes provided.
             right now is in a buyer’s market across all its
             property nodes, making it a highly attractive                In terms of property values for all Commercial,
             option for those looking to make fixed capital               Retail and Industrial properties:
             investments for the first time, or for those                 The data accumulated and analysed in terms of
             expanding on their existing investments.                     properties for sale or to rent were as at what was
               After many years of high property price                    available on the market at the time the research
             growth, due in no small part to the desirability             was conducted during the period January to April
             of the Western Cape, along with strong semi-                 2019, and as per the asking prices loaded onto
             gration trends from other parts of the country,              the Property.24 website by real estate agencies
             property values are stabilising throughout the               and commercial/industrial property brokers.
             province, but particularly in and around the                    The exception to this was in terms of commercial
             metropole of Cape Town. These are offering                   (office) rental and vacancy rates in the areas
             opportunities that we have no doubt will                     of Bellville, the Cape Town CBD, Century
             continue to appreciate in value above any                    City, Claremont, Central (being Pinelands and
             others in the rest of the country, albeit it at              surrounds), Rondebosch/Newlands and the V&A
             a more reasonable rate than experienced                      Waterfront – all of which fall into the City of Cape
             particularly over the past decade.                           Town. For these seven nodes, the most recent
               There is much information to be digested in                quarterly Office Vacancy Report produced prior to
             this publication, which covers a sampling of                 publication by the South African Property Owners
             four important economic growth nodes in our                  Association (SAPOA) has been utilised.
             province, and we have no doubt it will become                   In addition to the above, for analytical
             a very valuable resource for comparative                     purposes, use was also made of the Rode’s Report
             analysis as it grows year-on-year.                           on the South African Property Market, produced
                                                                          quarterly by Rode & Associates in Cape Town.

             TIM HARRIS                                                   In terms of Residential properties:
             CHIEF EXECUTIVE OFFICER                                      All information on the market values and analytics
             WESGRO                                                       of sold properties (ie: market stock, age profiles of
                                                                          buyers, price performance and activity) has been
                                                                          sourced from Lightstone Property.
                                                                             Information on rentals prices has been sourced
                                                                          from Property24.com, and the analyses of these
                                                                          are based on rentals being asked and stock
                                                                          availability as listed by real estate agencies, at the
                                                                          time research was conducted (from January to
                                                                          April 2019).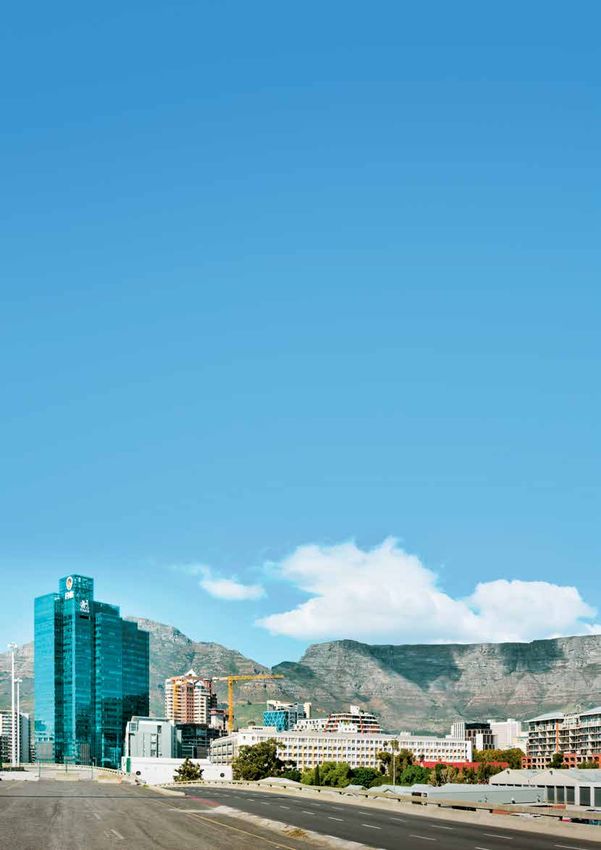
THE CITY OF WEST
COAST
CENTRAL
KAROO
CAPE TOWN CITY
OF
CAPE
TOWN
CAPE
WINELANDS
OVERBERG
GARDEN ROUTE
Making progress possible
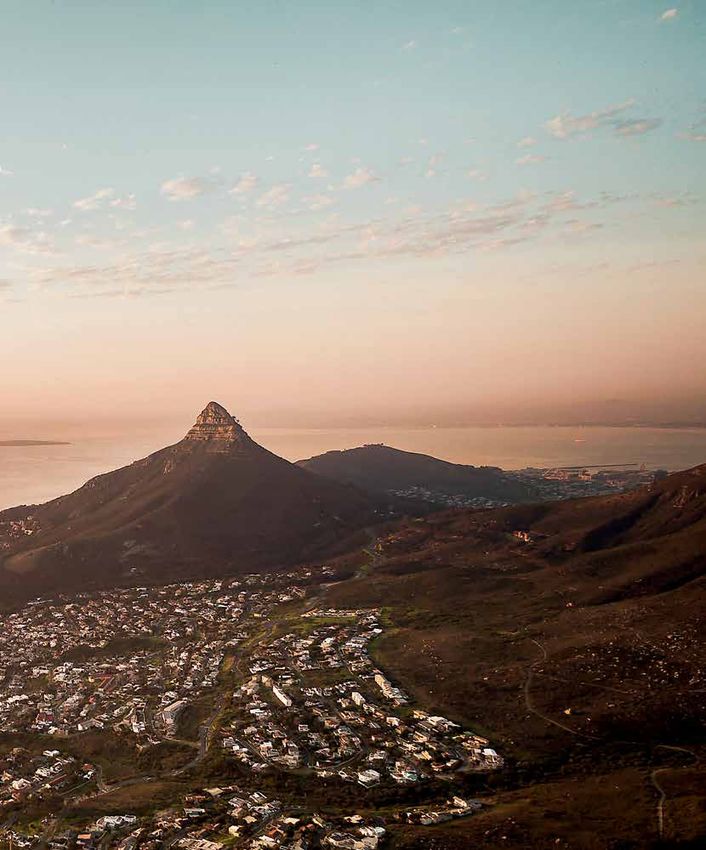
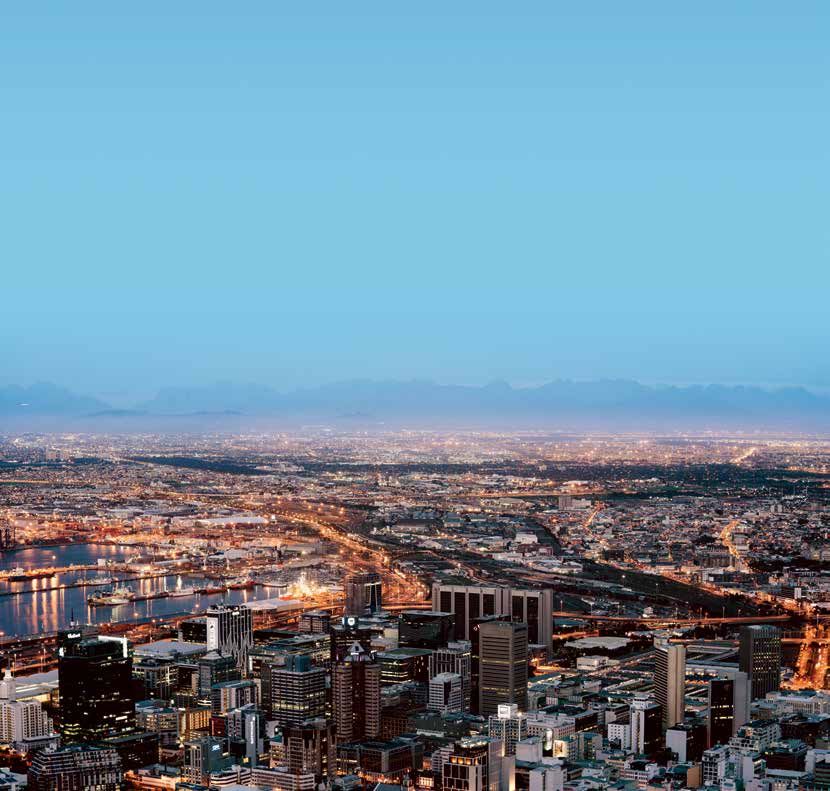
While it is arguably one of the most beautiful cities in the world and high
on the tourism agenda, there is much more to Cape Town than just its
natural beauty. Through the provision of world-class infrastructure, it is
a city that is not only a gateway to the African continent, but one where
both business and lifestyle options score top marks.
Cape Town has a highly diverse economy with In January 2019, of growth include real estate, property
a number of flourishing sectors. the City of Cape development and construction, as well as
It is South Africa’s second largest economic Town received its dynamic enterprises involved in boat building,
centre and second most-populated city after 15th consecutive clothing and textiles, electronics, renewable
Johannesburg. It is also home to one of the unqualified1 energy and growing the green economy.
busiest container ports in the country as well audit from the Cape Town experienced an unprecedented
as the second busiest airport. Furthermore, it auditor general. drought in 2017 and 2018, with severe water
is the second-most important contributor to restrictions imposed at the time. This resulted
national employment and plays a crucial role in the City establishing its Water Resilience
in job creation in South Africa. Strategy that not only turned Cape Town
The strategic sectors that it has positioned away from the brink of disaster, but also put
for growth include manufacturing, financial measures in place in the short-, medium- and
services, agri-business, tourism, film and longterm to prevent the situation arising again
media, digitech and business process in the future, and strengthening its overall
outsourcing. Within these, particular nodes resilience.
1 A
n unqualified audit is an independent auditor’s judgment that a company’s financial statements are fairly and appropriately presented, without any
identified exceptions, and in compliance with generally accepted accounting principles.
6
WESGRO THE WESTERN CAPE PROPERTY REPORT 2018/19

         SPOTLIGHT ON ECONOMIC SECTORS2
         The six largest economic sectors in            of Old Mutual Africa, Santam, Direct              Other economic sectors that play
         Cape Town by value in 2018 were                Axis, Metropolitan and Sanlam.                 an important role in Cape Town
         finance, insurance, real estate and               In terms of the business services           are construction (R21.99bn); food,
         business services (contributing an             sector, business process outsourcing           beverages and tobacco (R18.52bn);
         estimated R115.69 billion or 27.33%            (BPO) and information technology               electricity, gas and water (R12.89bn);
         of gross value added, or GVA);                 (IT) were the largest contributors to          petroleum products, chemicals,
         wholesale and retail trade catering and        employment growth in Cape Town                 rubber and plastic (R12.34bn); and
         accommodation (R72.39bn or 17.10%              between 2006 and 2016. A research              communication (R43m).6 7
         of GVA); manufacturing (R63.34bn or            report4 released in 2018, commissioned            Of particular interest in terms of the
         14.96% of GVA); general government             by the Cape Innovation and Technology          latter is that Cape Town is also South
         (R52.93bn or 12.50% of GVA);                   Initiative (CiTi), Wesgo and the Allan         Africa’s “new media” hub8, with 57% of
         transport, storage and communication           Gray Orbis Foundation, found that over         all South African gaming studios located
         (R48.24bn or 11.40% of GVA); and               40 000 people are now employed in              in the city, as well as a large proportion
         community, social and personal                 the Cape Town tech industry – twice as         of the country’s animation studios.
         services (R28.88bn or 6.82% of GVA).3          many as in Johannesburg.                          Cape Town’s boat building economy
            With Cape Town emerging as a key               Cape Town has indeed emerged as             is also proving its worth, with more
         financial services hub in South Africa,        a significant tech and innovation hub,         than R1bn in export revenue9 now
         a large portion of private investment          with the largest telecommunications            generated annually, according to the
         and asset management services, as              market and the most venture capital            office of the Mayor of Cape Town.
         well as insurance companies, are               activity in South Africa, according to
         located here, including the head offices       Invest Cape Town5.

    MORE GOOD REASONS TO                                                         Cape Town International Airport was voted
    INVEST IN CAPE TOWN                                                          Africa’s Leading Airport for the second
    The City of Cape Town is involved in a number
    of initiatives aimed at attracting investors                                 consecutive year at the 25th World Travel Awards
    through the expansion of infrastructure and                                  Africa & Indian Ocean in October 2018. It was
    easing the path towards doing business.
                                                                                 also voted Best Airport in Africa at the 2019
    CAPE TOWN INTERNATIONAL                                                      Skytrax World Airport Awards – the fourth year
1   AIRPORT EXPANSION                                                            running that it has secured this award.
    Cape Town International Airport is set to
    undergo extensive upgrades and expansions
    to the tune of R7bn over the next four years.
    Construction, which is expected to commence                            INVEST CAPE TOWN is Cape Town’s business brand dedicated
    in early 2020, is set to be completed by 2023.                         to celebrating a dynamic city economy and creating awareness
    The planned upgrades and expansions include                            among the public and investors about the attractiveness and
    the building of a new runway as well as new                            competitiveness of Cape Town as a place to do business. Invest
    international and domestic departure lounges to                        Cape Town’s purpose is to build and maintain a strong brand
    meet the ever-growing demand on the facility.                          reputation for Cape Town and contribute to the city’s global
      In parallel, new flights are continuously being                      competitiveness. The City of Cape Town launched the brand to
    added, thanks to the phenomenal success of                             enable the future development of Cape Town and to achieve the
    the Cape Town Air Access (CTAA) initiative –                           city’s vision of becoming a high-performance African business
    a powerful collaboration and combined effort                           hub that supports big ideas and innovation. For more info, visit
    between the City of Cape Town, the Western                             www.investcapetown.com
    Cape Government, Airports Company South
    Africa, Cape Town Tourism, Wesgro, South
    African Tourism and the private sector. The
    primary mandate of the Air Access team is to

    2   Invest in Cape Town 2017/18, Regional Market Analysis and Intelligence, Wesgro; IHS Markit 2017.
    3     Quantec EasyData, 2019.
    4   Evaluation & Network Analysis of the Cape Town-Stellenbosch Tech Sector, Endeavour Insight, 2018.
    5     www.investcapetown.com.
    6     All 2018 figures are estimates.
    7     Quantec EasyData, 2019.
    8   Invest in Cape Town 2017/18, Regional Market Analysis and Intelligence, Wesgro.
    9    www.iol.co.za/personal-finance/investments/local-luxury-boat-exports-contributes-r1bn-to-economy-17255461.

                                                                             7
THE CITY OF CAPE TOWN | CAPE WINELANDS | SALDANHA BAY/VREDENBURG | GEORGE

                                                                                           CREATING A SMART CITY THROUGH
ABOUT
                             promote, develop and maintain air routes in
                             and out of Cape Town International Airport
                                                                                      3    THE CITY OF CAPE TOWN BROADBAND
CAPE TOWN                    through: route retention (ensuring the success                PROJECT
MUNICIPALITY10               of existing routes); route expansion (increasing              The objective of the City’s Broadband Project11
 Stretching from            frequencies and capacity on existing routes);                 is to create a high-speed, high-capacity
 Gordon’s Bay in the         and new route establishment (facilitating the                 municipal telecommunications network –
 south to Atlantis           establishment of new routes).                                 the Metro Area Network (MAN) – which will
 in the north, the             Since inception in 2015, the initiative                     extend throughout the greater Cape Town
 City of Cape Town           has launched 15 new routes and facilitated                    area. This is designed primarily to meet the
 incorporates                21 route expansions. This has doubled seat                    needs of the City, as well as to provide services
 2 446km² and has            capacity at Cape Town International Airport,                  to both the general public and private sectors.
 294km of coastline.         adding 1.5 million two-way seats to the                       A Telecoms Networks Strategy positions the
 With an estimated          Cape Town network, contributing an estimated                  MAN as the carrier for a number of networks
 population of               R6bn in direct tourism spend since July 2015.                 and services. As at June 2018, core network
 4 322 031, the                                                                            construction had already installed 750km of
 City contributed        2   STREAMLINING BUSINESS                                         optic fibre cabling within the metro and, by
 around 71.74%               InvestSA is a one-stop shop based in the heart                completion of the project (scheduled for
 of the provincial           of the Cape Town CBD at the Cape Investor                     June 2021), 1 317km will have been installed.
 economy and had             Centre, which was launched in 2018. Operated                  Of the 95 switching facilities that will
 an estimated GDPR           by Wesgro and the Western Cape Government,                    ultimately be in service, 31 are already
 of R423.34 billion          it is a multi-faceted collaboration between                   operational. The network will connect 736
 in 2018.                    national, provincial and local government to                  City buildings and approximately 300 private
 As at 2018, the            cut the “red tape” for investors wishing to set               buildings. Since its 2009 inception, the capital
 City of Cape Town           up or expand their business interests in South                spend on the Broadband Project sits at R1.3bn
 accounted for               Africa. This initiative clusters key government               (as at June 2018), with a remaining R805m still
 62.74% of all job           departments and agencies under one roof to                    to be spent.
 opportunities               provide investors with a single point of service                According to Invest Cape Town, 848km of
 created in the              to aspects such as regulatory compliance,                     fibre-optic cable have been installed thus far
 Western Cape,               enhancing regulatory and legal processes and                  in greater Cape Town (with 1 827km planned).
 providing                   improving approval turnaround timeframes.                     A total of 475 buildings have been connected
 employment for              It also provides information on incentives                    on the MAN while free Wi-Fi has been installed
 1.60 million people.        (eg: tax, land, training and free-trade zones)                at 715 access points at 225 locations12.
                             as well as on both pre-approvals (eg: market
                             data, costs, incentives, project approval                4    POSITIONING CAPE TOWN AS
                             and local partners) and post approvals                        THE GREEN ECONOMY HUB OF
                             (eg: facilitation of permit approvals,                        SOUTH AFRICA
                             information relating to import of equipment                   As the Western Cape has positioned itself as
                             and raw materials, and central bank profit                    the Green Economy hub for South Africa, this
                             repatriation to investors). This collaboration                is of particular importance and relevance to
                             follows the launch by the City of the targeted                the City of Cape Town. A number of renewable
                             Invest Cape Town initiative in 2017.                          energy companies have already made Cape
                                                                                           Town their home across the spectrum of
                                                                                           solar photovoltaic manufacturing, electrical

                             Top international companies that have invested in Cape Town over the
                             past 10 years include Amazon, Hisense, GlaxoSmithKline, Kimberley-
                             Clark, IBM, Harvard University, Airbus, Oracle, Juwi and Wind Prospect.

10  Economic Performance Indicators for Cape Town, 2018: Q3 (July-September), City of Cape Town; Municipal Economic Review & Outlook 2018,
     Western Cape Government Provincial Treasury.
11 City of Cape Town, Speech by Alderman JP Smith given at SA Innovation Summit CEO event, 13 September 2018.
 12 Invest in Cape Town 2017/18, Regional Market Analysis and Intelligence, Wesgro.

                                                                      8
WESGRO THE WESTERN CAPE PROPERTY REPORT 2018/19

manufacturing, fuel supply, professional                     TOP MICE
services and supporting bodies. Cape Town’s                  DESTINATION                        TIMELINES FOR BUSINESS
three universities13 also actively contribute
                                                             IN AFRICA
                                                                                                PROCESSES14
towards research and development in the field                                                   The time it takes to obtain a business
                                                             In 2018, Cape Town was
of renewable energy. In turn, the City of Cape                                                  licence from the City of Cape Town varies,
                                                             named the number-
Town has established the Atlantis Greentech                                                     and depends on the type of business an
                                                             one city in Africa for
Special Economic Zone (SEZ), making tracts                                                      operator wishes to establish. While a hawker’s
                                                             the MICE (meetings,
of land available at low cost for purchase or                                                   licence can be obtained in 15 days, a food
                                                             incentives, conferences
lease by greentech companies through an                                                         sale licence can take up to 40 days, and an
                                                             and exhibitions) sector
accelerated land disposal process. A number of                                                  entertainment business licence can take
                                                             by the International
other financial and non-financial incentives are                                                between eight and 11 months. Rezoning
                                                             Congress and
also available, including discounted electricity                                                of land and building plan approvals are
                                                             Convention Association
and rapid turnaround on development                                                             highly dependent on the type of application
                                                             (ICCA). This was the 10th
applications.                                                                                   being made, but the City has stated that
                                                             consecutive year for
                                                                                                the former is estimated, theoretically, to be
                                                             which Cape Town had
For more information, visit                                                                     approximately 90 days and the latter 60 days.
                                                             achieved this accolade.
www.investcapetown.com/wp-content/
uploads/2019/04/Green-Economy-Info-Page.pdf

INTRODUCTION TO
THE CITY OF CAPE TOWN
PROPERTY MARKET
On a quarterly basis, the national South African             PERIOD OF                       THE SAMPLING OF AREAS FOR
Property Owners Association (SAPOA) publish,                 RESEARCH                        COMMERCIAL, RETAIL (INCLUDING
among other figures, office rental and vacancy               It is important to stress       LEISURE) AND INDUSTRIAL
statistics for a number of key commercial nodes              that the property data          PROPERTIES:
across South Africa, including seven nodes in                in this report reflects         In addition to the seven SAPOA nodes, these
the Western Cape – all of which lie within the               “a point in time”– the          areas include: Airport Industrial, Atlantis,
City of Cape Town’s municipal boundaries. These              period January to               Blackheath, Brackenfell, Elsies River, Epping,
nodes are Bellville, the Cape Town CBD, Century              April 2019 – during             Killarney Gardens, Montague Gardens, Ndabeni,
City, Claremont, Central (being Pinelands and                which research was              Paarden Eiland, Parow, Salt River, Somerset West
surrounds), Rondebosch/Newlands and the                      undertaken. Therefore,          and Woodstock.
V&A Waterfront. The SAPOA rental and vacancy                 during this period,
statistics for these seven nodes appear in the               there may not have              THE SAMPLING OF AREAS FOR
box on pg 10, and reflect SAPOA’s Q1 (as at the              been properties                 RESIDENTIAL PROPERTIES:
end of April 2019), to coincide with the period              available in certain            Again, in addition to the seven SAPOA nodes, the
during which the rest of the property data                   categories in certain           authors have also looked at residential property in
research in this report was undertaken.                      areas, either in terms          a sampling of areas that fall in close proximity to
  However, because the City of Cape Town is                  of rentals or sales.            the larger commercial nodes, as well as Somerset
so vast, the authors of this publication believe             This does not mean,             West – with the latter included due to the rapid
there are many other important nodes across                  however, that there             growth seen in this area across all property sectors.
the metropole, over and above the seven nodes                are never properties              Therefore, residential property analysis
covered by SAPOA. Accordingly, independent                   in these categories             includes: Bellville, the Cape Town CBD (and areas
research has been conducted to complement                    available in these areas        in close proximity, i.e., Gardens and Oranjezicht
and extend the SAPOA findings to include                     – it simply means there         in the City Bowl area, and Green Point and Sea
other primary areas across the spectrum of                   were none available at          Point on the Atlantic Seaboard), Century City,
commercial, retail, industrial and residential               the time.                       Claremont, Newlands, Pinelands, Rondebosch,
properties, and in terms of properties both for                                              Somerset West and the V&A Waterfront.
sale as well as to rent.

13  Namely, the University of Cape Town, the University of the Western Cape and the Cape Peninsula University of Technology.
14 Source: Municipal Economic Review & Outlook 2018, Western Cape Government Provincial Treasury.

                                                                         9
THE CITY OF CAPE TOWN | CAPE WINELANDS | SALDANHA BAY/VREDENBURG | GEORGE
COMMERCIAL PROPERTY15
SUBURB Grade* Total rentable Area available Vacancy rate Median asking
area (m²) for rental (m²) rental (per m²) SAPOA’S OFFICE
VACANCIES &
BELLVILLE P 10 600 1 363 12.9% R180
RENTALS
A 375 497 9 585 2.6% R140 The statistics to the
left for the seven
B 161 641 17 164 10.6% R115
nodes covered by
C 15 078 4 783 31.7% R75 SAPOA in the City
OVERALL 562 816 32 895 5.6% of Cape Town have
been taken from
CAPE TOWN CBD P 52 000 3 480 6.7% R185 the organisation’s
A 382 383 43 182 11.3% R150 Research Office
Vacancy Report,
B 519 786 58 915 11.3% R116
Q1:2019.
C 108 244 14 646 13.5% R100
OVERALL 1 062 413 120 223 11.3%
CENTRAL A 272 975 4 798 1.8% R158
B 36 741 2 991 8.1% R105
OVERALL 309 716 7 789 2.5%
CENTURY CITY P 62 480 5 000 8% R200
A 250 928 27 105 10.8% R150
Across all the
B 41 931 3 421 8.2% R140
nodes surveyed
OVERALL 355 339 35 526 10%
by SAPOA
CLAREMONT P 6 000 0 0% N/A
countrywide,
A 62 636 922 1.5% R220 the seven nodes
B 45 286 2 254 5% R148 surveyed in the
C 9 679 1 047 10.8% R110 City of Cape
OVERALL 123 601 4 223 3.4% Town collectively
RONDEBOSCH/ A 71 654 872 1.2% R225 average the lowest
NEWLANDS B 30 877 562 1.8% R167 vacancy rate in
OVERALL 102 531 1 434 1.4%
South Africa, with
an aggregate of
V&A WATERFRONT P 51 000 306 2.3% R220
7.8% overall.
A 72 455 3 837 1.9% R200
For more
B 6 298 0 0% N/A
information, visit
OVERALL 129 753 4 143 3.2%
www.sapoa.org.za
*SAPOA OFFICE GRADE DEFINITIONS:
P GRADE (PRIME GRADE): A GRADE: B GRADE: C GRADE:
Top-quality, modern space Buildings not older than Generally older buildings Buildings in a fair condition
usually considered iconic and 15 years and which have but with accommodation but with older style finishes,
a flagship in its market as well undergone refurbishments and finishes close to modern services and building systems.
as a pace setter in establishing featuring high-quality modern standards. Air conditioning May or may not have air
rentals. To be considered P finishes and amenities, such as and on-site parking still conditioning or on-site
grade, an office should at least air conditioning and adequate considered essential. parking.
be a 4-star Green Certified on-site parking.
building.
15 With the exception of the figures credited in the box above to SAPOA, all other figures in this Commercial section have been sourced from
Property24.com.The number of properties indicated as available were as at the time that research for this publication was undertaken
(between January and April 2019).
10WESGRO THE WESTERN CAPE PROPERTY REPORT 2018/19
AIRPORT INDUSTRIA
COMMERCIAL LAND, OFFICES AND RETAIL FOR SALE: There were neither vacant
commercial stands nor office or retail properties for sale.
COMMERCIAL OFFICE PROPERTY TO RENT: There were seven properties for rent suitable
for offices, representing 3 152m² under roof. There were no properties suitable for retail or leisure to rent.
MONTHLY RENTAL RANGE SIZE RANGE
Highest Lowest Median Highest Lowest Median Largest Smallest Median
asking asking asking R/m² R/m² R/m² in size in size size
overall overall p/m asking
Rental R72 704 R13 978 R13 978 R38 880 R72 704 R13 978
Size 1 024m² 90m² 90m² 864² 1 024m² 90m²
R36 750 R71/m² 245m²
R/m² R71/m² R155/m² R155/m² R45/m² R71/m² R155/m²
ATLANTIS
COMMERCIAL LAND, OFFICES AND RETAIL FOR SALE: There were neither vacant COMMERCIAL stands nor
OFFICE BUILDINGS for sale. There were, however, two RETAIL properties for sale representing 1 650m² under roof.
PRICE RANGE SIZE RANGE
Highest Lowest Median Highest Lowest Median Largest8 Smallest Median
asking asking asking R/m² R/m² R/m² in size in size size
overall overall asking
Price R3.2m R2.95m R3.2m R2.95m R2.95m R3.2m
Size 700m² 950m² 700m² 950m² 950m² 700m²
R3.075m R3 838/m² 825m²
R/m² R4 571/m² R3 105/m² R4 571/m² R3 105/m² R3 105/m² R4 571/m²
COMMERCIAL RETAIL AND OFFICES TO RENT: There were no properties suitable
for RETAIL or leisure to rent. There was one COMMERCIAL OFFICE property to rent,
representing 125m² under roof. The monthly rental was R5 625 at R45/m².
BELLVILLE
COMMERCIAL LAND FOR SALE: There were three vacant stands suitable for commercial
development representing 1 918m².
PRICE RANGE SIZE RANGE
Highest Lowest Median Highest Lowest Median Largest Smallest Median
asking asking asking R/m² R/m² R/m² in size in size size
overall overall asking
Price R5m R3m R5m R3m R3m R5m
Size 419m² 1 010m² 419m² 1 010m² 1 010m² 419m²
R5m R10 225/m² 489m²
R/m² R11 933/m² R2 970/m² R11 933/m² R2 970/m² R2 970/m² R11 933/m²
COMMERCIAL OFFICES FOR SALE: There were 22 properties for sale suitable for offices
representing 10 544m² under roof.
PRICE RANGE SIZE RANGE
Highest Lowest Median Highest Lowest Median Largest Smallest Median
asking asking asking R/m² R/m² R/m² in size in size size
overall overall asking
Price R93.353m R595 000 R4.2m R3.6m R93.353m R595 000
Size 3 822m² 73m² 160m² 1 282m² 3 822m² 73m²
R3.705m R11 890/m² 277m²
R/m² R25 210/m² R8 151/m² R26 250/m² R2 808/m² R25 210/m² R8 151/m²THE CITY OF CAPE TOWN | CAPE WINELANDS | SALDANHA BAY/VREDENBURG | GEORGE
COMMERCIAL RETAIL FOR SALE: There were nine properties for sale suitable for
retail or leisure representing 5 605m² under roof.
PRICE RANGE SIZE RANGE
Highest Lowest Median Highest Lowest Median Largest Smallest Median
asking asking asking R/m² R/m² R/m² in size in size size
overall overall asking
Price R19.114m R465 000 R465 000 R5.5m R19.114m R465 000
Size 2 147m² 17m² 17m² 729m² 2 147m² 17m²
R5.5m R11 838/m² 684m²
R/m² R8 903/m² R27 353/m² R27 353/m² R7 545/m² R8 903/m² R27 353/m²
COMMERCIAL OFFICES AND RETAIL TO RENT: Please see pg 10 for COMMERCIAL OFFICE
rentals and vacancies in Bellville, as per SAPOA, Q1: 2019. In terms of RETAIL, there were
48 properties to rent suitable for retail or leisure representing 18 854m² under roof.
MONTHLY RENTAL RANGE SIZE RANGE
Highest Lowest Median Highest Lowest Median Largest Smallest Median
asking asking asking R/m² R/m² R/m² in size in size size
overall overall p/m asking
Rental R570 720 R4 000 R10 020 R16 326 R570 720 R10 020
Size 4 640m² 40m² 30m² 200m² 4 640m² 30m²
R25 000 150/m² 188m²
R/m² R123/m² R100/m² R334/m² R82/m² R123/m² R334/m²
BLACKHEATH
COMMERCIAL LAND FOR SALE: There was one vacant stand of 2.23ha for sale by
auction (POA), suitable for commercial development.
COMMERCIAL OFFICES FOR SALE: There were three properties for sale suitable for
offices representing 5 040m² under roof.
PRICE RANGE SIZE RANGE
Highest Lowest Median Highest Lowest Median Largest Smallest Median
asking asking asking R/m² R/m² R/m² in size in size size
overall overall asking
Price R19.95m R1.5m R19.95m R7.8m R19.95m R1.5m
Size 3 000m² 260m² 3 000m² 1 780m² 3 000m² 260m²
R7.8m R5 769/m² 1 780m²
R/m² R6 650/m² R5 769/m² R6 650/m² R4 382/m² R6 650/m² R5 769/m²
COMMERCIAL RETAIL FOR SALE: There was one property for sale suitable for retail
or leisure representing 1 027m² under roof. The asking price was R7.6m at R7 400/m².
COMMERCIAL OFFICES AND RETAIL TO RENT: There was one COMMERCIAL property
to rent suitable for offices representing 75m² under roof. The monthly rental was
R5 134 at R75/m². There were no premises suitable for RETAIL or leisure available to rent.
12WESGRO THE WESTERN CAPE PROPERTY REPORT 2018/19
BRACKENFELL
COMMERCIAL LAND FOR SALE: There were no vacant stands available for commercial development.
COMMERCIAL OFFICES FOR SALE: There were four properties for sale suitable for offices
representing 3 563m² under roof.
PRICE RANGE SIZE RANGE
Highest Lowest Median Highest Lowest Median Largest Smallest Median
asking asking asking R/m² R/m² R/m² in size in size size
overall overall asking
Price R8.4m R2.75m R2.75m R8.4m R8.4m R999 000
Size 1 413m² 350m² 350m² 1 658m² 1 658m² 142m²
R5.575m R6 490/m² 882m²
R/m² R5 945/m² R7 857/m² R7 857/m² R5 066/m² R5 066/m² R7 035/m²
COMMERCIAL RETAIL FOR SALE: There were two properties for sale suitable for retail or leisure
representing 2 204m² under roof; however, both properties were POA, so R/m² is unknown.
COMMERCIAL OFFICES AND RETAIL TO RENT: There were no COMMERCIAL offices available
to rent. In terms of RETAIL or leisure, there were 10 suitable properties to rent representing 1 253m² under roof.
MONTHLY RENTAL RANGE SIZE RANGE
Highest Lowest Median Highest Lowest Median Largest Smallest Median
asking asking asking R/m² R/m² R/m² in size in size size
overall overall p/m asking
Rental R48 812 R13 870 R13 870 R19 000 R48 812 R13 870
Size 217m² 38m² 38m² 130m² 217m² 38m²
R24 998 R232/m² 122m²
R/m² R225/m² R365/m² R365/m² R146/m² R225/m² R365/m²
CAPE TOWN CBD
COMMERCIAL LAND FOR SALE: There were no vacant stands for sale suitable for commercial development.
COMMERCIAL OFFICES FOR SALE: There were 32 properties for sale suitable for offices
representing 13 900m² under roof.
PRICE RANGE SIZE RANGE
Highest Lowest Median Highest Lowest Median Largest Smallest Median
asking asking asking R/m² R/m² R/m² in size in size size
overall overall asking
Price R32m R2.3m R9.5m R8.9m R32m R2.4m
Size 1 600m² 109m² 295m² 693m² 1 600m² 105m²
R7.975m R20 923/m² 375m²
R/m² R20 000/m² R21 101/m² R32 203/m² R12 843/m² R20 000/m² R22 857/m²
COMMERCIAL RETAIL FOR SALE: There were 11 properties for sale suitable for retail or leisure
representing 9 279m² under roof.
PRICE RANGE SIZE RANGE
Highest Lowest Median Highest Lowest Median Largest Smallest Median
asking asking asking R/m² R/m² R/m² in size in size size
overall overall asking
Price R28.5m R1.199m R1.199m R21.4m R21.4m R1.199m
Size 1 376m² 22m² 22m² 3 333m² 3 333m² 22m²
R11.9m R23 471/m² 507m²
R/m² R20 712/m² R54 500/m² R54 500/m² R6 421/m² R6 421/m² R54 500/m²
13THE CITY OF CAPE TOWN | CAPE WINELANDS | SALDANHA BAY/VREDENBURG | GEORGE
COMMERCIAL OFFICES AND RETAIL TO RENT: Please see pg 10 for COMMERCIAL OFFICE
rentals and vacancies in the Cape Town CBD, as per SAPOA, Q1:2019. In terms of RETAIL
or leisure, there were 72 properties to rent representing 19 485m² under roof.
MONTHLY RENTAL RANGE SIZE RANGE
Highest Lowest Median Highest Lowest Median Largest Smallest Median
asking asking asking R/m² R/m² R/m² in size in size size
overall overall p/m asking
Rental R258 940 R8 817 R27 300 R65 075 R258 940 R8 817
Size 2 354m² 44m² 50m² 685m² 2 354m² 44m²
R39 750 R238/m² 170m²
R/m² R110/m² R200/m² R546/m² R95/m² R110/m² R200/m²
CENTURY CITY
COMMERCIAL LAND FOR SALE: There were no vacant stands for sale suitable for
commercial development.
COMMERCIAL OFFICES FOR SALE: There were 20 properties for sale suitable for offices
representing 11 237m² under roof.
PRICE RANGE SIZE RANGE
Highest Lowest Median Highest Lowest Median Largest Smallest Median
asking asking asking R/m² R/m² R/m² in size in size size
overall overall asking
Price R44.945m R1.232m R6m R10.08m R32m R1.232m
Size 2 100m² 56m² 200m² 672m² 2 122m² 56m²
R8.52m R21 402/m² 423m²
R/m² R21 402/m² R22 000/m² R30 000/m² R15 000/m² R15 080/m² R22 000/m²
COMMERCIAL RETAIL FOR SALE: There were four properties for sale suitable for retail or
leisure representing 1 768m² under roof.
PRICE RANGE SIZE RANGE
Highest Lowest Median Highest Lowest Median Largest Smallest Median
asking asking asking R/m² R/m² R/m² in size in size size
overall overall asking
Price R16.4m R3.49m R4.2m R12.2m R14.3m R3.49m
Size 776m² 106m² 110m² 776m² 776m² 106m²
R8.2m R27 029/m² 443m²
R/m² R21 134/m² R32 925/m² R38 182/m² R15 722/m² R18 428/m² R32 925/m²
COMMERCIAL OFFICES AND RETAIL TO RENT: Please see pg 10 for COMMERCIAL OFFICE
rentals and vacancies in Century City as per SAPOA, Q1:2019. In terms of RETAIL or leisure, there
were eight properties to rent representing 6 009m² under roof.
MONTHLY RENTAL RANGE SIZE RANGE
Highest Lowest Median Highest Lowest Median Largest Smallest Median
asking asking asking R/m² R/m² R/m² in size in size size
overall overall p/m asking
Rental R494 410 R12 000 R38 500 R78 900 R494 910 R12 480
Size 3 807m² 106m² 193m² 789m² 3 807m² 78m²
R42 858 R165/m² 217m²
R/m² R130/m² R113/m² R200/m² R100/m² R130/m² R160/m²
14WESGRO THE WESTERN CAPE PROPERTY REPORT 2018/19
CLAREMONT
COMMERCIAL LAND FOR SALE: There were no vacant stands for sale suitable for commercial development.
COMMERCIAL OFFICES FOR SALE: There was one property for sale suitable for offices
representing 86m² under roof. It had an asking price of R2.1m or R24 419/m².
COMMERCIAL RETAIL FOR SALE: There were three properties for sale suitable for retail
or leisure representing 726m² under roof.
PRICE RANGE SIZE RANGE
Highest Lowest Median Highest Lowest Median Largest Smallest Median
asking asking asking R/m² R/m² R/m² in size in size size
overall overall asking
Price R8m R4.4m R4.4m R6.2m R6.2m R4.4m
Size 287m² 110m² 110m² 329m² 329m² 110m²
R6.2m R27 875/m² 287m²
R/m² R27 875/m² R40 000/m² R40 000/m² R18 845/m² R18 845/m² R40 000/m²
COMMERCIAL OFFICES AND RETAIL TO RENT: Please see pg 10 for COMMERCIAL OFFICE
rentals and vacancies in Claremont as per SAPOA, Q1:2019. In terms of RETAIL or leisure, there
were 20 properties to rent suitable for retail or leisure representing 7 372m² under roof.
MONTHLY RENTAL RANGE SIZE RANGE
Highest Lowest Median Highest Lowest Median Largest Smallest Median
asking asking asking R/m² R/m² R/m² in size in size size
overall overall p/m asking
Rental R518 560 R6 720 R34 450 R33 065 R518 560 R6 720
Size 3 241m² 56m² 65m² 389m² 3 241m² 56m²
R34 050 R181/m² 176m²
R/m² R160/m² R120/m² R530/m² R85/m² R160/m² R120/m²
ELSIES RIVER
COMMERCIAL LAND AND OFFICES FOR SALE: There were neither vacant stands nor
buildings suitable for commercial development for sale.
COMMERCIAL RETAIL FOR SALE: There were two properties for sale suitable for retail or
leisure representing 1 146m² under roof.
PRICE RANGE SIZE RANGE
Highest Lowest Median Highest Lowest Median Largest Smallest Median
asking asking asking R/m² R/m² R/m² in size in size size
overall overall asking
Price R3.95m R2.5m R42.5m R3.95m R3.95m R2.5m
Size 833m² 313m² 313m² 833m² 833m² 313m²
R3.225m R6 365/m² 573m²
R/m² R4 742/m² R7 987/m² R7 987/m² R4 742/m² R4 742/m² R7 987/m²
COMMERCIAL RETAIL AND OFFICES TO RENT: There were no RETAIL or leisure properties to rent.
There were four COMMERCIAL properties to rent suitable for offices representing 1 159m² under roof.
MONTHLY RENTAL RANGE SIZE RANGE
Highest Lowest Median Highest Lowest Median Largest Smallest Median
asking asking asking R/m² R/m² R/m² in size in size size
overall overall p/m asking
Rental R31 742 R3 702 R31 742 R5 720 R31 742 R3 702
Size 634m² 92m² 634m² 143m² 634m² 92m²
R10 110 R45/m² 217m²
R/m² R50/m² R40/m² R50/m² R40/m² R50/m² R40/m²
15THE CITY OF CAPE TOWN | CAPE WINELANDS | SALDANHA BAY/VREDENBURG | GEORGE
EPPING
COMMERCIAL LAND, OFFICES AND RETAIL FOR SALE: There were neither vacant
stands nor buildings suitable for commercial or retail for sale.
COMMERCIAL RETAIL AND OFFICES TO RENT: There were no RETAIL or leisure
properties to rent. There were six COMMERCIAL properties suitable for offices to rent
representing 1 282m² under roof.
MONTHLY RENTAL RANGE SIZE RANGE
Highest Lowest Median Highest Lowest Median Largest Smallest Median
asking asking asking R/m² R/m² R/m² in size in size size
overall overall p/m asking
Rental R22 140 R2 500 R2 500 R22 140 R22 140 R2 500
Size 492m² 15m² 15m² 492m² 492m² 15m²
R9 848 R59/m² 152m²
R/m² R45/m² R167/m² R167/m² R45/m² R45/m² R167/m²
KILLARNEY GARDENS
COMMERCIAL LAND, OFFICES AND RETAIL FOR SALE: There were neither
vacant stands nor buildings suitable for commercial or retail for sale.
COMMERCIAL OFFICES TO RENT: There were seven properties to rent suitable
for offices representing 3 394m² under roof.
MONTHLY RENTAL RANGE SIZE RANGE
Highest Lowest Median Highest Lowest Median Largest Smallest Median
asking asking asking R/m² R/m² R/m² in size in size size
overall overall p/m asking
Rental R180 000 R5 605 R180 000 R24 178 R180 000 R5 605
Size 1 200m² 59m² 1 200m² 255m² 1 200m² 59m²
R34 080 R120/m² 284m²
R/m² R150/m² R95/m² R150/m² R95/m² R150/m² R95/m²
COMMERCIAL RETAIL TO RENT: There were two properties to rent suitable for
retail or leisure representing 2 550m² under roof.
MONTHLY RENTAL RANGE SIZE RANGE
Highest Lowest Median Highest Lowest Median Largest Smallest Median
asking asking asking R/m² R/m² R/m² in size in size size
overall overall p/m asking
Rental R150 000 R41 250 R150 000 R41 250 R150 000 R41 250
Size 2 000m² 550m² 2 000m² 550m² 2 000m² 550m²
R95 625 R75/m² 1 275m²
R/m² R75/m² R75/m² R75/m² R75/m² R75/m² R75/m²
16WESGRO THE WESTERN CAPE PROPERTY REPORT 2018/19
MONTAGUE GARDENS
COMMERCIAL LAND AND RETAIL FOR SALE: There were neither vacant stands nor
buildings suitable for retail for sale.
COMMERCIAL OFFICES FOR SALE: There were three properties for sale suitable for
offices representing 6 074m² under roof.
PRICE RANGE SIZE RANGE
Highest Lowest Median Highest Lowest Median Largest Smallest Median
asking asking asking R/m² R/m² R/m² in size in size size
overall overall asking
Price R46m R26.95m R46m R26.95m R46m R26.95m
Size 2 106m² 1 975m² 2 106m² 1 975m² 2 106m² 1 975m²
R36.475m R17 744/m² 1 993m²
R/m² R21 842/m² R13 646/m² R21 842/m² R13 646/m² R21 842/m² R13 646/m²
COMMERCIAL OFFICES TO RENT: There were 40 properties to rent suitable for offices
representing 11 597m² under roof.
MONTHLY RENTAL RANGE SIZE RANGE
Highest Lowest Median Highest Lowest Median Largest Smallest Median
asking asking asking R/m² R/m² R/m² in size in size size
overall overall p/m asking
Rental R225 600 R5 000 R5 000 R21 368 R225 600 R5 000
Size 1 410m² 15m² 15m² 389m² 1 410m² 15m²
R17 850 R95/m² 202m²
R/m² R160/m² R333/m² R333/m² R55/m² R160/m² R333/m²
COMMERCIAL RETAIL TO RENT: There were 10 properties to rent suitable for retail or
leisure representing 4 940m² under roof.
MONTHLY RENTAL RANGE SIZE RANGE
Highest Lowest Median Highest Lowest Median Largest Smallest Median
asking asking asking R/m² R/m² R/m² in size in size size
overall overall p/m asking
Rental R171 615 R8 670 R25 002 R12 500 R171 615 R8 670
Size 2 019m² 102m² 180m² 213m² 2 019m² 102m²
R29 783 R98/m² 266m²
R/m² R85/m² R85/m² R139/m² R59/m² R85/m² R85/m²
NDABENI
COMMERCIAL LAND, OFFICES AND RETAIL FOR SALE: There were neither vacant stands
nor buildings suitable for COMMERCIAL for sale. There was one property for sale suitable for
RETAIL or leisure representing 200m² under roof at an asking price of R4.95m or R24 750/m².
COMMERCIAL RETAIL AND OFFICES TO RENT: There was one property to rent suitable for
RETAIL or leisure representing 72m² under roof at a monthly rental of R8 280 or R115/m². There
were nine properties to rent suitable for COMMERCIAL offices representing 2 658m² under roof.
MONTHLY RENTAL RANGE SIZE RANGE
Highest Lowest Median Highest Lowest Median Largest Smallest Median
asking asking asking R/m² R/m² R/m² in size in size size
overall overall p/m asking
Rental R48 000 R2 000 R2 000 R20 473 R48 000 R2 000
Size 570m² 14m² 14m² 341m² 570m² 14m²
R20 473 R85/m² 283m²
R/m² R84/m² R143/m² R143/m² R60/m² R84/m² R143/m²
17THE CITY OF CAPE TOWN | CAPE WINELANDS | SALDANHA BAY/VREDENBURG | GEORGE
NEWLANDS/RONDEBOSCH
COMMERCIAL LAND, OFFICES & RETAIL FOR SALE: There were neither vacant stands
nor buildings suitable for offices or retail for sale in Newlands. Rondebosch had neither
vacant stands nor retail properties for sale, but it did have one office building on the market
representing 657m² under roof. This had an asking price of R11.995m or R18 257/m².
COMMERCIAL OFFICES AND RETAIL TO RENT: Please see pg 10 for COMMERCIAL OFFICE
rentals and vacancies in Newlands/Rondebosch, as per SAPOA, Q1:2019. In terms of RETAIL
or leisure premises, there was one property to rent in Newlands representing 200m² under roof.
The monthly rental was R24 000 or R120/m². In terms of Rondebosch, there were 14 properties
available to rent suitable for RETAIL representing 1 643m² under roof.
MONTHLY RENTAL RANGE SIZE RANGE
Highest Lowest Median Highest Lowest Median Largest Smallest Median
asking asking asking R/m² R/m² R/m² in size in size size
overall overall p/m asking
Rental R55 590 R9 360 R23 599 R9 360 R55 590 R9 360
Size 218m² 52m² 82m² 52m² 218m² 52m²
R23 900 R245/m² 101m²
R/m² R255/m² R180/m² R288/m² R180/m² R255/m² R180/m²
PAARDEN EILAND
COMMERCIAL LAND, OFFICES & RETAIL FOR SALE: There were neither vacant stands nor
buildings suitable for RETAIL or leisure for sale. There was one COMMERCIAL OFFICE building
for sale representing 94m² under roof. This has an asking price of R1.4m or R14 894/m².
COMMERCIAL OFFICES TO RENT: There were 29 properties to rent suitable for offices
representing 7 561m² under roof.
MONTHLY RENTAL RANGE SIZE RANGE
Highest Lowest Median Highest Lowest Median Largest Smallest Median
asking asking asking R/m² R/m² R/m² in size in size size
overall overall p/m asking
Rental R101 500 R2 160 R4 500 R27 563 R101 500 R2 160
Size 1 069m² 36m² 20m² 530m² 1 069m² 36m²
R17 500 R95/m² 194m²
R/m² R95/m² R60/m² R225/m² R52/m² R95/m² R60/m²
COMMERCIAL RETAIL TO RENT: There were 20 properties to rent suitable for retail
representing 20 482m² under roof.
MONTHLY RENTAL RANGE SIZE RANGE
Highest Lowest Median Highest Lowest Median Largest Smallest Median
asking asking asking R/m² R/m² R/m² in size in size size
overall overall p/m asking
Rental R297 000 R7 500 R60 000 R10 000 R223 868 R7 500
Size 2 700m² 110m² 422m² 172m² 3 441m² 110m²
R82 820 R85/m² 905m²
R/m² R110/m² R65/m² R142/m² R58/m² R65/m² R65/m²
18WESGRO THE WESTERN CAPE PROPERTY REPORT 2018/19
PAROW
COMMERCIAL LAND FOR SALE: There were no vacant stands suitable for offices, retail or leisure
for sale.
COMMERCIAL OFFICES FOR SALE: There were nine properties for sale suitable for offices
representing 7 682m² under roof.
PRICE RANGE SIZE RANGE
Highest Lowest Median Highest Lowest Median Largest Smallest Median
asking asking asking R/m² R/m² R/m² in size in size size
overall overall asking
Price R31.5m R1.05m R1.05m R7.6m R31.5m R1.05m
Size 2 546m² 65m² 65m² 1 970m² 2 546m² 65m²
R3.995m R9 975/m² 350m²
R/m² R12 372/m² R16 154/m² R16 154/m² R3 858/m² R12 372/m² R16 154/m²
COMMERCIAL RETAIL FOR SALE: There were 14 properties for sale suitable for retail or leisure
representing 14 234m² under roof.
PRICE RANGE SIZE RANGE
Highest Lowest Median Highest Lowest Median Largest Smallest Median
asking asking asking R/m² R/m² R/m² in size in size size
overall overall asking
Price R23m R2.65m R11m R2.8m R23m R2.65m
Size 2 049m² 288m² 495m² 735m² 2 697m² 288m²
R6.3m R8 584/m² 779m²
R/m² R12 478/m² R9 201/m² R22 222/m² R3 801/m² R8 528/m² R9 201/m²
COMMERCIAL OFFICES TO RENT: There were 34 properties to rent suitable for offices
representing 16 504m² under roof.
MONTHLY RENTAL RANGE SIZE RANGE
Highest Lowest Median Highest Lowest Median Largest Smallest Median
asking asking asking R/m² R/m² R/m² in size in size size
overall overall p/m asking
Rental R315 120 R5 952 R46 682 R41 760 R315 120 R5 952
Size 2 626m² 64m² 209m² 1 044m² 2 626m² 64m²
R36 225 R145/m² 309m²
R/m² R120/m² R93/m² R223/m² R40/m² R120/m² R93/m²
COMMERCIAL RETAIL TO RENT: There were 12 properties to rent suitable for retail or
leisure representing 7 311m² under roof.
MONTHLY RENTAL RANGE SIZE RANGE
Highest Lowest Median Highest Lowest Median Largest Smallest Median
asking asking asking R/m² R/m² R/m² in size in size size
overall overall p/m asking
Rental R188 700 R4 920 R9 720 R42 598 R188 700 R9 720
Size 3 145m² 41m² 36m² 760m² 3 145m² 36m²
R29 360 R103/m² 332m²
R/m² R60/m² R120/m² R270/m² R56/m² R60/m² R270/m²
19THE CITY OF CAPE TOWN | CAPE WINELANDS | SALDANHA BAY/VREDENBURG | GEORGE
PINELANDS (ALSO KNOWN AS CENTRAL AS PER SAPOA)
COMMERCIAL LAND FOR SALE: There were no vacant stands suitable for offices, retail or leisure for sale.
COMMERCIAL OFFICES AND RETAIL FOR SALE: There was only one COMMERCIAL OFFICE property for sale
representing 185m² under roof. The asking price was R2.55m or R13 784/m². There was also
one property suitable for RETAIL or leisure for sale: a 12-bedroom guesthouse representing 1 644m².
The asking price was R8.995m or R5 471/m².
COMMERCIAL OFFICES AND RETAIL TO RENT: Please see pg 10 for COMMERCIAL OFFICE rentals and vacancies in
Central (incorporating Pinelands), as per SAPOA, Q1:2019. There were no properties to rent suitable for RETAIL or leisure.
SALT RIVER
COMMERCIAL LAND FOR SALE: There were no vacant stands for sale.
COMMERCIAL OFFICES FOR SALE: There were 12 office properties for sale representing 5 850m² under roof.
PRICE RANGE SIZE RANGE
Highest Lowest Median Highest Lowest Median Largest Smallest Median
asking asking asking R/m² R/m² R/m² in size in size size
overall overall asking
Price R22m R2.125m R22m R4.5m R22m R2.125m
Size 1 486m² 172m² 1 486m² 492m² 1 486m² 172m²
R3.885m R12 323/m² 779m²
R/m² R14 805/m² R12 355/m² R14 805/m² R9 146/m² R14 805/m² R12 355/m²
COMMERCIAL RETAIL FOR SALE: There were two properties for sale suitable for retail or leisure
representing 4 530m² under roof.
PRICE RANGE SIZE RANGE
Highest Lowest Median Highest Lowest Median Largest Smallest Median
asking asking asking R/m² R/m² R/m² in size in size size
overall overall asking
Price R36m R13.5m R13.5m R36m R36m R13.5m
Size 3 400m² 1 130m² 1 130m² 3 400m² 3 400m² 1 130m²
R24.75m R11 268/m² 2 265m²
R/m² R10 588/m² R11 947/m² R11 947/m² R10 588/m² R10 588/m² R11 947/m²
COMMERCIAL OFFICES TO RENT: There were 65 properties to rent suitable for offices
representing 19 688m² under roof.
MONTHLY RENTAL RANGE SIZE RANGE
Highest Lowest Median Highest Lowest Median Largest Smallest Median
asking asking asking R/m² R/m² R/m² in size in size size
overall overall p/m asking
Rental R200 000 R4 150 R6 064 R30 000 R200 000 R6 064
Size 1 600m² 38m² 16m² 750m² 1 600m² 16m²
R15 750 R114/m² 160m²
R/m² R125/m² R109/m² R379/m² R40/m² R125/m² R379/m²
COMMERCIAL RETAIL TO RENT: There were 26 properties to rent suitable for retail or leisure
representing 7 585m² under roof.
MONTHLY RENTAL RANGE SIZE RANGE
Highest Lowest Median Highest Lowest Median Largest Smallest Median
asking asking asking R/m² R/m² R/m² in size in size size
overall overall p/m asking
Rental R63 772 R8 925 R45 100 R8 925 R63 772 R12 000
Size 596m² 119m² 301m² 119m² 596m² 100m²
R28 750 R120/m² 263m²
R/m² R107/m² R75/m² R150/m² R75/m² R107/m² R120/m²You can also read