Cape Town Regional Trends January-December 2019 - An inspiring place to know - Wesgro
←
→
Page content transcription
If your browser does not render page correctly, please read the page content below
Cape Town Regional Trends

January-December 2019       An inspiring place to know

Contents

1.   Methodology
2.   Participation and sample size
3.   Executive Summary
4.   Cape Town Visitor Trends & Patterns
       4.1     Origin of visitors
       4.2      Main purpose of visit
       4.3     Travel group size
       4.4     Top activities undertaken in Cape Town
       4.5     Overnight Spent
       4.6     Length of stay
       4.7     Mode of transport
5.   Performance of Cape Town attractions
6.   Cape Town Accommodation Performance
7.   Cape Town International Airport Arrivals
8.   Real-time data Wi-Fi Project
9.   Acknowledgements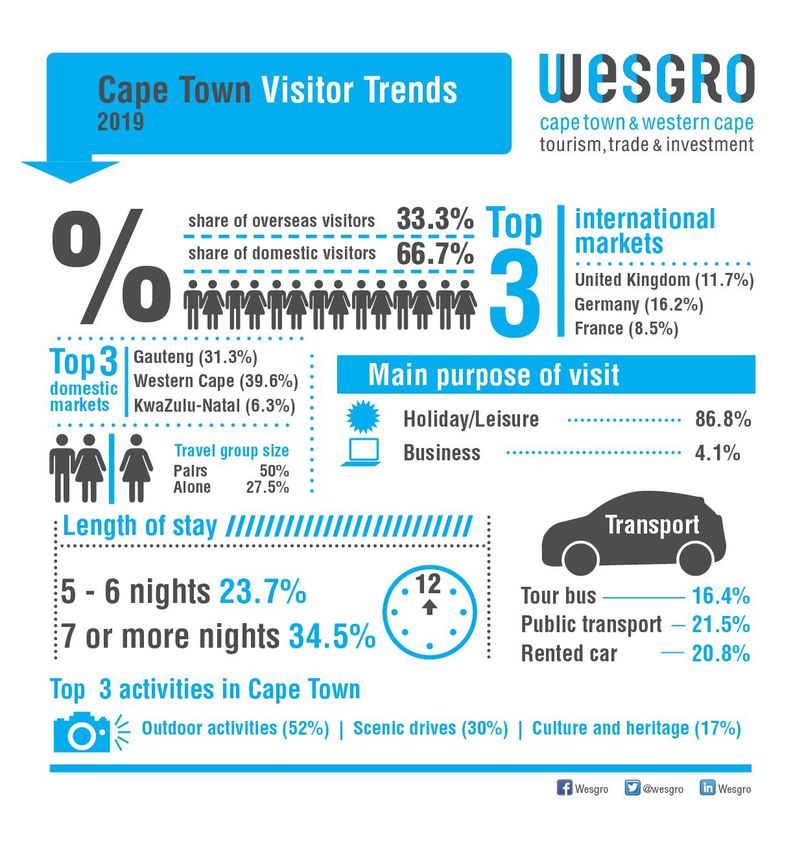
1. Methodology

•   This report provides an overview of the tourism trends and patterns in Cape Town. The findings will illustrate key
    visitor trends obtained from the regional visitor tracking survey.

•   Responses to the regional visitor tracking surveys are used as a proxy to indicate the key trends within the Western
    Cape and the various regions. It is important to note that absolute figures cannot be determined from these surveys,
    as the survey responses are a sample of the tourists into the respective tourism offices across the Western Cape,
    and would thus represent a sample of the visitors. Therefore, where statistically relevant absolute numbers may be
    given, however, a share is provided to indicate the trend. This is based on international best practice in the use of
    surveys within the tourism industry for determining key trends.

•   Data for the regional visitor tracking survey, from which regional trend data was drawn, was captured when a visitor
    booked with a consultant (convenience sampling) and only represents part of the visitor population.

•   Definition: Tourist: refers to any visitor travelling to a place other than that of his/her own environment for more than
    one night, but less than 12 months and for whom the main purpose of the trip is other than the exercise of an activity
    remunerated for from within the place visited.

2. Participation and sample size
In 2019, a total of 750 responses to the regional visitor tracking survey were received from the respective Visitor
Information Centres (VICs) in Cape Town. The participating VICs were:

Cape Town Central                                 351
Long Street                                       229
Cape Town International Airport                   59
Southeys Vines                                    41
Simons Town                                       31
Mobile VIC                                        21
Kirstenbosch                                      18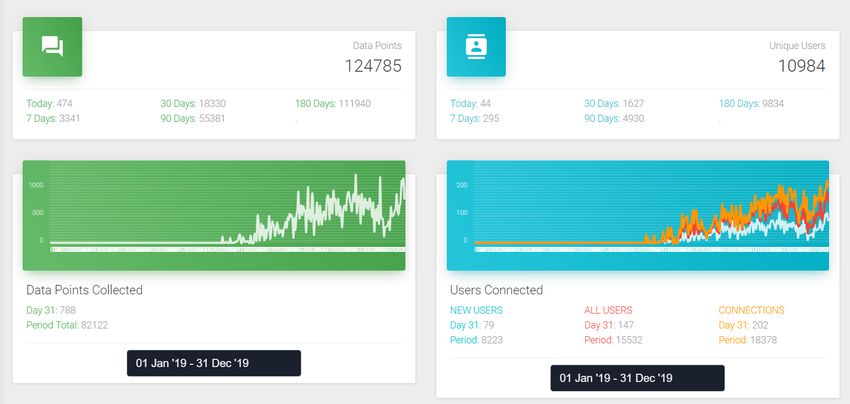
3. Executive Summary
•   Visitor engagements at the respective Cape Metropole Visitor Information Centres (VICs) reflected
    67.7% coming from the domestic market and 32.3% originating from overseas markets.

•   Cape Town continues to hold a strong demand for leisure travel, with holiday/leisure (86.8%) ranking
    as the leading motivation for travel, followed by business (4.1%).

•   Germany (16.2%), the United Kingdom (11.7%) and France (8.5%) ranked as Cape Town’s top three
    international markets into the VICs. The domestic market was led by travellers from the Western
    Cape (39.6%) and Gauteng (31.3%).

•   Visitors to Cape Town primarily travelled as pairs (50.1%), followed by 27.5% who were solo
    travellers. 92.3% of respondents indicated to be overnight visitors, 34.5% of which enjoyed extended
    stays of a week and more in the city. A further 23.7% indicated overnight stays of 5-6 nights.

•   The city benefits from two major national highways and a strong network of tour operators and guides
    operating on these routes. Public transport (21.5%) are a particularly popular form of exploring Cape
    Town, followed by rented cars (20.8%) and tour busses (16.4%).

•   Word of mouth (24.9%) ranked as the top information source amongst visitors to Cape Town. The
    internet (8.1%) emerged as an equally strong tool for information. 9.7% of these visitors were return
    visitors, an extremely important market for industry role-players to tap into and grow.

•   The top five activities enjoyed in Cape Town included outdoor activities, scenic drives,
    culture/heritage, wine tasting, and National Parks/Nature Reserves.

•   The attractions highlighted in this report includes the renowned Table Mountain Aerial Cableway,
    Table Mountain National Park, Kirstenbosch National Botanical Garden, Table Mountain’s Boulders
    Beach, Cape of Good Hope, and Robben Island. These attractions collectively welcomed close to 7.5
    million visitors in 2019. This does not include the V&A Waterfront which usually records around 25
    million visitors annually.

•   In 2019 Wesgro embarked on a real-time tourism research project aimed at collecting tourism
    information from foreign and domestic tourists through the use of on-board vehicle Wi-Fi. The
    solution was installed on a select number of tour operator vehicles that operate in Cape Town and
    the Western Cape in order to ensure the highest level of interaction with tourists. The system allows
    passengers to access the Wi-Fi through an easy anonymous login solution. The project took off
    during June/July 2019 and data was collected from more than 8 000 unique users with 82 000 data
    points collected over the June to December 2019 period. Findings obtained from this project will be
    highlighted in this report.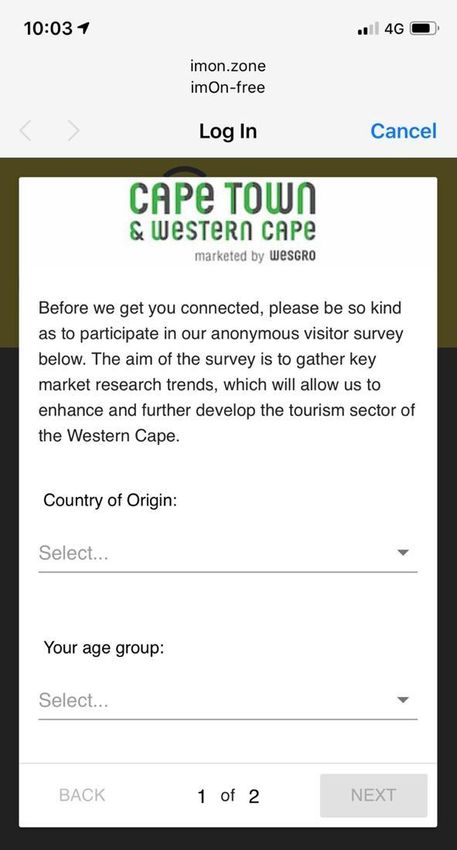
4. Cape Town Visitor Trends & Patterns
     4.1 Origin of Visitors

                                                                                                                                    % SHARE OF OVERSEAS AND DOMESTIC VISITORS TO CAPE TOWN, 2019

             •    Visitor engagements at the various Cape Metropole Visitor Information Centres (VICs) reflected                                                            Domestic; 6,4%
                  67.7% coming from the domestic market and 32.3% originating from overseas markets. However,
                  visitors who responded to the visitor tracking surveys made up 93.6% of travellers to Cape Town over
                  the Jan – Dec 2019 and 6.4% originated from the domestic market.

             •    The top five international markets who conducted bookings at the respective Cape Town VICs
                  included Germany (16.2%), the United Kingdom (11.7%), France (8.5%), United States (5.4%), and
                  Brazil (4.6%).
                                                                                                                                                    Overseas; 93,6%
             •    Despite financial and economic constraints, trends indicate that domestic travellers continue to travel.
                  The largest share of domestic travellers to the region originated from the Western Cape, followed by
                  Gauteng and Kwazulu Natal.

                                 % SHARE OF INTERNATIONAL VISITORS TO CAPE TOWN, 2019                                                    % SHARE OF DOMESTIC VISITORS TO CAPE TOWN, 2019
                 40,0%
                                                                                                                    33,6%         Western Cape                                                     39,6%
                 35,0%

                 30,0%                                                                                                                  Gauteng                                         31,3%
% Visitors

                 25,0%
                                                                                                                                            KZN            6,3%
                 20,0%
                         16,2%
                 15,0%                                                                                                                  Limpopo       4,2%
                                   11,7%
                 10,0%                      8,5%
                                                     5,4%                                                                             Free State      4,2%
                                                              4,6%      4,6%     4,1%     3,8%     3,8%     3,6%
                 5,0%
                                                                                                                             North West Province    2,1%
                 0,0%
                                                       2015                                      2016
                                                                                                                                  Did not specify                 12,5%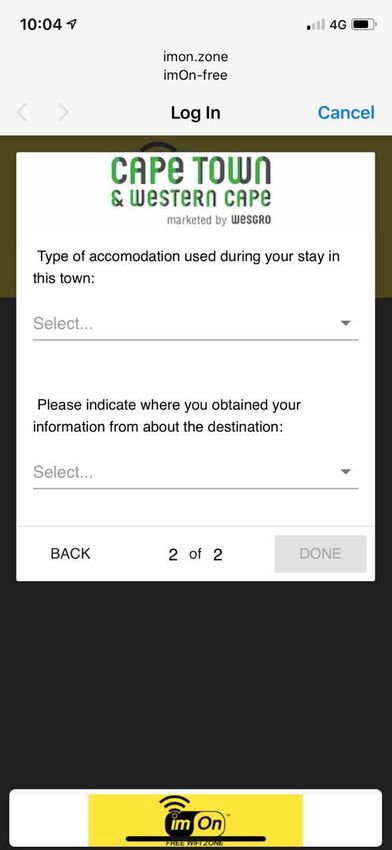
4. Cape Town Trends and Patterns
 4.2 Main Purpose of Visit                                                                            4.3 Travel Group Size

                                                   Honeymoon/W
                               VFR; 0,5%           eddings; 0,3%
                 Education; 0,7%                                                                                              One                           27,5%
                                                         Sport; 0,3%
          Business; 4,1%                                  Medical/Wellness; 0,1%
   Did not specify; 7,2%                                                                                                     Twos                                                50,1%

                                                                                                                           Threes              8,9%

                                                                                                       % Visitors
                                                                                                                             Fours            7,2%

                                           Leisure/Holiday;
                                                86,8%                                                                           >5        4,8%

                                                                                                                    Did not specify    1,5%

 4.4 Top Activities Undertaken in Cape Town

                             52%
              % Visitors

                                            30%

                                                              17%
                                                                            14%           13%
                                                                                                        10%                      10%                 9%
                                                                                                                                                              4%
                                                                                                                                                                              1%

                           Outdoor        2015
                                        Scenic drives Culture/heritage          2016 National Parks
                                                                         Wine tasting                 Beaches                  Shopping        Adventure   Crafts/food   Sporting events
                           Activities                                                                                                                       markets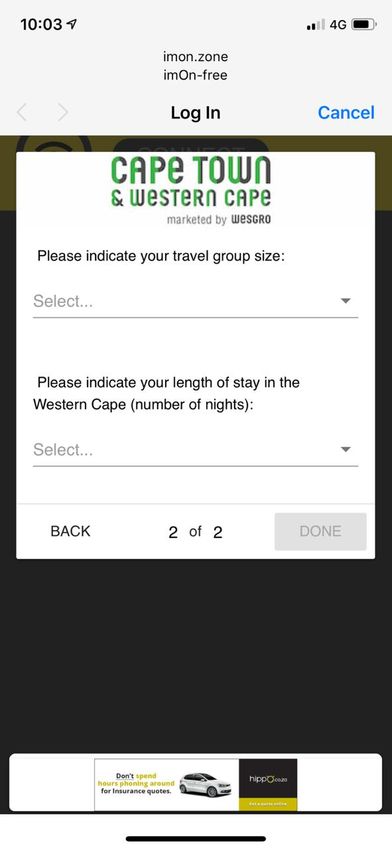
4. Cape Town Trends and Patterns

4.5 Overnight Spent                                        4.6 Average Length of Stay

                                Did not specify; 3,7%
     Day Visitor; 4,0%

                                                                            7+ nights;
                                         Overnight                            34,5%
                                       visitor; 92,3%

4.7 Mode of Transport
                                                                           5 to 6 nights;
                                                                               23,7%
  Public transport                                 21,5%

      Rented Car                                   20,8%

        Tour bus                             16,4%                         Four nights;
                                                                             16,2%
   Shuttle service                 10,1%

Own motor vehicle               7,1%                                       Three nights;
                                                                              11,7%
     Mini bus taxi         4,0%
                                                                           Two nights;
                                                                             9,8%
     Metered taxi        2,1%
                                                                          One night; 4,0%
   Did not specify                             18,0%
                                                                            % Visitors
                                % Visitors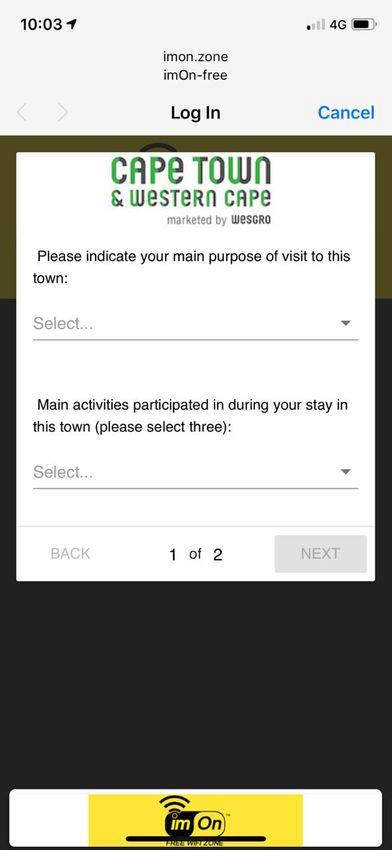
5. Performance of Cape Town Attractions

                                                               Total visitors      18/19 %     •   For this section, visitor movement to Cape Town’s top attractions were reviewed. These
                                      Attraction
                                                                   2019            Change          include the city’s most iconic attractions for which visitor statistics were available.

  Table Mountain National Park                                   3 164 464             -5,7%   •   The attractions highlighted in this section includes the renowned Table Mountain Aerial
                                                                                                   Cableway, Table Mountain National Park, Kirstenbosch National Botanical Garden, Table
  Table Mountain Aerial Cableway                                 1 099 615             -5,4%
                                                                                                   Mountain’s Boulders Beach, and Cape of Good Hope, and Robben Island.

  Table Mountain National Park: Cape of Good Hope                1 135 894             -1,6%
                                                                                               •   In 2019, Table Mountain National Park reached over 3.1 million visitors, however, registered a
  Kirstenbosch National Botanical Garden                         921 421               -1,3%       decline of 5.7% year-on-year.

  Table Mountain National Park: Boulders                         820 351               -8,1%   •   Despite the year-on-year decline in 2019, the park has maintained its 3 million mark across
                                                                                                   the last four years. These figures highlight the strong demand and sustainability of this iconic
  Robben Island                                                  315 821               1,3%
                                                                                                   attraction.
  Sources: Table Mountain National Park, SANParks, Table Mountain Aerial Cableway, Robben
  Island, and Kirstenbosch National Botanical Garden, 2020

                                                                     VISITORS TO THE TABLE MOUNTAIN NATIONAL PARK, 2015 - 2019
                          4 000 000
                                                                                                    3 475 724
                          3 500 000                                                                                                    3 355 049
                                                                             3 195 027                                                                                     3 164 464
                          3 000 000
                                                   2 598 477
     Number of Visitors

                          2 500 000

                          2 000 000

                          1 500 000

                          1 000 000

                           500 000

                                 0
                                                     2015                       2016                   2017                               2018                               2019

                                                                                                                                                                               Source: SANParks, 2019
5. Performance of Cape Town Attractions
VISITORS TO THE TABLE MOUNTAIN NATIONAL PARK: BOULDERS, 2015-2019
1000000 923625 30,0%
892324
817898 820351 25,0%
• The local inhabitants at Boulders Beach knows how to pull the 800000
crowds. Boulders attracted over 800,000 visitors in 2019, and 660062 23,9% 20,0%
Number of visitors
Y-O-Y % Change
registered a marginal year-on-year decline of 8.1%. 600000 15,0%
12,9% 10,0%
• The African Penguins can be found from southern Namibia all the
400000 5,0%
way around the South African coast to Port Elizabeth; however, few
places offer as remarkable a viewing point as Boulders Beach. 0,0%
200000
-8,1% -5,0%
-4,5% -3,4%
0 -10,0%
2015 2016 2017 2018 2019
Source: Table Mountain National Park, 2019
NUMBER OF VISITORS TO TABLE MOUNTAIN NATIONAL PARK: CAPE OF GOOD HOPE,
2015-2019
• The Cape of Good Hope nature reserve within Table Mountain National
Park forms part of the Cape Floral Region, a World Heritage Site. It 1400000 22,7% 25,0%
includes the majestic Table Mountain chain, which stretches from 1184413 1154063
1200000 1135894
Signal Hill to Cape Point, coupled with the coastlines of the Cape 1089184 20,0%
Peninsula.
1000000 887890
Number of visitors
15,0%
Y-O-Y % Change
• This narrow stretch of land contains a mix of extraordinarily diverse and 800000
unique fauna and flora. The Cape of Good Hope welcomed over 1.1 10,0%
million visitors in 2019 and maintained the 1 million visitor mark since 600000 8,7%
2016. 5,0%
400000
200000 0,0%
-1,6%
-2,6%
-3,6%
0 -5,0%
2015 2016 2017 2018 2019
Source: Table Mountain National Park, 2019
5. Performance of Cape Town Attractions
NUMBER OF VISITORS TO TABLE MOUNTAIN AERIAL CABLEWAY, 2015-2019
1400000 20,0%
• Despite being a weather permitting attraction, the 1125746 1185452 1162313
1200000 1099615 15,0%
Cableway reached their 1 million mark in 2016 and has
967534 16,4%
proven to be a strong icon for Cape Town, maintaining a 1000000
Number of visitors
10,0%
Y-O-Y % Change
solid share of annual visitors in 2018 and 2019. Over 1
million visitors enjoyed the Cableway in 2019. 800000
5,0%
• With seasonality and environmental challenges, the 600000 5,3%
Cableway saw an overall 5.4% decrease in visitors in 2,0% 0,0%
400000
2019.
-2,0% -5,0%
200000
-5,4%
0 -10,0%
2015 2016 2017 2018 2019
Source: Table Mountain Aerial Cableway, 2019
NUMBER OF VISITORS TO KIRSTENBOSCH NATIONAL BOTANICAL GARDEN, 2015-2019
• In 2004 the Cape Floristic Region, including Kirstenbosch, 980000 8,0%
968004
was declared a UNESCO World Heritage Site.
Kirstenbosch is the first botanical garden in the world to be 960000 947663 6,0%
included within a natural World Heritage Site.
940000 5,8% 933473 4,0%
Number of visitors
Y-O-Y % Change
921421
• It is important to note that the visitor numbers illustrated in 920000 2,0%
the figure excludes concerts. Events such as the summer 2,1%
895951
sunset concerts amongst others therefore serves as 900000 0,0%
additional volume and economic contribution to the -0,4%
garden. Across the period under review, Kirstenbosch 880000 -2,0%
-1,3%
recorded over 900,000 visitors in 2019, registering a 860000 -4,0%
decline of 1.3% year-on-year. -3,6%
840000 -6,0%
2015 2016 2017 2018 2019
Source: Kirstenbosch National Botanical Garden, 20196. Benchmarking Cape Town’s Hotel Sector
• STR Global Hotel Performance in 2019 reflected an upward trend in AVERAGE REVPAR BY PROVINCE, 2019 AVERAGE REVPAR BY CITY, 2019
occupancy levels when compared to 2018. By category, the highest South Africa R787,28 Port Elizabeth R615,38
percent change (+4,8%) occurred in the Cape Town 5 Stars category. Northern Cape R455,20 Durban R641,09
Eastern Cape R623,79 Cape Town R1,165.54
• On a provincial and city level, Cape Town (1,165.54) and the Western
Limpopo R525,83 East Rand R639,06
Cape (R1,046.72) as a whole achieved the highest revenue amongst all
Free State R553,54 Pretoria & Surrounds R527,71
provinces and top cities in 2019.
KwaZulu Natal R711,41 Sandton R803,75
• By region, a positive year-on-year growth was recorded in the average Mpumalanga R603,73 Johannesburg R547,56
daily rate (ADR) achieved across all regions depicted below, with the Western Cape R1,046,72
highest growth (+3.8%) in ADR recorded in the Winelands region. Gauteng R673,66
Year to Date: January-December 2019 vs January-December 2018
Occ % ADR RevPAR Percent Change from YTD 2018
Region/City
2019 2018 2019 2018 2019 2018 Occ ADR RevPAR
Western Cape 64,1 63,7 1 632,21 1 599,63 1 046,72 1 019,38 0,6 2,0 2,7
Cape Town 65,3 64,1 1 784,43 1 751,97 1 165,54 1 123,33 1,9 1,9 3,8
Cape Town 5 Stars 68,0 64,9 3 242,96 3 181,22 2 206,35 2 065,17 4,8 1,9 6,8
Cape Town 4 Stars 64,7 63,6 1 393,25 1 369,54 901,56 871,40 1,7 1,7 3,5
Cape Town 3 Stars 65,5 66,6 1 032,71 1 014,38 676,61 675,85 -1,7 1,8 0,1
Northern Cape Town 68,1 70,4 1 023,79 1 003,38 697,40 706,18 -3,2 2,0 -1,2
Winelands 57,0 58,6 1 624,75 1 565,28 925,48 916,67 -2,7 3,8 1,0
Garden Route 55,2 56,3 1 285,80 1 275,48 710,16 717,54 -1,8 0,8 -1,0
Notes: STR Global Hotel data provides a high-level overview of occupancy (OCC), average daily rate (ADR) and revenue per available room (RevPAR) for key geographical areas within SA.
Source: STR Global, 20207. ACSA: Cape Town International Airport Arrivals
• International connectivity is key to growing tourism in the Western Cape. INTERNATIONAL PASSENGER MOVEMENT THROUGH THE CAPE TOWN INTERNATIONAL
Cape Town International Airport is Africa’s most award winning airport AIRPORT, 2015 - 2019
and was voted the best airport in Africa, Skytrax 2017 (19th in the
1 400 000 100,0%
world).
1 200 000
• As Africa's 3rd largest airport it records passenger movement of over
1 000 000
Number of Arrivals
Y-O-Y % Change
10 million annually. 10,0%
800 000
• The last 10 years has seen dramatic growth in passenger traffic at the
600 000
Cape Town International Airport. Total passenger movement (arrivals
1,0%
and departures) reached the 10 million mark in 2016, and continued to 400 000
show remarkable growth in 2018 (10.8 million) and in 2019 (11 million).
200 000
• International arrivals through the Airport increased by 0.3% in 2019, 0 0,1%
2015 2016 2017 2018 2019
reaching a total of 1.2 million. The steady growth can mainly be
International Passengers 770834 891945 1078220 1190547 1194042
attributed to the number of new routes and expansions which have been
% Change 8,9% 15,7% 20,9% 10,4% 0,3%
secured, largely through the collaborative efforts initiated by Wesgro’s
Air Access Team.
DOMESTIC PASSENGER MOVEMENT THROUGH THE CAPE TOWN INTERNATIONAL
AIRPORT, 2015 - 2019
4200000 10,0%
• Despite industry challenges, Cape Town International Airport has seen
steady movement from the international market. No declines were 4100000 8,0%
recorded for the period under review, indicating that travel to Cape Town
Number of Arrivals
Y-O-Y % Change
in particular is still taking place. 4000000 6,0%
• The domestic market grew by 2.6% in 2019 after a declining trend in 3900000 4,0%
2018. This is a very important market for South Africa, and challenges
3800000 2,0%
such as affordability continues to impact local travel hindering the growth
of this market. South African Tourism recorded a year-on-year increase 3700000 0,0%
of 61.3% citing the growth as largely due to the travel campaigns and
special deals which was initiated by SA Trade and SA Tourism (SA 3600000 -2,0%
2015 2016 2017 2018 2019
Tourism, 2020).
Domestic Passengers 3823249 4030151 4122302 4066442 4170368
% Change 8,8% 5,4% 2,3% -1,4% 2,6%
Source: ACSA, 20197. ACSA: Cape Town International Airport Arrivals
In terms of regional flight connections, Cape Town International airport carries out regional flights via Johannesburg OR Tambo and offers the following direct regional flights:
The Cape Town airport serves as a key port of connectivity to other cities within Africa with:
10 times a week direct flight to Addis Ababa, Ethiopia
7 times a week direct flight to Maun, Botswana
3 times a week direct flight to Gaborone, Botswana
13 times a week direct flight to Walvis Bay, Namibia
35 times a week direct flight to Windhoek, Namibia
3 times a week direct flight to Livingstone, Zambia
7 times a week direct flight to Luanda, Angola
2 times a week direct flight to Mauritius Island, Mauritius
3 times a week direct flight to Victoria Falls, Zimbabwe
REGIONAL ARRIVALS THROUGH THE CAPE TOWN INTERNATIONAL AIRPORT, 2015 - 2019
120 000 20,0%
100 000
15,0%
Number of Arrivals
80 000
10,0%
60 000
5,0%
40 000
0,0%
20 000
0 -5,0%
2015 2016 2017 2018 2019
Regional Passengers 85 366 101 275 106 754 102 799 99 930
% Change 11,0% 18,6% 5,4% -3,7% -2,8%
¹Regional Arrivals are defined by the Government Gazette by the landing charge in respect of an aircraft which lands at a company airport that has been engaged in a flight where the airport of departure of that aircraft
is Botswana, Lesotho, Namibia or Swaziland.
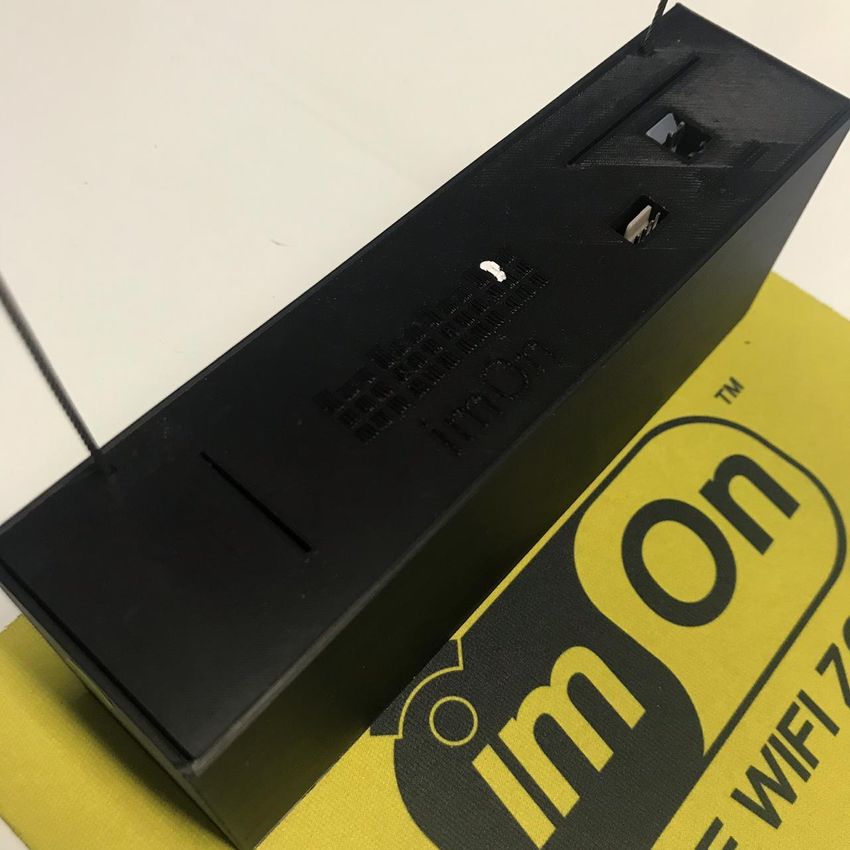
Source: ACSA, 20198. Real-time data Wi-Fi Project In 2019 Wesgro embarked on a real-time tourism research project aimed at collecting tourism information from foreign and domestic tourists through the use of on-board vehicle Wi-Fi. The solution was installed on a select number of tour operator vehicles that operate in Cape Town and the Western Cape in order to ensure the highest level of interaction with tourists. The system allows passengers to access the Wi-Fi through an easy anonymous login solution. A series of questions are asked in such a way that it does not become off-putting to the user. Question deployment are staggered and optimised to maximise the user experience.
8. Real-time data Wi-Fi Project
8. Real-time data Wi-Fi Project
The project took off during June/July 2019 and data was collected from more than 8 000 unique users with 82 000 data points collected over the June to December 2019 period.
8. Real-time data Wi-Fi Project
Survey results from the real-time data collected during 2019 are consistent with the general visitor trends as seen through the survey data collected via the Cape Town Visitor Information Centres. The UK
and USA are amongst the top international markets to the Western Cape and the most popular reason for travel is Leisure followed by Business. The Wi-Fi Project data was collected via Tour Operators,
however, a significant amount of respondents also made use of rented cars as their main mode of transport which suggests that tourists are exploring the city via tour groups as well as on their own.
9. Acknowledgements

  Acknowledgements and many thanks go to the following for supplying the data which made this publication possible and whose continued and unwavering support will sustain the forthcoming
  issues.

  The participating Visitor Information Centres (VICs) in the Cape Metropole:
             • Cape Town Central
             • Cape Town International Airport
             • Kirstenbosch
             • Simon’s Town
             • Southey’s Vines
             • Mobile VIC
             • Long Street

  The participating indicators and attractions in Cape Town:

             •   Kirstenbosch National Botanical Garden
             •   Table Mountain Aerial Cableway
             •   Robben Island
             •   South African National Parks Board
             •   Table Mountain National Park
             •   ACSA: Cape Town International Airport
             •   STR Global

  Real time Wi-fi Solution supplied by imOn Connect Solutions (Pty) Ltd

  For more publications like this visit the Wesgro publications portal on our website at www.wesgro.co.za/research_articles
You can also read