Unequal Education Federal Loophole Enables Lower Spending on Students of Color - Ary Spatig-Amerikaner August 2012
←
→
Page content transcription
If your browser does not render page correctly, please read the page content below
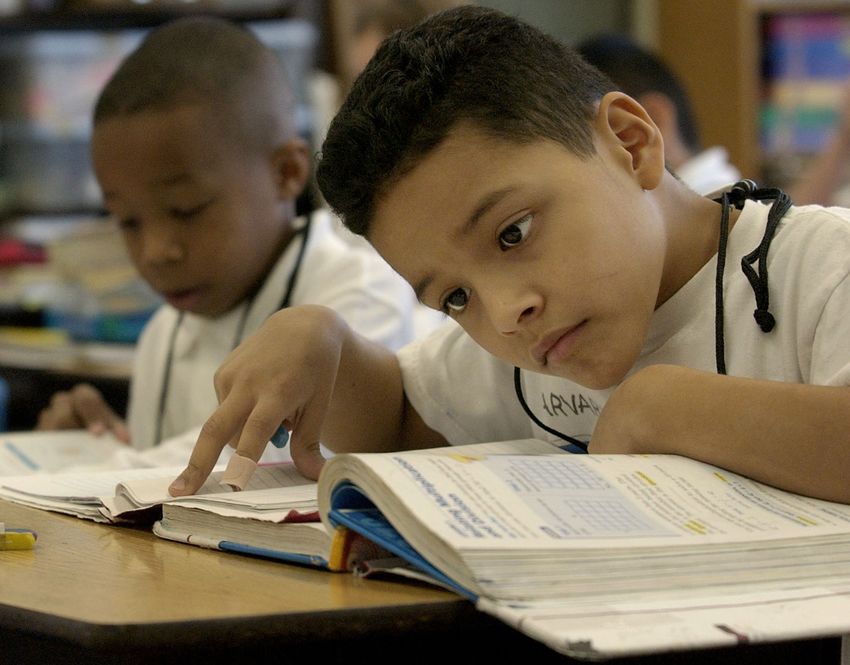
AP PHOTO/DAVID J. PHILLIP

                            Unequal Education
                            Federal Loophole Enables Lower Spending on Students of Color

                            Ary Spatig-Amerikaner   August 2012

                                                                     W W W.AMERICANPROGRESS.ORG
Unequal Education Federal Loophole Enables Lower Spending on Students of Color Ary Spatig-Amerikaner August 2012
Contents    1 Introduction and summary

            7 The problem: Underinvesting in students of color

           11 How does this happen?

           17 Comparability: A federal solution to within-
              district variation

           39 Recommendation: Close the comparability
              loophole gradually

           43 Appendix

           45 About the author

           47 Endnotes
Introduction and summary
In 1954 the Supreme Court declared that public education is “a right which must
be made available to all on equal terms.”1 That landmark decision in Brown v.
Board of Education stood for the proposition that the federal government would
no longer allow states and municipalities to deny equal educational opportunity
to a historically oppressed racial minority. Ruling unanimously, the justices over-
turned the noxious concept that “separate” education could ever be “equal.”
Yet today, nearly 60 years later, our schools remain separate and unequal. Almost
40 percent of black and Hispanic students attend schools where more than 90 per-
cent of students are nonwhite.2 The average white student attends a school where
77 percent of his or her peers are also white.3 Schools today are “as segregated as
they were in the 1960s before busing began.”4 We are living in a world in which
schools are patently separate.
In Brown the Court focused on the detrimental impact of legal separation—the
fact that official segregation symbolized and reinforced the degraded status of
blacks in America. Today’s racial separation in schools may not have the formal
mandate of local law, but it just as surely reflects and reinforces lingering status
differences between whites and nonwhites by enabling a system of public
education funding that shortchanges students of color.
Separate will always be unequal. But just how unequal is the education we offer
our students of color today? This paper answers this question using one small but
important measure—per-pupil state and local spending. This fraction of spending is
certainly not the only useful measure of educational opportunity. How we spend our
money is perhaps more important.5 But newly released data give us the opportunity
to shed new light, specifically on inequity in spending from state and local sources.
For the first time ever, the U.S. Department of Education in 2009 collected
school-level expenditure data that includes real teacher salaries. Amazingly,
Introduction and summary | www.americanprogress.org 1this had never been done before. I use these data to examine per-pupil spending
in public schools, finding that:
• Students of color are being shortchanged across the country when compared
to their white peers.
• The traditional explanation—that variation in schools’ per-pupil spending stems
almost entirely from different property-tax bases between school districts—is
inaccurate. In fact, approximately 40 percent of variation in per-pupil spending
occurs within school districts.
• Changing a particular provision of federal education law—closing the so-called
comparability loophole—would result in districts making more equitable
expenditures on students of color.
Variation within a district is largely due to district budgeting policies that ignore
how much money teachers actually earn. When veteran teachers elect to move
to low-need schools in richer, whiter neighborhoods, they bring higher salaries
to those schools. New teachers who tend to start out in high-need schools, serving
many students of color and poor students, earn comparatively low salaries. This
leads to significantly lower per-pupil spending in the schools with the highest
concentrations of nonwhite students.
To date, the size of the problem has been difficult to measure due to a lack of data.
Other researchers have made important contributions to these conversations by
documenting a pattern of underinvestment in minority students,6 but they have
been hampered by a frustrating lack of information. In 2009 the Obama admin-
istration showed that it recognized the importance of this issue by including a
requirement in the American Reinvestment and Recovery Act of 2009 that dis-
tricts report actual state and local spending on school-level personnel and nonper-
sonnel resources in school year 2008–09. In December 2011 the administration
released the information to the public.
My analysis based on these new data calls into question a specific federal policy that
is supposed to guard against within-district inequities. Title I of the Elementary and
Secondary Education Act is the federal government’s primary contribution to public
education for students living in poverty. In order to receive Title I money, school
districts have to promise to provide educational services to their higher-poverty
schools that are “comparable” to those provided to the lower-poverty schools.
2 Center for American Progress | Unequal EducationSchool districts across the country routinely tell the federal government that they are
meeting this requirement. But the law explicitly requires districts to exclude teacher
salary differentials tied to experience when determining comparability compliance.
This is a major exclusion because experience is a chief driver of teachers’ salaries.
This misleading process leads to a misleading result—districts think they are provid-
ing equal spending on high-need schools and low-need schools, even though they
aren’t. This problem has been frequently called the comparability loophole.
The comparability requirement is, similar to most federal education law, silent
on race. This paper builds upon the well-documented correlation between people
of color and people living in poverty7 to assess the ongoing impact of the compa-
rability loophole on students of color.
In the first part of this paper, I paint a detailed picture of what is happening for
our students of color across the country. The second part models two alterna-
tive futures in which state and local spending experience a one-time growth of
approximately 4 percent. In the first model, present policy trends continue—we
do not close the comparability loophole. In the second, we close the loophole by
“leveling up” spending in schools that are currently being shortchanged. Table 1
presents the top-line findings. (see Table 1)
Introduction and summary | www.americanprogress.org 3TABLE 1
Unequal education
National per pupil spending shortfalls for students of color
Percent
Today No reform Reform
improvement
Shortfall in national per pupil
$334 $347 $192 45 percent
spending on nonwhite students
Shortfall in per pupil spending in
schools serving 90 percent non-
$293 $305 $72 76 percent
white students compared to all
other schools
Shortfall in per pupil spending in
schools serving 90 percent non-
$733 $762 $485 36 percent
white students compared to 90
percent white schools
A 10 percentage point increase
in students of color at a school is
$75 $78 $51 35 percent
associated with a decrease in per
pupil spending of …
Source: Author’s analysis of newly released U.S. Department of Education expenditure data, part of a reporting requirement under the
American Recovery and Reinvestment Act, adjusted for regional cost differences.
Table 1 presents a lot of important information. The most shocking is the data
showing that schools with 90 percent or more students of color spend a full $733
less per student per year than schools with 90 percent or more white students.
What does that add up to? On average, the high-minority schools have 605 stu-
dents. This average school would see an annual increase of $443,000 in state and
local spending if it were brought up to the same per-pupil spending level as those
schools with very few nonwhite students. This is enough to pay the average salary
for 12 additional first-year teachers or nine veteran teachers.
This shift in spending would not by itself fix the unequal spending on education
now evident in school districts across our nation, as I detail in the main pages of
this report. But it would go a long way toward ensuring that the vision of Brown v.
Board of Education is implemented in the 21st century.
In addition to telling this national story, this paper highlights spending patterns
in Texas and California, the states where a full 35 percent of U.S. students of color
attend school. The trends in these states are similar to the national story shown
in Table 1: Students of color are being shortchanged in per-pupil spending in all
of the four ways I assess spending patterns.
4 Center for American Progress | Unequal EducationFinally, the paper argues that Congress should gradually close the comparability
loophole. Specifically, I recommend that when the Elementary and Secondary
Education Act is reauthorized (which should happen soon since it has been due
for reauthorization for several years), the comparability requirement should be
changed in three phases, described in Figure 1.
This change in federal law FIGURE 1
would affect about 3,386 Recommendation
districts, where 77 percent of Phasing in a change to the federal comparability requirement
all students attend school.8 It
is not a magic bullet—dispari- Phase 1: Reporting Year 1
• Continue to hold districts accountable for existing comparability requirements, and
ties in funding for students of
• Require districts to report actual expenditures.
color will persist. To com-
pletely resolve the problem Phase 2: Transition Years 2 - 4
• Continue to hold all districts accountable for old comparability requirements, and
would require addressing both • Require districts not meeting new requirements (listed in Phase 3) to spend any
within-district and between- new state and local money in schools with lowest actual per pupil expenditures.
district spending problems in
Phase 3: Closed Loophole Years 5 & Beyond: New Comparability Requirements
each state, as well as state-by- • Title I schools must receive at least as much per pupil as average non Title I;
state discrepancies in educa- • Must be calculated using actual teacher salaries;
• Comparisons must be made within school level categories (elementary, middle,
tional support. high); and
• If all schools are Title I, then those in highest two quintiles of poverty must have
spending at least as much as the average for those in lowest two quintiles.
Much work has been done
already to reduce between-dis-
trict disparities. These battles
have been fought in courtrooms and legislative chambers across the country. This
paper, however, focuses only on whether and how we should close the comparabil-
ity loophole in federal law—a reform that would reduce within-district disparities
in per-pupil funding and reduce the amount by which we shortchange students of
color. I believe you will find the new data and the conclusions we can draw from
them compelling evidence for the gradual closing of the comparability loophole
Introduction and summary | www.americanprogress.org 5The problem: Underinvesting
in students of color
The national numbers
There are four ways to measure how much our country spends on students of color Across the
compared to white students. Each tells a different version of the same story. First,
across the country schools spent $334 more on every white student than on every country schools
nonwhite student. To get this figure I simply divided each school’s adjusted total
spending into “white” and “nonwhite” shares based on the proportion of students spent $334 more
who are white. Then I added each of these “white” and “nonwhite” shares across the
country and divided by the total number of white and nonwhite students. This is a on every white
nontrivial spending difference, given that the median per-pupil spending was $4,038
(see appendix for explanation of per-pupil calculation). The $334 average shortfall is student than on
8 percent of the median per-pupil spending.
every nonwhite
The second version of the problem is more troubling: It focuses on the most
racially isolated schools. More than one-third of the students represented by this student.
new dataset attend schools that are either more than 90 percent white or more
than 90 percent nonwhite. The spending difference between these schools is large.
The mostly white schools spent $733 more per student than the mostly nonwhite
schools,9 or 18 percent of the median per-pupil spending nationwide. Mostly white
How big a problem is this for students in the high-minority schools? What could schools spent $733
that money buy? The average-sized, mostly minority school has 605 students. This
means that the average school serving 90 percent or more students of color would more per student
see an annual increase of more than $443,000 if it were to be brought up to the
same spending level as its almost-entirely-white sister schools. The average first- than the mostly
year teacher in the United States is paid $36,780; the average teacher with 11 years
to 20 years of experience earns $47,380.10 This funding could pay the salary for 12 nonwhite schools.
additional first-year teachers or nine veteran teachers.11 Alternatively, this funding
could pay for any number of other useful personnel or resources such as school
counselors, teacher coaches, or laptop computers.
Introduction and summary | www.americanprogress.org 7We spend $293 OK, skeptics might say, but that is comparing the two ends of the spectrum:
schools that are almost entirely white with schools that are almost entirely non-
less per year on white. What about the whole story? The last two versions of the problem answer
this question. Version three compares the “high-minority” schools (90 percent
students in these or more nonwhite) to all other schools. We spend $293 less per year on students
in these heavily minority schools than on students in all other schools. That’s 7
heavily minority percent of the median per-pupil spending.
schools than on Finally, across all schools, an increase of 10 percent in students of color is associ-
ated with a decrease in spending of $75 per student.12 This is a fairly small number,
students in all given that the median per-pupil spending in 2009 was $4,038. This analysis does
not imply that spending is being determined by race, explicitly or implicitly. But
other schools. given the 20 percent gap in high school graduation rates between white students
(78 percent) and their peers—Hispanic (58 percent), black (57 percent), and
American Indian (54 percent)—spending less money on schools that serve more
students of color, even if it is not on purpose, simply does not make sense.13
An increase of
Table 2 shows how an increase of 10 percent in students of color is related to
10 percent in per-pupil spending in each state. It shows that in 24 states an increase in the
concentration of students of color is associated with a decrease in dollars spent
students of color per pupil. These 24 states educate 63 percent of all students of color. In 13 states
the percentage of students of color is not related to a school’s per-pupil spending.
is associated with In 12 states an increase in the concentration of students of color is associated with
an increase in per-pupil spending. This positive news is tempered by the fact that
a decrease in only 12 percent of students of color attend school in these states. (New Jersey was
excluded from the entire analysis because it mistakenly included federal spending
spending of $75 in its report instead of only state and local spending.)
per student.
8 Center for American Progress | Unequal EducationTABLE 2
State spending on unequal education
Relationship between school racial composition and dollars spent per pupil
A 10 percentage point increase in students of color is associated with . . .
A decrease in dollars per pupil No significant spending An increase in dollars per pupil
in 24 states change in 13 states in 12 states
Vermont -$762* Maine -$122 Mississippi $16*
New Hampshire -$582* DC -$117 Virginia $16**
Nebraska -$298* Wyoming -$108 Louisiana $29*
Nevada -$257* Delaware -$106 Maryland $36*
Kansas -$188* Michigan -$4 Missouri $41*
New Mexico -$179* Florida -$3 Minnesota $99*
Connecticut -$151* Indiana $2 South Carolina $118*
Iowa -$151* Tennessee $5 North Dakota $123*
Colorado -$145* Georgia $7 South Dakota $140*
West Virginia -$125* North Carolina $12 Ohio $162*
Idaho -$120* Massachusetts $16 Montana $180*
Oregon -$114* Arkansas $26 Alaska $409*
California -$104* Utah $28
New York -$104*
Wisconsin -$100*
Texas -$95*
Rhode Island -$78*
Pennsylvania -$73*
Oklahoma -$53*
Washington -$50*
Illinois -$42*
Arizona -$37**
Kentucky -$30**
Alabama -$20*
*p < 0.05, ** p < 0.10
Source: Author’s analysis of newly released U.S. Department of Education expenditure data, part of a reporting requirement under the
American Recovery and Reinvestment Act, adjusted for regional cost differences.
Introduction and summary | www.americanprogress.org 9California and Texas
Because a full 35 percent of students of color attend school in either California
or Texas, I highlight per-pupil spending patterns in these two states. Table 2 shows
that schools in both states have a negative relationship between the percent of
students of color and dollars spent per student. The problem is starker when we
focus on those schools serving almost only nonwhite students.
• In the California schools serving 90 percent or more nonwhite students, per-
pupil spending is $191 less than at all other schools, and $4,38014 less than at
schools serving 90 percent or more white students.15
• In the Texas schools serving 90 percent or more nonwhite students, per-pupil
spending is $514 less than at all other schools, and $911 less than at schools
serving 90 percent or more white students.16
Just how big are these differences? In California the average high-minority school
has 759 students. If an average-sized school got an extra $4,380 for every student, it
would mean an extra $3.3 million per year. If it were to get a more modest boost of
$191 per student to bring it in line with the majority of schools in the state, then it
would get approximately $145,000 extra per year. What could that buy? New teach-
ers in California are paid approximately $45,000 a year, and veterans with 11 years
or more of teaching experience are paid an average of $68,000 a year.17 If per-student
funding were increased in the schools serving almost entirely students of color to
the same level as the rest of the state’s schools enjoy, it would pay the salaries of two
experienced teachers or three new teachers, or buy any number of other valuable
educational inputs such as computers, guidance counselors, or teaching coaches.
In Texas the average high-minority school is 708 students; new teachers are paid
$39,150, and veterans earn $47,110 each year.18 If an average school in the Lone
Star state were to receive an extra $514 in per-pupil funding—enough to bring
it up to the level of spending the rest of the schools in the state enjoy—it would
be able to pay the salaries of seven veteran teachers or nine new teachers.
The bottom line: Across our country, we are spending less on students of
color than on white students, at least when it comes to the state and local dol-
lars reported by states under the new reporting requirement in the American
Recovery and Reinvestment Act of 2009.
10 Center for American Progress | Unequal EducationHow does this happen?
Within-district and between-district variation in
per-student spending
How do we end up spending so much less on minority students? What mecha-
nisms create this per-pupil discrepancy? Researchers often think about the phe-
nomenon of varied per-pupil educational investment at three distinct levels:
–– States: States provide different levels of funding for education from one another.
–– Between districts: School districts receive different amounts of funding.
–– Within districts: School districts distribute funds differently among their schools.19
Understanding which of these allocation policies are driving inequity in spending
is important for those who want to effectively advocate for reducing this inequity.
This paper does not address the variation in total education expenditures that
exists between states. Instead, it asks how much total variation in spending exists
in each state and then looks at whether the discrepancies stem primarily from
within- or between-district spending.
Unequal education spending: Total variation in each state
Let’s start by looking at the total variation in per-pupil spending at the school level
in each state. Table 3 displays each state’s median per-pupil spending, as well as
per-pupil spending in schools at the 25th and 75th percentiles of per-pupil spend-
ing. It also includes a “spread ratio,” which is the difference between the 75th and
25th percentile expressed as a percentage of the median. This ratio is one easy way
to see how evenly a state’s money is being spent across its schools. The lower the
ratio, the more evenly the money is being spent.
How does this happen? | www.americanprogress.org 11Note that the spread ratio for all states is more than 20 percent of their median
spending, and that on average, the spread is approximately one-third of the state’s
median per-pupil spending. The differences in educational spending on the
schools within every state in the country remain substantial.
TABLE 3
Unequal state spending per pupil
Variation in adjusted per pupil spending by state in the 2008-09 school year
25th Percentile 50th Percentile 75th Percentile Spread Ratio
($) ($) ($) (75-25/50) (%)
Florida 2,452 2,719 3,012 21
Washington 3,368 3,687 4,150 21
West Virginia 3,577 3,982 4,425 21
Tennessee 3,201 3,574 3,990 22
Alabama 3,587 4,017 4,507 23
Mississippi 3,016 3,396 3,801 23
Vermont 6,401 7,430 8,210 24
Georgia 4,115 4,612 5,239 24
Oregon 3,371 3,743 4,284 24
Kentucky 3,567 4,019 4,547 24
California 3,094 3,459 3,942 25
North Carolina 3,953 4,410 5,064 25
Michigan 3,214 3,662 4,172 26
Maryland 4,323 4,846 5,595 26
Delaware 4,232 4,906 5,536 27
Minnesota 3,514 4,041 4,602 27
Indiana 3,524 4,021 4,612 27
Maine 4,627 5,243 6,048 27
Louisiana 3,560 4,009 4,654 27
Rhode Island 4,739 5,479 6,253 28
Virginia 3,577 4,092 4,708 28
Hawaii 4,733 5,248 6,224 28
South Carolina 4,015 4,553 5,312 28
Missouri 3,273 3,727 4,336 29
12 Center for American Progress | Unequal Education25th Percentile 50th Percentile 75th Percentile Spread Ratio
($) ($) ($) (75-25/50) (%)
Wisconsin 3,661 4,232 4,901 29
Texas 2,919 3,407 3,965 31
Ohio 4,147 4,828 5,637 31
Massachusetts 3,771 4,408 5,133 31
Iowa 4,284 4,899 5,804 31
Connecticut 4,768 5,633 6,523 31
Nevada 3,253 3,567 4,380 32
Utah 2,669 3,103 3,650 32
National Average 3,868 4,489 5,349 32
New York 4,457 5,225 6,193 33
Pennsylvania 4,144 4,882 5,779 33
Illinois 3,264 3,812 4,567 34
Colorado 3,592 4,186 5,046 35
Oklahoma 3,006 3,467 4,215 35
District of
4,702 5,442 6,622 35
Columbia
South Dakota 3,297 3,812 4,723 37
Kansas 4,427 5,094 6,367 38
Arkansas 4,534 5,288 6,643 40
Montana 4,334 5,126 6,424 41
Arizona 2,721 3,258 4,112 43
Idaho 3,234 3,907 4,914 43
New Hampshire 4,696 5,847 7,405 46
North Dakota 4,545 5,486 7,107 47
Nebraska 4,374 5,285 6,881 47
New Mexico 3,494 4,261 5,575 49
Wyoming 5,517 6,736 9,335 57
Alaska 4,546 6,374 8,345 60
Source: Author’s analysis of newly released U.S. Department of Education expenditure data, part of a reporting requirement under the
American Recovery and Reinvestment Act, adjusted for regional cost differences
How does this happen? | www.americanprogress.org 13Of course, variation in per-pupil spending is not inherently bad. Increased
investment in students who need the most support makes sense.20 Further, some
variation is easily explained—it is more expensive to run a high school than an
elementary school, for instance (though note that when I recreate Table 3 using
only elementary schools in each state, the numbers do not change much).
But this much variability in per-pupil spending, especially when coupled with
the racial spending patterns described above, is cause for concern.
Unequal education spending: Variation between and within
school districts
The most common reason given for variation in the funding of schools is the
history of school finance systems in which public schools were supported almost
entirely by local property taxes. 21 Because of this well-known story, the majority
of efforts by advocates of equal public education spending have been aimed at
reducing spending inequities between school districts in the same states by
redistributing education spending from wealthier to poorer districts.
But in recent years, researchers have started to document a new level of maldistri-
bution of resources at the district level. “Almost universally,” explains University of
Washington’s Center for Education researcher Marguerite Roza, “school districts
magnify those initial [between-district] inequities by directing more non-targeted
money to schools and students with less need.”22 The primary mechanism through
which this happens? Districts have teacher assignment practices that place the
least-experienced teachers in high-minority, high-poverty schools. Because novice
teachers earn so much less in salary, the total spending at these high-needs schools
is likely to be lower than spending at schools in wealthier neighborhoods that
employ veteran teachers.
The Center for American Progress published studies shining a light on these
within-district inequities in teacher salaries in California and Florida. The former
required painstakingly “pluck[ing], one by one, from online school accountabil-
ity report cards,” the average teacher salaries at each school.23 Florida made the
job easier by collecting and reporting expenditure data, including actual teacher
salaries, at each school.24
14 Center for American Progress | Unequal EducationFIGURE 2
Partition of variance in per-pupil spending
Between districts (%) Within districts (%)
South Carolina
Georgia
Wyoming
Tennessee
Arkansas
West Virginia
South Dakota
Alabama
Delaware
Wisconsin
Mississippi
North Carolina
Florida
Michigan
Loisiana
Virginia
Alaska
Vermont
Missouri
Nebraska
DC
Maryland
Kentucky
Montana
Rhode Island
U.S. Average
Minnesota
Maine
Kansas
Nevada
Massachusetts
Illinois
Oklahoma
Colorado
Ohio
Indiana
Utah
North Dakota
New Hampshire
Pennsylvania
Connecticut
New York
Texas
Oregon
Iowa
California
Idaho
Washington
New Mexico
Arizona
0 20 40 60 80 100
Source: Author’s analysis of newly released U.S. Department of Education expenditure data, part of a reporting requirement under
the American Recovery and Reinvestment Act, adjusted for regional cost differences.
How does this happen? | www.americanprogress.org 15But even these illuminating studies do not solve the problem that the University
of Washington’s Roza identified in 2006: There was “no large scale national data-
base” to assess the scope of this problem.25 Until now.
The latest data highlights both within- and between-
district inequities
Figure 2 exploits this new data to show the percentage of variation in per-pupil
41 percent spending occurring within and between districts in each state. The percentage
of variation that is within districts—the part of the story that no one really talks
of the variation about and that is likely driven by teacher salary differences—ranges from
9 percent in Arizona to 77 percent in South Carolina.26 On average,27 41 percent
in spending of the variation in spending between schools happens within districts; the
remaining 59 percent falls between districts in a state.
between schools
This is a major finding. Contrary to popular belief,28 individual districts themselves
happens within are responsible for a sizable amount of the variation in per-pupil spending. The
common perception that discrepancies in wealth between districts are responsible
districts; the for most of the variation in per-pupil spending within a state is simply not the whole
story. In some states there is more between-district variation, and in those areas the
remaining 59 focus should continue to be on addressing those funding discrepancies. But in the
states at the top of Figure 2, the bigger problem appears to be within-district varia-
percent falls tion in spending.
between districts Advocates of equitable education funding should target their strategies to indi-
vidual states; the information in Figure 2 should help to contextualize reform
in a state. efforts in each state. But Figure 2 also shows that within-district discrepancies
in spending are a nationwide problem. The remainder of this paper presents a
proposed solution to that problem.
16 Center for American Progress | Unequal EducationComparability: A federal solution
to within-district variation
The two primary findings of this paper thus far are that we are systematically
(even if not intentionally) spending less on the schools that serve high concentra-
tions of students of color, and the current discrepancies in per-pupil spending stems
from both state and district spending policies. This whole analysis is about problems
with state and local spending. But is there a role for federal policymakers?
Since 1936 Congress has had explicit permission from the Supreme Court
to use its spending power to influence a wide range of state and local action.29
What federal levers might Congress use to incentivize states and districts to
change the disturbing spending patterns documented above? The Elementary
and Secondary Education Act has been the primary source of federal education
funding and policy intervention since its initial passage in 1965. Congress most
recently reauthorized it in 2001 with the passage of the No Child Left Behind Act.
The money that flows through the federal programs authorized by these two laws
makes up only 8.2 percent of all education spending. Nonetheless, this is a non-
trivial amount of money: $47.7 billion in 2007–08.30 By investing this much in our
nation’s schools, Congress has purchased a vote in how they are run. In recent his-
tory, federal lawmakers have not been shy about using their carrot-and-stick power
to force dramatic accountability and teacher-training requirements on schools
across the country. Consider, for instance, the now very well-known account-
ability and teacher-quality provisions added to the Elementary and Secondary
Education Act by the No Child Left Behind Act.
So what can Congress do to change state and local spending practices? Title I
of the Elementary and Secondary Education Act—“Improving the Academic
Achievement of the Disadvantaged”—authorizes the largest pot of federal educa-
tion money, and thus carries the most potential for effecting change. Because the
money is allocated to school districts directly, it is easier to use it to change district
policies than state policies.
Comparability: A federal solution to within-district variation | www.americanprogress.org 17Congress has always demanded that districts use the federal dollars to enhance
educational opportunities for low-income students. The federal funding is sup-
posed to provide additional help for schools serving disadvantaged students,
not replace state and local funding that would otherwise go to them.31 Congress
included three specific financial requirements to keep districts from using federal
funds improperly:
–– A supplement-not-supplant requirement that says federal funds must be
used to supplement nonfederally funded expenditures, not supplant them
–– A maintenance-of-effort requirement that says districts must spend at least
90 percent as much each year as in the year prior
–– A provision called the comparability requirement that is designed to ensure
that all schools receiving Title I funding are providing services to their students
comparable to those in non-Title I schools before federal funds are distributed32
Collectively, says the Department of Education, these requirements are “critical
to the success of Title I, Part A because they ensure that the federal investment
has an impact on the at-risk students the program is designed to serve—some-
thing that would not occur if federal dollars replaced state and local resources that
would otherwise be made available to these at-risk students.”33
Because I suggest changing the requirement, it is important to take a moment first
to understand the details of the way the current law does and does not work.
In order for a school district to receive its formula-based Title I grant each year,
the comparability provision says the district must show that, “Taken as a whole,
services provided in Title I schools from state-and-local funds be at least compa-
rable to those provided in non-Title I schools.”34 The Department of Education
explains that, “The purpose of this comparability requirement is to ensure that
federal assistance is providing additional resources in high-need schools rather
than compensating for an inequitable distribution of funds that benefits more
affluent schools.”35
Districts can demonstrate compliance with this comparability requirement
in several ways. Approximately 80 percent use a method sanctioned by official
Department of Education guidance by ensuring that student-to-teacher ratios in
Title I schools are between 90 percent and 110 percent of the average in non-Title
I schools.36 The districts can do this within “school-level” bands—i.e., by compar-
ing elementary schools to elementary schools—or in the district as a whole.37
18 Center for American Progress | Unequal EducationIf all schools are served by Title I, then every school must have between 90
percent and 110 percent of the district average student-to-teacher ratio.38
Districts can also choose to show comparability using expenditure data instead
of student-to-teacher ratios. In this case, they report personnel spending equal
to the number of teachers at each school multiplied by the average district teacher
salary, an accounting maneuver that effectively wipes out experience-based salary
differentials received by individual teachers.39
The loophole that undermines comparability’s effectiveness
There are two problematic assumptions in both of these widespread methods of
proving that Title I schools are getting comparable services to non-Title I schools.
First, they assume that the primary purpose of the comparability requirement
was to address the allocation of teachers—and not the allocation of other forms
of educational services. The Department of Education’s guidance, after all, allows
districts to comply by showing only student-teacher ratio comparability. Districts
are thus free to completely ignore resources such as school facilities, textbooks,
and appropriate and high-quality curricular and extracurricular offerings.
Second, these approaches treat teachers as interchangeable “widgets” that each
provide “comparable” services to their students.40 They intentionally do not
acknowledge that these teachers do not actually cost the district the same amount
of money. In fact, the statute explicitly forbids including any salary differentials
based on years of experience when making comparability calculations.
These problems join together to form what scholars and advocates call the “com-
parability loophole.”41 This loophole allows districts to claim that they are provid-
ing comparable services to Title I and non-Title I schools even if all their most
expensive (and likely most experienced) teachers may be clustered in non-Title
I schools. By intentionally turning a blind eye to this particular type of resource-
allocation decision, scholars argue, Congress and the Department of Education
are undermining the intent of the billions of dollars they are spending. These
funds are intended to provide services “on top of ” those purchased using equally
distributed state and local funds. In reality, the funds are anything but equal.
Title I money is allocated primarily based on poverty levels, which means ensur-
ing that Title I schools have “comparable services” is largely equivalent to ensuring
Comparability: A federal solution to within-district variation | www.americanprogress.org 19that high-poverty schools get their fair share of state and local funding. Since race
and poverty are highly correlated,42 it is it is reasonable to predict that this loop-
hole is depressing the amount of money spent at schools serving students of color.
Conversely, it is reasonable to predict that closing the loophole would increase
per-pupil spending on students of color.
If these rules How would closing the loophole change spending patterns?
were adopted In assessing the benefits and costs of changing this policy, the first step is to define
exactly what the new “closed” comparability requirement would require. In a paper
today, 3,836 for the Center for American Progress in 2008, Ross Weiner, then-vice president at
the Education Trust—a nonprofit advocacy and technical assistance firm—spelled
districts across the out specific recommendations.43 In order to receive their Title I funds, districts
should have to show that they are providing comparable services by:
country—where 77
–– Including actual teacher salaries in the calculations instead of average salaries
percent of students –– Including all general education expenditures in the calculations and not just
the number of teachers
attend school— –– Showing that Title I schools are each receiving at least as much as the district’s
average for non-Title I schools instead of between 90 percent and 110 percent
would be forced of the non-Title I average
–– Comparing Title I schools with the non-Title I schools in the same grade level
to change their –– Requiring—in districts where every school in a particular grade level is a
Title I school—schools serving the highest two quintiles of students living in
spending patterns poverty to spend at least as much as the average for those schools serving the
lowest two quintiles
or risk being out of
compliance. If these rules were adopted today, 3,836 districts across the country—where 77
percent of students attend school—would be forced to change their spending pat-
terns or risk being out of compliance.44
This section of the paper asks two sets of questions. First, would closing the loop-
hole change the patterns of underinvestment in students of color? And second,
what would individual districts actually do to implement it, how hard would it
be, what would it cost, and what unintended consequences might ensue? These
answers inform the final recommendation to gradually close the loophole while
also pursuing other, broader policy changes at a federal level.
20 Center for American Progress | Unequal EducationIn order to predict the effects of changing the law, I model what would happen if the
loophole were closed. There are three general ways that the loophole could be closed:
• Reallocate existing resources: School districts would be given no new money This leveling-up
and told they had to spend at least as much on Title I schools as non-Title I
schools. The result, in districts not meeting this requirement, would be to real- solution would
locate resources from the non-Title I schools to Title I schools.
cost a total of $6.83
• Equalize with new money: School districts would be subject to the same
requirement but would use new funds to “level up” the Title I schools to billion, which is
a level of spending equal to their non-Title I counterparts.
less than 4 percent
• Combination: Districts could be required to reallocate some funds and also
be given some new money. of current general
Of the three options, I model the so-called leveling-up version in this paper for state and local
two reasons. First, it is the most straightforward to model. Second, it is the most
politically feasible, as I discuss below. This leveling-up solution would cost a total education funding.
of $6.83 billion, which is less than 4 percent of current general state and local
education funding.45
To create this modeled “closed loophole” world, I artificially increase spending
at Title I schools to the level that would be required under a closed loophole (the
average spending in non-Title I schools serving the same grade levels) if their
2009 spending registered below this bar.
In what follows, I compare spending patterns in the closed loophole world with
today’s real world as reported to the Department of Education using 2009 data.
While this is a useful comparison, it is not entirely fair, because the closed-loop-
hole world allocates $6.83 billion more than today’s real world. To address this,
I add a model that increases spending by the same amount but without closing
the loophole.46 This allows us to compare what our education spending patterns
will likely look like if we do nothing—do not fix the loophole and simply allow
spending to grow as the economy recovers—with what the education spending
patterns might look like if we close the loophole.
By essentially throwing $6.83 billion at our schools in two different ways—first under
today’s rules and second under the proposed new rules—I assess what the compara-
bility loophole is going to cost students of color in the near future if we do not close it.
Comparability: A federal solution to within-district variation | www.americanprogress.org 21How will closing this ostensibly race-neutral comparability loophole change the
national pattern of spending on students of color? Figures 3 through 6 each high-
New public light one of the four versions of the problem described in the first section of this
paper. They compare the spending patterns in three alternative worlds:
education
–– The real world with the comparability loophole in place
spending without a –– A hypothetical scenario with 4 percent spending growth allocated under
today’s rules with no fix to the comparability loophole
change in this law –– A hypothetical scenario with 4 percent spending growth allocated according
to the rules if the comparability loophole were closed
will exacerbate
Figures 3 through 6 detail the results.
the inequities
in spending
on students of
color and their
white peers.
22 Center for American Progress | Unequal EducationFIGURES 3-6
Four ways to describe what closing the comparability loophole w
ould
mean for students of color
FIGURE 3
Effect of closing loophole on national spending per student
National spending per student
Today We spend $334 more per year on each white student than on each student of color.
No fix The problem gets worse. We will spend $347 more per year on each white student
than on each student of color.
Closed world The problem gets better. We would spend $192 more per year on each white
student than on each student of color.
Take Away:
Fixing the loophole would decrease the spending disparity by $155. That’s almost one half of the
original spending gap.
FIGURE 4
Effect of closing loophole on spending gap between 90 percent minority and
90-percent white schools
Mostly minority schools compared to mostly white schools
Today Mostly white schools spend $733 more per student than mostly minority schools.
No fix The problem gets worse. Mostly white schools will spend $762 more per student
than mostly minority schools.
Closed world The problem gets better. Mostly white schools would spend $485 more per student
than mostly minority schools.
Take Away:
One third of students attend these highly segregated schools where the population is more than 90
percent white or nonwhite. If we close the loophole, the spending gap is reduced by more than one third.
Comparability: A federal solution to within-district variation | www.americanprogress.org 23FIGURE 5
Effect of closing the loophole on spending gap between 90 percent minority s chools
and other schools
Mostly minority schools compared to all other schools
Today Mostly minority schools spend $293 less per student than everyone else.
No fix The problem gets worse. Mostly minority schools will spend $305 less per
student than everyone else.
Closed world The problem gets better. Mostly minority schools would spend $72 less per
student than mostly minority schools.
Take Away:
A full 80 percent of the gap between the schools serving mostly minority students and all other schools
would be eliminated if we closed the comparability loophole.
FIGURE 6
Effect of closing the loophole on relationship between percent student body nonwhite
and per pupil spending
National spending patterns by percent of nonwhite students
Today An increase of 10 percent students of color leads to $75 less per student
spending in a school.
No fix The problem gets worse. An increase of 10 percent students of color will lead
to $78 less per student spending in a school.
Closed world The problem gets better. An increase of 10 percent students of color would
lead to $51 less per student spending in a school.
Take Away:
Closing the loophole would improve the national relationship between race and state and local
education spending. It would decrease the problem by 36 percent.
Source: Author’s model calculations
24 Center for American Progress | Unequal EducationThese findings show that the problem (underinvesting in students of color) will
get worse if we allow the law to remain unchanged. This is important for progres-
sives to understand: New public education spending without a change in this law
will exacerbate the inequities in spending on students of color and their white
peers. In contrast, if we close the comparability loophole and districts comply
(more on implementation challenges below), then we can make big strides in
reducing the racial per-pupil funding disparities that are shortchanging students of
color across the country. (see Figure 7)
FIGURE 7
Bottom-line budget implications for high-minority schools
Comparisons to other schools are important, but what are the bottom line b
udget
implications of the loophole for high minority schools?
Today High minority schools spend $4,149 per student.
No fix They will spend $4,312 per student.
Closed world They will spend $4,492 per student.
Take Away:
Not fixing the loophole will cost the average high minority school $180 per student.
When we reach a point where state and local spending has grown by about 4 percent,
the loophole will cost the average high minority school serving 605 students $109,000
per year. That’s quite a price tag.
Source: Author’s model calculations.
Table 5 on pages 26-27 shows the state-by-state effect of closing the comparabil-
ity loophole in version 4 of the problem—the relationship between percent of
students of color and per-pupil spending. Similar to the prior figures, it compares
today with an increase in spending of 4 percent allocated under today’s rules and
with an increase in spending of 4 percent allocated under a closed loophole. The
last column shows the difference between the hypothetical world in which spend-
ing increases by 4 percent but there is no fix for the loophole, and the hypothetical
world in which spending is increased by 4 percent and the loophole is closed. This
column is essentially a measure of the cost of the comparability loophole from the
perspective of students of color—it improves (it is a positive number) in all but
five states.47 The states are ordered by this column so students of color living in the
states at the top have the most to gain from closing the loophole.
Comparability: A federal solution to within-district variation | www.americanprogress.org 25TABLE 5
Helping students of color by closing the comparability loophole
Effect of closing the loophole on the relationship between a 10 percent increase in
percent students of color and dollars spent per pupil
An increase of 10 percentage points in students of color is associated
with what change in per pupil spending?
Today Open Closed Difference: open to closed
Vermont -$762 -$792 -$628 $164
Maine -$122 -$127 $26 $152
South Dakota $140 $145 $253 $108
Alaska $409 $425 $532 $107
Connecticut -$151 -$157 -$71 $86
Pennsylvania -$73 -$76 -$6 $69
Texas -$95 -$99 -$43 $56
Michigan -$4 -$4 $47 $51
Idaho -$120 -$124 -$74 $50
Missouri $41 $43 $91 $48
Rhode Island -$78 -$81 -$34 $47
New Mexico -$179 -$186 -$142 $44
Ohio $162 $168 $209 $41
New York -$104 -$108 -$70 $37
Illinois -$42 -$44 -$7 $36
Wisconsin -$100 -$104 -$70 $35
Nebraska -$298 -$310 -$283 $27
Kansas -$188 -$196 -$171 $25
Massachusetts $16 $17 $41 $24
Georgia $7 $7 $31 $24
Arizona -$37 -$39 -$15 $23
Montana $180 $187 $210 $23
Maryland $36 $37 $60 $23
Oklahoma -$53 -$55 -$35 $20
Oregon -$114 -$118 -$101 $18
Colorado -$145 -$151 -$134 $17
California -$104 -$108 -$91 $17
Arkansas $26 $27 $44 $17
Iowa -$151 -$157 -$141 $16
Indiana $2 $3 $18 $15
26 Center for American Progress | Unequal EducationAn increase of 10 percentage points in students of color is associated
with what change in per pupil spending?
Today Open Closed Difference: open to closed
South Carolina $118 $123 $138 $15
Tennessee $5 $5 $19 $14
Washington -$50 -$52 -$40 $12
Florida -$3 -$3 $8 $11
Alabama -$20 -$20 -$10 $11
New Hampshire -$582 -$605 -$595 $9
Mississippi $16 $17 $25 $8
West Virginia -$125 -$130 -$122 $7
Kentucky -$30 -$31 -$25 $7
Nevada -$257 -$268 -$261 $6
Louisiana $29 $30 $34 $4
North Carolina $12 $12 $15 $2
Delaware -$106 -$110 -$108 $2
Minnesota $99 $103 $104 $1
Virginia $16 $17 $14 -$3
Utah $28 $29 $24 -$5
Wyoming -$108 -$112 -$117 -$5
North Dakota $123 $127 $118 -$10
DC -$117 -$122 -$132 -$10
Results from general regression of adjusted dollars per pupil on “%nonwhite” in each state using actual spending data (today) and modeled
spending data (closed).
Source: Author’s analysis of newly released US Department of Education expenditure data, part of a reporting requirement under the
American Recovery and Reinvestment Act, adjusted for regional cost differences.
Comparability: A federal solution to within-district variation | www.americanprogress.org 27How do our two states of particular interest fare? In California closing this loop-
hole would take a step in the right direction by reducing the magnitude of the
negative relationship by 16 percent ($17 per student). In Texas closing the loop-
hole would cut the negative relationship between the percent of students of color
and per-pupil spending by more than half, from a $99 decrease to a $43 decrease
with every 10 percentage point increase in students of color.
These numbers might seem trivial. In Texas, for example, if a 10 percentage point
increase in students of color is associated with a $43 decrease in per-pupil spend-
ing due to closing the loophole, instead of a $99 decrease by not closing it, does
that really matter? Is that enough to justify changing the policy? This $53-per-
student annual change in an average Texas school of 552 students is the equivalent
of $29,256—less than one new teacher’s salary. This isn’t nothing, but it also isn’t
a game changer for these students.
Again, however, the meaningful spending differences are at the extremes—as
described above, the schools with 70 percent, 80 percent, and 90 percent students
of color that are losing out on substantial sums of money if we don’t close the loop-
hole. A school with 90 percent or more students of color in Texas today spends
$911 less per pupil than a school with 10 percent or less students of color.48
When the current budget crisis ends in Texas and state and local spending starts
to increase, what will happen? If we let present trends continue—if we don’t close
the loophole and state and local public education funds grow by 4 percent—
then the gap will grow to $946. If, instead, we close the loophole, then that same
increase in spending will lead to a different result: That gap would be cut in half,
down to $477. That adds up to an annual difference of $338,000 enough to pay
salaries for eight new teachers or seven veteran teachers.
For a high-minority school in Texas, its spending relative to an all-white coun-
terpart might matter less than the school’s spending relative to what it should
get if the loophole were closed. Under the model where the loophole remains,
these schools have average per-pupil spending that is $316 less than the model
where the loophole is closed. The average high-minority school in Texas has 708
students. In a hypothetical world in which state and local education spending
increases by approximately 4 percent, the loophole would cost this average high-
minority school $224,000 a year. That is the cost of salaries for five new teachers
or four veteran teachers.49 It could, alternatively, buy every student in the school
a laptop computer.50
28 Center for American Progress | Unequal EducationEffects of an ostensibly race-neutral policy on students living in
poverty and students of color
Comparability requirements are technically race-neutral. This analysis provides
one example of the way that “color blind” policies can have dramatic racial impli-
cations. The costs of this federal policy are not equally shared across race lines:
Students of color are bearing the bulk of the burden.
Nonetheless, in analyzing a policy change of this magnitude, I would be remiss
to ignore effects on students living in poverty more broadly. Not surprisingly
(since the comparability requirement is written for their benefit), closing the
loophole appears to also be good news for this larger population as a whole.
An increase of 10 percentage points of students living in poverty today is associ-
ated with a school budget decrease of $19 per student. If we do nothing to close
the loophole before the economy rebounds and education spending rises by 4
percent, the problem will get slightly worse, meaning the decrease in spending
associated with a 10 percent increase of students in poverty will be $20. But if
we close the loophole, the negative relationship is eliminated. In the hypothetical
world where we increase spending by 4 percent and do close the loophole, the
model predicts that an increase of 10 percentage points of students living
in poverty will be associated with a $2 increase in per-pupil spending.
For students attending a school where more than 90 percent of students live in
poverty, how much does it matter if we close the loophole? With the loophole
closed, these schools would spend an average of $4,880 per pupil. In a world
where we spend the same amount of money but do not close the loophole, the
average spent would be $4,768. That’s a difference of $112 per student. The aver-
age high-poverty school serves 460 students. Thus for these schools, the cost of
the loophole is approximately $52,000 per year—and will go up over time. This
is more than the average first-year teacher is paid nationally.51
Comparability: A federal solution to within-district variation | www.americanprogress.org 29Administrative challenges to closing the comparability loophole
Concerns about closing the loophole fall broadly into two groups: administrative
and substantive. This section of the report focuses on two of the most common
administrative concerns: Data management and conflicts between union con-
tracts, federal law, and budget shortfalls.
Data management
The first question always raised about closing the comparability loophole by
making districts account for actual teacher salaries is “How hard would this be for
districts? Can they even track this data?” Until 2009 the Department of Education
had never asked school districts for this information, and their data systems are
often not set up this way. The traditional school district has a payroll system and
a budgeting system that are separate. They are not designed to speak to one
another. The payroll staff is in charge of paying teachers; the budget staff assigns
teacher slots to schools without regard to their cost.52 These budget offices are
generally the ones responsible for maintaining federally mandated comparability
requirements among Title I and non-Title I schools.
The question, then, is whether a school district budget office has access to the
information it would need to balance school-level spending as determined by
actual teacher salaries.
“Of course,” says Matt Hill, chief strategy officer at the Los Angeles Unified School
District. “You know where your people are and how much you’re paying them. I
just don’t see what’s so hard.”53 Hill went on to explain that at his previous job at the
Oakland Unified School District, he used to just “download the whole budget and
all the personnel files into [his personal] computer for 30,000 kids.” It isn’t magic,
but it does take time and a little know-how, Hill says, and there should be some
technical assistance provided to districts if and when this change is implemented.
Kristen Ferris, a manager at Education Resource Strategies,54 agrees. As part of
their consulting arrangements with urban school districts, her firm does equity
analyses of how school districts spend their money. One of the things the firm
does is assess total per-pupil spending at each school using actual salaries. “It’s
30 Center for American Progress | Unequal EducationYou can also read