The Greenwich Bay Fish Kill August 2003 - Causes, Impacts and Responses - Rhode Island Department of Environmental Management
←
→
Page content transcription
If your browser does not render page correctly, please read the page content below
The Greenwich Bay Fish Kill – August 2003

        Causes, Impacts and Responses

 Rhode Island Department of Environmental Management
                   September 3, 2003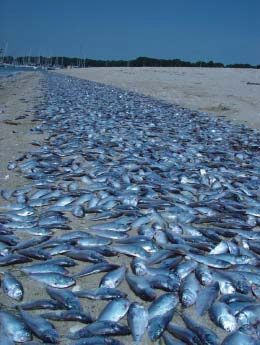
Table of Contents

                                                                          Page

I.     Introduction and Summary                                           1

II.    Description of Event – August 20                                   3

III.   Cause(s)                                                           4

IV.    Scope and Context                                                  5
       •      Chronology                                                  5
       •      Conditions around Narragansett Bay – August 2003            6
       •      Conditions around Narragansett Bay – Historically           9

V.     Sources of Nutrient Loading                                        10
       •      Point and Nonpoint Pollution Sources                        13

VI.    Impacts                                                            14

VII.   Recommendations                                                    15
       •    Hold Greenwich Bay Fish Kill Public Workshop                  16
       •    Consider New Bond Funding                                     16
       •    Accelerate Nutrient Upgrades at Sewage Treatment Facilities   17
       •    Improve Septic System Management                              17
       •    Improve Stormwater Management                                 18
       •    Improve Monitoring and Assessment                             18
       •    Improve Bay Planning                                          21

Appendix 1           Bond Proposal                                        23

Appendix 2           Nitrogen Removal                                     31
I. Introduction and Summary
Rhode Islanders and all who care about Narragansett Bay just witnessed a sad and telling event.
More than one million fish, primarily menhaden, were reported killed on August 20, 2003. This
was the result of an environmental condition that would kill any human - no oxygen to breathe.
A fish kill of this magnitude - many have called it the worst in the last fifty years - makes us stop
and take a hard look at the health of Narragansett Bay and how we use, manage and protect this
resource that is key to the state's economic and ecological vitality. As Governor Carcieri
recently said, "Rhode Island is Narragansett Bay."
This report was prepared by the Department of Environmental Management (DEM) at the
Governor’s urgent request for an assessment of causes and impacts, as well as recommendations
for actions that might prevent, or at least minimize, the recurrence of an event like this. Given
the short timeframe in which it was drafted, the report is by definition preliminary, and less than
definitive in all respects. While we believe we have a relatively good understanding of what
happened and why, more information would need to be collected and analyzed to further
characterize and quantify impacts. There is also no perfect scientific consensus about the
relative importance of various factors contributing to the event, and thus no complete consensus
as to what the most appropriate policy or programmatic responses are or in what order of priority
they should be pursued.
As much as we must acknowledge these limitations, we urge that they not be used as an excuse
to delay action. We have sufficient knowledge and scientific understanding to move forward
aggressively with certain actions, at the local and state level, by government and non-
government entities, to address both short and long term issues. To put it bluntly, there is less
immediate need for more study and new initiatives than for better implementation of existing
programs that were developed to address the very issues raised by the fish kill. That means
ensuring key programs have adequate capacity. It means getting serious about pollution
reduction: eliminating cesspools, upgrading sewage treatment plants, mandating tie-ins to sewers
or smaller scale treatment facilities where septic systems cannot provide adequate treatment, and
either preventing direct discharge of storm water or providing adequate treatment. As we
continue to improve our scientific understanding of, for example, circulation and distribution of
contaminated water in Narragansett Bay or the time it takes for groundwater that discharges to
the Bay to cleanse itself from contamination, we should not suspend or slow down the work we
know must be done to further reduce the loading of nutrients and other pollutants into the Bay
and its tributaries.
The report’s major findings are:
1. There is no magic solution, no quick fix. It is unlikely that we will ever be able to prevent fish
kills from happening at all. Nor can we guarantee that any action or combination of actions will
reduce the risk of a recurrence significantly within a short period of time, say a year. Other
findings explain why.
12. The fish kill was not a simple or isolated event. It was part of a much larger event going on
in Greenwich Bay and other parts of Narragansett Bay this year, and part of a trend that has been
observed for many preceding years and will likely continue. The kill affected not only
menhaden, but also other finfish, eels, crabs and in particular soft shell clams, the latter also in
locations north of Greenwich Bay. Additional mortality occurred among clams as this report
was being written, and could occur among additional species if low or no oxygen conditions
continue. In all likelihood, a much broader and deeper impact on the Bay’s ecosystem is
occurring from events like this, including loss of quality habitat and changes in assemblages of
resident species.
3. The immediate cause for the kill was lack of oxygen, but there is a broad and complex range
of factors resulting in a severe and prolonged pattern of oxygen depletion. They include factors
that cannot be controlled, at least not quickly or directly, such as rain, wind, temperature,
geology and hydrodynamics. They also include pollution from various sources, including
effluent from wastewater treatment facilities and septic systems, storm water runoff and
groundwater flow from polluted areas, and perhaps discharges from vessels using the Bay. Some
of these, point sources, are more easily identified and dealt with than so-called non-point source
pollution. All of these pollution sources need to be controlled, and all of the controls require
significant resources, time and political will, to be implemented and to be effective.
4. The fish kill happened during a summer that also saw an extraordinary number of beach
closings around Narragansett Bay, including locations that have not been usually affected in
previous years. This has added to the concern that something unusual has been taking place in
the Bay and that a comprehensive effort is needed to address the larger phenomenon. On the one
hand, some of the same factors have contributed to poor water quality at beaches and to the fish
kill, in particular an unusual amount of rain and storm water runoff. On the other hand, the
phenomena are clearly different, one being caused by lack of oxygen and the other by high
concentrations of bacterial pathogens. While there is some overlap in strategies to deal with
these phenomena, it could be confusing and counterproductive, in our view, to merge them
completely.
5. Rhode Island has had much success in improving its environment, including water quality in
Narragansett Bay. Yet, events like this show us that the progress we have made is not good
enough. We must raise the bar. We can not rely on our luck and hope that, for example, the
weather will cooperate and keep fish kills and beach closures within tolerable dimensions. We
have to accelerate our pollution control efforts and adopt more ambitious targets, in particular for
nitrogen removal. We also need to consider to what extent we may be interfering with critical
processes like circulation within, and flushing of, embayments, and may have to adjust our
policies and practices.
6. Rhode Island has many programs in place that are relevant to our understanding of, and
response to, this event. Between federal and state agencies, academic institutions and
environmental organizations, we actually have a relatively good understanding of what happened
and what must be done. Three things must happen to make us collectively more effective. First,
we must allocate adequate resources to programs with key responsibility, both at the state and
local level. Several state programs, including marine fisheries, water quality restoration and
2enforcement are struggling to meet their mandates. Local initiatives, for example to deal with
poorly functioning septic systems or storm water, are frustrated by lack of resources or available
expertise. Second, to make these programs more effective and make the best use of limited
resources, we must coordinate and integrate them better, at and between all levels. We need a
statewide, if not watershed-wide, mechanism by which we pool our resources, share, use and
disseminate information, develop and implement joint strategies, and avoid wasteful duplication.
And finally, we need better accountability, a structure and transparency for our efforts, so they
can be evaluated on a regular basis, by a range of experts and by the public.
These three principles, adequate resources, coordination and accountability, are also the common
ingredients of various proposals to develop a long term plan, or at least a better planning process,
for Narragansett Bay. And indeed, the fish kill presents many Bay issues mentioned in those
proposals. If anything, the event underscores the urgent need for such a proposal to be
implemented and offers an obvious, initial and high-priority task to be addressed by participants.
We urge the Governor to articulate this mandate and to provide the needed leadership in making
sure this process will be focused on getting actual results, not just many meetings and lengthy
documents.
II. Description of Event - August 20
Early on Wednesday, August 20, 2003,
DEM received two fish kill reports. By
mid morning, reports indicated that tens
of thousands of fish had died in the
vicinity of Greenwich Bay Marina
(Figure 1). This estimate was adjusted
by Marine Fisheries staff around noon to
approximately one million (Figure 2).
The kill consisted of mostly small
juvenile menhaden, but many (hundreds)
of small crabs (calico and others), an
occasional larger (4 or 5 inch) blue crab,
grass shrimp, a few blackfish, some
horseshoe crabs, and some good sized
(about 12-15 inch) American eels were
also observed along the shore or floating
at the surface. The menhaden which
washed up on Wednesday appeared
intact (no lesions such as noted in
Pfiesteria incidents). The eels appeared
to be the largest animals affected. Along
the western shore of the bay, many noted
a rotten egg smell associated with
hydrogen sulfide (toxic to organisms)
being produced by sediment chemistry
and bacterial processes.
3III. Cause(s)
The fish kill was caused by the absence of dissolved oxygen (anoxia) in the waters of Greenwich
Bay, particularly in its deeper waters and near its western shore. The condition caused fish and
other marine animals living in these areas of the bay to suffocate.
This conclusion is solidly based on continuous measurements made by DEM in the western bay
before the event was reported, and by surveys made throughout the bay on the day that the kill
was first reported. Readings from a monitoring station set up in June 2003 at a Greenwich Bay
Marina dock, at the mouth of
Apponaug Cove, showed
dissolved oxygen levels had
dropped to zero in that area.
Later in the day, DEM staff
determined that anoxia extended
out to the mouth of Greenwich
Bay at the bottom and covered
the entire water column at the
western end of the bay (Figure
3, next page).
Anoxia or hypoxia (low
oxygen) is often caused, as it
was in this case, by blooms of
tiny marine plants. This rapid
growth occurs in response to an
increase in nutrients, for
example when storm water enters a water body and carries with it an increased load of pollutants
that include nutrients, in particular nitrogen. Heavy rainfall tends to cause significant increases
in nutrient loading. Other weather factors, such as wind direction and strength, and temperature
play a role as well, either providing favorable conditions under which blooms can develop and
persist, or disrupting the process by mixing and oxygenating the water. Shallow bays and coves
may have poor circulation and flushing, and thus be more vulnerable to nutrient loading, blooms
and prolonged low oxygen conditions.
The fastest growing species are microscopic phytoplankton that are suspended in the water
column, often coloring the water green or brown. They produce oxygen during daylight hours
and take up oxygen from the water column at night. This is reflected in a daily cycle of
dissolved oxygen levels, increasing during the day, dropping off during the night, and at their
lowest in the early morning hours. Growth will slow and stop when there are no more nutrients
or light can no longer penetrate the water column. Oxygen production drops and phytoplankton
begin to die off. The decay uses up more oxygen as “decomposing” bacteria (not the same as
those associated with fecal contamination and beach closures) break down the dead
phytoplankton. The result can be, as it was here, a very rapid depletion of oxygen, especially
when the preceeding bloom is large.
4Data collected by DEM and others confirm that this scenario led to the August 20 fish kill.
Significant rainstorms were followed by a significant bloom in the shallow bay, itself followed
by a gradual and then very rapid decline in dissolved oxygen. The loading from storm water
probably happened through both surface flow and groundwater flow, including from areas still
served by septic systems. An additional, significant source of nutrient loading was the East
Greenwich sewage treatment plant. While anoxia does not necessarily kill fish – they need to be
present in the area – fish were abundant in Greenwich Bay at the time the oxygen dropped to
zero throughout the water column, and were left with no escape. Later reports from local
residents said that fish could be seen gulping for air at the surface the evening of August 19.
The data also show, however, that this event was part of a much larger event involving blooms
and low oxygen levels in a larger area of Narragansett Bay; that its timeframe extends from well
before to well after August 20; that the contributing factors are many and complex; that the
impact goes well beyond the fish kill itself; and that part of the problem is the amount of nutrient
loading that goes on even in the absence of unusual weather patterns as seen this year.
IV. Scope and Context
There have been problems with low
oxygen levels and fish kills
occurring nearly every summer for
at least the last ten years around the
upper half of Narragansett Bay. A
DEM presentation at a Narragansett
Bay Estuary Program (NBEP)
symposium in September 1998 on
nutrient removal treatment presented
evidence that several areas of
Narragansett Bay (including
Greenwich Bay) seemed to be
exhibiting low oxygen impacts like
small localized fish kills and
dominance of pollution-tolerant
bottom species. Although these
incidents draw some attention, and
regulators and scientists are
following up on them, it seems that
we have always been able to miss
having a really big kill. Except for
this year.
Chronology
Two rainstorms passed through the
area in early August. The first
5storm on August 1 dropped slightly more than an inch of rain in the vicinity of Greenwich Bay.
The second storm, the largest of the summer, dropped 3.75” of rain on the watershed on August
7-8. The influence of these two storms was seen initially as two pulses of fresh water that were
observed to enter the bay immediately following the storms, lowering salinity (saltiness) at the
surface and bottom of western Greenwich Bay. The records indicate that the fresh water was not
completely mixed with salt water until approximately a week after the end of the second storm.
The rain events were followed by phytoplankton blooms. Phytoplankton contain chlorophyll,
which is measured at DEM’s monitoring station at the mouth of Apponaug Cove. The data show
that phytoplankton levels topped out three to seven days after the rain storms. Peak values
occurred August 11-13 and were the highest seen all summer. Favorable conditions included
warm temperatures, plenty of light and abundant nutrients.
Measurements of dissolved oxygen reflect the daily cycle, then a steady drop-off after August
13, when the second bloom ended. Oxygen levels were very low at both the surface and bottom
on the western side of Narragansett Bay on the morning of August 14 (Graphs 1 and 2, next two
pages). Bottom conditions remained anoxic through August 20 (and beyond to the last readings
on August 25). Levels were apparently low near the surface (1-4 mg/l) but sufficient to sustain
animals able to reach and stay in that part of the water column. Around low tide on August 18
and 19, dissolved oxygen dropped to zero, first briefly, then staying at zero from the evening of
the 19th on.
Other researchers working in the area (A. Altieri, Brown U.; B. Sullivan and D. Gifford, URI)
began to see hypoxia building up on the western side of Greenwich Bay one to two weeks before
the fish kill. URI researchers taking measurements once a week from a dock at the mouth of
Greenwich Cove found anoxic conditions from 12’ to 20’ depth on August 14, similar to the
readings at Apponaug Cove. A Brown University researcher studying bottom organisms off
Chepiwanoxet Point over the last year observed stressed worms and an absence of crabs and fish,
as well as development of white bacterial mats while diving at the site on August 7; and dead
worms and crabs when he returned on August 19. A DEM underwater survey on August 21
corroborated the white bacterial mats and dead organisms on the bottom (fish, crabs and shrimp).
Another indicator that impacts were occurring well before August 20, and continued thereafter,
is the die-off of soft shell clams. The first report of a clam kill in Greenwich Bay came several
weeks before the fish kill. And on August 25-26, a massive die-off occurred, both within
Greenwich Bay and at points north, with millions of juvenile soft shells washing ashore.
Conditions around Narragansett Bay – August 2003
The effect of the August rain events was not limited to the side embayments of the bay. A record
available from the Narragansett Bay Commission for a continuously monitoring buoy (near
Bullocks Point Light) indicated conditions in the central Providence River. The near-surface
record showed that the response of the Providence River to the August storms was very similar
to that of Greenwich Bay. The August 7-8 storm was followed by a drop in salinity (increased
river flow) that spiked a chlorophyll bloom from the 11th -13th. The peaks of the chlorophyll
levels in the lower Providence River were simultaneous with those in Greenwich Bay, indicating
6140
120
Tide Height
100
80
60
40
20
0
32 3.0
Rainfall (inches)
30 2.5
Salinity (ppt)
28 2.0
26 1.5
1.0
24
0.5
22
0.0
28 3.0
Water Temperature
Temperature (C)
26
Rainfall (inches)
2.5
24 2.0
22
1.5
20
18 Air Temperature 1.0
16 0.5
14 0.0
150 3.0
125 Rainfall Amount 2.5
Chlorophyll (ug/L)
Rainfall (inches)
100 2.0
75 1.5
50 Micro-Algae 1.0
25 0.5
0 0.0
13 3.0
12
11
Dissolved Oxygen (mg/L)
2.5
10
9
Rainfall (inches)
2.0
8
7
1.5
6 Hypoxic events occur when oxygen
5 levels are below 3 mg/l.
4 1.0
3
2 0.5
1
0 0.0
05-Aug-03 07-Aug-03 09-Aug-03 11-Aug-03 13-Aug-03 15-Aug-03 17-Aug-03 19-Aug-03 21-Aug-03
Graph 1 Bottom Sonde at Greenwich Bay Marina (Depth Varies Between 1.9 and 3.8 meters)
7140
120
Tide Height
100
80
60
40
20
0
32 3.0
Rainfall (inches)
30 2.5
Salinity (ppt)
28 2.0
26 1.5
1.0
24
0.5
22
0.0
28 3.0
Water Temperature
Temperature (C)
26
Rainfall (inches)
2.5
24
2.0
22
1.5
20
18 Air Temperature 1.0
16 0.5
14 0.0
150 3.0
125 Rainfall Amount 2.5
Chlorophyll (ug/L)
Rainfall (inches)
100 2.0
75 1.5
Micro-Algae
50 1.0
25 0.5
0 0.0
14 3.0
13
12
Dissolved Oxygen (mg/L)
2.5
11
10
Rainfall (inches)
9 2.0
8 Hypoxic events occur when oxygen
7 levels are below 3 mg/l. 1.5
6
5 1.0
4
3
2 0.5
1
0 0.0
05-Aug-03 07-Aug-03 09-Aug-03 11-Aug-03 13-Aug-03 15-Aug-03 17-Aug-03 19-Aug-03 21-Aug-03
Graph 2 Surface Sonde at Greenwich Bay Marina (Depth at 1.1)
8that the blooms in the two areas are independent, resulting from similar environmental conditions
and nutrient inputs. Following the end of the bloom, dissolved oxygen in the Providence River
also dropped to low values (between 1 - 2.5 mg/l). Although these numbers are not as low as
those seen in Greenwich Bay, they are also not sufficient to sustain sensitive animal life for very
long.
A station (maintained by URI/GSO under the “Bay Window” federal grant) in upper
Narragansett Bay east of Warwick Point indicates that the bottom oxygen dropped to near zero
on August 18 and was lowest at the end of the record on the 20th.
A federally funded collaborative monitoring effort, the “Bay Window” has been looking at the
oxygen issue in the Bay for the last 3-4 years. This effort, which includes URI, Brown
University, the Narragansett Bay Estuary Program, DEM’s Division of Fish and Wildlife, and
the NOAA National Marine Fisheries laboratory in Narragansett, has involved continuous
monitoring at several buoys around Prudence island as well as monthly tows of an undulating
instrument to measure oxygen levels as well as other parameters. This latter survey was
conducted out on Thursday August 20, 2003, and covered most of Narragansett Bay except for
Greenwich Bay (too shallow for the instrument used). The results showed that near-bottom
severe hypoxia (< 2 mg/l) extended from Field’s Point (below the sewage treatment plant), down
the ship channel to the middle of the upper Bay, and continued into the West Passage all the way
to the Jamestown Bridge! This was the greatest extent of severe hypoxia ever recorded for
Narragansett Bay, although the dry-weather August 2002 hypoxic event documented by
volunteer monitors may have been as extensive (the volunteer evening survey can only cover
down to Quonset with small 20’ boats). Mount Hope Bay was hypoxic only in the upper half
(near Fall River down to just below the state line).
A recent volunteer monitoring survey on the eve of August 25, 2003 (7PM-2 AM) found hypoxia
(2-3 mg/l) still occurring in the Providence River and parts of the western side of the upper Bay,
as well as near Fall River, while the West Passage continued to experience more severe hypoxia
(< 2 mg/l) near the bottom, and Greenwich Bay still had a significant volume of anoxic water
(essentially no oxygen) below about 12’ depth, especially on the western side.
An underwater video camera was used on the August 25 evening survey to look at a small
number of areas in the upper Bay which had low oxygen (hypoxic levels, but not anoxic). These
areas did not appear to have mats of bacteria or dead organisms as was the case on the western
side of Greenwich bay.
Much of this evidence suggests that Greenwich Bay is not the only area experiencing the
problem, but it does seem to be particularly vulnerable to the most extreme impacts (i.e. no
oxygen).
Conditions around Narragansett Bay - Historically
Although the magnitude of the fish kill (and the clam kill) is unusual, the phenomenon is not
new. Nor is evidence of high nutrient and low oxygen levels. In fact, events of this type have
been reported in Greenwich Bay for every year since we began to collect information except for
9the year 2000. Events reported in Greenwich Bay for July 15, 1998 and July 26, 1999 resulted in
the deaths of hundreds of fish and other animals. DEM staff documented the 1999 event, finding
gray-green water extending along the entire western shore of Greenwich Bay, including Green-
wich Cove (Figure 4). Daytime dissolved oxygen levels at the surface were below 2 mg/l. No
fish kills were reported from this
event, probably because bait fish
were not present in the area. A
June 23-24, 2001 event was sim-
ilarly documented that caused the
deaths of thousands of fish and
other animals (Figure 5, next
page). The area affected by this
event was apparently restricted to
the western edge of the bay,
particularly north of Chepiwa-
noxet Point. Although 2002 was
a relatively dry year, a bloom
event that caused odors and
discolored water, but no fish kill,
was reported in Warwick Cove.
Low oxygen and fish kills have not been limited to Greenwich Bay. As mentioned above,
evidence was presented in 1998 that several areas of Narragansett Bay (including Greenwich
Bay) seemed to be exhibiting low oxygen impacts like fish kills and low oxygen-tolerant bottom
species. Subsequently, the Narragansett Bay Estuary Program began to organize and coordinate
a purely voluntary dissolved oxygen survey of the upper half of Narragansett Bay during summer
neap tides. A small federal grant award received from NOAA enabled the purchase of several
oxygen monitoring instruments, and local scientists at URI, Brown University, Roger Williams
University, EPA Narragansett Lab, the Massachusetts Bays National Estuary Program and Save
The Bay volunteered to be trained to use them, and have collaborated each summer since 1999
for 2-4 evening surveys.
Results of the volunteer evening oxygen surveys since 1999 have clearly revealed a consistent
pattern of low oxygen in the Providence River slightly past Conimicut point, Greenwich Bay
(especially the western end), as well as the western upper bay (Rocky Point side) and the upper
part of the West Passage. The East Passage has low oxygen on a much less frequent basis due to
the natural inflow of oxygenated seawater up this deeper natural channel. Mount Hope Bay has
less data available due to shortage of volunteer boats and crew, but the data so far suggest that
low oxygen tends to be mainly near the Fall River ship channel, with occasional problems at the
mouth of the Lee and Cole Rivers in Massachusetts.
V. Sources of Nutrient Loading
We understand that increased runoff from land surfaces and through groundwater convey
increased nitrogen loads to Greenwich Bay. The origins of these nutrients in the watershed are
10very difficult if not impossible to measure directly, so their pathways to the Bay are best
determined indirectly. The most comprehensive study of this issue to date was conducted by
Urish and Gomez for the Greenwich Bay Initiative (1998). They constructed a loading budget
based on land use, including the number of unsewered homes, lawn, roof and street areas, and
other sources.
The work of Urish and Gomez was extended by DEM in 2001 to allow a comparison of water-
shed loads (non-point source) with those from the East Greenwich wastewater treatment facility
(point source). This estimate included direct
measurements of nutrients from the principal
tributary streams. This comparison is our best
estimate of the relationship between treatment
plant and watershed loads during the sum-mer
season. For this estimate, the relative contribut-
ions of lawn, wastewater (i.e. ISDS), road, and
atmospheric sources were taken from Urish and
Gomez.
The pie chart (Fig 6, next page) shows that
watershed loads appear to be dominated by
ISDSs on the whole (51%). It should be kept in
mind that even adequately working septic
systems release significant amounts of nitrogen
into the groundwater, which slowly transports it
to nearby streams and even directly into the
shoreline area of Green-wich Bay. Loads from
storm water could carry nitrogen (and bacteria)
from failing systems. The wastewater treatment
facility is the second largest source (40%). Lawn
fertilizer, road run-off, and direct atmospheric
deposition account for less than 10% of the total,
suggesting those sources are not dominant factors.
There is one additional, important process that merits discussion. Tides entering and leaving
Greenwich Bay every 12.4 hours carry with them nutrients from Narragansett Bay that may
come from further north in the Bay, or from as far south as Rhode Island Sound. A water quality
model developed for Greenwich Bay by Brush in a 2002 URI dissertation indicated that nitrogen
exchanges with upper Narragansett Bay may act as the largest external nitrogen source to
Greenwich Bay.
This has been a serious concern for several researchers, who have pointed out that the beneficial
effects of source reductions within the Greenwich Bay watershed may not be fully realized
without changes to the nitrogen loads to the Providence River. DEM agrees this is a legitimate
concern, and believes it underscores the necessity of controlling nitrogen loads bay-wide.
Concerns with local sources of nutrients should not become an excuse to ignore larger, bay-wide
11Figure 6 Watershed Nitrogen Sources to Greenwich Bay
Roof and Road Runoff
1.6%
East Greenwich
Wastewater from
Wastewater Treatment
Septic Systems (ISDS)
Facility
51%
(Treated Effluent)
40%
Lawn
Fertilizers
Atmospheric 7%
Deposition
0.4%
12issues. Nor should further study and debate of those larger issues delay the implementation of
common sense measures that can reduce loading from local sources.
Point and Nonpoint Pollution Sources
In August 2002, despite a severe drought (opposite of this summer), low oxygen levels covered
almost half of the Bay, including the Providence River, the East Passage, Upper Bay, and West
Passage (Figure 7, map below). Unfortunately, Greenwich Bay was not covered due to an
inadequate number of boats. However, other researchers working in the area at the time
corroborate that a severe low oxygen event was occurring there also.
Figure 7 Dry weather hypoxia in Narragansett Bay , August 6, 2002 . (From Deacutis et al, 2003)
This finding is a key issue in the debate over point versus nonpoint sources. This recent event
seems driven by rainfall-related nonpoint nutrient loadings. However, in August 2002, the
severe hypoxia was clearly not due to rainfall, but to “baseline” conditions driven by nutrients
from the point sources (sewage treatment plants) and what groundwater was entering the Bay
(river flow was very low). These two contrasting years clearly indicate that we need to deal
with nutrients from all the major sources, point and non-point.
An analysis of the 2001-02 data by the Narragansett Bay Estuary Program and Brown University
scientists showed that high runoff, low salinity surface water was not required to get very low
oxygen values, only a low energy situation (i.e. very weak neap tide and low winds). Nutrients
are the problem source, algae provide the organic “fuel” to the bacteria, and the weak neap tides
maintain the layering (stratification) necessary to decrease oxygen in the lower water layers.
13This is why weak neap tides are the periods of maximum risk for the Bay. The late Dr. Dana
Kester of URI predicted that August 2003 would be a high-risk period for parts of Narragansett
Bay based on tidal current projections.
VI. Impacts
The obvious symptoms of the fish kill will likely disappear very rapidly, in a matter of days to
weeks. Dead fish will be scavenged and buried. The stench of their decay will dissipate.
Stronger tides and cooler weather with stronger wind will eventually mix water masses and raise
oxygen levels.
A fish kill resulting from hypoxia or anoxia conditions is an acute symptom of nutrient pollution
or over-enrichment. Anoxic conditions (dissolved oxygen concentrations below 0.5 mg/l), such
as occurred over large areas of Greenwich Bay, will produce lethality of 75-90% in fish species
that are not able to leave the area. Based on what we know of the kill, it appears that fish losses
occurred mainly in the western side of Greenwich Bay, especially the Apponaug/Greenwich Bay
Marina area. There are no reports or indications of fish losses in the Providence River or
elsewhere in the Bay so far, suggesting that most fish were able to escape the poor quality but
less lethal bottom conditions elsewhere. Greenwich Bay, due to its geographic orientation in
relation to prevailing winds (which “protects” it from the mixing energy of most wind directions)
and the poor flushing rate of the western side, may make it more prone to hypoxic events and
fish kills.
In addition to the apparent mortality, a severe hypoxic/anoxic event can cause significant and
long-lasting, ecological changes, particularly to bottom communities, which are more difficult to
evaluate. Menhaden stocks are not likely to be significantly affected since they are large and
migratory. Shellfish are able to survive short periods of anoxia but particularly the young are
likely to succumb. The massive die-off of juvenile soft shell clams reflects this. Soft shell clams
naturally experience wide swings in populations, so it will be difficult to accurately estimate the
impact on that population, but it is likely to be significant after the second kill. the soft shell
clam is not as heavily exploited commercially as the hard shell clam (quahog), there is a
significant recreational fishery in Greenwich Bay. Adult quahogs are very resistant to low
oxygen (they literally “clam up” and lower their metabolism to survive) and most likely will
survive, but will not grow or reproduce during this stressful period. The newest sets of quahogs,
however, may have been affected, as they are more vulnerable to low oxygen (cannot “hold their
breath” as well). If anoxic conditions were to persist for months, impacts may extend to adult
quahog population. Although it is too early to tell, impacts on the quahog fishery cannot be
ruled out.
Complete recovery of a system that has suffered severe anoxia may take over five years and the
“mature” community that develops after recovery may not resemble the original community. If
the quahog adults are not killed, that resource may come back more rapidly, but the more
sensitive non-commercial bottom species may not. Based on the volunteer evening oxygen
surveys, the western area of Greenwich Bay has likely experienced these types of conditions
before, so the bottom communities there are probably of the more opportunistic, pollution-
tolerant type and will rapidly re-colonize the area once the cooler weather sets in.
14Chronic effects are less obvious but much more important. Over-enrichment leads to frequent
low oxygen conditions during summer months, changing ecological structure and function. The
most sensitive species die off first (crabs, shrimp, lobster, followed by starfish, sea urchins, and
sensitive marine worms). For Narragansett Bay species, lethality for sensitive species generally
begins at dissolved oxygen levels below 3 mg/l. Growth of many species, particularly in larval
form or juveniles, is reduced at levels less than 5 mg/l. Recruitment is diminished and diversity
lowered by hypoxic conditions. Resistance to disease and other stresses is reduced. Bottom
(demersal) species like flat fish typically decline while pelagic or water column species may
increase.1 Bottom habitat quality is reduced,2 pollution tolerant benthic organisms predominate,3
and microbial activity increases along with oxygen demand by the sediment, causing such areas
to more rapidly deplete oxygen next time conditions are “ripe.”4
VII. Recommendations
Rhode Island has many programs in place that focus in part or entirely on the health of
Narragansett Bay, including ways to reduce pollutant loading. These programs use both
regulatory and non-regulatory approaches for purposes like protecting the fisheries of
Narragansett Bay, establishing and assuring compliance with water quality standards, water
quality monitoring, biological monitoring, complaint and incident investigation, development
and implementation of water quality and habitat restoration plans and watershed action plans.
Within DEM, programs include wetlands and ISDS permitting, the non-point source pollution
abatement (section 319) program, point source and storm water permitting (RIPDES), the
Narragansett Bay Estuary Program, which is part of the National Estuary Program, the No
Discharge (of wastewater by vessels into state waters) program, and beach monitoring (with the
Department of Health). The Coastal Resources Management Council plays a critical role
through its wetlands and coastal permitting program, its policies affecting coastal development
(for example, requiring buffer zones) and its Special Area Management Planning (SAMP)
program (through which denitrification systems have been required for on-site wastewater
treatment, and which is currently developing a Plan for Greenwich Bay). Besides state agencies,
1
DEM Division of Fish and Wildlife trawl survey data has shown such a shift in Narragansett Bay.
2
Along with fish kills and low oxygen, loss of eelgrass (due to loss of water clarity) and replacement of sensitive
bottom species with low-oxygen tolerant species have been noted nationally when estuaries like Long Island Sound
and Chesapeake Bay are impacted by excess nutrients. Eelgrass provides a refuge, breeding ground and nursery for
coastal fish, crustaceans, and shellfish (particularly scallops). Narragansett Bay is known to have had more
extensive eelgrass beds in many areas of the upper half of the Bay, including Greenwich Bay, the Palmer River, off
Quonset, and even the lower Providence River. All disappeared by the late 40’s, early 1950’s, and have not
returned. Scallops, which are often associated with eelgrass also disappeared. The only viable eelgrass beds today
begin at the lower end of Prudence Island due to the impacts of nutrient (especially nitrogen) loading into the upper
Bay. Restoration efforts in over-enriched areas of the upper Bay and Greenwich Bay have failed.
3
Work done in 1978 and more recently in 2001-02 by the EPA Narragansett Lab and a consultant firm (SAIC)
indicates that the species of bottom organisms living in parts of the upper Bay above Jamestown seem to be more of
the low-oxygen tolerant variety than in areas from Jamestown and south towards the mouth of the Bay (where low
oxygen would be much less likely).
4
Nutrient over-enrichment has other harmful effects in addition to reducing oxygen levels and the associated
impacts. Algal species composition can be altered, favoring less desirable dinoflagelates and, in some cases,
harmful species. Water clarity is severely reduced by algal blooms. Macroalgae growth is favored and can
outcompete other more desirable habitat. The stench of dead and decaying macroalgae has been a frequent
complaint in the Greenwich Bay and other upper Bay areas in recent years.
15coastal communities, watershed and other environmental organizations, and many academic
programs are actively involved in tracking and trying to improve conditions in the Bay.
Collectively, these efforts have allowed us to make significant progress in improving water
quality. To a lesser degree, progress is also being made in habitat restoration. Such progress can
lead to complacency. Although we often point to the shortcomings of our efforts, and caution
that significant ecological and economic impacts are still possible, we may have gotten used to
thinking that we are on the right track and close to attaining adequate and sustainable levels of
water quality. We are aware of mishaps like sewer overflows and spills, and of events like algae
blooms and minor fish kills, but perhaps no longer alarmed by them.
What an event like this massive die-off illustrates is that our successes are not good enough.
Pollutants are still being loaded into the Bay on a regular basis. Even the loading that occurs
during periods of dry weather appears to be setting us up for disaster when weather or other
conditions change. That suggests that we should raise the bar for our pollution reduction efforts
and try to protect water quality, not just under optimal conditions, but under unusual conditions
that can suddenly cause an intensification and escalation of environmental impacts. This
reevaluation and adjustment is needed throughout our programs and throughout the Narragansett
Bay watershed (including Massachusetts).
In this context, we make the following recommendations:
1. Conduct a public workshop on the fish kill within one month
As noted, this report is by definition preliminary. Additional information will be collected that
may raise or clarify additional issues or suggest additional responses. Although this report relies
on input from various quarters, it is important to give a broader range of experts and interested
parties an opportunity to comment. This is also a critical element of building support for the
additional recommendations below.
The workshop can serve as an opportunity to debrief experts and interested parties on the fish
kill, and to discuss appropriate follow-up strategies with a particular focus on Greenwich Bay.
Given that the report and this workshop will be very relevant to the work done on a Special Area
Management Plan for Greenwich Bay by CRMC and the Coastal Resources Center, we
recommend the workshop be held in the context of that effort, and conducted by CRMC and
DEM jointly. We further recommend the Coastal Institute as a key participant or co-sponsor, for
reasons explained in recommendations 6 and 7 below. Scheduling the workshop within a month
should allow for additional data to be considered, as well as assist in implementing the last two
items in recommendation 6.
2. Consider new bond funding to revitalize assistance programs
As noted several times in this report, the availability of technical as well as financial assistance is
critical to the implementation of many of the state’s programs, in particular those that rely on
partnerships with cities and towns, watershed organizations, etc. Previously, programs like
Aquafund were available for this purpose and served as a catalyst for many successful water
16quality improvement projects, especially at the local level. Another important aspect was that
limited amounts of state funding could leverage significant contributions from other sources.
Bond funding for these programs has essentially dried up. A new bond issue is needed. A
proposal is attached as Appendix 1.
3. Accelerate nutrient upgrades at sewage treatment facilities
Recognizing that nitrogen is considered the key nutrient providing the “fuel” for excessive algae
blooms and low oxygen conditions in marine waters, we should step up our control of known
sources of nitrogen loading. Further upgrades for denitrification need to be made to our
wastewater treatment facilities to reduce the significant amount of nitrogen that is now
discharged directly to Narragansett Bay or to its tributaries. These retrofits are expensive but
necessary. DEM has identified 11 facilities that should construct such upgrades (and three more
in Massachusetts). In one case (Woonsocket), construction is complete. In three (Bucklin Point,
Warwick and West Warwick), construction is underway. Four communities (Cranston, East
Greenwich, Burrillville and Smithfield) are in the planning and design phase. At Fields Point,
there is agreement that nutrient reductions are necessary, but disagreement about how much.
East Providence and Warren have not yet been approached.5
DEM and the communities or districts should evaluate schedules that have been negotiated to
date to see if any acceleration is possible (especially at the East Greenwich plant). At Fields
Point, the largest point source of nutrient loading, the Narragansett Bay Commission should
agree to the 5 mg/l limit DEM has proposed. East Providence and Warren must adopt their
schedules as soon as possible. And pending construction of permanent upgrades, relatively
simple, interim measures that were pioneered by Warwick should be implemented at all
facilities.
4. Improve septic system management
More properties currently using septic systems need to utilize systems that remove nitrogen. In
the case of Greenwich Bay, Warwick is doing a good job providing new sewers and assistance to
homeowners who want to take advantage of them. However, the rate of participation is currently
50% and needs to increase. Warwick and other communities with similar problems need to
consider making tie-ins mandatory. More cities and towns need to take or share responsibility
for septic system management, and take advantage of tools like management districts. At the
state level, legislation or regulations should be adopted to finally phase out cesspools, which
provide no treatment. Programs that used to provide technical and financial assistance need to be
revitalized and, if necessary, provided with more capital (for example to increase the capacity of
the State Revolving Fund). Experience tells us that cost-sharing is the way to go, that financial
incentives are necessary to get cooperation and participation, and that such assistance needs to be
a mix of grants and loans.
5
Appendix 2 provides additional background information on nitrogen removal at wastewater treatment facilities.
175. Improve storm water management
New DEM regulations, mandated by the federal EPA, require cities and towns to develop
stormwater management plans. DEM made grants available for this purpose and also expects to
issue a general permit in the near future that will provide additional guidance. Although cities
and towns are developing these plans, many have major concerns about how they can implement
them. Once again, cost sharing is becoming an issue. DEM is working with the congressional
delegation to ensure 319 nonpoint source pollution funds can be used for this purpose. Cities
and towns should take advantage of legislation allowing them to establish stormwater
management districts and, through them, raise revenue. Some have questioned whether DEM’s
draft general permit requires more than the absolute minimum that EPA is looking for. The fish
kill provides a clear example of why we cannot afford to go “light.”
6. Improve monitoring and assessment
The event in Greenwich Bay was preceded over a period of several weeks by smaller events
prior to the fish kill. Dead juvenile softshell clams had been washing up in significant numbers
over that period on beaches on the west side of the Bay. Without a more comprehensive and
consistent environmental monitoring program to measure things like dissolved oxygen and
nutrients, we were unable initially to establish a link to low oxygen and determine that a serious
problem of unusual proportions was building. We also did not have the ability to assess what
was causing the softshell clam kill (lack of oxygen or other environmental conditions such as
low salinity). Although DEM has arrangements with academic and volunteer programs to help
with monitoring and assessment, and should try to expand such arrangements, it lacks adequate
staff in its Marine Fisheries and Water Quality programs just to participate in and coordinate
these efforts.
Rhode Island has been engaged in an effort, with EPA, to create a statewide monitoring plan,
covering both fresh and salt water, and targeting both chemical and biological components. The
State currently invests less than $100,000 in ecological monitoring and, as a result, has rather
meager monitoring data, much of it drawn from volunteer efforts which are subject to the
vagaries of inconsistent funding streams and may or may not have the ability to provide data
over the long term. We lack baseline data for many locations and parameters, as well as trend
data (as opposed to snapshots). The statewide monitoring plan should identify gaps in our data
(including economic data) and address inefficiencies as well as adequacy of resources among a
broad range of data collection activities.
Besides better data collection, data management needs to be improved. Rhode Island should
once and for all commit to better coordination and quality control of the collection, storage, use,
exchange and accessibility of data related to Narragansett Bay. The Coastal Institute at URI and
its Environmental Data Center are logical candidates to be tasked with this challenge, especially
within the context of Bay planning.
Specific assessment issues that scientists believe are part of the Greenwich Bay nutrients
problem but have not been adequately addressed include:
18• Is groundwater flow contributing significant levels of nutrients into the bay?
• Does Greenwich Bay's circulation pattern and flushing rate in the coves contribute to
the creation of low-oxygen zones, particularly along the bay's western shore? Has
this circulation changed recently due to shoreline changes?
• Are lawn fertilizers contributing significantly to nutrient loads in storm water runoff
to the Bay, or are septic systems (including adequately working systems) a much
bigger factor?
• Where are the most serious "hot spots" for pollution inputs?
• What is the percent usage of the pumpouts by areas of high density of large (less than
25’) boats?
• What is the compliance rate with the no discharge into marine waters rule?
• Are gray water / septic systems at near-shore and shore-side restaurants contributing
nutrients?
• Are significant amounts of nutrients being transported into Greenwich Bay from the
upper Bay?
• Do unsewered areas correspond with levels of nutrient inputs?
• If nutrient inputs from groundwater are significant, how long will it take polluted
groundwater to clean up if we take appropriate action today?
Specific recommendations regarding monitoring and assessment relevant to the fish kill include:
• Repeat the shellfish survey and beach seine survey conducted just before the fish kill
in Greenwich Bay as soon as possible; also survey a reference site nearby but outside
Greenwich Bay. (DEM’s Division of Fish and Wildlife began planning this today.)
• Adopt standard quantitative field methods to assess losses of fish and bottom
(benthic) organisms lost in these types of kill incidents to ensure good estimates.
Procedures for documenting and investigating fish kills are well established and can
be adopted for RI needs.
• Develop a Bay-wide comprehensive monitoring plan, based on work and information
from the recent “Ecological Indicators” workshop. Integrate monitoring such as the
fisheries trawls and beach seines with water quality monitoring to ensure a better
understanding of habitat quality. Work with the state’s Congressional delegation to
restore funding for the “Bay Window” collaborative monitoring effort (ending this
fall due to depletion of available federal funds). Provide for long term operation and
maintenance of the continuous monitoring buoy system.
• Acquire a small (“Acrobat”) undulating platform mounted with a fast-response
SeaBird oxygen-CTD sensor (the fastest available is critical) and integrated GPS to
allow for rapid mapping of hypoxic zones from a small (19-22’) boat during fish kills
and for baseline work.
• Acquire a towable sled-mounted submersible video camera with integrated GPS and
(DC) VCR –TV and marine electronic cable, and develop a statistically valid transect
design for the Bay to literally “see” and map the condition of the benthic community.
This could possibly be done in conjunction with the EPA AED lab in Narragansett,
which has already offered to help with efforts in response to the kill.
• Communicate the need for better monitoring and response capacity, as well as
nutrient removal capabilities to and through the congressional delegation. Other
19coastal states, including New York, Connecticut, New Hampshire and states
bordering on Chesapeake Bay have received significant federal funds in this regard.
As an estuary designated by Congress as of national significance, Narragansett Bay
needs the same level of support.
• Work with stakeholders to develop a monitoring and modeling program to assess the
impact of new nutrient controls at sewage treatment facilities and whether additional
modifications are necessary. Coordinate and direct federal, state and university
resources toward development of a single water quality model for the Bay.
• Institutionalize through Memoranda of Understanding collaboration with the Coastal
Institute and Sea Grant program at URI towards the establishment of a “consortium”
that can bring in local, regional and national expertise when needed to assess and
respond to challenges we face in Narragansett Bay. Create a network of experts in
areas including but not limited to chemistry, biology, ecology, resource economics,
engineering and law.
• Invite the Coastal Institute to take the lead on development of a rapid assessment
program that can quickly mobilize relatively small teams of scientific experts to
assess and respond to a variety of circumstances and incidents affecting the health of
Narragansett Bay. This program should be led by a marine ecologist or fisheries
biologist with adequate training in this area, and include data collection and
management protocols. The program should be coordinated with efforts to develop
baseline data for the Bay, and with emergency response programs such as the one
developed by DEM for oil spills.6 Given that many of the pieces are already in place,
it should be possible to have a formal structure and interagency agreement in place by
the end of October, which would accommodate some review and comment by
interested parties.
With respect to beach closings:
• Develop a separate assessment and response protocol to investigate problems leading
to beach. Although there is overlap between these issues and occurrences like the
fish kill, they are fundamentally different in nature, involve very different assessment
and response techniques, and require different expertise and skills in the person who
leads the effort. Beach closings are human health issues, and do not typically impact
or otherwise involve Bay ecology. Combining the efforts could lead to serious
dilution of capacity and to confusion. A similar but separate assessment and response
program can be developed to focus in particular on issues like local storm water
drainage, sources of contamination within the watershed, evaluation of unsewered
areas and septic system failure rates, techniques to better characterize pollution and
pinpoint its sources (for example, DNA/RNA analyses, dye studies and compliance
inspections). This program should obviously be linked to the program described
above, as well as the larger planning and data management effort described below.
6
DEM is already collaborating with the Coastal Institute in the area of emergency response. The (interagency) RI
Oil Spill Science Team recently completed a GIS and Mapping Plan to support scientific response activities,
including natural resource damage assessment. The plan details everything from organizational structure and chain
of command to people and equipment that have been committed to specific assessment and response tasks. It will
be relatively easy to build on this model and apply it to situations like a fish kill.
20Our recommendation is that R.I. Department of Health be the lead agency, working
closely with EPA (e.g., its Flagship Beaches program) and DEM, and with URI and
other institutions. A formal structure and agreement should be completed in the same
timeframe, i.e. by the end of October.
7. Improve Bay Planning
The problem of nutrient over-enrichment in Narragansett Bay is only one of a number of major
issues facing us that will require the cooperation of many in Rhode Island and in Massachusetts
(which contains 60% of the watershed). This cooperation should be in the context of an overall
plan and process to protect and restore Narragansett Bay and its watershed, both now and in the
future. This plan should set clear goals supported by the public, measure results, and hold
agencies and local governments accountable. The process should also produce a formal
agreement between Rhode Island and Massachusetts that clearly communicates what must be
done to ensure a more healthy future for Narragansett Bay. Our recommendation is that the
Coastal Institute serve as a neutral venue for this process, and that a Narragansett Bay Science
Advisory Committee be created to provide technical guidance.
What is needed is an initiative would bring together different organizations that are working
toward the same ends but have not had the advantage of an institutional structure under which to
work together with a sufficient level of administrative and technical support. If designed
properly, it would clarify roles, responsibilities and commitments. It would also provide a
collective charge to overcome bureaucratic barriers as well as to remove the artificial wall that
often separates agencies, organizations and the public in working together to build collaborative
solutions for our most critical Bay problems. It could give us the ability to avoid a repetition of
the devastating ecological event that we saw in Greenwich Bay this past August.
21APPENDIX 1 – BOND PROPOSAL
22Form 2: Project Information
Department/Agency:
Department of Environmental Management
Project Name: Project Identifier:
Clean Water 2004
Priority Ranking: Year First Shown in Agency CIP:
2004
Project Start Date: July 2005 Project End Date: June 2010
Is Project in Approved CIP? Geographic Location: Statewide
Description:
The Department of Environmental Management is proposing $15 million in new authority to
provide matching grants to state and local agencies, nonprofit organizations and for-profit
businesses to abate sources of pollution causing beach closures, fish kills and other problems
identified in water quality restoration plans (WQRPs) including federally mandated Total
Maximum Daily Load (TMDL) plans.
The Clean Water 2004 funds will be targeted to implement WQRPs scheduled for completion by
2007. To date, WQRPs for fifteen waterbodies have been completed by DEM and approved by
US Environmental Protection Agency. WQRPs for an additional 41 waterbodies are scheduled
for completion by the end of 2007 (see attached 2002 303(d) list). Each plan identifies the
watershed specific actions needed to abate both point and nonpoint sources of pollution causing
the identified water quality impairments.
The proposed bond issue will address a critical water quality need in Rhode Island. In November
2000, voters approved the Clean Water 2000 Bond adding $60 million to buy down the State
Revolving Fund (SRF) interest rate. These loan funds are available for a range of key projects
including combined sewer overflows, wastewater treatment plan upgrades and local sewer
projects. Despite the positive aspects of the SRF Program, it does not address several significant
areas of need identified by the federally mandated water quality restoration planning effort:
• Local nonpoint source pollution abatement projects: It's generally not feasible to use
SRF funds to finance nonpoint source projects, even at zero percent interest. This is
due to the need to provide collateral for the loan and the lack of a dedicated local
revenue stream for nonpoint projects such as storm water treatment. Projected costs to
abate nonpoint pollution far outweigh the federal funds available. For critical
nonpoint source pollution abatement projects, the state needs to provide a financial
incentive to leverage local corrective actions.
23You can also read