Non-target and suspect characterisation of organic contaminants in Arctic air - Part 2: Application of a new tool for identification and ...
←
→
Page content transcription
If your browser does not render page correctly, please read the page content below
Atmos. Chem. Phys., 20, 9031–9049, 2020
https://doi.org/10.5194/acp-20-9031-2020
© Author(s) 2020. This work is distributed under
the Creative Commons Attribution 4.0 License.
Non-target and suspect characterisation of organic contaminants in
Arctic air – Part 2: Application of a new tool for identification and
prioritisation of chemicals of emerging Arctic concern in air
Laura Röhler1,2 , Martin Schlabach2 , Peter Haglund3 , Knut Breivik4,5 , Roland Kallenborn1 , and
Pernilla Bohlin-Nizzetto2
1 Facultyof Chemistry, Biotechnology and Food Sciences (KBM), Norwegian University of Life Sciences, Ås, Norway
2 Department of Environmental Chemistry, NILU – Norwegian Institute for Air Research, Kjeller, Norway
3 Department of Chemistry, University of Umeå, Umeå, Sweden
4 Department of Atmosphere and Climate, NILU – Norwegian Institute for Air Research, Kjeller, Norway
5 Department of Chemistry, University of Oslo, Oslo, Norway
Correspondence: Laura Röhler (laura.rohler@nmbu.no)
Received: 8 February 2020 – Discussion started: 13 February 2020
Revised: 11 May 2020 – Accepted: 26 May 2020 – Published: 29 July 2020
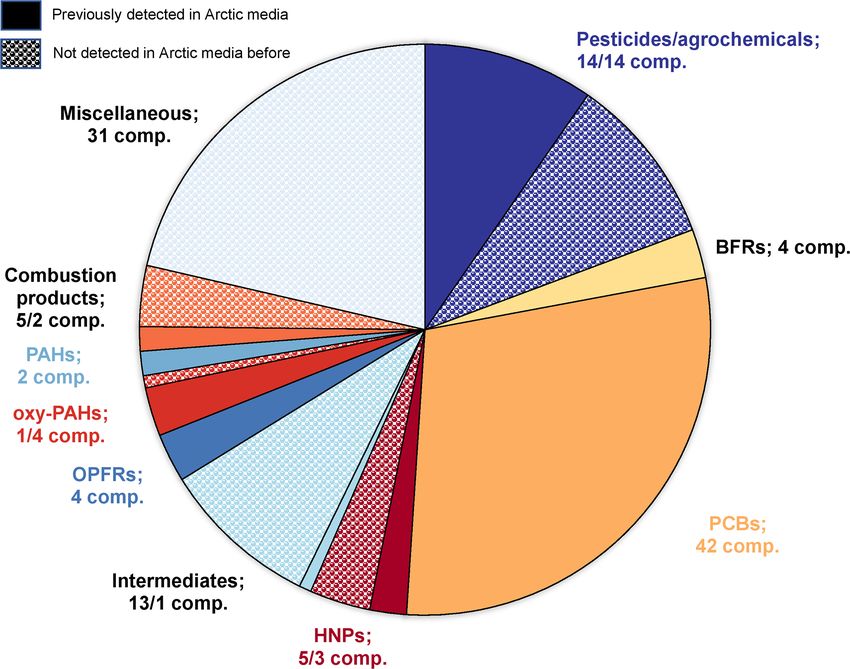
Abstract. The Norwegian Arctic possesses a unique environ- ported here, simultaneous non-target and suspect screening
ment for the detection of new potential chemicals of emerg- were applied. The detection of over 700 compounds of inter-
ing Arctic concern (CEACs) due to remoteness, sparse pop- est in the particle phase and over 1200 compounds in the
ulation and the low number of local contamination sources. gaseous phase is reported. Of those, 62 compounds were
Hence, a contaminant present in Arctic air is still considered confirmed with reference standards and 90 compounds with
a priority indication for its environmental stability and en- a probable structure (based upon mass spectrometric inter-
vironmental mobility. Today, legacy persistent organic pol- pretation and library spectrum comparison). These included
lutants (POPs) and related conventional environmental pol- compounds already detected in Arctic matrices and com-
lutants are already well-studied because of their identifica- pounds not detected previously (see also Fig. 1). In addi-
tion as Arctic pollutants in the 1980s. Many of them are tion, 241 compounds were assigned a tentative structure or
implemented and reported in various national and interna- compound class. Hitherto unknown halogenated compounds,
tional monitoring activities including the Arctic Monitoring which are not listed in the mass spectral libraries used, were
and Assessment Programme (AMAP). These standard mon- also detected and partly identified.
itoring schemes, however, are based on compound-specific
quantitative analytical methods. Under such conditions, the
possibility for the identification of hitherto unidentified con-
taminants is limited and random at best. Today, new and ad- 1 Introduction
vanced technological developments allow a broader, unspe-
cific analytical approach as either targeted multicomponent A high number of organic chemicals is used today in large
analysis or suspect and non-target screening strategies. In or- quantities. By 2019, the Chemical Abstracts Service (CAS)
der to facilitate such a wide range of compounds, a wide- registrySM contained more than 156 million unique inorganic
scope sample clean-up method for high-volume air sam- and organic chemicals. This is 50 % more than in 2015,
ples based on a combination of adsorbents was applied, fol- when CAS was celebrating 100 million registered com-
lowed by comprehensive two-dimensional gas chromatogra- pounds (Wang, 2015). For the effective regional control of
phy separation and low-resolution time-of-flight mass spec- chemicals in commerce, the REACH register was introduced
trometric detection (GC × GC-LRMS). During the study re- in the EU region (EC regulation no. 1907/2006 of the Euro-
pean Parliament and of the Council concerning the registra-
Published by Copernicus Publications on behalf of the European Geosciences Union.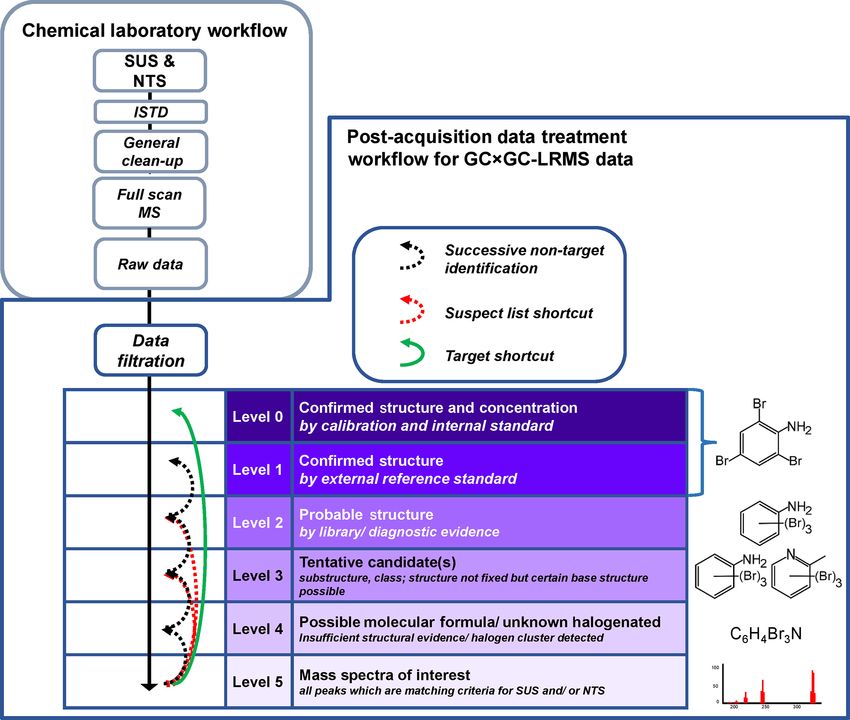
9032                       L. Röhler et al.: Non-target and suspect characterisation of organic contaminants in Arctic air

Figure 1. Graphical abstract, summary of compounds confirmed with reference standards and compounds with tentative structure.

tion, evaluation, authorisation and restriction of chemicals)        Stockholm Convention on POPs and the Aarhus protocol on
managed by the European Chemicals Agency (European                   POPs under the Convention on Long-range Transboundary
Parliament, 2018). REACH has only classified about 2000              Air Pollution (CLRTAP) (UNEP, 2009b; UNECE, 1998). In
substances (about 40 % of chemicals registered with a pro-           order to evaluate the effectiveness of these agreements aim-
duction volume above 100 t yr−1 ) into classes of high con-          ing at reducing human and environmental exposure to POPs
cern. Such chemicals were identified as carcinogenic, muta-          (Fiedler et al., 2019), air monitoring strategies for legacy
genic, toxic for reproduction (CMRs), persistent, bioaccumu-         POPs have been established on national, regional and global
lative and toxic (PBT), very persistent and very bioaccumu-          levels. Examples are the European Monitoring and Evalua-
lative (vPvB), and/or endocrine disruptors (EDCs) (data sta-         tion Programme (EMEP, 2019) for the Aarhus protocol on
tus May 2018; ECHA, 2019a). The assessment of chemicals              POPs (UNECE, 1998), the Global Monitoring Plan (GMP)
with lower production volumes will follow. A considerable            for the Stockholm Convention (UNEP, 2009a), and the Arc-
amount of organic chemicals is released into the environ-            tic Monitoring and Assessment Programme AMAP (2019)
ment by various pathways including insufficient waste man-           for the Arctic. Within these, the air monitoring of POPs in
agement, direct application (e.g. agriculture, structure treat-      remote areas including the polar regions is used to study the
ment), unintended by-products from large-scale production            long-range atmospheric transport of POPs to remote areas,
lines, and primary emission and/or releases from products            and such knowledge is considered vital for the understand-
and applications. Some of these organic chemicals are persis-        ing of the environmental behaviour of POPs and further in-
tent and can migrate over long distances, ultimately reaching        ternational POP regulation. Recently, chemicals of emerg-
remote areas, such as the Arctic (Lebedev et al., 2018; Mac-         ing Arctic concern (CEACs) (AMAP, 2017), including new
donald et al., 2000, 2005; Genualdi et al., 2011; Barrie et          flame retardants, plasticisers, per- and polyfluoroalkyl sub-
al., 1992). An important pathway for the long-range trans-           stances (PFAS), pharmaceuticals and personal care products
port of persistent organic chemicals is via the atmosphere           (PPCPs), current-use pesticides (CUPs), and others, have re-
(Xiao et al., 2012; Genualdi et al., 2011; Hung et al., 2010;        ceived increased attention within AMAP. Selected CEACs
MacLeod et al., 2005; Koziol and Pudykiewicz, 2001; Barrie           have already been included in some of the national and re-
et al., 1992). Environmental persistence and long-range at-          gional air monitoring programmes in the Arctic (AMAP,
mospheric transport potential (LRATP) (Zhang et al., 2010;           2009, 2017). Measurements of CEACs in the Arctic provide
Czub et al., 2008) are two hazard criteria which charac-             authorities with crucial knowledge supporting adequate pol-
terise persistent organic pollutants (POPs). POPs are consid-        icy measures and, if necessary, national or international regu-
ered to be priority pollutants, and their use and production         lations coming into place. In addition, it is important to iden-
is regulated through international agreements, such as the           tify new CEACs in the Arctic at an early stage. While this

Atmos. Chem. Phys., 20, 9031–9049, 2020                                                https://doi.org/10.5194/acp-20-9031-2020
L. Röhler et al.: Non-target and suspect characterisation of organic contaminants in Arctic air                             9033

is often accomplished using biotic matrices, there is also a        (11 cm in diameter, 5 cm in height) using high-volume air
need for measurements in abiotic matrices like air as not all       samplers (average 25 m3 h−1 ). The sampling time was 4–5 d,
CEACs bioaccumulate but are still persistent and transported        resulting in sample volumes of 2700 and 3500 m3 . Details
over long distances. Non-target and suspect screening (NTS          on the sampling methodology can be found in Kallenborn et
and SUS) approaches represent promising strategies for the          al. (2013).
identification of so-far unidentified CEACs. However, stan-            Before extraction, the PUFs from the two air samples were
dard sampling and analytical methods used for the targeted          combined in one Soxhlet extractor and spiked with inter-
monitoring of POPs in air are not necessarily suitable for          nal standards (ISTDs; details in Table S1 in the Supple-
non-target analyses, and methodological challenges remain           ment). The same was done for GFFs from the two air sam-
to be solved. For example, some CEACs may have similar              ples. PUFs and GFFs were Soxhlet-extracted separately for
properties to legacy POPs, while others might be less sta-          8 h in acetone /n-hexane (1 : 1 v/v). This resulted in one
ble under certain conditions, such as being acid labile (e.g.       pooled PUF extract and one pooled GFF extract. The indi-
some flame retardants, cyclic methyl siloxanes and some             vidual extracts were reduced to 0.5 mL with a Zymark Turbo-
legacy POPs like dieldrin and related compounds) (Röh-              Vap and solvent-exchanged to isooctane. For clean-up, three-
ler et al., 2020). It is therefore important to develop non-        layer liquid chromatography columns were used, with the
destructive sample clean-up procedures, e.g. without sulfu-         bottom layer consisting of a mixture of Z-Sep+ and DSC-18,
ric acid, to preserve an expanded range of compounds for            the middle layer of Florisil, and the top layer of sodium sul-
SUS and NTS strategies in atmospheric samples. As a nat-            fate. Samples were applied in isooctane and eluted with ace-
ural consequence of a wide-scope sample clean-up method,            tonitrile (ACN) / 0.5 % citric acid (w/w). Details about the
the resulting analytical extracts contain a larger load of inter-   sample clean-up can be found in the Supplement and Röhler
fering background matrix. It is therefore essential to increase     et al. (2020).
the separation power of the instrumental analysis. This could
be achieved by high-resolution chromatographic separation           2.2   GC × GC-LRMS analysis
and/or high-resolution mass separation, i.e. high-resolution
mass spectrometry (HRMS) methods.
                                                                    The samples were analysed using a LECO Pegasus® 4D
   In this study, a new non-destructive, wide-scope sam-
                                                                    (St. Joseph, MI, USA) GC × GC-LRMS system operating in
ple clean-up procedure and a powerful instrumental analy-
                                                                    EI mode. The GC was equipped with a Restek (Bellefonte,
sis method were applied to high-volume air samples from
                                                                    PA, USA) Siltek guard column (4 m, 0.25 mm), an SGE (Tra-
an Arctic background monitoring station, aiming at iden-
                                                                    jan Scientific and Medical, Ringwood, VIC, Australia) BPX-
tifying regulated POPs, known CEACs, and emerging or
                                                                    50 (25 m, 0.25 mm, 0.25 µm) first-dimension column, and an
new CEACs. The final separation and detection method
                                                                    Agilent J&W (Folsom, CA, USA) VF-1ms (1.5 m, 0.15 mm,
was comprehensive two-dimensional gas chromatography
                                                                    0.15 µm) second-dimension column. Helium (5.0 quality;
(GC × GC), which offers enhanced peak capacity com-
                                                                    Nippon Gases Norge AS, Oslo, Norway) was used as a car-
pared to conventional GC and a better separation of ma-
                                                                    rier gas with a constant flow of 1 mL min−1 . A total of 3 µL
trix residues from analytes, and low-resolution time-of-flight
                                                                    of each extract was injected into a PTV (programmed tem-
mass spectrometry (LRMS) (Röhler et al., 2020). New poten-
                                                                    perature vaporiser) inlet operating in solvent vent mode. For
tial CEACs were evaluated by comparing them to the PBT
                                                                    the identification of unknown halogenated compounds (see
classification of the Stockholm Convention (UNEP, 2009b)
                                                                    Sect. 3.7), the samples were also analysed using a LECO GC-
with a focus on long-range atmospheric transport potential
                                                                    HRT GC × GC-HRMS instrument operating under the same
(LRATP).
                                                                    conditions described above for the GC × GC-LRMS analy-
                                                                    ses. Details on chromatographic conditions can be found in
                                                                    the Supplement.
2     Experimental section

2.1    Air sampling and sample clean-up                             2.3   Quality control

Two air samples were collected at the Zeppelin Observa-             Laboratory blanks, consisting of unexposed PUFs and GFFs,
tory on Svalbard (78◦ 550 N, 11◦ 530 E; 474 m a.s.l.) in De-        were extracted, cleaned and analysed according to the same
cember 2015. Zeppelin is a Norwegian background station             sample preparation scheme as the exposed samples. The
providing environmental monitoring data, including organic          blanks were used for quality assurance to ensure that iden-
environmental pollutants, to many national authorities and          tified and/or reported compounds have their origin in the col-
international monitoring programmes: EMEP, AMAP and                 lected air sample and do not appear in the blank samples
GMP. The particle phase of the air samples was collected on         above predefined levels (see Sect. 2.4). This means that com-
glass-fibre filters (GFFs; 142 mm i.d.; cut-off 10 µm) and the      pounds need to exceed the area threshold of a factor 100 com-
gas phase was collected on polyurethane foam (PUF) plugs            pared to the area in the sample blanks.

https://doi.org/10.5194/acp-20-9031-2020                                            Atmos. Chem. Phys., 20, 9031–9049, 2020
9034 L. Röhler et al.: Non-target and suspect characterisation of organic contaminants in Arctic air
The ISTDs, which cover a wide area of the GC × GC est level of identification confidence, Level 5 (L5), is defined
chromatogram, were not used for target quantification as peaks of interest, which are only characterised by reten-
but for quality assurance and sample normalisation. tion time and a mass spectrum and not by tentative molec-
For example, the early eluting ISTDs (e.g. 13 C6 - ular weights. The remaining levels for identification confi-
labelled hexachlorobenzene (HCB) or 2 H10 -labelled dence with LRMS are in line with the original concept of
phenanthrene) help to identify potential evaporative Schymanski et al. (2015): Level 4 (L4), defined by a possible
losses during clean-up and volume reduction, and the molecular formula (e.g. a plausible molecular formula could
13 C -labelled p,p 0 -dichlorodiphenyltrichloroethane be assigned to various compound classes) or a halogen clus-
12
0
(p,p -DDT) ISTD provides information about possi- ter detected without a match to the MS libraries used. For
ble matrix effects in the injector and/or the GC col- Level 3 (L3), the group of tentative candidates identified as a
umn due to its higher thermal degradation potential. substructure and/or class, a certain base structure is possible,
Thus, the p,p 0 -dichlorodiphenyldichloroethylene /p,p 0 - e.g. the MS shows fragment patterns of a polycyclic aromatic
dichlorodiphenyldichloroethane (p,p 0 -DDE /p,p0 -DDD) hydrocarbon (PAH) with a plausible molecular formula, but
ratio was used for the identification of injector losses. several alternative structures are possible. Level 2 (L2) is the
A comprehensive recovery test was done by Röhler et group of probable structures based on good library matches
al. (2020) to investigate the applicability of this wide-scope and additional evidence, e.g. the position or grouping on the
sample clean-up method. two-dimensional GC × GC plan. Level 1 (L1) is defined by
compounds confirmed by external reference standards. We
2.4 Data processing and post-acquisition data introduced an additional Level 0 (L0) for compounds con-
treatment firmed by ISTDs and for which target quantification could be
performed together with SUS and NTS. Target quantification
For GC × GC-LRMS system control, data analysis and pro- was, however, not a primary aim of this study.
cessing, LECO® ChromaTOF® software (V 4.50.8) was During SUS and NTS data processing (Fig. 3), the
used, including its advanced features: Statistical Compare forward-match percentage to the mass spectrum (MS) li-
and Scripts. Several in-house libraries with mass spectra of brary (ChromaTOF uses the NIST composite algorithm; see
reference standards were used, including 13 C/2 H-labelled Samokhin et al., 2015) entry was used to reduce the num-
ISTDs, the National Institute of Standards and Technology ber of peaks which require manual inspection (see Sect. 3.1
(NIST) 2014 mass spectral library, the Scientific Working for numbers). This is a critical step in which potential com-
Group for the Analysis of Seized Drugs (SWGdrug; Oul- pounds of interest may be lost, since the MS values from
ton, 2019) mass spectral library, and a customised library the NIST14 library are not identical to the MS obtained with
with selected spectra from NIST14 for suspect screening the GC × GC-LRMS, probably due to the unit mass resolu-
for the tentative identification of detected compounds. To tion of the instrument, generating mass artefacts as shown in
create the customised library with selected spectra from Fig. 4. Compounds with higher mass defects, e.g. the bromi-
NIST14, all mass spectra of compounds from NIST14, nated compounds, had non-acceptable spectra match qual-
which are listed on relevant suspect lists for the Arctic ity (Fig. 4). It is possible that some compounds of interest
(Reppas-Chrysovitsinos et al., 2017; Brown and Wania, were rejected during data processing due to a bad match of
2008; Coscollà et al., 2011; Hoferkamp et al., 2010; Howard MS to the NIST14 MS library or custom suspect libraries.
and Muir, 2010; NORMAN network, 2019; Vorkamp and To minimise such losses of compounds with higher mass de-
Rigét, 2014; Zhong et al., 2012), were copied to an own fects, visual basic scripts developed by Hilton et al. (2010)
library file for more efficient suspect screening. This cus- were applied for data processing. These scripts were specif-
tomised library was useful to detect and flag potential sus- ically written for isotope clusters obtained from the instru-
pects during data processing. More details can be found in ment used. All compounds flagged by those scripts were
Röhler et al. (2020), and a short description of how the data checked manually. Furthermore, it was not possible to use
from suspect lists got aligned with our peak table and how available retention indices for further identification confi-
the suspect MS libraries were built can be found in the Sup- dence due to the use of a medium polar GC column (BPX-50,
plement. 50 % phenyl polysilphenylene-siloxane) as the first column
The identification level classification concept of Schyman- for GC × GC separation instead of a non-polar (5 % phenyl)
ski et al. (2015), originally developed for liquid chromatog- column, for which most of the retention indices are present
raphy (LC)-HRMS data, defines a common set of rules for in databases. In addition, there are limited concepts for the
harmonised communication of identification confidences of adaption of retention indices for GC × GC (e.g. Veenaas and
results from different SUS and NTS studies. Due to the lack Haglund, 2018; Mazur et al., 2018). This BPX-50 column, as
of HRMS data in the current study, this level classification the first column for GC × GC separation, was chosen to get
concept had to be slightly adjusted to account for the limi- a better separation of compounds of interest from an interfer-
tations of LRMS data (Fig. 2); see Röhler et al. (2020). As ing background matrix and thus minimise negative effects on
LRMS analysis does not provide accurate masses, the low- collected mass spectra.
Atmos. Chem. Phys., 20, 9031–9049, 2020 https://doi.org/10.5194/acp-20-9031-2020L. Röhler et al.: Non-target and suspect characterisation of organic contaminants in Arctic air 9035
Figure 2. General strategy and identification confidence for GC × GC-LRMS. Adapted from Schymanski et al. (2015) and Röhler et
al. (2020).
When a compound was flagged in the result list (L1–L5 port. Yet, an organic chemical’s potential for LRAT into
lists, Fig. 3) for a manual check after data processing, ad- the Arctic requires that it is sufficiently persistent in air.
ditional plausibility checks were performed. These included LRATP can be estimated from theoretical calculations. The
the selectivity of the sampling and sample clean-up method key mechanism which is believed to degrade organic chem-
as well as the complete sample analysis procedure. For in- icals in the atmosphere is reaction with OH radicals. Be-
stance, a compound should not degrade during sample pro- cause both concentrations of OH radicals and temperatures
cessing (from sampling to analysis) or evaporate or sorb to are very low during the polar night, the atmospheric half-
the vial, injector or chromatographic column. The GC × GC life due to atmospheric reaction (t1/2 ) is predicted to be very
retention times should also be reasonable; e.g. volatile com- long in comparison to lower latitudes (e.g. Webster et al.,
pounds cannot elute at the end of the run and non-polar com- 1998). For a more realistic evaluation of LRATP, reaction
pounds cannot have a short second-dimension retention time. half-lives in air therefore need to be adjusted to reflect the
Furthermore, the area of a candidate in a sample should ex- actual sampling conditions. Half-lives were adjusted using
ceed the area threshold of factor ≥ 100 in the corresponding an equation from Wania et al. (2006), and we refer to the
sample blank to be kept in the peak table and not to be sorted Supplement for details. To parameterise this equation, the re-
out as a compound occurring from the blank sample. The action rates in air at 25 ◦ C were retrieved for L0, L1 and L2
higher threshold is necessary since areas are not adjusted for compounds from the EPI Suite software (U.S. EPA, 2019)
different sample volumes. The different sample extracts were and adjusted using the maximum temperature during sam-
visually adjusted to the same hight, before taking out aliquots pling (−2.4 ◦ C), an assumed OH-radical concentration of
for GC × GC analysis (uncertainty ±10 %). 6 × 10³ mol cm−3 and an assumed activation energy for re-
action in air of 10 000 J mol−1 . Estimates of the OH-radical
2.5 Evaluation of long-range atmospheric transport concentration were based on a model developed by Bahm
potential and Khalil (2004). However, this model does not predict OH
radicals at latitudes higher than 45◦ N, which crosses cen-
The detection of a substance in air at Zeppelin does not pro- tral Europe ([OH] at 45◦ N: 5×10⁴ mol cm−3 ), in December.
vide conclusive evidence for long-range atmospheric trans- Our samples were collected at 78◦ N, and our assumed OH-
https://doi.org/10.5194/acp-20-9031-2020 Atmos. Chem. Phys., 20, 9031–9049, 20209036 L. Röhler et al.: Non-target and suspect characterisation of organic contaminants in Arctic air
radical concentration of 6 × 10³ mol cm−3 was chosen as an
initial conservative estimate, keeping in mind that our anal-
ysed air samples include air masses which may have been
transported from lower latitudes. Results from these theoret-
ical calculations are discussed in Sect. 3.5.3 and shown in the
Supplement (Table S3 and the Excel file).
3 Results and discussion
3.1 Number of detected and classified compounds in
Arctic air
By applying the wide-scope clean-up based on C18 silica
and Z-Sep+ combined with Florisil to the air sample extracts
from PUFs and GFFs, we were able to expand the chemical
domain covered compared to established target POP analy-
sis methods, which generally are using concentrated sulfuric
acid. Our method covers a broad spectrum of polarity, has
sufficient matrix removal, and is for the first time applied
to Arctic air samples for the detection and identification of
known and new potential CEACs. Previously, this method
was successfully applied to air samples from southern Nor-
way (Röhler et al., 2020).
It was possible to detect and classify over 700 compounds
in the particle phase (GFF samples) and over 1200 com-
pounds in the gas phase (PUF samples) as L5 with our clas-
sification and sorting method out of over 16 000 features in
GFF and almost 20 000 features for PUF (for details on the
peak reduction during data processing for SUS and NTS,
see Fig. S1 in the Supplement). The higher number of gas-
phase compounds was expected since particle-related com-
pounds collected on GFFs may have a lower LRATP com-
pared to gas-phase-related compounds collected on PUFs.
Of these L5 compounds, approximately 200 compounds in
GFFs and approximately 400 compounds in PUFs could be
further classified to L4, L3 or L2 (Fig. 5). As the structures of
the remaining L5 compounds remain unknown, these com-
pounds are not discussed any further. In total, 65 compounds
(14 / 51 GFF / PUF) were classified as L4. Many compounds
of the L4 class could be identified as unknown halogenated
compounds because a halogen pattern was observed, but no
matches in MS libraries were found (12 / 29 GFF / PUF). For
the remaining L4 compounds, only a possible molecular for-
mula could be assigned. As L3, 241 compounds (95 / 146
GFF / PUF) could be classified, including two major sub-
groups: polycyclic aromatic compounds (PACs) and phtha-
lates (see Fig. 6). The PAC subgroup include many PAHs. A
total of 90 compounds reached L2 (20 / 70 GFF / PUF), and
41 of the compounds in PUF were PCBs with two to seven
chlorine substituents. By analysing reference standards under
Figure 3. Data processing workflow for suspect and non-target
identical conditions as the air samples, 56 compounds could
screening.
be classified as L1 (14 / 42 GFF / PUF) (Table 1). Further-
more, six compounds could be identified and confirmed with
ISTDs to L0 in the PUF sample (only traces in the GFF sam-
Atmos. Chem. Phys., 20, 9031–9049, 2020 https://doi.org/10.5194/acp-20-9031-2020L. Röhler et al.: Non-target and suspect characterisation of organic contaminants in Arctic air 9037
Figure 4. (a) Isotope cluster of hexabromobenzene (HBB) in NIST14, (b) own measured HBB on GC × GC-LRMS and (c) HRMS isotope
cluster HBB (Röhler et al., 2020).
Figure 5. Distribution of L0–L5 compounds in the GFF and PUF sample.
ple). Of the 56 confirmed L1 compounds, seven were com- to date (October 2019). The new potential CEAC group was
mon to the GFF and PUF sample. Importantly, a compound split into two subgroups: those with an estimated LRATP and
not positively confirmed by this method does not necessarily those without. The default LRATP estimates are based on the
mean that it does not occur in Arctic air. EPI Suite software (U.S. EPA, 2019), reflecting standard-
As shown in Table 1, 39 of 56 compounds that were ised environmental conditions (t1/2 (air) at 25 ◦ C, 12 h days
classified as L1 are listed in one or more suspect lists and a hydroxyl radical concentration of 1.6 × 10⁶ OH cm−3 ),
(Reppas-Chrysovitsinos et al., 2017; Brown and Wania, and the results compared with the criteria in the Stockholm
2008; Coscollà et al., 2011; Hoferkamp et al., 2010; Howard Convention (UNEP, 2009b) that substances with t1/2 (air) ex-
and Muir, 2010; NORMAN network, 2019; Vorkamp and ceeding 2 d have LRATP. A complete table with all com-
Rigét, 2014; Zhong et al., 2012) or self-built suspect li- pounds identified, including physical–chemical properties
braries. From L2 compounds, 17 compounds resemble com- from EPI Suite, the adjusted half-life in air during sampling
pounds in one or more suspect lists. Since L2 compounds (Eqs. S1 and S2 in the Supplement), usage and information
are not confirmed with reference standards, those compounds from previous reports on occurrence in Arctic environments,
might be different isomers than those listed in the Supple- toxicity, and presence on high production volume (HPV)
ment, and thus matches to suspect lists could be different for chemical lists for the EU and US, as well as further parame-
L2 compounds. ters for PBT classification (REACH and Stockholm conven-
For a better understanding of the importance of our find- tions), can be found in the Supplement (Table S2 and the
ings at L0, L1 and L2, these compounds were further ar- Excel file).
ranged into four groups. These groups are (i) legacy POPs
and PAHs, (ii) CEACs defined in the AMAP (2017) report, 3.2 Legacy POPs and PAHs
(iii) organic compounds previously detected in Arctic media,
and (iv) new potential CEACs not reported in Arctic media The currently used method revealed 59 legacy POPs and
PAHs as L0, L1 and L2, specifically hexachlorocyclo-
https://doi.org/10.5194/acp-20-9031-2020 Atmos. Chem. Phys., 20, 9031–9049, 20209038 L. Röhler et al.: Non-target and suspect characterisation of organic contaminants in Arctic air
Table 1. Overview of the L0–L4 compounds classified in Arctic air samples.
Level Compounds PUF sample GFF sample Common to PUF Found in
classified and GFF suspect lists
L0 6 6 Only traces detected 0 1
L1 56 42 14 7 39
L2 90 70 (41 PCBs) 20 0 17a
L3 241 146 95 0 –b
L4 65 51 (29 unknown halogenated) 14 (12 unknown halogenated) 0 –b
a Showing similarity to suspect lists, isomer not confirmed; b not applicable.
hexanes (α-HCH and γ -HCH), HCB, pentachlorobenzene Table 2. Ranking of the most abundant POPs in this study (based
(PeCB), DDTs (o,p 0 -DDT, p,p0 -DDT and p,p 0 -DDD), PCB- on peak area) in comparison to concentrations from target anal-
153, dieldrin, trans-nonachlor, cis-chlordane, two poly- ysis (pg m−3 ) in the Norwegian national monitoring programme
brominated diphenyl ethers (PBDE-28 and PBDE-47), of long-range-transport environmental contaminants (Nizzetto and
and a metabolite of heptachlor (heptachloro exo epoxide) Aas, 2016).
(UNEP, 2009b) as L0 or L1. Furthermore, two PAHs,
Compound Area from Average concentration
benzo[ghi]fluoranthene (L1) and naphthalene (L2), could be
this study in December 2015 at
identified. Other PAHs were classified as L3 (PACs). Dield-
Zeppelin (pg m−3 ;
rin and benzo[ghi]fluoranthene were common to GFF and Nizzetto and Aas, 2016)
PUF and had a GFF : PUF ratio according to peak area of 1 : 8
for dieldrin and 2 : 1 for benzo[ghi]fluoranthene. It was also HCB 8 032 400 80.8
PeCB 890 100 25.1a
possible to classify 41 PCB congeners as L2. The finding of
α-HCH 652 200 3.25
legacy POPs and PAHs, routinely measured at the same mon- p,p0 -DDE 297 500 0.89
itoring station using target methods, is an indirect validation γ -HCH 177700 0.6
of the method and indicates that the detection of other com- o,p0 -DDT 46 700 0.16
pounds with similar physical–chemical properties is trust- Dieldrin 37 700 –b
worthy. From the assumption that a higher concentration of trans-Nonachlor 36 900 0.37
a compound gives a greater peak area, the detected legacy cis-Chlordane 36 100 0.35
POPs could be correlated with a good match to the average Heptachloro exo epoxide 25 800 –b
concentrations of monitored legacy POPs at the Zeppelin sta- p,p0 -DDT 18 800 0.11
PCB-153 15 100 0.15
tion (Table 2) (Nizzetto and Aas, 2016). Pearson correlation
PBDE-47 9800 0.07
analysis indicates a strong correlation (r = 0.978) that is sig- PBDE-28 600 0.006
nificant different from zero (p < 0.001). Thus, the screening
a Not shown in report; b non-acid stable compound and not included in Norwegian
approach seems to give an indication of the relative concen-
national air monitoring.
trations (occurrence) of semi-volatile organic compounds in
Arctic air.
phosphate (TCEP), and the stimulant caffeine. The five
3.3 CEACs as defined by AMAP L2 compounds were the BFR pentabromotoluene (PeBT),
one isomer of TCEP, two isomers of tris(2-chloroisopropyl)
In total, 11 of the detected compounds are included phosphate (TCPP), and an isomer of dibromoanisole (DBA),
as CEACs in the AMAP (2017) report or in Reppas- likely the HNP 2,6-DBA. TBA is routinely measured in air
Chrysovitsinos et al. (2017). One was classified as L0, at the Zeppelin Observatory as part of the Norwegian mon-
five were classified as L1 and five were classified as itoring programme. TBA has also been reported in Arctic
L2. The CEAC classified as L0 was the flame retardant air from the Zeppelin station by Vetter et al. (2002). Bidle-
hexabromobenzene (HBB) that has also been detected in man et al. (2017a, b) detected 2,4-DBA and TBA at Pallas,
air at the Zeppelin Observatory by target analyses as part Finland (Bidleman et al., 2017a), and at several locations in
of the Norwegian national air monitoring programme for the Bothnian Bay region (Bidleman et al., 2017b). PCA is
long-range-transport atmospheric contaminants. Classified a pesticide metabolite originating from the biodegradation
as L1 were two halogenated natural products (HNPs), 2,4,6- of pentachlorophenol, which is a pesticide and wood preser-
tribromoanisole (TBA) and 2,4-dibromoanisole (2,4-DBA), vative (GovCanada, 2019; Su et al., 2008). PCA has previ-
the pesticide metabolite pentachloroanisole (PCA), the ously been found in air at other AMAP sampling sites, like
organophosphorus flame retardant (OPFR) tri(2-chloroethyl) Alert, Canada, but not at Zeppelin, Svalbard (Su et al., 2008;
Atmos. Chem. Phys., 20, 9031–9049, 2020 https://doi.org/10.5194/acp-20-9031-2020L. Röhler et al.: Non-target and suspect characterisation of organic contaminants in Arctic air 9039
Hung et al., 2010). The stimulant and food additive caffeine, 3.5 New potential chemicals of emerging Arctic
also an intermediate for pharmaceuticals as well as perfumes, concern
fragrances, personal care products and laboratory chemicals
(ECHA, 2019c), was found in effluent and seawater from It was possible to classify 73 new potential CEACs with
Longyearbyen (Kallenborn et al., 2018) but to our knowledge a match to reference standards (L1) or probable structures
not in air samples. TCPP (ECHA, 2019i; Sühring et al., 2016) (L2). These 73 compounds have, to our knowledge, never
is one of the main substances which have replaced TCEP in been previously reported in Arctic media. The complete list
Europe (Ireland/UK, 2008). TCPP and TCEP were detected can be found in the Supplement (Excel file). Almost 40 %
in our GFF sample (i.e. particle phase), together with struc- of these new potential CEACs have LRATP according to
turally related isomers. OPFRs have previously been detected the Stockholm Convention (UNEP, 2009b), with t1/2 (air) ex-
in Arctic air from the Zeppelin Observatory (Nizzetto et al., ceeding 2 d using the standard values from the EPI Suite
2018; Salamova et al., 2014). calculation (see Sect. 3.1.) Although those compounds were
not reported in the Arctic environment before, local sources
cannot be excluded for some of the identified compounds.
3.4 Organic compounds previously detected in Arctic Especially for compounds which might be of biogenic ori-
media gin, i.e. methoxy-chloro compounds, and compounds with
widespread use, the potential for local sources needs to be
kept in mind. This study, however, is not designed to prove
Besides legacy POPs and PAHs, as well as CEACs listed the potential influence of local sources on the overall contam-
by AMAP, it was also possible to identify eight other inant patterns. Especially for compounds that could be HNPs,
organic compounds as L1 and classify one compound but for which we could not find any evidence that they have
as L2. These nine compounds have previously been re- been detected in the Arctic before, further in-depth studies
ported in Arctic samples. As L1 we found tetrachlorovera- are required.
trole, octachlorostyrene (OCS), 1,2,3,4-tetrachlorobenzene,
1,9-benz-10-anthrone, 9-fluorenone, 9,10-anthraquinone and 3.5.1 Potential CEACs with LRATP
4H-cyclopenta[def]phenanthren-4-one. Only one isomer of
tetrachloroveratrole was classified as L2. Tetrachlorovera- Out of the total of 73 identified or tentatively identified
trole and its isomer are both pesticide metabolites (Su et new potential CEACs, 29 were classified as compounds
al., 2008; GovCanada, 2019), while the others were either with LRATP according to the Stockholm Convention crite-
combustion products or oxidation products of PAHs (Kirch- ria (UNEP, 2009b), with t1/2 (air) exceeding 2 d using the
ner et al., 2016; Su et al., 2008; Hung et al., 2010; Gubala standard values from the EPI Suite calculation. Of these, 6
et al., 1995; Singh et al., 2017; Karavalakis et al., 2010). compounds were detected in the GFF sample (two as L1 and
4H-Cyclopenta[def]phenanthren-4-one was common to GFF four as L2), and 23 compounds were detected in the PUF
and PUF with a GFF : PUF ratio from peak areas of 1 : 2. sample (13 as L1 and 10 as L2); see Tables 3 and 4. Further
Tetrachloroveratrole and OCS have been reported from other information about these compounds can also be found in the
Arctic monitoring sites like Alert, Canada, but are not in- Supplement (Excel file). As the identities of L2 compounds
cluded in the Norwegian monitoring programme at the Zep- were not fully confirmed, no literature search was performed
pelin Observatory on Svalbard (Hung et al., 2010; Su et al., for previous reports on occurrence in Arctic environments.
2008). OCS has also been detected in air samples from the In the GFF sample, one of the two L1 compounds was ben-
Alps (Kirchner et al., 2016), and 1,2,3,4-tetrachlorobenzene zenesulfonamide (BSA), an industrial intermediate used for
has been measured in sediments in Arctic Alaska (Gubala the synthesis of chemicals in commerce like pesticides, pho-
et al., 1995) but to our knowledge not in Arctic air before; tochemical products, pharmaceuticals, sweeteners or dyes
1,9-benz-10-anthrone, 9-fluorenone, 9,10-anthraquinone and (ECHA, 2019e; Naccarato et al., 2014; Herrero et al., 2014).
4H-cyclopenta[def]phenanthren-4-one have been reported in Since BSA occurs in many products, local sources cannot
aerosols as total suspended particles from the Alert station, be excluded and further investigations are needed to confirm
Canada (Singh et al., 2017). Besides that, they were detected, potential LRATP or local sources as a major contamination
among further oxy- and nitro-PAHs, in the emissions from source of BSA in the sample investigated here. The other
a local point source in Longyearbyen, Svalbard (coal-fired L1 compound identified in the GFF is a potential combus-
power plant) (Drotikova et al., 2020). Most of the known tion product, 2-methyl-9,10-anthraquinone, which can have
Arctic contaminants were classified as L1 as a result of avail- its origin in wood combustion (Czech et al., 2018; Lui et
able standards. Please note that most PAHs are classified as al., 2017; Vicente et al., 2016) or can be formed by at-
L3 compounds due to the lack of single reference standards. mospheric reactions (Alam et al., 2014). 2-Methyl-9,10-
We assume that several of the known PAHs, previously de- anthraquinone is also an intermediate in the production of
tected in Arctic media, could be found among the PAHs clas- coating products, inks and toners, laboratory chemicals, and
sified as PACs in L3 (see Sect. 3.6). explosives; it is also used for the production of plastic prod-
https://doi.org/10.5194/acp-20-9031-2020 Atmos. Chem. Phys., 20, 9031–9049, 20209040 L. Röhler et al.: Non-target and suspect characterisation of organic contaminants in Arctic air
Table 3. Structure overview of L1 compounds classified as new potential CEACs with LRATP.
Name/CAS/sample Structure Name/CAS/sample Structure
Benzenesulfonamide (BSA)/ 2-Naphthalenecarbonitrile/
98-10-2 613-46-7
GFF (particle phase) PUF (gas phase)
2-Methyl-9,10-Anthraquinone/ 2,3,5,6-Tetrachloropyridine/
84-54-8 2402-79-1
GFF (particle phase) PUF (gas phase)
2,6-Dichlorobenzonitrile Pentachloropyridine/
(dichlorobenil)/ 2176-62-7
1194-65-6 PUF (gas phase)
PUF (gas phase)
2,4-Dichlorobenzonitrile/ 1,4-Benzenedicarbonitrile
6574-98-7 (terephthalonitrile)/
PUF (gas phase) 623-26-7
PUF (gas phase)
1,4-Dichloro-2,5-dimethoxybenzene 20 ,30 ,40 -Trichloroacetophenone/
(chloroneb)/ 13608-87-2
2675-77-6 PUF (gas phase)
PUF (gas phase)
2-Chloro-6-(trichloromethyl)pyridine 2,4,6-Tribromoaniline/
(Nitrapyrin)/ 147-82-0
1929-82-4 PUF (gas phase)
PUF (gas phase)
2,4-Dichloroanisole/ 2-Nitroanisole/
553-82-2 91-23-6
PUF (gas phase) PUF (gas phase)
2,4,6-Trichloroanisole/
87-40-1
PUF (gas phase)
Table 4. Overview of L2 compounds classified as new potential CEACs with LRATP.
Name Sample Molecular formula
3,4-Dichloropropiophenone-related positional isomera GFF (particle phase) C9 H8 Cl2 O
Diphenyl sulfone GFF (particle phase) C12 H10 O2 S
Dibenzothiophene sulfone GFF (particle phase) C12 H8 O2 S
N-(2-Cyanoethyl)-N-methyl-benzenesulfonamide GFF (particle phase) C10 H12 N2 O2 S
Two chloroneb-related positional isomersb PUF (gas phase) C8 H8 Cl2 O2
One chlorothalonil-related positional isomerc PUF (gas phase) C8 Cl4 N2
Two trichloro-dimethoxybenzen isomers PUF (gas phase) C8 H7 Cl3 O2
Two dichloro-methylanisole isomers PUF (gas phase) C8 H8 Cl2 O
One dibromo-dimethoxybenzene isomer PUF (gas phase) C8 H8 Br2 O2
1-Naphthalenecarbonitrile PUF (gas phase) C11 H7 N
One pentachloro-methylbenzene positional isomerd PUF (gas phase) C7 H3 Cl5
a Retention times close, but not identical, to those of a 3,4-dichloropropiophenone standard. b Retention times close, but not identical,
to those of a chloroneb standard. c Retention times close, but not identical, to those of a chlorothalonil standard. d Retention times
close, but not identical, to those of a pentachlorotoluene standard.
Atmos. Chem. Phys., 20, 9031–9049, 2020 https://doi.org/10.5194/acp-20-9031-2020L. Röhler et al.: Non-target and suspect characterisation of organic contaminants in Arctic air 9041
ucts (ECHA, 2019h). Besides those L1 compounds it was 3.5.2 Potential CEACs without LRATP
possible to detect one 3,4-dichloropropiophenone-related
compound, likely a positional isomer, and three sulfur- Besides the new potential CEACs with LRATP described in
related compounds: diphenyl sulfone, dibenzothiophene sul- the previous section, we could also identify 44 new poten-
fone and N -(2-cyanoethyl)-N-methyl-benzenesulfonamide; tial CEACs which do not have a predicted LRATP accord-
these were classified as L2 by MS library matching. ing to the Stockholm Convention criteria (UNEP, 2009b),
In the PUF sample, the pesticide dichlobenil (2,6- reflecting default standardised environmental conditions. Of
dichlorobenzonitril) was identified, together with an isomer, these 44 new potential CEACs, 19 compounds were detected
2,4-dichlorobenzonitrile (ECHA, 2019g), as L1. No informa- in the GFF sample (six as L1 and 13 as L2) and 25 com-
tion on commercial application and usage is found for 2,4- pounds were detected in the PUF sample (11 as L1 and 14
dichlorobenzonitrile. Besides dichlobenil, another pesticide, as L2). An overview of L1 compounds without a predicted
chloroneb (1,4-dichloro-2,5-dimethoxybenzene) (U.S. EPA, LRATP reflecting default environmental conditions can be
2005), was identified as L1, and two chloroneb-related com- found in Table 5. None of the new L1 potential CEACs have
pounds and one chlorothalonil-related compound, likely po- to our knowledge been previously detected in Arctic sam-
sitional isomers of those, were assigned L2. The nitrification ples; only triallate was found once before in passive air sam-
inhibitor nitrapyrine (2-chloro-6-(trichloromethyl)pyridine; ples from Arviat, Nunavut, Canada (western shore of Hud-
L1) was identified in Arctic samples for the very first time son Bay; 61◦ N) (Messing et al., 2014), which is outside the
(ECHA, 2019f; Woodward et al., 2019). Furthermore, two Arctic Circle. Triallate is an agriculture pesticide and was de-
trichloro-dimethoxybenzenes, two dichloro-methylanisols tected in both GFF and PUF in our sample. Four of the six
and one dibromo-dimethoxybenzene were also assigned L2. L1 compounds detected in the GFF sample were also found
Biogenic origin cannot be excluded for halogenated in the PUF sample at various GFF / PUF peak area ratios: m-
methoxybenzenes. Local sources also cannot be ex- terphenyl 1 : 30 (GFF : PUF ratio), triallate 1 : 17 (GFF : PUF
cluded for the closely related 2,4-dichloroanisole and ratio), dichlofluanid 1 : 3 (GFF : PUF ratio) and carbazole
2,4,6-trichloroanisole (both L1), potential metabolites of 1 : 1 (GFF : PUF ratio). The two remaining compounds, iden-
chlorophenol and chlorophenoxy pesticides, and also poten- tified as L1 in the GFF sample, were 1,2-benzoanthraquinone
tial HNPs (Führer and Ballschmiter, 1998; Schenker et al., and 6H-benzo[cd]pyren-6-one. Both are potential combus-
2007; Bendig et al., 2013). 2-Naphthalenecarbonitrile, orig- tion products and can have their origin in wood or coal com-
inating most probably from plastic combustion, e.g. ABS bustion (Czech et al., 2018; Lui et al., 2017; Vicente et al.,
(acrylonitrile butadiene styrene) plastic or polyester fabrics 2016), or they can be formed by atmospheric reactions (Alam
(Moltó et al., 2006, 2009; Watanabe et al., 2007; Wang et et al., 2014). As L2, we could, besides others, classify several
al., 2007) or the bluing of steel (Stefanye, 1972), was iden- positional isomers of reference standards which were anal-
tified as L1 and 1-naphthalenecarbonitrile as L2. A further ysed (see the Excel file in the Supplement for further details).
group of compounds, confirmed with reference standards as In the PUF it was possible to identify all three isomers
L1, are intermediates with various application areas. 2,3,5,6- of terphenyl (o, m, p) usually applied as a technical mix-
Tetrachloropyridine and pentachloropyridine are intermedi- ture, while only m-terphenyl was also detected in the GFF.
ates occurring in the synthesis of the pesticides chlorpyrifos The commercial mixture of terphenyls is used as an indus-
and triclopyr (Howard and Muir, 2010). Terephthalonitrile is trial agent for heat storage and transfer as well as textile
identified as an intermediate for the production of the pesti- dye carriers and as an intermediate of non-spreading lubri-
cide dacthal (Meng, 2012). 20 ,30 ,40 -Trichloroacetophenone is cants (Health Council of the Netherlands, 2002). During py-
an intermediate for the production of various fungicides and rolysis and the combustion of used black shorts (polyether
pharmaceuticals (WOC, 2019). Not much is known about fabric), all three terphenyl isomers were detected (Moltó et
the use of 2,4,6-tribromoaniline, but it might be used in the al., 2006). 4-Chloro-2-methylphenole (PCOC) is used by
synthesis of pharmaceuticals, agricultural pesticides and fire- the industry as an intermediate for the production of phe-
extinguishing agents (Labmonk, 2019). 2-Nitroanisole can noxy herbicides and is found as an impurity in the final
have its origin in combustion processes or can be formed by commercial product (Hansen et al., 2002). For dichloflu-
atmospheric reactions (Stiborova, 2002). In 1993, large quan- anid, carbazole, 3-iodo-2-propynyl-butylcarbamate (IPBC)
tities of 2-nitroanisole were emitted into the air during an ac- and 2-(methylmercapto)benzothiazole, local contamination
cident at the Höchst plant in Germany (Weyer et al., 2014). A sources cannot be excluded. Diclofluanid and IPBC are both
pentachloro-methylbenzene-related compound, likely a posi- used as wood preservatives, and carbazole is a constituent
tional isomer, was detected and assigned L2, but industrial of coal tar (creosote). In addition to that, IPBC is used
uses are not known. in cosmetics and personal care products (ECHA, 2019b,
d), and carbazole is used in the production of carbazole-
containing polymers (PVK, or poly(-N-vinylcarbazole)) that
are used in photovoltaic devices and semiconducting poly-
mers (Zhao et al., 2017; Grazulevicius et al., 2003). Car-
https://doi.org/10.5194/acp-20-9031-2020 Atmos. Chem. Phys., 20, 9031–9049, 20209042 L. Röhler et al.: Non-target and suspect characterisation of organic contaminants in Arctic air
Table 5. Structure overview of L1 compounds classified as new potential CEACs without a predicted LRATP under standardised environ-
mental conditions.
Name/CAS/sample Structure Name/CAS/sample Structure
1,2-Benzanthraquinone/ p-Terphenyl/
2498-66-0 l92-94-4
GFF (particle phase) PUF (gas phase)
6H-Benzo[cd]pyren-6-one/ 4-Chloro-2-methylphenole (PCOC)/
3074-00-8 1570-64-5
GFF (particle phase) PUF (gas phase)
Triallate/ 3-Iodo-2-propynyl-butylcarbamate
2303-17-5 (iodocarb, IPBC)/
GFF and PUF 55406-53-6
PUF (gas phase)
Dichlofluanid/ 2-(Methylmercapto)-benzothiazole/
1085-98-9 615-22-5
GFF and PUF PUF (gas phase)
Carbazole/ MHC-1
86-74-8 (2-bromo-1-bromomethyl-1,4-dichloro-5-
GFF and PUF (20 -chloroethenyl)-5-methylcyclohexane)/
66321-24-2
PUF (gas phase)
m-Terphenyl/ 2-bromo-3,5-dimethoxytoluene/
l92-06-8 13321-73-8
GFF and PUF PUF (gas phase)
o-Terphenyl/
84-15-1
PUF (gas phase)
bazole is also used in the production of pharmaceuticals necessary to identify the origin of MHC-1 in the Arctic. No
(Zawadzka et al., 2015). 2-(Methylmercapto)benzothiazole information was found on the industrial usage of 2-bromo-
is a major methylation product of 2-mercaptobenzothiazole, 3,5-dimethoxytoluene, but formation as HNP cannot be ex-
a commonly used vulcanisation accelerator in rubber car cluded, since chlorinated dimethoxytoluenes were previously
tires, shoes, cables, rubber gloves and toys (Herrero et al., identified in lichen (Elix et al., 1984).
2014; Leng and Gries, 2017). Due to the widespread use of
rubber products in and around the sampling station, a po- 3.5.3 Estimated half-lives in air reflecting Arctic
tential local origin cannot be excluded. Dichlofluanid and environmental conditions
carbazole were detected in both the GFF and PUF sample,
while IPBC and 2-(methylmercapto)benzothiazole were only Our t1/2 (air) is based on default values retrieved from
in the PUF sample. The mixed halogenated compound MHC- EPI Suite (U.S. EPA, 2019). Standardised estimates are com-
1 is an HNP emitted from marine natural sources. As con- monly used for the estimation of LRATP (Muir and Howard,
firmed earlier, the seaweed Plocamium cartilagineum pro- 2006; Howard and Muir, 2010; Brown and Wania, 2008;
duces large amounts of MHC-1 (Vetter et al., 2008). MHC-1 Reppas-Chrysovitsinos et al., 2017). These default half-lives
was, however, not detected in Zeppelin air samples reported are likely underestimated when adjusted to Arctic environ-
in an earlier study (Vetter et al., 2002). Further studies are mental conditions. When adjusting the estimates of t1/2 (air)
Atmos. Chem. Phys., 20, 9031–9049, 2020 https://doi.org/10.5194/acp-20-9031-2020L. Röhler et al.: Non-target and suspect characterisation of organic contaminants in Arctic air 9043
Table 6. Half-life in air: standard values from EPI Suite and adjusted for Arctic conditions (Eqs. S1–S2) for selected compounds.
Name CAS Standard half-life Adjusted half-life
(days) (25 ◦ C; (days) (−2.4 ◦ C;
1.5 × 10⁶ mol cm−3 ) 6.0 × 10³ mol cm−3 )
9-Fluorenone 486-25-9 1.7 651
p,p0 -DDE 72-55-9 1.4 541
Dieldrin 60-57-1 1.2 437
1,9-Benz-10-anthrone 82-05-3 0.6 223
Caffeine 58-08-2 0.6 207
TCIPP 13674-84-5 0.2 90
TCEP 115-96-8 0.5 183
Benzo[ghi]fluoranthene 203-12-3 0.2 65
Naphthalene 91-20-3 0.5 186
Tris(3-chloropropyl) phosphate 1067-98-7 0.1 55
m-Terphenyl 92-06-8 0.8 159
Dichlofluanid 1085-98-9 0.7 135
IPBC 55406-53-6 0.4 79
for the sampling temperature and assumed OH-radical con-
centrations in December (see Sect. 2.5), all compounds clas-
sified as L1 and L2 have an estimated t1/2 (air) exceeding 2 d.
Results for selected compounds can be found in Table 6, and
further results are in Table S3 and the Excel file in the Sup-
plement. This supports our assumption that those new po-
tential CEACs could be subject to LRAT as a result of en-
hanced persistence in air during Arctic winter. While influ- Figure 6. L3 compound groups.
ences from nearby sources cannot be excluded, those prop-
erties are relevant for two out of four hazard criteria defin-
ing a POP according to the Stockholm convention (UNEP, identification of new potential CEACs in air samples from
2009b), suggesting they deserve further focus from the re- both southern Norway (Birkenes) and the Arctic (Zeppelin,
search and policy communities. While the selected numeri- Svalbard), combined with predictions of t1/2 (air) which are
cal values used to predict adjusted reaction half-lives may be adjusted to reflect actual environmental conditions, supports
questioned, these data in combination with their findings in our assumption that these compounds may undergo LRAT.
Arctic air samples suggest that LRATP cannot be excluded.
While half-lives are prolonged under relevant Arctic condi- 3.6 Summary for Level 3 compounds
tions, we caution that our estimates do not account for dif-
ferences in net atmospheric deposition among the substances A large number of L3 compounds, as tentative candidates,
studied, which may limit LRATP (e.g. Beyer et al., 2003). were detected in the Arctic air samples. The bulk of them
are PACs, primarily PAHs, substituted PAHs (e.g. alkane
side chains), halogenated PAHs, and sulfur-, nitrogen- and
3.5.4 Comparison of findings in Arctic air to air oxygen-containing PAHs (Fig. 6). The tentatively identified
samples from southern Norway compounds also include several phthalates, carbonic acid es-
ters and miscellaneous halogenated compounds. The list of
For some compounds it was possible to compare findings L3 compounds can be found in the Supplement (Excel file).
from this study of Arctic air samples to findings of simi-
lar high-volume air samples from Birkenes in southern Nor- 3.7 Level 4 compounds
way (Röhler et al., 2020). The Birkenes Observatory is an
EMEP monitoring station for background air, and the air The group of L4 compounds includes compounds with an as-
samples were collected during April–May 2015. For a com- signed molecular formula and several unknown halogenated
plete overview of compounds that were identified in both compounds, which did not match any of the MS values in the
studies, see the Excel file in the Supplement. Among the MS libraries used. The approximate molecular weight (nom-
new potential CEACs detected in Arctic air, it was also pos- inal mass), the degree of halogenation and some major frag-
sible to find 5 of 15 L1 compounds with LRAT and 10 of ments could be extracted from the LRMS spectra (see the
13 L1 compounds without LRAT in the Birkenes air. The Excel file in the Supplement). Additional structural informa-
https://doi.org/10.5194/acp-20-9031-2020 Atmos. Chem. Phys., 20, 9031–9049, 20209044 L. Röhler et al.: Non-target and suspect characterisation of organic contaminants in Arctic air
Table 7. Unknown halogenated compounds with HRMS data.
Compound Accurate Possible molecular formula Formula supported by manual
mass from MetFrag fragment interpretation
A#9842 GFF 256.0169 C11 H10 Cl2 N2 O C11 H10 Cl2 N2 O
B#11108 GFF 230.0134 C8 H8 Cl2 N4 m/z 230, dichloro-fragment
C10 H10 Cl2 NO
C#4444 PUF 299.8372 C7 H5 Br2 ClO C7 H5 Br2 ClO
C6 H5 Br2 O2 P
D#5672 PUF 220.0053 C9 H10 Cl2 O2 C9 H10 Cl2 O2
C8 H10 ClO3 P
tion was obtained using GC × GC-HRMS for some of the to be monitored or risk-assessed. All these compounds are
unknown halogenated compounds. predicted to have atmospheric reaction half-lives exceeding
The acquired accurate mass spectra from HRMS (see the 2 d if these are adjusted to reflect actual environmental con-
Supplement for HRMS spectra) were processed using Met- ditions during sampling. Reaction half-lives reflecting stan-
Frag software (MetFrag, 2019; Ruttkies et al., 2016), and dardised environmental conditions (e.g. 25 ◦ C) are thus poor
possible molecular formulas were generated (Table 7). predictors for persistence in the Arctic environment. The
After searching SciFinder® with possible molecular for- study reported here underpins the importance of combining
mulas and identified substructures from the mass spectra, model estimates with empirical measurements for the envi-
it was possible to find structure suggestions for several of ronmental assessment of chemicals. The newly identified or-
the unknown halogenated compounds analysed with HRMS. ganic CEACs from this study are recommended for inclusion
The number of citations of a compound in SciFinder could in regulatory monitoring strategies and for target-specific an-
give a further limitation of possible structures. Since the mass alytical methods. Although the applied identification method
spectra do not occur in the NIST14 MS library, the found is a promising tool for the identification of new priority pol-
compound might be a less cited compound or might not lutants, we do not consider the current study to be exhaustive.
have been registered or assigned a CAS number, and it is Further in-depth studies carried out using GC × GC-HRMS
not yet listed in the CAS registry in SciFinder. Using HRMS are expected to provide additional information about CEACs
and SciFinder data, additional structural information could not yet included in MS libraries. Those should preferably use
be extracted for four unknown halogenated compounds (Ta- a column set featuring a non-polar first-dimension column,
ble 7 and Figs. S2–S7) originally classified as L4. Two of the which allows for comparisons to retention time databases or
compounds were tentatively identified as methoxylated halo- retention index prediction data (Veenaas and Haglund, 2018)
genated benzenes, one dibromo-monochloro-anisole and one in order to accept or reject the candidate structures of hitherto
dichloro-methyl-dimethoxy-benzene. Several structurally re- unknown CEACs.
lated compounds were found among the potential CEACs
with a default LRATP (see Sect. 3.5.1 and Table 4) of which
one, chloroneb, was assigned L1 confidence, which supports Data availability. All necessary data are provided in the Excel file
the tentative structure assignments and qualifies the two for in the Supplement.
L3.
Supplement. The supplement related to this article is available on-
4 Conclusions line at: https://doi.org/10.5194/acp-20-9031-2020-supplement.
By applying a dedicated non-target and suspect screening
method based on a non-destructive sample clean-up method Author contributions. LR, MS, PBN and RK developed the idea
(excluding acid treatment) combined with GC × GC-LRMS behind this study. LR performed chemical work and analysis, cre-
to high-volume air samples from Arctic Svalbard, a large ated the figures, and wrote the paper. MS and PBN provided guid-
number of known and new potential CEACs could be iden- ance and contributed to the paper preparation. PH provided guid-
tified and prioritised. During this study, 73 new potential ance, conducted HRMS measurements and contributed to the paper
CEACs (compounds previously not reported in Arctic en- preparation. KB provided guidance on theoretical calculations and
vironments) were classified at confidence level L1 or L2, contributed to the paper preparation. RK provided financial support
and academic guidance, as well as contributing to the paper prepa-
which indicates that comprehensive suspect and non-target
ration. All authors read and approved the submitted paper.
screening can reveal new potential CEACs that might need
Atmos. Chem. Phys., 20, 9031–9049, 2020 https://doi.org/10.5194/acp-20-9031-2020You can also read


