Supporting Presentation and Discussion of Visualization Results in Smart Meeting Rooms
←
→
Page content transcription
If your browser does not render page correctly, please read the page content below
Noname manuscript No.
(will be inserted by the editor)

Supporting Presentation and Discussion of Visualization
Results in Smart Meeting Rooms
Axel Radloff · Christian Tominski · Thomas Nocke · Heidrun Schumann

Received: date / Accepted: date

Abstract Visualization has become an accepted tool            Keywords Information Presentation · Smart Meeting
to support the process of gaining insight into data.          Room · Visualization · Interaction
Current visualization research mainly focuses on ex-
ploratory or confirmatory visualization taking place in
classic workplace settings. In this paper, we focus on        1 Introduction
the presentation and discussion of visualization results
among domain experts, rather than on the generation of        Visualization has matured to an indispensable means
visual representations by visualization experts. We de-       to support the analysis of big and complex data. While
velop a visualization infrastructure for a novel kind of      visualization research primarily focuses on exploratory
visualization environment labeled smart meeting room,         and confirmatory tasks (i.e., formulation and validation
which provides plenty of display space to present the vi-     of hypotheses), the presentation of visualization results
sual information to be discussed. We describe the mech-       has attracted only little attention. Particularly, the in-
anisms needed to show multiple visualization views on         teraction with the generated and presented images is
multiple displays and to interact with the views across       rarely considered.
device boundaries. Our system includes methods to dy-             When we look at the working environment in which
namically generate visualization views, to suggest suit-      visualization is typically applied these days, we will
able layouts of the views, and to enable interactive          most certainly see the classic setup where a user is
fine-tuning to accommodate the dynamically changing           sitting at a computer with a display, a mouse, and
needs of the user (e.g., access to details on demand).        a keyboard. On the other hand, recent research indi-
The benefits for the users are illustrated by an applica-     cates that alternative working environments (e.g., large
tion in the context of climate impact research.               high-resolution displays or touch-enabled tabletop dis-
                                                              plays) can be quite attractive for visualization applica-
                                                              tions [11, 19, 33, 50].
A. Radloff
Institute for Computer Science, University of Rostock, Ger-       In this article, we bring together aspects of:
many
E-mail: axel.radloff@uni-rostock.de
                                                               – presentation of and interaction with visualization
                                                                 results and
C. Tominski
Institute for Computer Science, University of Rostock, Ger-
                                                               – modern visualization environments.
many
E-mail: christian.tominski@uni-rostock.de
                                                              In particular, our goal is to support domain experts
                                                              in discussing visual representations in a smart meeting
T. Nocke
Potsdam Institute for Climate Impact Research, Germany
                                                              room.
E-mail: nocke@pik-potsdam.de                                      The smart meeting room is an environment in which
H. Schumann
                                                              multiple heterogeneous display devices (e.g., projectors
Institute for Computer Science, University of Rostock, Ger-   as well as stationary and mobile displays) provide am-
many                                                          ple space for visual representations. Tracking devices
E-mail: heidrun.schumann@uni-rostock.de                       (e.g., location or eye tracking) and associated software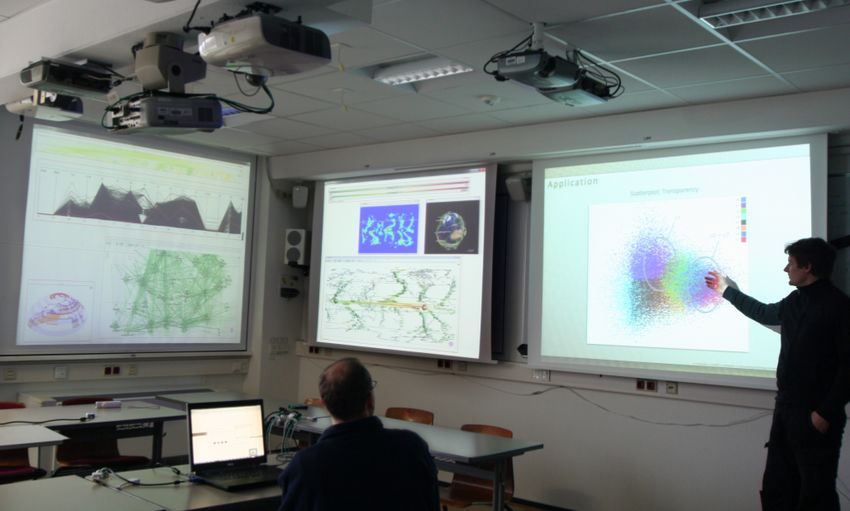
2                                                                                                    Axel Radloff et al.

make the smart meeting room aware of its internal state      way, the audience is informed about the major char-
and its inhabitants [1, 16, 51]. This awareness allows for   acteristics of the matter to be discussed and the aim
customized user assistance to support a variety of user      of the discussion. After the introduction, presenter and
tasks.                                                       audience start the discussion.
     We focus on the task of discussing research results.        During the discussion, the demands of the partici-
The discussions are structured as a presenter-audience       pants may change dynamically. The participants, under
setting. The presenter is in charge of moderating the        the guidance of the presenter, need to be enabled to ac-
discussion about analysis results and insights, which        cess further information about specific details or to in-
are to be communicated via pre-built visual representa-      quire insights regarding relationships to other data. The
tions. The audience engages in the discussion and can        carefully prepared presenter can accommodate these
interactively change views. Moreover, the audience may       changes by selecting different visual representations. How-
contribute additional visual content at any time.            ever, even in the setting of a focused discussion, the
     Both the discussion of visual representations as a      presenter cannot foresee all eventualities. For example,
user task and the smart meeting room as a visualiza-         aspects that were initially assumed to be irrelevant may
tion environment combined have not been considered           become relevant, but they are not readily encoded in
in previous studies. However, the objective of this work     the visual representations being discussed. Data that
is not to develop any new sophisticated visualization        were deemed to be unrelated to the topic of the dis-
technique. The approach presented here is more of a          cussion may yet turn out to be connected, but they
technical basis for improving the way how people work        were not included in the presentation. Handling such
with visual representations generated by multiple users      dynamic requests is one contribution of the infrastruc-
and shown on multiple displays. By building an appro-        ture presented later.
priate visualization infrastructure that utilizes the fa-        Examples of such discussions can be found in many
cilities provided by the smart meeting room, we aim at       fields of study. Our work is situated in the context of cli-
supporting the users to impart visual information and        mate impact research. Climate impact researchers com-
discuss it in a dynamic process.                             monly face various types of heterogeneous data and
     Based on a scenario description in Section 2, we de-    hence many findings about the data need to be dis-
velop a novel visualization infrastructure for supporting    cussed. For now, we shall only briefly illustrate how a
presentation and discussion in smart meeting rooms in        typical discussion among experts in climate impact re-
Section 3. In Section 4 we elaborate on technical as-        search might look like. How such discussions can benefit
pects of the implementation. An application related to       from our approach will be illustrated later in Section 5.
climate impact research will be given in Section 5. Re-          In climate impact research, scientists from differ-
lated work will be briefly reviewed in Section 6. We         ent domains (e.g., physics, biology, geology, mathemat-
conclude and indicate directions for future work in Sec-     ics, statistics) work together. In our introductory ex-
tion 7.                                                      ample, we assume that a biologist has created a new
                                                             model for the impact of carbon dioxide on the fraction
                                                             of trees. She wants to discuss her findings with climate
2 Background
                                                             impact researchers from other domain backgrounds, be-
Let us start with sketching the scenario we are address-     cause she assumes influences to another climate impact
ing. First we will characterize the task to be accom-        model, the soil water content model. To prepare the dis-
plished by the users and secondly we will describe the       cussion she asks a visualization expert to render expres-
environment in which the task is to be carried out.          sive visual representations of the data generated from
                                                             her model. In addition, she asks the visualization ex-
                                                             pert to prepare visual representations of causal models
2.1 The Task: Presenting and Discussing                      (e.g, temperature and precipitation) and further impact
                                                             models, including the soil water content model.
The objective is to support the task of presenting and           At the meeting, she first introduces the prepared
discussing the insights gained from visual representa-       visual representations to the attending colleges. During
tions of data. The discussions involve multiple domain       the discussion a statistician comes up with her finding
experts and are carried out as follows. At the begin-        that the evapotranspiration in Europe may influence
ning of a discussion, the presenter introduces the topic     the tree fraction as well. However, this specific impact
and the associated data. Preliminary research results        model had not been considered by the presenting biol-
are explained to the audience by pointing out key find-      ogist. To discuss this question, the statistician’s visu-
ings illustrated in pre-built visual representations. This   alization results need to be presented in combination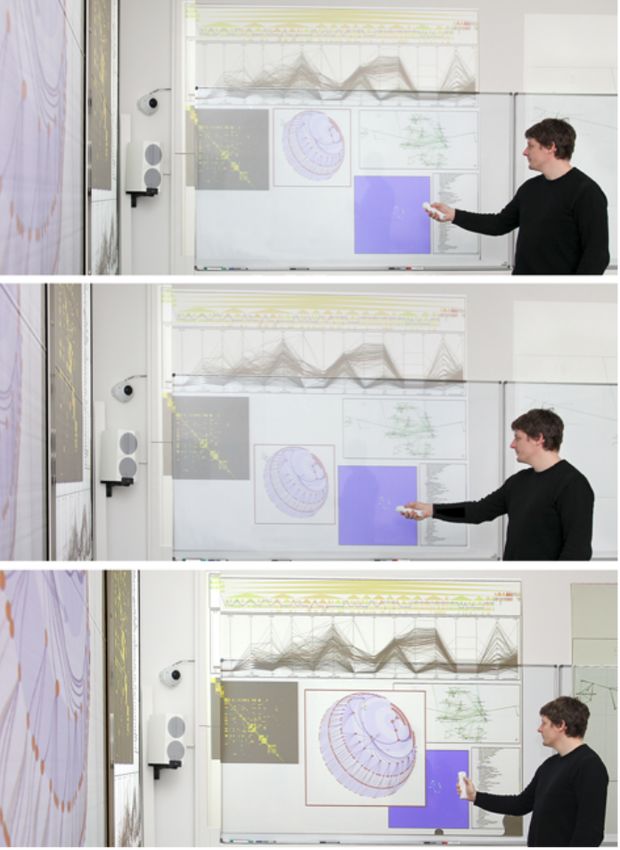
Supporting Presentation and Discussion of Visualization Results in Smart Meeting Rooms                              3

with the findings of the presenting biologist. Usually,      are dynamic (e.g., laptops, smart phones, or tablets).
this requires additional effort by the presenter (e.g.,      Static and dynamic displays are integrated in a com-
for transferring visual representations to the presenter’s   mon ensemble of devices that work in concert to assist
computer and creating the combined view) and causes          the users.
interruptions to the discussion.                                 Smart meeting rooms are multi-display environments.
    Moreover, in the light of the ongoing discussion, a      In fact, through the mix of dynamic and static displays,
physicist comes up with a new hypothesis about his           smart meeting rooms are heterogeneous multi-display
data, only recently generated by a new climate model.        environments. Displays with different properties (i.e.,
In order to discuss this hypothesis on the spot with         size, resolution, pixel density, etc.) from tablets up to
the gathered experts, new visual representations of the      large public displays can be utilized simultaneously to
physicist’s data need to be created and dynamically in-      communicate visual information efficiently.
cluded into the current presentation. This requires even         The technical properties of smart meeting rooms en-
more effort and results in the discussion being post-        able multiple users to work collaboratively. In this con-
poned.                                                       text, smart means that customized user assistance is
    This is where our solution comes into play. The ap-      provided based on the current state of the environment
proach presented in this paper facilitates such dynamic      and its users. Typically the users take on different roles
discussions and allows for a sufficient degree of flexi-     (e.g., presenter or audience), which are associated with
bility when presenting visual representations. Dynam-        different preferences and aims. According to their role,
ically raised requests can be accommodated on the fly        the users work together in a defined scenario (e.g., dis-
and the discussion can continue without wasting the          cussion or presentation) and even may change between
precious time of the attending experts.                      these scenarios [18].
    Next, we will take a closer look at the environment          In summary, we can pinpoint the task of present-
in which the discussion takes place.                         ing visual representations in a smart meeting room for
                                                             the purpose of discussing insights among multiple do-
                                                             main experts. A visualization infrastructure specifically
2.2 The Environment: Smart Meeting Rooms                     tailored for such a scenario will be introduced next.

The classic setup for such a discussion would be a sin-
gle PC running a presentation of slides. The slides are      3 Supporting Discussion in Smart Meeting
usually shown on a large public display (e.g., projec-       Rooms
tor) to share the visual information with the discussion
participants. Using only a single public display for pre-    Before we go into any details, we will first discuss our
sentation and discussion of data limits the number of        goals and associated requirements. An overview of the
simultaneously presentable views and thus the infor-         infrastructure will pave the way for the description of
mation that can be communicated and discussed at a           its individual components.
time.
    Modern visualization environments, such as smart
meeting rooms, offer new possibilities to extend the lim-    3.1 Goals and Requirements
its of classic work spaces. Smart meeting rooms aim to
support users in working collaboratively to reach a com-     Forming a big picture about some analyzed data in-
mon goal. They are a form of smart environments [10]:        volves combining insights captured in multiple dedi-
“A small world where all kinds of smart devices are          cated visual representations. Therefore, our first goal
continuously working to make inhabitants’ lives more         is to increase the quantity of information that can be
comfortable.”                                                shown at a time by utilizing the displays available in
    Smart meeting rooms have three basic characteris-        the smart meeting room. This requires an appropriate
tics that need to be taken into account when develop-        compilation of the visual information to be communi-
ing visualization solutions. Smart meeting rooms are:        cated and its automatic placement on the displays, tak-
(1) ad-hoc, (2) multi-display, and (3) multi-user envi-      ing into account the configuration and properties of the
ronments.                                                    displays as well as the roles, locations, and view direc-
    Ad-hoc means that smart meeting rooms integrate          tions of the users. For example, a large public display
devices brought in by the users dynamically [7]. So in       located close to the presenter should be chosen as the
addition to devices that are static (e.g., sensors or pro-   main display, whereas displays being located behind the
jectors and canvases), there will also be devices that       audience should be avoided.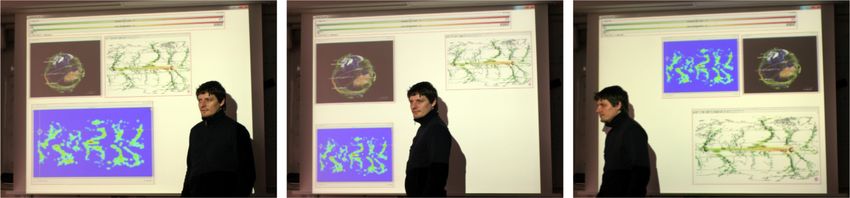
4                                                                                                      Axel Radloff et al.

    Forming a big picture in the course of a discussion is
a dynamic process with changing demands. Therefore,
our second goal is to provide sufficient flexibility allow-
ing the users to react to changing demands effortlessly,
but within limits reasonable in a discussion scenario. In
the first place, this means that the presenter must be
enabled to select the visual content that is relevant to
the current state of the discussion and hence needs to
be displayed. As the discussion goes on, the selection
will be updated by all users and the multi-display en-
vironment has to automatically adjust itself to the new
situation.
    When it comes to discussing details of the data, the      Fig. 1 The displays of the smart meeting room show different
                                                              visualization views originating from the presenter’s and the
visual representations should provide more details as         attendee’s devices.
well. For example, when a discussion shifts from a global
perspective to certain areas of the tropical rain forest,
the presenter must be able to mark the new regions            develop a unified solution for displaying views and in-
of interest. In turn, the system has to provide higher        teracting with them.
resolution images of the marked parts of the data and             Displaying the views is supported by four basic com-
display them to the audience on the fly.                      ponents of the infrastructure: view generation, view group-
    As indicated earlier, the demands during a discus-        ing, view mapping, and view layout. Interacting with
sion may change even more drastically. At some point,         views is enabled by three components: interaction grab-
it might even become necessary to re-encode certain           bing, interaction mapping, and interaction handling.
visual representations or to create entirely new ones.        Each of these components will be described in more
In such cases, participants with sufficient expertise can     detail in the following paragraphs.
create new visual representations on their own devices
using the visualization tools they are familiar with. Our     3.2.1 Display components
infrastructure must provide the means to dynamically
integrate the new visual representations into the ongo-       First we will briefly explain the components that han-
ing discussion.                                               dle the display of views. For more details, we refer the
    In the light of the addressed task and environment,       interested reader to the explanations in [30].
the aforementioned aspects can be summarized into two
technology-oriented research questions:                       View generation The view generation component han-
                                                              dles the process of creating views and inserting them
 – How can we present visual content in a multi-display       into the environment. As we do not want to impose
   environment?                                               any restrictions on what visualization software can be
 – How can we cope with changing demands of dy-               applied, we propose a twofold strategy:
   namic discussions?
                                                               – Exposing views: For visualization software that is
                                                                 dedicated to be run in the smart environment, we
3.2 Visualization Infrastructure                                 provide an API that can be used to expose views to
                                                                 the environment.
As an answer to the previous questions, we propose a           – Grabbing views: For visualization software that is
visualization infrastructure and its implementation in           unaware of being used in the smart environment,
a smart meeting room. This section outlines the basic            we implemented tools that allow us to grab visual
components.                                                      content from the devices participating in the envi-
    The central element we are handling in the infras-           ronment.
tructure are visual representations of data. For brevity
we call visual representations views from now on. The             Both strategies have advantages and disadvantages.
two key aspects that need to be considered by the in-         Using the API to expose views requires modifying ex-
frastructure are the display of views and the interaction     isting visualization software, but on the positive side,
with views. In previous work, display and interaction         the exposed views can be generated according to the
have been investigated separately in [30] and [29], re-       specific needs of the environment and can even be en-
spectively. Here, we bring together both aspects and          riched with semantic meta-information about what is
Supporting Presentation and Discussion of Visualization Results in Smart Meeting Rooms                               5

                                                              It is worth reiterating that this functionality does not
                                                              depend on the underlying visualization software, but
                                                              is provided for free by the integration of JPEG2000 in
                                                              our infrastructure. This means that any view being pre-
                                                              sented using our solution can be explored at different
                                                              levels of detail for varying regions of interest without
                                                              any additional effort on the view generation side.
                                                                  In summary, the result of the view generation pro-
Fig. 2 Focus+context embedding of a dynamically defined       cess is a collection of JPEG2000-encoded views. In or-
region of interest.                                           der to compute a suitable arrangement of views in the
                                                              smart environment, it is necessary to create a semanti-
                                                              cally meaningful grouping of the views.
being shown in the views. The grabbing-based strat-
egy has the advantage of being applicable to virtually        View grouping The view grouping component is needed
any visualization software, but on the other hand, the        to define the affiliation of views. Views that seman-
created views contain no other information than the           tically belong together (in terms of the visualization
grabbed pixels.                                               task to be addressed) are grouped into in so-called view
    Taken together, the view generation strategies are        packages.
capable of capturing multiple visualization views from            Although an automatic generation of view packages
heterogeneous sources in a smart meeting room (see            would be desirable, the number and complexity of influ-
Figure 1). This is a key benefit of our approach. The         encing factors makes this goal hard to achieve, and the
presenter can prepare a deck of views prior to the dis-       situation is even more complicated without appropri-
cussion in an authoring process. Should new or alterna-       ate meta-information (e.g., when using view grabbing).
tive views be needed during the discussion, anyone from       Therefore, we resort to the users’ knowledge and ex-
the audience can dynamically contribute new content.          perience in authoring semantically meaningful groups
This way, a seamless integration and presentation of          of views. This gives users the freedom to express their
views is supported, and discussions can continue with         definition of ’semantically meaningful’. For example, a
only moderate interruptions. Otherwise, delegating the        view package could include views that show the same
task of generating new views to a dedicated visualiza-        data differently, views that are needed at a particular
tion expert would result in longer breaks, adversely af-      time during the discussion, or views that illustrate the
fecting the flow of the discussion.                           development of the data over a number of time steps.
    In order to achieve scalability in terms of the dif-          Technically, views are grouped using a simple drag
ferent display resolutions available in the smart envi-       and drop GUI. The GUI enables the presenter to group
ronment, views (exposed or grabbed) need to be en-            views in a pre-process in preparation of a discussion,
coded into a multi-resolution representation. For this        but also anyone from the audience to integrate new
purpose, we employ the capabilities of the JPEG2000           views in an ad-hoc fashion during a discussion should
standard [37]. This standard implements the philosophy        it become necessary. By generating and deploying view
of encode once and decode many different ways. For the        packages, the users also select the views to be presented
encoding, we use the resolution dictated by the data,         at a certain time during the discussion.
which is typically higher than the resolution of the dis-         With appropriately defined view packages, we can
plays. JPEG2000 then allows us to later decode views          later support the principle of spatial proximity equals
with exact the resolution needed, be it the original data     semantic similarity when it comes to mapping view
resolution for an HD projection or a lower-resolution for     packages to the displays available in the smart meet-
a combined display of several views.                          ing room.
    Additionally, the JPEG2000 encoding facilitates zoom-
ing into details for user-defined regions of interest with-   View mapping The view mapping component automat-
out generating entirely new views. Thanks to JPEG2000’s       ically determines which views are to be shown on which
multi-level content description, regions of interest can      display. To generate a suitable distribution of views in
be scaled to make them bigger and easier to see. We           the smart meeting room, a number of aspects need to
support the classic detail-only, overview+context, and        be taken into account. In the first place, the seman-
focus+context strategies for presenting enlarged details      tic grouping of views determines which views should be
and the corresponding context. Figure 2 illustrates the       shown together in close proximity (e.g., on the same dis-
classic fisheye embedding of the focus into the context.      play or on adjacent displays). The positions and viewing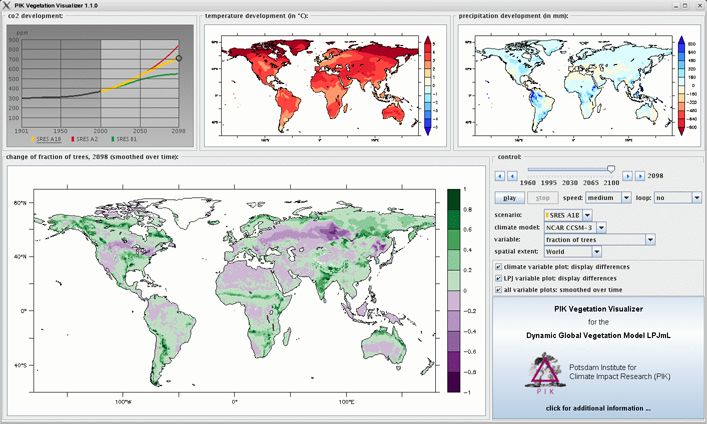
6                                                                                                           Axel Radloff et al.

Fig. 3 The layout mechanism arranges views such that they are not occluded by the presenter walking in front of the canvas.

directions of the users are needed to be able to map the            by combining force-directed placement and pressure-
views to displays currently being visible to the audience.          based resizing of views (similar to [3]). As the number
Furthermore, we have to consider the display properties             of views per display is not excessive, it is possible to
as it makes no sense to map a high-resolution view to               compute the layout continuously according to the cur-
a small, low-resolution screen.                                     rent situation of the environment. However, we have
    The problem of assigning views to displays can be               to take care that the layout remains reasonably stable
formulated as an optimization problem whose objec-                  and does not flicker. We deal with this by computing
tive is to ensure spatial quality qs , temporal continuity          a quality function. Only if the quality of a newly com-
(quality qt ) and semantic proximity (quality qp ):                 puted layout is significantly improved (above a certain
                                                                    threshold) will it be smoothly blended in to replace the
q(mt−1 , mt ) = a · qs (mt ) + b · qt (mt−1 , mt ) + c · qp (mt )   existing layout.
The different qualities are weighted (a, b, c) and mt−1                 Designed this way, the layout mechanism is capa-
and mt denote consecutive mappings. Spatial quality                 ble of producing good initial view layouts, integrating
concerns the visibility of views, which is influenced,              views generated by any user in the audience on the fly,
for example, by the distance and the angle between a                and adjusting them dynamically as the discussion goes
user and a display. Temporal quality qt rates changes of            on. An example for the dynamic adjustment is given
view-to-display assignments. Semantic proximity qp de-              in Figure 3, where the layout mechanism is geared to-
scribes the spatial relationship of all views of the same           ward preventing views from being occluded by a user
view package. As the optimization is too complex to be              stepping in front of a display canvas. Although the lay-
solved analytically, we utilize a genetic algorithm [25]            out of views is updated with regard to the position of
to find a local optimum within reasonable time [30].                the person, the iterative nature of our algorithm avoids
    As a result, views belonging semantically together              disruptive changes to maintain user orientation at all
are mapped to the same display, and the displays are                times.
chosen such that views currently being discussed appear                 Suitability of our layout component has been con-
next to the presenter, while care is taken that they are            firmed in a small study. We showed 14 different lay-
also sufficiently visible to the audience. The next step            outs with different content to 20 users who were asked
is to lay out the individual views on their assigned dis-           to identify information encoded in these views and to
plays.                                                              compare the identified information for similarities in the
                                                                    underlying data. As a result, the feedback of the users
View layout The view layout component arranges the                  indicates that they were satisfied with the layouts gen-
views assigned to a certain display. While it is possi-             erated by our solution.
ble to use pre-defined layouts to prepare a discussion,                 The view layout is the final stage of the display
the ad-hoc character of the smart meeting room also                 pipeline of our infrastructure. Now we can move on
demands taking into account dynamic changes, includ-                to investigating the aspect of interaction in the smart
ing requests for details on demand or movements of                  meeting room.
users in the environment. We employ an iterative lay-
out mechanism that produces initial results quickly and             3.2.2 Interaction components
can accommodate dynamic changes.
    A view layout is characterized by two aspects: the              The previous sections focused on displaying views in
positions and the sizes at which views are to be shown              the smart meeting room. The described mechanisms,
on a display. We consider both aspects simultaneously               among other aspects, also consider the users’ positions
Supporting Presentation and Discussion of Visualization Results in Smart Meeting Rooms 7
and viewing directions. In this sense, users always in-
teract with the system, but they do so implicitly (e.g.,
by walking in the room). Yet we have to give the users
the opportunity to interact explicitly with the visual-
izations depicted in the environment. This can be neces-
sary, for example, in situations where the environment
has only incomplete information about the users intents
or where aspects are involved that cannot be sensed ap-
propriately by the environment.
Therefore, our display components have to be cou-
pled with suitable interaction components. These com-
ponents have to capture the interaction taking place on
the different devices, map them according to the cur-
rent arrangement of views, and handle the interaction
to achieve the effects intended by the users.
In most general terms, one can differentiate two
kinds of interaction: (1) interaction with views and (2)
interaction with the content depicted in a view. By in-
teraction with views we mean operations such as mov-
Fig. 4 During the discussion, the presenter can adjust the
ing a view from one display to another, rearranging the layout of views easily by picking views (top), relocating views
view layout manually, or setting up a region of interest (center), and resizing views (bottom).
to be magnified. On the other hand, interaction with
a view’s content means operating directly on the de-
picted data, for example, to select relevant data items. handling the interaction. The interaction mapper de-
This requires propagating interactions through to the termines the display where the interaction is performed
application that generated a view. There, the interac- and delegates the interaction to the device that is re-
tion is handled and corresponding visual feedback is sponsible for handling the interaction. To this end, the
generated to update the view. interaction mapper utilizes knowledge about the posi-
To make these interactions possible across device tions of the displays in the room and the layout of views
and display boundaries, dedicated interaction compo- across the room. We also consider the computing device
nents have been developed for our infrastructure. In the that generated a view in order to support interaction
following, we describe them briefly. For more detailed with the view’s content. But this is only possible if the
descriptions, we refer the interested reader to [29]. device is still part of the environment.
Interaction handling The interaction handler interprets
Interaction grabbing The interaction grabber compo-
the interaction and executes the necessary actions. As
nent is required to gather the interaction taking place
mentioned earlier, we differentiate:
on the devices of the smart meeting room. As the inter-
action can originate from different interaction devices, Interaction with views: The generic intermediate descrip-
we need to convert the interactions into a generic in- tion of the interaction is interpreted by the inter-
termediate description that abstracts from the details action handler that is in charge of managing the
of the individual devices. On the most general level, views in the environment. Operations such as relo-
our intermediate description supports pointing interac- cating or resizing a view are handled at this stage.
tion (e.g., with mouse or Wiimote) and trigger interac- For the purpose of illustration, Figure 4 shows how
tion (e.g., key strokes or mouse buttons). The generic a user adjusts the views laid out on a canvas. Using
description based on pointing and triggering is suffi- a Wiimote, the user picks a view, relocates it, and
ciently expressive to cover a broad range of interaction adjusts its size as needed. As the JPEG2000-based
in the smart environment, including classic mouse and regions of interest are also independent of the un-
keyboard interaction as well as modern tracking-based derlying visualization software, any such operations
interaction using controllers. (e.g., the fish eye magnification or overview + detail
as detailed in [31]) are carried out at this stage as
Interaction mapping Once the intermediate description well.
of the interaction has been encoded, the next step is Interaction with a view’s content: The generic interme-
to map the interaction to the device responsible for diate description of the interaction, is transformed8 Axel Radloff et al.
to the local space of the view being interacted with. Another aspect worthy of discussion is the handling
The transformed interaction description is then del- of potentially conflicting interaction in a multi-user con-
egated to and executed by the application that gen- text. This is a classic problem to which various ap-
erated the view. In turn, the view generation com- proaches exist (e.g., [8, 11, 35]), but none provides a uni-
ponent is set up to receive and process the visual versal answer. We do not claim to have a definite solu-
feedback (in the form of a new view) generated by tion either. Yet the setting that we address in our work,
the application. a setting in which a presenter is in charge of leading
and moderating the discussion, a pragmatic solution is
The three components for grabbing, mapping, and possible. To avoid conflicts, we assume that the pre-
handling interaction in our infrastructure enable the senter grants permission to individual members of the
presenter and anyone from the audience (if granted) audience to carry out interactions affecting any public
to adjust views and their content according to current displays. All other participants are not allowed to in-
state of the discussion. It is worth mentioning that the teract until the presenter advises them otherwise. In a
interaction components enable the users to carry out sense, our solution is not a technical one, but a social
the necessary steps with any available interaction de- one where the presenter “controls” the audience.
vice. This is a significant benefit over classic discussion
scenarios, where interaction is usually reserved for the
presenter only, who has to sit down at a particular ma- 3.4 Summary
chine in order to interact. Moreover, if someone from
the audience would like to contribute, he or she is usu- According to the requirements formulated in Section 3.1,
ally required to use the presenter’s device or to attach we can conclude the following. Using our architecture
the personal device to a projector, which is inconve- with its seven display and interaction components, the
nient and causes interruption of the discussion. With demands of discussion scenarios can be addressed. Views
our approach these adverse effects can be avoided. showing visual representations of the studied data can
be generated and published in an ad-hoc manner us-
ing any device. The views can be grouped according to
3.3 Discussion semantic needs and they are mapped to the available
displays based on certain quality criteria.
Our approach supports both automatic layout and in- Interaction with the displayed views and the visual
teractive manipulation. In the first place, views are as- representations they show is supported across devices.
signed to and arranged at display devices through auto- Views can be manipulated on an abstract level (e.g.,
matic methods. On top of that, we provide interactive view selection, view placement, view resizing) indepen-
methods allowing presenter and audience to manipu- dent of the original visualization software. Moreover, it
late the layout assignment and appearance of the views. is also possible to feed back the interaction that takes
This raises the question of balancing automatic and in- place in the environment to the view-generating visu-
teractive means and addressing consistency during the alization software, for example, to re-parameterize the
discussion. visual encoding.
A basic requirement is that an automatic algorithm In the next section, we take a look at some details
should not override an interactive manipulation of a of the implementation of our infrastructure in a smart
user unless it is explicitly intended. This requirement meeting room.
is dealt with as follows. Based on the initial generation
and grouping of views, the assignment and layout on
the display devices take place. The view mapping and 4 Implementation Details
layout are constantly updated and improved in a back-
ground process. If an interaction occurs (e.g., rearrang- The approach introduced before has been instantiated
ing or resizing views, moving views between displays, or in a prototypical implementation in a smart meeting
even adding and removing views), then the automatic room. First we will briefly characterize our smart meet-
improvement strategies affecting the display(s) where ing room, including the physical and the communica-
the interaction took place are halted. This includes the tion environment. Then, we will give implementation
view mapping and the automatic layout on the specific details regarding the display and the interaction com-
display device. Thus, no automatic process overrides in- ponents.
teractive changes of the presenter or the audience. Of The smart meeting room basically contains seven
course, it is possible to reactivate the automatic map- displays, including mobile laptop displays and static
ping and layout at any time when deemed necessary. projectors connected to regular PCs as illustrated inSupporting Presentation and Discussion of Visualization Results in Smart Meeting Rooms 9
Fig. 5 Scene in our smart lab. The smart view management is used to display the information, while the smart interaction
management enables the presenter to interact with all displayed views.
Figure 5. Users can bring their own devices, which are Figure 6 provides an architectural overview of our
seamlessly integrated into the environment using wire- implementation. In the following, we elaborate on some
less network connections. of the details of the display and interaction components
Several sensor devices monitor the state of the envi- integrated in our approach.
ronment (e.g., lightness or temperature). For tracking
the environment’s inhabitants, the smart meeting room Display components The display components described
is equipped with Ubisense [39] devices, which are based before (view generation, view grouping, view mapping,
on small tags and ultra-wide band signals, and a Sense- view layout) are shown on the left hand side of Figure 6.
floor [32], which is based on measuring pressure on the The views are generated either by using an API or
floor tiles. As interaction devices, we provide regular by grabbing pixels. As mentioned earlier, the API-based
keyboard and mice as well as Wiimote controllers con- solution requires extending existing visualization soft-
nected to PCs and laptops. ware with appropriate calls to API functions in order
Our implementation builds upon service-oriented con- to expose visual content and meta-information. When
cepts developed by Thiede et al. [38] and a middleware using the grabbing-based approach, the user selects a
called Helferlein by Bader et al. [5, 6]. Based on the certain region of the device screen. The pixels contained
service-oriented concept small pieces of software with in the selected region are captured to create a new view.
well-defined data input and output interfaces provide Native JAVA functionality is utilized to capture the im-
information about the environment (e.g., the Ubisense age.
user tracking data), map these data to coordinates of The outcome of the two methods of the view gener-
the smart meeting room, and provide pre-processed lo- ation is a view containing the image data encoded with
cation information about the users for other applica- JPEG2000 available for the presentation in the smart
tions. This information is stored in the form of tuples meeting room. The views are transmitted to the man-
in a so-called tuple space [13], which is implemented agement component via a network connection. Both ap-
in the Helferlein middleware. All applications running proaches can be used simultaneously with one or more
in the smart meeting room can access the information personal devices. To this end, a connection to the smart
about the environment and put it to use for different meeting room’s network and the ability to run the soft-
kinds of user assistance. In a sense, Helferlein’s tuple ware required to generate views are preconditions for
space is the information backbone of the smart meet- a personal device to participate in the ad-hoc environ-
ing room. ment.
Our implementation of the display and interaction The view grouping is carried out interactively by the
components described earlier builds upon this infras- user with an easy-to-use graphical tool. This tool col-
tructure. We use Java as the common programming lects all views and possibly already existing view pack-
language and runtime environment. This makes our ap- ages from the tuple space and visualizes them in a ba-
proach largely platform independent, but may require sic GUI. New views can be added to existing groups
new users to install the necessary runtime libraries. But or groups can be reconfigured using simple drag and
other than that, there are no restrictions regarding the drop gestures. Once all updates are finished, the cur-
OS or the applications to be used. rent view package configuration is fetched back to the10 Axel Radloff et al.
Fig. 6 Architecture of our infrastructure for presenter support in smart meeting rooms.
smart meeting room’s tuple space. The view grouping force-directed placement and pressure-based resizing is
GUI can be started as a single application at any de- performed. For the force-directed placement, attract-
vice participating in the environment; the GUI itself is ing and repulsing forces are defined automatically be-
implemented in JAVA. tween the views. For the pressure-based resizing, an in-
The view mapping is encapsulated in a software ner pressure of any view (regarding the actual size and
component running in the smart meeting room with- the optimal size) and an outer pressure (with regards
out any specific user interface for neither the presenter to the used display space) are defined. These forces are
nor the audience. Through the middleware it gathers processed by the layout algorithm.
the necessary information about the room (user po- Furthermore, the layout algorithm is capable of tak-
sitions and view directions, display device positions, ing the users’ positions into account to avoid physical
sizes and orientations) and the views and view pack- occlusion of views displayed via a projector to a projec-
ages. Based on this information, a genetic algorithm tion surface. The physical positions of projectors and
tries to optimize a quality function to assign the views users in the smart meeting room and the size of the
to the available display devices. For this, random view- presented display surface are collected from the tuple
display mappings are generated. These mappings are space. Based on this information, projection cones and
rated based on the quality function (see Section 3.2.1). their intersections with the users are calculated. The
Considering the rating, new mappings are generated intersections are projected to the canvases and mapped
that are rated again. The genetic algorithm converges into the display space. Through this we obtain dummy
to a good mapping quickly. views that represent the areas of the display surfaces
Finally, the views are transferred to the display de- that are occluded by users. These dummy views oc-
vices where the view layout takes place. The layout cupy display space which prevent the view layout to
strategy described in Section 3.2.1 considers the fol- place any other real view in that area. More details on
lowing information: the resolution and aspect ratio of this procedure can be found in [30].
the display device, the number of views to be displayed,
and the properties of the individual views (e.g., aspect Interaction components The three interaction compo-
ratio and original size). Based on this information, a nents of our approach (interaction grabber, interactionSupporting Presentation and Discussion of Visualization Results in Smart Meeting Rooms 11
mapper, and interaction handler) are shown on the right
hand side of Figure 6.
The interaction grabber gathers the interaction from
the individual devices. To make this possible, a software
service is started on a personal device, monitoring the
interactions of connected interaction devices. The inter-
action events are converted into our generic interaction
description, representing pointer movement and trigger
interactions. This description of a single event is pro-
vided to the tuple space of the smart meeting room.
In the next step, the interaction mapper assigns this
interaction description to a certain display device. This
is achieved by a relative pointer movement monitoring,
Fig. 7 The PIK vegetation visualizer (PVV).
based on the positions of the public displays (queried
from tuple space) and a defined origin position of a
pointer. Any interaction device participating in the ad- Using JPEG2000 we can somewhat enhance our pixel-
hoc environment has its own pointer. Multiple pointers oriented solution with flexible regions of interest and
can be used simultaneously. Moving the pointer out of a multi-resolution encoding. The API-based view grab-
display device causes the interaction mapper to assign bing provides some rudimentary ways of considering
the interaction to the adjacent display device. additional meta-information for views. But incorporat-
In the last step, the interaction is interpreted using ing sophisticated content-aware mechanisms that define
the interaction handler. It converts the generic interac- views based on their semantics would require substan-
tion description into specific events performed on the tial additional effort.
assigned display device. Although our implementation is not a production-
Through this interaction process, it is technically ready system, we were able to run test scenarios with
possible for multiple users to interact with all displayed visualization applications in the smart meeting room.
views simultaneously. The views can be resized, reposi- The next paragraphs will illustrate this.
tioned, assigned to other display devices, zoomed, and
so forth. Note that neither the original image data have
5 Application to Climate Impact Research
to be modified for such manipulations nor does the orig-
inal software need to provide functionality for resizing In this section, we illustrate how our approach can be
or zooming. All this is realized by utilizing the capa- applied in the context of climate impact research. Cli-
bilities of the JPEG2000 encoding. For further imple- mate impact research requires interdisciplinary collab-
mentation details on the interaction process, we refer oration of experts from different domains (e.g., physics,
to [29]. statistics, geology, or computer science). For these ex-
perts exploration and analysis of large amounts of data
Implications and limitations As the reader can guess, is day-to-day business. Once research results have been
many technical details need to be taken care of to get crystallized from the data, they need to be communi-
such a complex and dynamic environment up and run- cated to fellow researchers or even the public.
ning. We should admit that the implementation of our However, communicating the research results is a
approach as well as the smart meeting room itself are challenging problem, because of the complexity of the
work in progress with ongoing contributions from many data and the heterogeneity of the collaborating researchers.
researchers. Interactive visualization can play a key role in convey-
Apparently such a setting implies some dependen- ing complex information and bridging the gaps between
cies and limitations. In particular, we depend on the the different scientific languages spoken by the involved
middleware Helferlein, which provides us with all the experts. In this section, we demonstrate how visualiza-
information we need about the environment and the tion in a smart meeting room using our solution can im-
users. This information is the basis for the dynamic prove the current practice of presenting and discussing
mapping and layout of views on the multiple displays. research results among climate impact researchers.
Secondly, our approach is limited to views defined by As the basis for our test runs we used the PIK Veg-
nothing else but pixels. Pixels are the least common de- etation Visualizer (PVV), a tool for interactive visual-
nominator to integrate contents from heterogeneous de- ization of biosphere simulation data [27, 49]. PVV is ap-
vices of multiple users for the purpose of presentation. plied by climate researchers on a regular basis to present12 Axel Radloff et al.
and discuss the diverging outcomes of alternative mod- ability of the devices in the smart meeting room leads
els, different simulations, and associated parameteriza- to two fundamental novel options.
tions. As the data to be visualized is very large, PVV First, applying the display facilities of the room, it is
uses an off-line phase to pre-calculate visual represen- now possible to compare several climate model drivers
tations for a well-defined set of models and parameter (e.g. temperature and precipitation) for geographical
settings. This results in a large image database. During regions of interest over multiple climate models together
a discussion, PVV allows the presenter (not the audi- with multiple eco-system variables such as forest cover-
ence) to query the image database according to time age and carbon storage at a glance. The view grouping
intervals, models, or parameters via standard GUI el- helps to steer and structure the layout. Views related
ements. Up to four images, one focus image and three to the core topic of the discussion are mapped to the
context images, are shown as a fixed layout as depicted primary displays. Side topics that surface during the
in Figure 7. discussion can be integrated on-the-fly, but are usually
In daily work, PVV is applied in different situations, parked on secondary displays until they become the fo-
including presentations to larger expert or non-expert cus of the discussion. By using this multi-view, multi-
audiences on standard projectors, presentations at ex- display approach, it becomes much easier to answer
hibitions or open house events on medium or large high- complex questions related to complex, multi-faceted cli-
resolution displays, as well as presentations and discus- mate data.
sions with guest scientists or decision-makers in meeting Second, the presenter can change both the views and
rooms with different presentation devices. In these ap- the layout to match the current topic of interest. For
plication scenarios, the climate researchers are facing example, it is possible to move a view to another display
always the same limitations of the original version of to support a requested comparison with other views. On
the PVV tool: the display, where the view is inserted, all other views
automatically scale down to free space for the new view.
– fixed number of pre-calculated resolutions, Analogously, the views of the source display scale up to
– fixed window layout, exploit the vacant space. The JPEG2000 coding holds
– restricted comparative visualization only, all necessary information to carry out these operations.
– interaction restricted to the presenter. But not only the presenter, also the attendees can eas-
To overcome these limitations, we extended PVV ily move views between displays or zoom into regions of
such that it uses our API to expose visualization views interest with their personal interaction devices. By do-
to the smart meeting room. The following improve- ing so, they can emphasize their statements or illustrate
ments could be achieved. their questions. They can also generate new views, e.g.,
In the original PVV, a large number of images were showing the behavior of further variables, and assign
generated at multiple resolutions suitable for common them to a view package or directly to a certain display.
display devices. However, the underlying data resolu- In this way, many different aspects of the climate
tion is much higher, so the generated images show only data can be visualized and discussed in relation to cli-
a fraction of the information contained in the data. The mate impacts. This facilitates getting the big picture
integration of JPEG2000 makes it now possible to en- around the complex relationships to be studied in cli-
code all images at full detail and decode exactly the mate impact research, going clearly beyond the func-
level of detail needed for a certain task or display de- tionality offered by the original PVV tool.
vice. This can be done on-the-fly, without resorting to The technical implementation in the smart meet-
any settings of the original PVV GUI controls. ing room enables the presenter to be fully in charge of
A major improvement over the original practice of what and how visual information is shown and allows
applying PVV in standard meeting room is the switch the audience to add content on demand and partici-
to the smart meeting room. In a experimental setup, pate actively. The interaction with the system, even in
we tested how a typical discussion scenario of climate its prototypical state, is designed to be easy enough to
researchers can be supported (see Figure 5). In this sce- be operated by users who are not necessarily experts in
nario, multiple experts from climate science, hydrology visualization or multi-display systems.
and ecology in the room discuss the potential global and
local impacts of climate change, using the options the
smart meeting room offers in combination with their 6 Related Work
own notebooks, smartphones, or portable projectors.
The integration of such mobile devices is realized by Our solution is inline with several other approaches
the Helferlein middleware (see Section 4). The avail- and research prototypes that address the integrationSupporting Presentation and Discussion of Visualization Results in Smart Meeting Rooms 13
of multiple possibly large displays and novel interac- applications nor do they support the automatic config-
tion modalities. Here, we briefly review relevant related uration of the information display.
work that is concerned with information presentation In summary, the existing solutions have different re-
in multi-display environments in general. More specif- strictions. They depend on particular features of some
ically, we look at approaches that (1) provide and dis- OS, they depend on particular applications or data struc-
play visual representations and (2) interactively manip- tures, or they lack automatic configuration. Our ap-
ulate these visual representations. proach supports heterogeneous devices, integrates views
from different applications and requires no specific data
6.1 Display of visual representations structures, just pixels, and we support automatic map-
ping and layout of contents.
There are a few systems that address the presenta-
tion of information in multi-display environments. The
existing approaches can be outlined with respect to
three categories: (1) operating-system-specific informa- 6.2 Interaction with visual representations
tion presentation, (2) data-based information presenta-
tion, and (3) image-based information presentation. The question of interacting in multi-display environ-
OS-specific information presentation systems, such ments is tackled differently in the literature. There are
as the Windows-based WinCuts [36] or the Linux-based solutions that (1) make mouse and keyboard available
Deskotheque [40, 42], utilize features of a specific OS for all displays or (2) utilize new interaction devices.
(e.g., GDI under Windows or XWindow under Linux
PointRight [21] allows for interacting with mouse
or Unix) to display windows and graphical primitives.
and keyboard in iRoom by utilizing the iROS middle-
Such systems master the technical difficulties for infor-
ware. Clicky [4] uses a specific server-client architec-
mation presentation. However, they alone are not suffi-
ture. 3D geometry models of the display devices can be
cient for smart meeting rooms, because smart meeting
used to support relative mouse pointer navigation via
rooms are ad-hoc environments where users can bring
the Perspective Cursor [26]. In Deskotheque the use of
their own devices with different operating systems.
mouse and keyboard across display boundaries is sup-
Data-based information presentation systems trans-
ported through a modified synergy client [41,43].
fer data to a public display device, where the data are
processed by a certain application that generates the vi- New interaction modalities applied in multi-display
sual output to be displayed. Examples are iRoom [20], environments include laser pointers [2, 12, 28], the XWand
Dynamo [17], the multi-user, multi-display molecular [47, 48], and the Nintendo Wiimote [24]. Gesture-based
visualization application in [11], the ZOIL framework interaction is possible as well [22, 19]. To the best of
in [19], or the VisPorter approach in [9]. Data-based in- our knowledge, there is no approach combining classic
formation presentation allows for dynamic generation of mouse and keyboard and new modalities for interaction
visual representations for certain situations, demands, in smart meeting rooms.
and tasks. However, these systems are usually limited Furthermore, there are a few approaches dealing
to specific applications and are tightly intertwined with with more than just the technical basis for displaying
the environment. With our approach for smart meeting of and interacting with visual representations in multi-
rooms, we strive for flexible applicability across appli- display environments. The automatic arrangement of
cation boundaries. the visual content has been addressed in [40, 45]. Show-
Image-based information presentation systems gen- ing relations between applications by means of visual
erate visual representations of the data on a source de- linking was proposed in [34, 44]. Interactive annotations
vice and transfer them as plain image data to the dis- of pre-defined visual content is discussed in [14, 15, 23].
play device that is to show the data. An example is However, the existing approaches are not capable of
WeSpace [46], which uses a client-server architecture to modifying visual representations on the fly.
collect and transmit content from multiple private de- Taken together, we see several existing solutions all
vices to a large public display. This is accomplished via with individual strengths and limitations. All these ap-
a modified VNC client. As such, image-based informa- proaches document the relevance of research on multi-
tion presentation systems are suited for smart meeting user multi-display environments. With our work, we
rooms. They are not restricted to certain operating sys- are part of an ongoing movement to go beyond the
tems or applications and can be used in a dynamic ad- classic single-user on a desktop machine pattern to-
hoc environment. However, current approaches neither ward richly supported and flexibly applicable multi-user
deal conceptually with the visual outputs of different multi-display environments.You can also read