From scanners to cell phones: neural and real-world responses to social evaluation in adolescent girls - Jamie Hanson
←
→
Page content transcription
If your browser does not render page correctly, please read the page content below
Social Cognitive and Affective Neuroscience, 2021, 1–13
doi: 10.1093/scan/nsab038
Advance Access Publication Date: 26 March 2021
Original Manuscript
From scanners to cell phones: neural and real-world
Downloaded from https://academic.oup.com/scan/advance-article/doi/10.1093/scan/nsab038/6188977 by guest on 07 May 2021
responses to social evaluation in adolescent girls
Stefanie L. Sequeira,1 Jennifer S. Silk,1 Elizabeth A. Edershile,1
Neil P. Jones,2 Jamie L. Hanson,1 Erika E. Forbes,2 and
Cecile D. Ladouceur2
1
Department of Psychology, University of Pittsburgh, Pittsburgh, PA 15213, USA, and 2 Department of
Psychiatry, University of Pittsburgh, Pittsburgh, PA 15213, USA
Correspondence should be addressed to Stefanie L. Sequeira, Department of Psychology, University of Pittsburgh, 210 South Bouquet Street, Pittsburgh,
PA 15213, USA. E-mail: sls234@pitt.edu.
Abstract
While expanded use of neuroimaging seemed promising to elucidate typical and atypical elements of social sensitivity, in
many ways progress in this space has stalled. This is in part due to a disconnection between neurobiological measurements
and behavior outside of the laboratory. The present study uses a developmentally salient fMRI computer task and novel
ecological momentary assessment protocol to examine whether early adolescent females (n = 76; ages 11–13) with greater
neural reactivity to social rejection actually report greater emotional reactivity following negative interactions with peers
in daily life. As hypothesized, associations were found between reactivity to perceived social threat in daily life and neural
activity in threat-related brain regions, including the left amygdala and bilateral insula, to peer rejection relative to a control
condition. Additionally, daily life reactivity to perceived social threat was associated with functional connectivity between the
left amygdala and dorsomedial prefrontal cortex during rejection feedback. Unexpectedly, daily life social threat reactivity
was also related to heightened amygdala and insula activation to peer acceptance relative to a control condition. These
findings may inform key brain–behavior associations supporting sensitivity to social evaluation in adolescence.
Key words: adolescence; peers; fMRI; ecological momentary assessment
Neuroimaging methods are often used to study brain func- This question is especially important when considering neu-
tion supporting various psychological processes, but most neu- ral processing of social and emotional information, information
roimaging tasks bear little resemblance to the real world (e.g. that is complex, contextual and critical for navigating the real
displaying angry faces without context). Further, the links world. This question is also particularly relevant to pursue for
between neural activity and daily subjective experiences or early adolescent females, a population highly sensitive to social
behaviors are rarely examined directly (Hasson and Honey, 2012; evaluation (Rudolph and Conley, 2005). Heightened sensitivity
Wilson et al., 2014). Thus, the ecological validity and real-world to social evaluation, resulting in part from increased time spent
relevance of neuroimaging work are often unclear and leaves us with peers and changes in brain function (Crone and Dahl, 2012;
wondering: What does an individual’s neural activity actually Somerville, 2013), may be developmentally normative and help
tell us about how that individual is likely to function in everyday adolescents navigate complex social environments. However,
life? high sensitivity to social threat specifically could contribute
Received: 24 April 2020; Revised: 12 March 2021; Accepted: 25 March 2021
© The Author(s) 2021. Published by Oxford University Press.
This is an Open Access article distributed under the terms of the Creative Commons Attribution License (http://creativecommons.org/licenses/by/4.0/),
which permits unrestricted reuse, distribution, and reproduction in any medium, provided the original work is properly cited.
1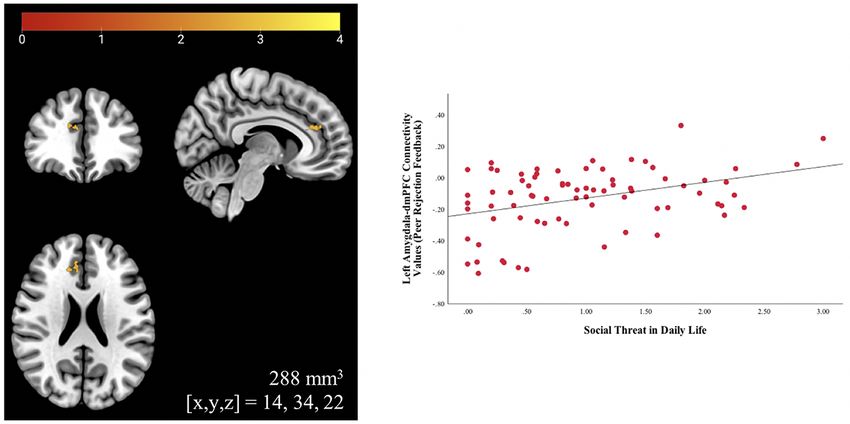
2 | Social Cognitive and Affective Neuroscience, 2021, Vol. 00, No. 00

to alarming increases in psychopathology, particularly social            adolescents’ neural activity to social rejection and self-reported
anxiety, occurring during adolescence for females (Silk et al.,          rejection sensitivity (Burklund et al., 2007; Masten et al., 2009).
2012a). Linking neural correlates of sensitivity to social threat to         This interpretation may also be supported by a handful of
real-world perceptions of social threat could ultimately inform          studies that have linked neurobiological measures of social
biobehavioral targets for adolescent mental health intervention.         threat reactivity to EMA measures of socioemotional processing
    Linking fMRI to everyday social behavior, however, carries           in youth (e.g. Forbes et al., 2009; Masten et al., 2012; Silk et al.,
challenges. Traditional psychosocial questionnaire measures,             2012b; Price et al., 2016; Oppenheimer et al., 2020). For exam-
frequently used in tandem with fMRI, may not accurately por-             ple, Silk et al. 2012b found that youths with higher physiological
tray daily functioning (Trull and Ebner-Priemer, 2014). Combin-          arousal (measured via pupillary response) to peer rejection on
ing fMRI and ecological momentary assessment (EMA) methods               the Chatroom Interact task also reported lower feelings of social

                                                                                                                                                 Downloaded from https://academic.oup.com/scan/advance-article/doi/10.1093/scan/nsab038/6188977 by guest on 07 May 2021
has helped address this gap and provided initial insight into            connectedness with peers in daily life. The relationship between
brain–behavior associations supporting socioemotional process-           neural sensitivity to rejection and socioemotional functioning
ing (e.g. Eisenberger et al., 2007; Masten et al., 2012). EMA involves   is likely reciprocal, such that daily social and emotional expe-
repeated sampling of an individual’s affect and behavior in nat-         riences also influence brain function. In support of this, Masten
uralistic conditions, which can provide rich insight and reduce          et al. (2012) showed that greater involvement with friends during
retrospective bias (Wilson et al., 2014). fMRI is a neuroimaging         adolescence (measured via daily diary methods) was associated
tool that can be used to study the neural substrates of non-             with less neural reactivity to social rejection on the Cyberball
verbal affective processing and taps more objective, biological          task in young adulthood. Additionally, adolescents with a his-
phenomena (Wilson et al., 2014). However, the ecological valid-          tory of childhood peer victimization show stronger activation
ity of much fMRI research is unclear. Integrating EMA and fMRI           in the social–affective brain network to peer rejection relative
allows one to bridge brain in the laboratory and behavior in more        to non-victimized adolescents (Will et al., 2016; Rudolph et al.,
naturalistic settings, to potentially increase the generalizability      2016).
and clinical relevance of both fMRI and EMA findings.                        Despite several recent studies examining the neural pro-
    Given the highly controlled, artificial environment of the           cessing of social rejection, and promising initial work linking
scanner, it is also necessary to have ecologically valid scanner-        EMA to neurobiology in adolescence, no studies have yet linked
based tasks that map more closely onto how individuals actually          concurrent measures of fMRI and EMA to examine how neu-
process socioemotional information in everyday life. One com-            ral processing of social rejection relates to daily socioemotional
mon task used to study neural processing of social threat in             functioning in adolescence. This approach has, however, been
adolescence is the Cyberball task (e.g. Masten et al., 2009; Will        taken in adults. Eisenberger and colleagues (2007) showed that
et al., 2016; Rudolph et al., 2016), a task in which participants        adults with greater activation in regions associated with pro-
believe they are being excluded during a virtual ball-tossing            cessing social threat (i.e. ACC, amygdala and periaqueductal
game (Williams et al., 2000). Cyberball provides a critical interac-     gray) during the Cyberball task reported greater disconnection
tive social component but fails to capture the modern, ‘online’          and rejection during real-world social interactions. This was
adolescent social context. Development of the Chatroom task              a critical finding linking brain and daily behavior. Given the
(Guyer et al., 2008, 2009), Chatroom Interact task (Silk et al.,         complexities of human social interactions, however, the field
2012b) and Virtual School (Jarcho et al., 2013) provide significant      requires a more nuanced examination of potential emotions
improvements in ecological validity. For example, during the             and cognitions associated with negative social interactions in
Chatroom Interact task, adolescents enter an interactive online          daily life. Further, it is unknown how these findings might repli-
chatroom with virtual ‘peers’ whom they believe to be other par-         cate during adolescence, an important developmental period in
ticipants in the study. Given the importance of peers and the            which to study brain–behavior associations supporting sensitiv-
pervasiveness of online social rejection for today’s youth, the          ity to social threat. Many have hypothesized that maturation in
Chatroom Interact task is a simple yet developmentally salient           the social–affective brain network supports increased sensitiv-
task to be used with fMRI methods.                                       ity to social evaluation during adolescence (e.g. Nelson et al.,
    Early fMRI work using these tasks has identified normative           2005; Somerville, 2013); identifying real-world correlates of neu-
increases in neural activation to social rejection from child-           ral reactivity to social threat may provide evidence to support
hood to adolescence in a social–affective brain network (see             this hypothesis.
Somerville, 2013 for review). This network, which includes the               Addressing these limitations, the present study used novel,
amygdala, anterior cingulate cortex (ACC) and anterior insula,           ecologically valid techniques to examine associations between
may be important for detecting and interpreting social cues and          fMRI findings and perceptions of daily social threat in early ado-
modulating affective responses to these cues (Jarcho et al., 2013).      lescent females oversampled for shy/fearful temperament. This
Notably, while the dorsal ACC has been noted as a core region of         sample was chosen to enrich variability in threat responding,
the ‘social pain’ network (Eisenberger, 2012), this region has not       as children and adolescents reporting subclinical symptoms of
been identified in meta-analyses of social rejection (Cacioppo           anxiety report more negative peer interactions and victimization
et al., 2013; Vijayakumar et al., 2017; Mwilambwe-Tshiloboa              (e.g. Hodges and Perry, 1999; Goldbaum et al., 2003). Temper-
and Spreng, 2021). However, the subgenual ACC (sgACC) has                amentally shy and fearful girls are also at risk for developing
been reliably linked to social rejection processing, particularly        future social anxiety disorder (Chronis-Tuscano et al., 2009).
in youth (Rotge et al., 2015; VijayaKumar et al., 2017). Day-to-         Studying brain–behavior associations supporting sensitivity to
day implications of patterns of neural activity during ecolog-           social threat in temperamentally shy/fearful early adolescent
ically valid tasks, such as Chatroom Interact, remain largely            females may provide insight into the etiology of social anxiety
unknown. One possibility is that youth with greater neural reac-         disorder in later adolescence.
tivity to peer rejection find negative experiences with peers more           In addition to capturing the modern social environment
salient and distressing in daily life. This interpretation may           using the Chatroom Interact task, we assessed nuances of every-
be supported by initial research showing associations between            day peer interactions using a newly developed set of EMA items.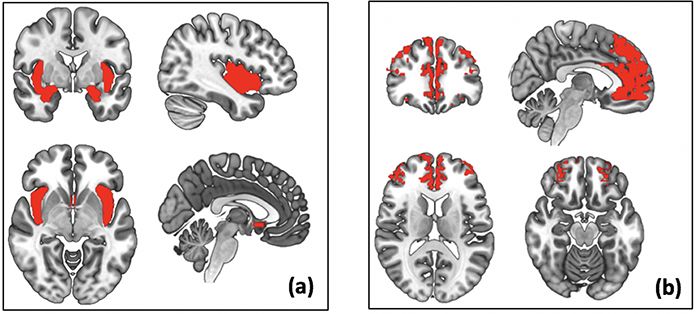
S. L. Sequeira et al. | 3

These items capture negative self-oriented thoughts and feel-          contraindications (e.g. dental braces, metal in the body and
ings associated with perceptions of socially threatening peer          claustrophobia), uncorrected visual disturbance, presence of
experiences. For example, adolescents were asked whether they          head injury or congenital neurological anomalies (based on par-
felt criticized, embarrassed, disliked and/or left out following       ent report), acute suicidality, or taking medications that affect
negative interactions they had with peers throughout the day.          the central nervous system (e.g. selective serotonin reuptake
Multilevel exploratory factor analyses were conducted to exam-         inhibitors).
ine the structure of a perceived social threat scale using these           Of 197 participants who completed the initial visit, 129 were
items. Assuming adequate reliability, we created an average            eligible for the study. The primary reason for exclusion was
social threat score for each participant, with higher social threat    a current or lifetime history of an anxiety disorder or MDD.
scores indicating greater emotional reactivity to perceived social     Of 129 eligible participants, 119 girls completed the fMRI scan

                                                                                                                                                        Downloaded from https://academic.oup.com/scan/advance-article/doi/10.1093/scan/nsab038/6188977 by guest on 07 May 2021
threat in daily life. We hypothesized that greater activation in a     for the current study; data from 25 participants were unus-
social–affective brain network (i.e. amygdala, sgACC and ante-         able due to excess movement (n = 19), falling asleep in the MRI
rior insula) to peer rejection in the scanner would predict higher     scanner (n = 5) or incidental findings from the MRI scan that
levels of reactivity to perceived social threat in daily life.         impeded analysis (n = 1). Of the 94 participants with usable
    Associations between perceived social threat in daily life         fMRI data, EMA data were available for 90 participants; 14 of
and functional connectivity between the amygdala and medial            these 90 participants (15.6%) had unusable EMA data due to
prefrontal cortex (mPFC) during rejection feedback were also           EMA drop-out (n = 3), low completion rate ( 0.20). Included
reporting greater emotional reactivity to perceived social threat      participants were predominately (71%) white. Median total fam-
in daily life would show reduced negative fronto-amygdala con-         ily income in this sample was between $80 000 and $90 000. Key
nectivity during rejection, potentially reflecting an inability to     demographic characteristics are summarized in Table 1.
effectively regulate social threat in the laboratory and in the real
world.                                                                 Measures
                                                                       Temperament. Temperament was assessed using identical
Methods                                                                child and parent (parent report on child) versions of the EATQ-R
                                                                       (Ellis and Rothbart, 2001). In this sample, internal consistency
Participants                                                           for the EATQ-R shyness scale was moderate for adolescent self-
Seventy-six girls (Mage = 12.27 years, s.d. = 0.81 years) were         report (Cronbach’s α = 0.74) and high for parent report (α = 0.87).
included in analyses for the present study. Participants were          Internal consistency for the EATQ-R fear scale was low for ado-
recruited for a longitudinal study of girls’ brain development         lescent self-report (α = 0.46) and parent report (α = 0.66). The
via advertisements and announcements in the community.                 sample was stratified such that two-thirds of participants in this
Participants were oversampled for shy/fearful temperament to           sample (n = 49) had scores higher than 0.75 s.d. above the mean
enrich variability in threat responsivity. A total of 522 families     on the parent- or child-rated shyness scale (2.99 for parent-
responded to recruitment efforts and completed a brief phone           report, 3.16 for child-report) or fear scale (3.12 for parent-report,
or web-based screen. Of these, 235 girls aged 11–13 met prelimi-
nary inclusion criteria and were scheduled for an initial clinical
interview to determine eligibility, and 197 of these participants      Table 1. Demographic characteristics of the total sample (n = 76)
completed the initial visit (see online supplemental methods for
                                                                                          n (%)          Mean (s.d.)       Median       Range
more information).
    Exclusion criteria included the presence of any past or cur-       Age                               12.27 (0.81)      12.24        11.05–13.97
rent DSM-5 anxiety disorder (with the exception of specific            Total family                       7.17 (2.98)       8.00        0–10
phobia), major depressive disorder (MDD), attention-deficit/            income
hyperactivity disorder (predominantly hyperactive–impulsive            Race/Ethnicity
presentation or combined presentation), autism spectrum dis-            White             54 (71.1%)
order, bipolar disorder or schizophrenia. Diagnostic status was         Black or          13 (17.1%)
determined at the initial visit using the Kiddie-Schedule for            African-
Affective Disorders and Schizophrenia-Present and Lifetime ver-          American
sion (K-SADS-PL; Kaufman et al., 1997), a semi-structured diag-         Asian              2 (2.6%)
nostic interview administered to all participants by a trained          Biracial           5 (6.6%)
clinician. All participants had an IQ > 70 as assessed using the        Other              2 (2.6%)
                                                                        Hispanic or        3 (3.9%)
verbal and matrix reasoning subtests of the Wechsler Abbre-
                                                                         Latino
viated Scale of Intelligence (WASI; Wechsler, 2011). Additional
exclusionary criteria include a lifetime presence of a neuro-          Note: Total family income was reported by parents on a scale of 0–10 in incre-
logical or serious medical condition, the presence of any MRI          ments of $10 000 (e.g. 0 = $0–10 000, 1 = $10 001–20 000…10 = $100 001+).
4 | Social Cognitive and Affective Neuroscience, 2021, Vol. 00, No. 00
3.48 for child-report) All other participants scored below 0.75 s.d.
above the mean on the fear and shyness scales of both child and
parent reports.
Ecological Momentary Assessment (EMA). Data on real-world
social threat experiences were collected using cell phone EMA.
Youth were given a pre-programmed android smartphone on
which they entered responses to a series of questions about
their daily experiences with peers using a secure smartphone
Downloaded from https://academic.oup.com/scan/advance-article/doi/10.1093/scan/nsab038/6188977 by guest on 07 May 2021
app for Web Data Express developed by the Office of Academic
Computing in the Department of Psychiatry of University of
Pittsburgh.
Using these phones, participants were asked to answer ques- Fig. 1. EMA social threat statements.
tions about their most recent social interactions and their emo- Note. *This item did not load significantly on a social threat score and thus was
excluded from analyses.
tional responses to these interactions for 16 consecutive days.
Adolescents were randomly sampled (i.e. received an electronic
notification to respond) three times per day on weekdays (once
After typing out details about the negative interaction and
in the morning between 7 AM and 8 AM and twice between 4 PM
identifying who was involved in the interaction, participants
and 9:30 PM) and four times per day on the weekends between
were asked to answer questions about how they felt during the
10 AM and 9:30 PM, allowing for a maximum of 54 observa-
interaction. First, they were asked to indicate how sad, wor-
tions. This large number of samples allows for a more stable
ried, stressed and mad they felt during the interaction using a
estimate of ‘typical functioning,’ even in the potential presence
0–100 sliding scale. These ratings were averaged at each obser-
of several atypical days. Compliance in this sample was 81.3%
vation for a measure of NA in response to the negative interac-
(s.d. = 13.9%, range = 37.0–100%).
tion. Internal consistencies for NA in response to the negative
After receiving the electronic notification, adolescents were
interactions was adequate (ωwithin = 0.64 and ωbetween = 0.88).
prompted through a series of questions about their recent emo-
Participants were then given a checklist that included state-
tions and interactions with friends. At the start of each observa-
ments that describe how they may have been thinking or feeling
tion, participants were asked to indicate how they were feeling
during the interaction (referred to as ‘social threat statements’)
‘just before the phone beeped’ using a 0–100 sliding scale and
and were asked to check off which statements applied to them
various emotion words adapted from Silk et al. (2011). At each
in the situation (Figure 1). Examples of social threat statements
observation, ratings for sad, worried, stressed and mad were
include, ‘I felt criticized’ and ‘I felt disliked or rejected.’ These
averaged to create a measure of momentary negative affect (NA).
questions took approximately 5 min to complete at each inter-
At each observation, ratings for happy, joyful, excited and inter-
val. Internal consistencies for this nine-item social threat mea-
ested were averaged to create a measure of momentary positive
sure were ωwithin = 0.64 and ωbetween = 0.91. These statements
affect (PA). Reliability was moderate to high for the momentary
were used to create a ‘perceived social threat score’ for each
PA measure (ωwithin = 0.80 and ωbetween = 0.94) and momentary
participant (see ‘EMA Perceived Social Threat Data Analysis’).
NA measure (ωwithin = 0.68 and ωbetween = 0.95).
Participants then received the prompt: ‘Think about the
interaction with other kids your age that made you feel the Chatroom interact task. The Chatroom Interact Task is an fMRI
worst since the last beep.’ They were asked to type out details task used to examine neural responses to peer rejection and
about this interaction. If participants could not think of a neg- acceptance (Silk et al., 2012b, 2014). The first component of
ative interaction, they could select an option that states, ‘I am the task was completed in the laboratory several weeks before
having trouble thinking of something.’ They were then probed the fMRI scan. During this laboratory visit, participants were
with follow-up questions to help them think about what hap- shown photographs and fictitious biographical profiles of other
pened since the last beep (e.g. ‘What were you doing when you girls their age (virtual peers) other girls whom they are told
completed the last beep?’; ‘Was there anything minor that hap- are also participating in the study. Participants also provided
pened that bugged you, like somebody said or did something their own photographs and profiles to increase believability
that annoyed you, hurt your feelings just a little, or disappointed and engagement in the task. Participants then chose the top
you?’). If participants continued to indicate that they did not five peers with whom they would be most interested in inter-
have a negative interaction, this observation was coded as ‘no acting during the fMRI scan. During the fMRI scan, adoles-
negative interaction’ and was not included in the calculation of cents were matched with the two peers they ranked high-
the social threat score. Thus, the social threat score captures est to increase the salience of the interactions and reviewed
affective responses to experienced negative social interactions the biographical profiles for these peers prior to starting the
but does not inherently capture frequency of negative social task.
interactions. Participants were then asked to indicate who was The fMRI task is made up of four blocks with 15 trials in
involved in the negative interaction. They could choose from each block, for a total run time of 15.1 min. Stimuli were pre-
the following options (with more than one selection possible): sented using E-prime 1.0 software (Psychology Software Tools,
‘friend or friends,’ ‘boyfriend/girlfriend or kid I have a crush Pittsburgh, PA). During the fMRI task, participants and peers
on,’ ‘other kid(s),’ ‘sibling/stepsiblings close to my age (less took turns selecting who they would rather talk to about differ-
than 2 years younger or older),’ ‘cousin(s),’ ‘mother/step-mother,’ ent topics, such as movies, music and friends. Throughout the
‘father/step-father,’ ‘siblings/stepsiblings NOT close to my age task, pictures of participants and peers are shown two at a time.
(greater than 2 years younger or older),’ ‘teacher or coach’ and/or During the first block, participants complete control trials (Olino
‘other adult(s).’ et al., 2015), in which a dot appears over one of the two faces onS. L. Sequeira et al. | 5
the screen. Participants are asked to indicate which side of the of field distortions in the functional images with the follow-
screen the dot appeared on by pressing a button. Control trials ing parameters: TR = 590 ms, TE1 = 4.92 ms, TE2 = 7.38 ms, voxel
were created to address concerns that peer acceptance trials are size = 2.3 × 2.3 × 2.3 mm, flip angle 60◦ . Total run time for the
not an ideal control with respect to rejection, given the strong Chatroom Interact task was 15 min and 9 s.
social evaluative component. Blocks two through four were feed-
back blocks. During the second block, participants choose which
peer they would rather chat with. During the third and fourth EMA perceived social threat data analysis
blocks, the subject is chosen/not chosen by their virtual peers.
For this analysis, we only included negative interactions expe-
In one of these blocks, the first virtual peer chooses the partic-
rienced with a peer (i.e. friend, girlfriend or boyfriend, other
ipant in two-thirds of the trials (‘acceptance’ trials) and rejects
kid) and did not include interactions with family members.
Downloaded from https://academic.oup.com/scan/advance-article/doi/10.1093/scan/nsab038/6188977 by guest on 07 May 2021
the participant in one-third of the trials (‘rejection’ trials), and
Data were quality checked to confirm that participants were
in the other block the second peer rejects the participant in two-
accurately reporting on negative interactions with a peer. For
thirds of the trials and chooses the participant in one-third of
example, if a participant reported a negative interaction with a
the trials. The order of these blocks and the trials within each
peer but then wrote ‘nothing’ in the description of the event,
block are randomized across participants. Topics are presented
her data for this event were not included. If a participant did
randomly and repeated in each block. Following each selection,
not endorse at least three usable negative interactions with
the photograph of the person who is chosen is highlighted and
peers over the 16 days of EMA data collection, her data were
the photograph of the person who is not chosen is superimposed
not used in the analysis. At this threshold, data from eight
with a large ‘X’. Each trial is 15 s long; the topic (i.e. ‘Who would
participants were excluded. Excluded participants did not dif-
you rather talk to about [topic]?’) is presented for 3 s and the
fer from included participants in age or anxiety symptoms at
feedback (i.e. highlight of one face and ‘X’ superimposed over
baseline. On average, participants reported a usable negative
the other) is presented for 12 s. To maintain task engagement,
interaction with a peer on 43.0% of completed EMA observations,
participants are asked to indicate, using a button press, whether
although variability in this percentage was high (s.d. = 24.6%,
the person on the left or right was chosen when they are not the
range = 5.77–100%). Included participants reported an average of
ones choosing. Analyses focused on the rejection, acceptance
18.0 (s.d. = 10.6) negative interactions with a peer over the 16-day
and control trials.
period.
Multilevel EFAs were completed in Mplus Version 8.4 (Muthén
Procedure and Muthén, 1998–2018) to evaluate the structure of the nine-
item scale to assess social threat. All items (up to 9) that
The study was approved by a university Institutional Review loaded significantly on a social threat factor were summed for
Board and consisted of three visits to the laboratory and a home each observation. Items were summed across each observation
protocol. At Visit 1, parents provided informed consent and because we assumed each item to be weighted equally, without
youth provided informed assent. Following consent, the WASI the possibility of missing data within each observation because
and K-SADS-PL were administered to determine eligibility. At the items were administered in a checkbox format. To provide
Visit 2, eligible participants completed the first part of the Cha- preliminary validation of the EMA perceived social threat scale,
troom Interact Task and were given an android smartphone to Mplus was used to calculate within- and between-person asso-
complete the EMA home protocol. Immediately following Visit ciations between social threat sum scores (i.e. the sum of the
2, participants began the EMA protocol, which lasted for 16 con- social threat statements endorsed for each negative peer expe-
secutive days (10 weekdays, 3 weekends). Following the EMA rience) and NA in response to each negative peer interaction.
collection, youth completed the fMRI scan. Before entering the Within- and between-person associations between social threat
scanner, participants were trained in a simulation MRI scanner sum scores and momentary NA or PA at the start of each EMA
to familiarize them with the tight space and the loud sounds of observation were also examined.
the scanner. Based on results from the EFA, an average ‘perceived social
threat score’ was computed for each participant by summing
the social threat statements endorsed for each negative peer
fMRI acquisition. Data were acquired using a Siemens 3T
interaction and averaging across the total number of observa-
Prisma magnet with a 32-channel phased array coil. Pillows
tions in which a negative peer interaction was endorsed (up
were used to minimize head movement. A PC running E-Prime
to 54 total observations). These perceived social threat scores
(www.pstnet.com) was used to control stimulus display. Stim-
were used in all neuroimaging analyses. Momentary NA ratings
uli were projected onto a screen at the head of the scanner bore,
(reported at the beginning of each observation) were also aggre-
viewable via a mirror attached to the head coil. Participants were
gated across all observations to create a trait NA measure for
equipped with a response glove on their right hand to make
each participant, for use in sensitivity analyses.
responses during the task. All included participants were right
handed.
Anatomical images covering the entire brain were acquired
fMRI data preprocessing and analysis
first using a three-dimension magnetization-prepared rapid
gradient-echo T1-weighted sequence [repetition time (TR) = All fMRI data were preprocessed according to standard proto-
2300 ms, echo time (TE) = 3.93 ms, flip angle 9◦ , inversion time cols based on the general linear model (GLM), using a canonical
(TI) = 900 ms, voxel size = 1 mm3 ]. Functional images were hemodynamic response function, in SPM12 (Wellcome Depart-
acquired using multi-band gradient echo-planar (EPI) sequences ment of Cognitive Neurology, London, UK). The preprocessing
(60 slices, three-factor multiband) sensitive to BOLD Blood Oxy- procedure includes image reconstruction and reorientation, co-
gen Level Dependent contrast [T2*] (TR = 1500 ms, TE = 30 ms, registration with the high-resolution structural image, spatial
flip angle 55◦ , voxel size = 2.3 × 2.3 × 2.3 mm). Field maps were realignment and normalization to a standard Montreal Neu-
acquired using gradient EPI imaging sequence for correction rological Institute T1 template with 2 mm voxels, and spatial6 | Social Cognitive and Affective Neuroscience, 2021, Vol. 00, No. 00
smoothing using a 6 mm full-width at half-maximum Gaussian In sensitivity analyses, the total number of negative peer
kernel. High pass filtering (128s) was applied to remove low interactions was added as a predictor to the regression model
frequency noise in the EPI signal. Head motion artifact was in SPM to confirm that associations between brain function and
detected, and ArtRepair was used to make appropriate adjust- perceived social threat reactivity held after statistically control-
ments. Scans with >0.5 mm of incremental motion, >3 mm from ling for frequency of negative events, as well as to examine
the baseline image and/or 3 s.d. of intensity shifts were consid- whether heightened neural responsivity to social rejection is
ered outliers. Outlier scans were replaced with a linear inter- also related to higher frequency of negative events in daily life.
polation between the two nearest non-outlier scans. Subjects Trait NA, or the aggregate measure of NA reported at the start
with more than 25% of volumes with excess movement were of every observation, was also controlled for in sensitivity anal-
excluded from analyses. These more liberal movement thresh- yses in SPM, to test whether neural function is associated with
Downloaded from https://academic.oup.com/scan/advance-article/doi/10.1093/scan/nsab038/6188977 by guest on 07 May 2021
olds were chosen to maximize the size of this early adolescent perceived social threat reactivity above and beyond trait levels of
sample higher in anxiety symptoms than a typical commu- NA. Finally, given the novelty of the control trials, a second-level
nity sample due to oversampling based on shy/fearful temper- one-sample t-test was run in SPM to examine statistically signif-
ament. Using this threshold, data from 19 participants were icant activation for Peer Rejection Feedback > Control Feedback
excluded. For first-level analyses, we modeled Feedback Antic- in a supplemental whole-brain analysis.
ipation, Choice Anticipation, Peer Acceptance Feedback, Peer
Rejection Feedback, Choice Feedback and Control Feedback, con-
sistent with an event-related design, with motion parameters Functional connectivity analysis. The CONN toolbox for SPM
included as nuisance regressors. Based on a priori hypotheses, (Whitfield-Gabrieli and Nieto-Castanon, 2012) was used for
group-level region-of-interest (ROI) approaches were used for all seed-to-voxel connectivity analyses. Psychological regressors
analyses. To correct for multiple comparisons, we first estimated included effects of task (Feedback Anticipation, Choice Antic-
intrinsic smoothness of the masked functional data using AFNI’s ipation, Peer Acceptance Feedback, Peer Rejection Feedback,
3dFWHM module with the spatial autocorrelation function (acf) Choice Feedback and Control Feedback). Six head realignment
option. These acf parameters were applied to AFNI’s 3dClust- motion parameters were included as nuisance regressors for
Sim module. Simulation results revealed the number of voxels each participant, and physiological noise from white matter and
needed to meet a pre-determined starting voxel-wise threshold cerebrospinal fluid was regressed out for each participant. Linear
of P < 0.005 and cluster threshold of P < 0.05 within each mask. de-trending and a 0.008–0.09 Hz temporal band-pass filter were
This starting threshold was motivated by challenges in balanc- also applied.
ing potential Type I and II errors in neuroimaging (e.g. Lieberman A first-level functional connectivity analysis (referred to as
and Cunningham, 2009); however, to increase transparency, we ‘weighted-GLM’ in CONN) provided weighted correlation mea-
also present results using a voxel-wise threshold of P < 0.001 and sures of condition-specific associations between the amygdala
cluster threshold of P < 0.05. seed BOLD timeseries and each voxel in an mPFC gray mat-
ter mask. This mask was created using the WFU PickAtlas Tool
v3.0.5b and automated anatomical labeling atlas (44 176 mm3 ;
BOLD activation analysis. Anatomically defined ROI masks for Figure 2b). This mask encompassed the mPFC (ventral and dor-
the bilateral amygdala, sgACC (BA 25) and bilateral anterior sal) and ACC, regions implicated in emotion regulation with
insula were created using WFU PickAtlas Tool (v3.0.5b) (http:// structural connections to the amygdala (Etkin et al., 2011). A clus-
fmri.wfubmc.edu/software/pickatlas) and combined into one ter size of 256 mm3 was needed for correction within this mask
‘affective-salience’ ROI mask (32240 mm3 ; Figure 2a). First-level at a voxel-wise threshold of P < 0.005. Condition-specific weights
contrasts for each participant were included in a second-level were defined by modeling each condition of interest with a
multiple regression in SPM12 to examine correlations between boxcar function and convolving with the canonical hemody-
social threat scores and neural activity to Peer Rejection Feed- namic response function. This weighted GLM approach provides
back > Control Feedback within the affective–salience mask. A ‘absolute’ measures of functional connectivity occurring dur-
cluster size of 256 mm3 was needed for correction within ing a single task condition, using a nonparametric estimation
this mask at a voxel-wise threshold of P < 0.005. Supplemental of weighted correlation measures within each task condition
whole-brain regression analyses were also performed to explore (e.g. Belleau et al., 2020). To generate amygdala–mPFC correla-
other neural regions that may be correlated with social threat tion maps during peer rejection feedback, the time series was
scores. extracted separately from right and left amygdala seeds, defined
anatomically by the CONN toolbox and correlated with every
other voxel in the ROI mask. The correlation maps were normal-
ized using a Fischer’s z transformation and used in group-level
statistics. A second-level regression analysis was used to exam-
ine associations between perceived social threat scores and
amygdala-seeded connectivity during peer rejection feedback.
This analysis was run separately for the left and right amygdala.
Similar to BOLD activation analyses, sensitivity analyses were
conducted controlling for the total number of peer interactions
and trait NA in the CONN toolbox.
Exploratory analyses
Fig. 2. Anatomical ROI masks used in analyses (a) Social–affective ROI mask,
including the anatomically defined sgACC (BA 25), bilateral insula and bilateral Secondary analyses were conducted to explore whether asso-
amygdala. (b) Gray matter mPFC ROI mask. ciations between real-world social threat reactivity (EMA) andS. L. Sequeira et al. | 7
neural reactivity were specific to neural responsivity to peer girls high in shy/fearful temperament were overrepresented to
rejection feedback or whether findings might extend to neu- enrich variability in threat sensitivity.
ral responsivity to peer acceptance feedback and thus social
evaluation generally. To do this, perceived social threat scores
were regressed on neural activation to Peer Acceptance Feed- Results
back > Control Feedback and Peer Rejection Feedback > Peer
Perceived social threat EMA measure
Acceptance Feedback. Perceived social threat scores were also
regressed on amygdala-seeded connectivity during peer accep- Multilevel Exploratory Factor Analyses (EFA). Results from the
tance feedback. EFA can be found in Table 2. Results indicate that the nine
Finally, exploratory analyses examining differences in social items load on a one-factor solution at both the within- and
Downloaded from https://academic.oup.com/scan/advance-article/doi/10.1093/scan/nsab038/6188977 by guest on 07 May 2021
threat scores and brain activity between temperamentally between-person level. At the within-person level, the eigen-
shy/fearful participants and the remainder of the sample can be value for factor one was 3.78 and 1.51 for factor two. At the
found in the online supplementary materials. It should be noted between-person level, the eigenvalue for factor one was 5.09 and
that this study was not designed to examine group differences; 1.55 for factor two. The item loadings on a two-factor solution
yielded results that were uninterpretable. Considering this, the
strong theoretical rationale for a one-factor solution, and the sig-
nificant decrease in the second eigenvalue, particularly at the
Table 2. Factor loadings for the 9-item social threat scale
between-person level, provides strong evidence for a one-factor
Item Loading solution. However, we did note the relatively weak loading of
item T4 (‘I felt uncomfortable’) at the between-person level. As
Within-Person a result, we excluded item T4 from all analyses and eight items
T1 0.81 were included in the final perceived social threat score; however,
T2 0.75 we note that all of the results presented in the paper remain
T3 0.58 significant when item T4 is included in analyses.
T4 0.33
T5 0.53
T6 0.46 Bivariate associations
T7 0.63
T8 0.45
Within-person associations. Zero-order correlations between
T9 0.70 the perceived social threat sum score, NA in response to the
negative peer interaction, momentary NA at the beginning of
Between-Person
the observation and momentary PA at the beginning of the
T1 0.87
observation can be found in Table 3. In the moment, perceived
T2 1.00
T3 0.61 social threat was modestly positively associated with NA in
T4 0.16 response to the social threat. In the moment, the perceived
T5 0.61 social threat sum score was not significantly associated with PA
T6 0.71 or NA reported at the beginning of the observation.
T7 0.66
T8 0.72
Between-person associations. As shown in Table 3, on aver-
T9 0.78
age, perceived social threat sum scores were strongly posi-
Note: N = 108; Observation N = 1644. Loadings in bold are those considered to tively associated with average momentary NA at the beginning
primarily load on that factor. of the observations and NA during negative peer interactions
Table 3. Correlations among variables at within- and between-person levels
Perceived Social Threat NA during Negative Peer
Sum Score Experience Momentary NA Momentary PA
Within
Perceived Social Threat –
Sum Score
NA during Negative Peer 0.18 [0.14, 0.23] –
Experience
Momentary NA 0.04 [−.01, 0.10] 0.28 [0.22, 0.31] –
Momentary PA −0.02 [−.06, 0.04] 0.00 [−.03, 0.05] −0.35 [−.39, −0.29] –
Between
Perceived Social Threat –
Sum Score
NA during Negative Peer 0.41 [0.21, 0.56] –
Experience
Momentary NA 0.40 [0.24, 0.57] 0.72 [0.59, 0.83] –
Momentary PA 0.03 [−.17, 0.28] 0.06 [−.12, 0.25] −0.08 [−.25, 0.12] –
Note: N = 108. Observation N = 1644. Values in bold are those for which the credibility interval did not contain zero. Confidence intervals are presented in brackets.
Perceived Social Threat Sum Score = the sum of all social threat statements endorsed following each negative peer experience.8 | Social Cognitive and Affective Neuroscience, 2021, Vol. 00, No. 00
Downloaded from https://academic.oup.com/scan/advance-article/doi/10.1093/scan/nsab038/6188977 by guest on 07 May 2021
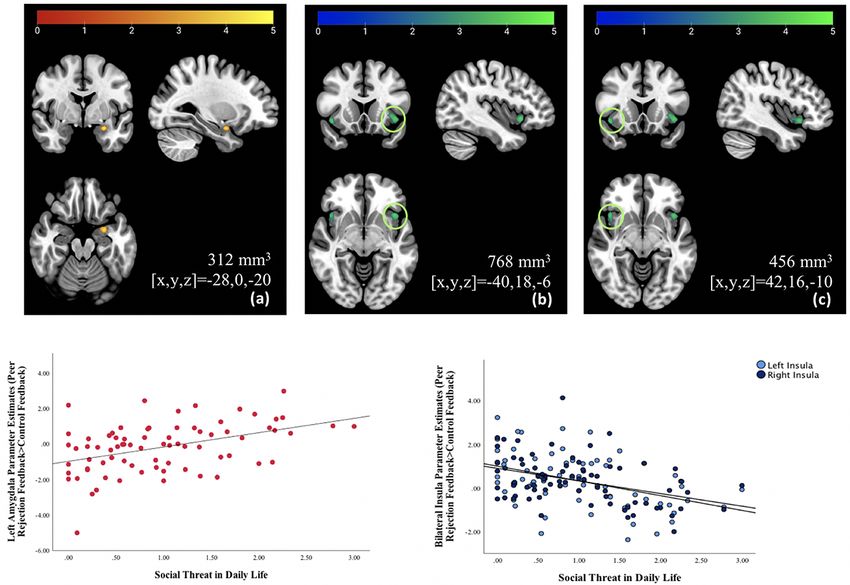
Fig. 3. Associations between neural activation and real-world responses to perceived social threat. Perceived social threat in daily life, measured using ecological
momentary assessment, correlated significantly with activation to Peer Rejection Feedback > Control Feedback in three regions within the social–affective ROI mask
(displayed using radiological orientation): (a) a cluster in the left amygdala, (b) a cluster in the left insula and (c) a cluster in the right insula. Clusters positively
associated with social threat at a voxel-wise threshold of P < 0.005 are shown with using red-yellow color scale. Clusters negatively associated with social threat at a
voxel-wise threshold of P < 0.005 are shown with using blue-green color scale. Scatterplots are displayed for illustrative purposes.
averaged across observations. There was no significant associa- Feedback were also found (Figure 3). Associations were driven
tion between perceived social threat and PA, on average. by neural activity during rejection trials, rather than by activity
during control trials (Figure S1 in online supplement).
All findings surpassed a more conservative voxel-wise
Descriptive statistics. Average perceived social threat scores
threshold of P < 0.001, for which a cluster size of 88 mm3 was
were normally distributed across the sample, with a range
needed to correct for multiple comparisons at a cluster thresh-
from 0.00 to 3.00, mean of 0.98 and standard deviation of 0.74,
old of P < 0.05 (amygdala: 168 mm3 ; left insula: 376 mm3 ; right
suggesting sufficient variability. NA in response to negative
insula: 200 mm3 ). All findings held when controlling for the total
peer interactions was higher on average (M = 24.20, s.d. = 16.33,
number of negative peer interactions over the 16-day period
range = 2.69–70.06) than momentary NA measured at the time of
at a voxel-wise threshold of P < 0.001, and the total number of
the observation (M = 7.52, s.d. = 8.68, range = 0.04–37.59); paired
interactions was not significantly associated with brain activity.
samples t-tests also revealed that at the within-person level,
Controlling for trait NA at a voxel-wise threshold of P < 0.001, the
participants reported higher average NA during negative peer
bilateral insula findings held but the resulting amygdala cluster
interactions than average NA at the start of each observation
did not meet the cluster-wise threshold (cluster size = 72 mm3 ).
[t(75) = −11.86, P < 0.001].
Supplemental whole-brain analysis with more liberal thresh-
olds (i.e. voxel-wise threshold of P < 0.005 and cluster-level
threshold of PFWE < 0.05) noted only one additional correlation
Connecting neurobiology to real-world threat
between perceived social threat scores and brain activation to
processing
Peer Rejection Feedback > Control Feedback. This negative asso-
BOLD activation. A significant positive association between ciation was found in the right parietal cortex (Brodmann area
perceived social threat scores and activation in a cluster in the 40; Figure S2 in online supplement); no findings surpassed a
left amygdala (cluster size = 312 mm3 ; peak x,y,z = −28,0,−20; whole-brain voxel-wise threshold of P < 0.001. Results from a
Z = 4.28) to Peer Rejection Feedback > Control Feedback was one-sample t-test examining neural activity across the whole
found. Significant negative associations between perceived brain for the Peer Rejection Feedback > Control Feedback con-
social threat scores and activation in the left ventral anterior trast can be found in the supplement (Table S1 in online sup-
insula (cluster size = 768 mm3 ; peak x,y,z = −40, 18, −6 Z = 4.08) plement). This contrast elicited expected activation in regions
and right ventral anterior insula (cluster size = 456 mm3 ; peak involved in salience detection and self-referential processing,
x,y,z = 42,16,−10 Z = 3.89) to Peer Rejection Feedback > Control including the insula, prefrontal cortex and parietal cortex.S. L. Sequeira et al. | 9
Downloaded from https://academic.oup.com/scan/advance-article/doi/10.1093/scan/nsab038/6188977 by guest on 07 May 2021
Fig. 4. Associations between fronto-amygdala connectivity and real-world responses to perceived social threat. Perceived social threat in daily life correlated positively
with functional connectivity between the left amygdala (anatomically defined) and a cluster in the right dmPFC/dorsal ACC (shown here, radiological orientation) during
peer rejection feedback at a voxel-wise threshold of P < 0.005. Youth reporting more social threat in daily life showed less negative fronto-amygdala connectivity during
rejection feedback. Scatterplot is displayed for illustrative purposes.
Functional connectivity. A significant positive association Feedback contrast (Table S2 in online supplement). No associa-
between perceived social threat scores and functional connec- tions between perceived social threat scores and brain activity
tivity between the left amygdala and a cluster in the right dor- were found for the Peer Rejection Feedback > Peer Acceptance
somedial PFC (dmPFC; Brodmann area 9) during peer rejection Feedback. No associations between perceived social threat and
feedback at a voxel-wise threshold of P < 0.005 was found (clus- amygdala-seeded connectivity during peer acceptance feedback
ter size = 288 mm3 ; peak x,y,z = 143 422; Z = 3.20; Figure 4). Girls were found.
reporting greater emotional reactivity to perceived social threat
in daily life showed less negative left amygdala–right dmPFC
connectivity to rejection. No significant associations were found
Discussion
with the right amygdala seed. This finding did not hold control-
ling for trait NA or the total number of negative peer interactions The present study uses innovative fMRI and EMA measures to
and did not survive a more conservative voxel-wise threshold link neural activity during a social interaction task to daily social
of P < 0.001. No additional findings emerged in an exploratory experiences in adolescent females. Real-world correlates of fMRI
whole-brain analysis. findings were found, such that individual differences in neu-
ral responses to social evaluation were linked to differences in
perceived social threat characterizing negative interactions with
Exploratory analyses: extension to social acceptance
peers in daily life. Findings suggest that variability in neural acti-
Several findings replicated for neural activation to social accep- vation on scanner-based tasks could provide meaningful insight
tance relative to control. At a voxel-wise threshold of P < 0.005, into daily socioemotional functioning.
higher perceived social threat scores were associated with Addressing critical limitations of prior work, we used a realis-
higher activity in the left amygdala to peer acceptance feed- tic, salient fMRI task to investigate neural processing of interper-
back relative to control feedback (cluster size = 352 mm3 ; peak sonal rejection and acceptance. Additionally, we developed and
x,y,z = −28,0,−20; Z = 4.52) and lower activity in the left insula tested new EMA items to assess in depth how adolescents feel
(cluster size = 872 mm3 ; peak x,y,z = −40,18,−6; Z = 4.28) and and think about themselves when faced with perceived social
right insula (cluster size = 472 mm3 ; peak x,y,z = 42,16,−10; threat in daily life. As hypothesized, adolescent girls with more
Z = 3.71); all findings remained significant at a voxel-wise positive amygdala activation to peer rejection feedback (relative
threshold of P < 0.001. Associations were driven by neu- to control) reported more self-focused negative thoughts and
ral activity during acceptance trials (Figure S3 in online feelings in response to social threat in daily life (e.g. ‘I felt embar-
supplement). rassed,’ ‘I felt rejected’). Findings align with prior work showing
Higher reactivity to perceived social threat in daily life was that adults with greater activation in brain regions that process
also related to lower activity in the inferior parietal cortex (Figure social threat, including the amygdala, report greater social dis-
S2 in online supplement) at a voxel-wise threshold of P < 0.005, tress in daily life (Eisenberger et al., 2007). Current findings were
similar to whole-brain exploratory findings for the Peer Rejec- restricted to the left amygdala, which could represent mean-
tion Feedback > Control Feedback contrast. A one-sample t-test ingful left-lateralization of the amygdala response to negative
also revealed similar patterns of activation across the whole emotions (Wager et al., 2003). Detection of meaningful left but
brain for the Peer Acceptance Feedback > Control Feedback not right amygdala response could reflect differences in rates
contrast as was seen for the Peer Rejection Feedback > Control of habituation to emotional stimuli (Phillips et al., 2001; Wright10 | Social Cognitive and Affective Neuroscience, 2021, Vol. 00, No. 00
et al., 2001); however, it could also reflect inadvertent effects of Similar to insula findings, higher activity in this region to rejec-
data preprocessing (Murphy et al., 2020). tion and acceptance may be adaptive for social functioning and
Interestingly, positive associations were also found between support healthy social relationships. Adolescents with reduced
perceived social threat in daily life and amygdala activation to right inferior parietal cortex activation to social feedback may be
positive peer feedback. This aligns with the role of the amyg- more emotionally reactive to negative social evaluation because
dala in responding to emotional, salient stimuli with both posi- of lower interpersonal awareness, although this remains to be
tive and negative valence (Murray, 2007). Heightened emotional explored further as the parietal cortex was not a region iden-
reactivity to social threat in daily life may thus be supported by tified a priori and did not survive a more stringent voxel-wise
heightened neural activity to social evaluation more generally, threshold of P < 0.001.
rather than heightened neural activity to social rejection specif- Findings from functional connectivity analyses were
Downloaded from https://academic.oup.com/scan/advance-article/doi/10.1093/scan/nsab038/6188977 by guest on 07 May 2021
ically. Of note, research shows heightened amygdala activation restricted to neural activity during social rejection, although it
to both negative and positive social evaluation in individuals should be noted that this finding also did not survive a more
with depression (e.g. Davey et al., 2011; Kumar et al., 2017). conservative voxel-wise threshold or statistically controlling for
Adolescent girls with higher amygdala activation to social eval- trait NA or the total number of negative peer interactions. Girls
uation, both positive and negative, may find social evaluation reporting greater reactivity to perceived social threat in daily life
highly salient and emotionally arousing and may thus care more using EMA showed less negative coupling between the amygdala
about how others perceive them. High sensitivity to social evalu- and dmPFC during rejection feedback. This finding could reflect
ative could confer risk for depression, particularly for adolescent less effective prefrontal regulation over the amygdala’s response
girls who experience more negative peer interactions and who to rejection. While more ventral portions of the PFC are tradi-
are at greater risk for depression, including adolescents high tionally associated with emotion regulation (Etkin et al., 2011),
in shy or inhibited temperament (Gladstone and Parker, 2006; the dorsal PFC may work to downregulate the amygdala through
Kingery et al., 2010), who made up the majority of the present more ventral regions, such as the orbitofrontal cortex (Ochsner
sample. As this sample is currently being followed longitudi- et al., 2004; Eippert et al., 2007; Blair et al., 2007; Frank et al., 2014).
nally, future research will examine how altered neural activation Negative connectivity between the left amygdala and dmPFC
to social evaluation supporting heightened emotional reactiv- has been previously implicated in conscious fear perception
ity to real-world social threat confers risk for psychopathology (Williams et al., 2006). Additionally, in clinically anxious youth,
throughout adolescence. altered connectivity between the amygdala and a similar dor-
Negative correlations between perceived social threat scores sal PFC region during threat processing was found to correlate
and anterior–ventral insula activation to both rejection and with EMA measures of avoidance in response to negative events
acceptance were unexpected. The anterior insula plays a (Price et al., 2016). Future connectivity analyses that incorporate
key role in salience processing and socioemotional process- information about directionality (e.g. non-parametric direction-
ing (Uddin, 2015; Uddin et al., 2017). Activation in the ality analysis; West et al., 2020) may help deepen understanding
insula has previously been correlated with self-report mea- of how the dorsal PFC and amygdala interact when processing
sures of distress, leading some researchers to consider this social rejection.
region as part of a ‘social pain’ network (Eisenberger, 2012). An important contribution of this study is the testing of a
However, more recent literature has challenged this view, novel EMA measure of social threat reactivity. This new measure
showing that the insula responds strongly to social accep- allowed us to collect more detailed information on teens’ emo-
tance as well as social rejection (Dalgleish et al., 2017; Perini tional reactions to perceived negative interpersonal interactions
et al., 2018). This may support the role of the insula as with peers. We view this perceived social threat score as a state
a ‘neural sociometer’ that tracks salient social information measure that when aggregated across time indexes trait levels of
that may influence an individual’s social inclusion status sensitivity to social threat in daily life, with improved ecological
(Dalgleish et al., 2017). In this way, high insula activity to any validity and measurement precision. Work from the personality
social feedback may be healthy and adaptive, helping indi- literature suggests that traits seem to associate with momen-
viduals to appropriately respond to important social cues and tary manifestations of behavior such that people who have
successfully navigate their environments. Of note, most ado- higher momentary levels on a variable also have higher trait
lescents showed significant positive insula activation to social levels (Fleeson and Gallagher, 2009; Fleeson and Jayawickreme,
rejection and acceptance. However, adolescents with more pos- 2015). As expected, this measure correlated only moderately
itive insula activation to any social feedback perceived lower with a measure of NA at the between-person level (r = 0.40),
social threat in daily life, which again could argue for the role of suggesting that adolescent girls who are more emotionally reac-
the insula as a sociometer. More broadly, whole-brain findings tive to negative social interactions also generally experience
suggest that similar brain regions are recruited when processing higher NA in daily life. Frequency of negative peer interactions
social acceptance and rejection. was also notable. On average, participants reported more than
Exploratory whole-brain analyses also identified a negative one negative peer interaction per day, underscoring how com-
correlation between perceived social threat scores and acti- mon negative peer experiences are during the early adolescent
vation in the right inferior parietal cortex to social rejection period. High rates of negative peer interactions could also be
and social acceptance relative to control. The inferior parietal related to oversampling based on shy/fearful temperament, as
cortex plays a role in self-referential processing (Sajonz et al., shyness has been linked to greater peer victimization and lower
2010), and activity in the right inferior parietal cortex specif- friendship quality in childhood (Kingery et al., 2010).
ically has been associated with self-awareness (Uddin et al., Higher social threat scores could be explained by an underly-
2006) and perspective-taking (Ruby and Decety, 2003), as well ing sensitivity to all social or emotional experiences during ado-
as processing differences in social distance (i.e. close friend lescence (Nelson et al., 2005; Somerville, 2013; Guyer et al., 2016).
vs acquaintance; Parkinson, Liu, and Wheatley, 2014). Thus, However, only modest within-person associations between
this region may play a role in generating awareness of how social threat scores and NA in response to negative peer inter-
the self is connected to others (Decety and Somerville, 2003). actions, and null within-person associations between socialYou can also read