Multi-Electrode Array Analysis Identifies Complex Dopamine Responses and Glucose Sensing Properties of Substantia Nigra Neurons in Mouse Brain ...
←
→
Page content transcription
If your browser does not render page correctly, please read the page content below
ORIGINAL RESEARCH
                                                                                                                                              published: 26 February 2021
                                                                                                                                         doi: 10.3389/fnsyn.2021.635050

                                             Multi-Electrode Array Analysis
                                             Identifies Complex Dopamine
                                             Responses and Glucose Sensing
                                             Properties of Substantia Nigra
                                             Neurons in Mouse Brain Slices
                                             Nadja Mannal 1 , Katharina Kleiner 1 , Michael Fauler 1 , Antonios Dougalis 1 ,
                                             Christina Poetschke 1 and Birgit Liss 1,2*
                                             1
                                               Institute of Applied Physiology, University of Ulm, Ulm, Germany, 2 Linacre and New College, University of Oxford, Oxford,
                                             United Kingdom

                                             Dopaminergic (DA) midbrain neurons within the substantia nigra (SN) display an
                                             autonomous pacemaker activity that is crucial for dopamine release and voluntary
                                             movement control. Their progressive degeneration is a hallmark of Parkinson’s disease.
                                             Their metabolically demanding activity-mode affects Ca2+ homeostasis, elevates
                                             metabolic stress, and renders SN DA neurons particularly vulnerable to degenerative
                                             stressors. Accordingly, their activity is regulated by complex mechanisms, notably by
                                             dopamine itself, via inhibitory D2-autoreceptors and the neuroprotective neuronal Ca2+
                                             sensor NCS-1. Analyzing regulation of SN DA neuron activity-pattern is complicated
                         Edited by:
                                             by their high vulnerability. We studied this activity and its control by dopamine, NCS-
               Francesco Ferraguti,
 Innsbruck Medical University, Austria       1, and glucose with extracellular multi-electrode array (MEA) recordings from midbrain
                        Reviewed by:         slices of juvenile and adult mice. Our tailored MEA- and spike sorting-protocols allowed
                     Nicola B. Mercuri,      high throughput and long recording times. According to individual dopamine-responses,
  University of Rome Tor Vergata, Italy
                    Valentina Carabelli,
                                             we identified two distinct SN cell-types, in similar frequency: dopamine-inhibited and
                University of Turin, Italy   dopamine-excited neurons. Dopamine-excited neurons were either silent in the absence
                   *Correspondence:          of dopamine, or they displayed pacemaker-activities, similar to that of dopamine-inhibited
                               Birgit Liss
                                             neurons. Inhibition of pacemaker-activity by dopamine is typical for SN DA neurons, and
                  birgit.liss@uni-ulm.de
                                             it can undergo prominent desensitization. We show for adult mice, that the number of
       Received: 29 November 2020            SN DA neurons with desensitized dopamine-inhibition was increased (∼60–100%) by
        Accepted: 08 January 2021            a knockout of NCS-1, or by prevention of NCS-1 binding to D2-autoreceptors, while
       Published: 26 February 2021
                                             time-course and degrees of desensitization were not altered. The number of neurons
                             Citation:
       Mannal N, Kleiner K, Fauler M,        with desensitized D2-responses was also higher (∼65%) at high glucose-levels (25 mM),
  Dougalis A, Poetschke C and Liss B         compared to lower glucose (2.5 mM), while again desensitization-kinetics were unaltered.
 (2021) Multi-Electrode Array Analysis
         Identifies Complex Dopamine
                                             However, spontaneous firing-rates were significantly higher at high glucose-levels
    Responses and Glucose Sensing            (∼20%). Moreover, transient glucose-deprivation (1 mM) induced a fast and fully-
        Properties of Substantia Nigra       reversible pacemaker frequency reduction. To directly address and quantify glucose-
       Neurons in Mouse Brain Slices.
Front. Synaptic Neurosci. 13:635050.         sensing properties of SN DA neurons, we continuously monitored their electrical activity,
    doi: 10.3389/fnsyn.2021.635050           while altering extracellular glucose concentrations stepwise from 0.5 mM up to 25 mM.

Frontiers in Synaptic Neuroscience | www.frontiersin.org                            1                                          February 2021 | Volume 13 | Article 635050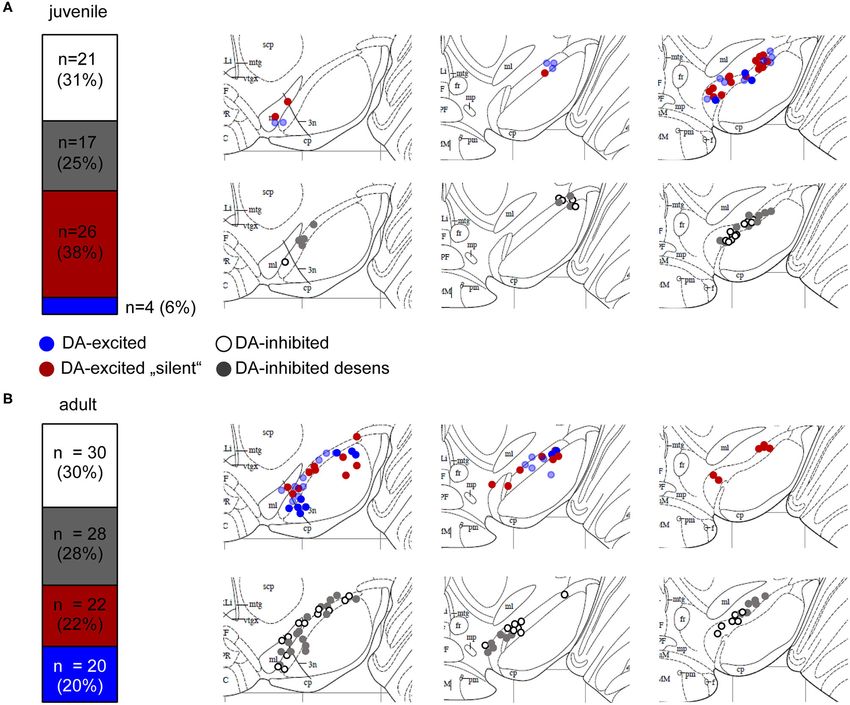
Mannal et al.                                                                                                       Dopamine & Glucose Responses in SN Neurons

                                            SN DA neurons were excited by glucose, with EC50 values ranging from 0.35 to 2.3 mM.
                                            In conclusion, we identified a novel, common subtype of dopamine-excited SN neurons,
                                            and a complex, joint regulation of dopamine-inhibited neurons by dopamine and glucose,
                                            within the range of physiological brain glucose-levels.

                                            Keywords: glucose-excited GE-neurons, dopamine excited neurons, dopamine inhibited neurons, dopamine-
                                            autoreceptor, neuronal calcium sensor NCS-1, GIRK channel, dopamine receptor desensitization, glucose-
                                            responsive neurons

INTRODUCTION                                                                           2012; Giguere et al., 2019; Wong et al., 2019), as well as their
                                                                                       particular mode of electrical activity. SN DA neurons display an
Dopamine and dopamine-releasing (DA) neurons are important                             autonomous pacemaker activity that is crucial for axonal and
for a variety of brain functions and processes like movement                           somatodendritic dopamine release (Rice and Patel, 2015; Sulzer
control, habit-formation, conditioning, cognition, novelty-                            et al., 2016; Liu and Kaeser, 2019). This activity causes additional
related behavior, motivation, reward prediction, and glucose                           metabolic stress, as it is associated, in SN but not in VTA
homeostasis (Dodson et al., 2016; Koekkoek et al., 2017; Berke,                        DA neurons, with oscillatory elevated levels of free intracellular
2018; Ter Horst et al., 2018; Collins and Saunders, 2020). DA                          Ca2+ , due to the activation of voltage-gated Ca2+ channels
midbrain neurons in the Substantia nigra (SN) are particularly                         (Cav) during action potentials (Zamponi et al., 2015; Philippart
important for voluntary movement control, and their progressive                        et al., 2016; Liss and Striessnig, 2019; Zampese and Surmeier,
degeneration causes the main motor-symptoms of Parkinson’s                             2020). These activity-related Ca2+ dynamics stimulate electrical
disease (PD), the 2nd most common neurodegenerative disease                            activity, ATP synthesis and dopamine release, and thus facilitate
(Kordower et al., 2013; Obeso et al., 2017; Poewe et al.,                              movement. But they also constitute an intrinsic metabolic burden
2017; Hernandez et al., 2019). SN DA neurons are particularly                          that can trigger neurodegeneration. Consequently, the activity
vulnerable to degenerative stressors, while neighboring DA                             of SN DA neurons is tightly controlled by a variety of (still
neurons in the ventral tegmental area (VTA) are less affected (Fu                      not fully understood) feed-back and feed-forward mechanisms
et al., 2016; Vogt Weisenhorn et al., 2016; Surmeier et al., 2017).                    (Dragicevic et al., 2015; Duda et al., 2016; Michel et al., 2016;
The causes for this differential vulnerability of DA neurons and                       Gantz et al., 2018).
for their selective degeneration in PD are still unclear. However,                         Dopamine itself is modulating the activity of SN DA neurons
a variety of intrinsic and extrinsic factors have been identified,                     in a negative feedback-loop by activation of inhibitory dopamine-
pointing to converging mechanisms, in particular cell-specific                         autoreceptors of the D2-type (D2-AR) (Lacey et al., 1987;
electrical activity patterns, calcium homeostasis and elevated                         Beckstead et al., 2004; Ford, 2014). Somatodendritic D2-AR are
metabolic stress (Duda et al., 2016; Giguere et al., 2018; Gonzalez-                   best-known to activate G-protein coupled inwardly rectifying
Rodriguez et al., 2020; Lebowitz and Khoshbouei, 2020).                                K+ channels (GIRK2), and leading to hyperpolarized membrane
   SN DA neurons display a high level of intrinsic metabolic                           potentials, but other signaling mechanisms are described
stress already under control conditions. This is due to the size and                   (Cardozo and Bean, 1995; Evans et al., 2017; Philippart and
complexity of their unmyelinated axonal arbors in their striatal                       Khaliq, 2018; Chen et al., 2020). Inhibitory dopamine responses
target regions, which is an order of magnitude greater than                            can desensitize, meaning that neuronal activity is regained
that of less susceptible dopamine neurons (Bolam and Pissadaki,                        although dopamine is still present (Gainetdinov et al., 2004).
                                                                                       D2-receptor desensitization is modulated by many (incompletely
Abbreviations: ACSF, artificial cerebrospinal fluid; AMP, adenosine                    characterized) processes (Bonci and Hopf, 2005; Robinson et al.,
monophosphate; Arc, arcuate nucleus; Cav, voltage-gated calcium channel;               2017a). In particular by Ca2+ dependent processes (Beckstead
CFTR, cystic fibrosis transmembrane conductance regulator; CV, coefficient of          and Williams, 2007; Liu et al., 2008; Perra et al., 2011; Evans et al.,
variation; D2-AR, autoreceptor of the D2 type; DA, dopamine; DMN, dorsomedial          2017; Gantz et al., 2018), like the Ca2+ dependent binding of
nuclei; DMV, dorsal motor nucleus of the vagus; DNIP, D2/NCS-1 interaction
                                                                                       the neuronal Ca2+ sensor NCS-1 to D2-ARs, as demonstrated
preventing peptide; EC50, half maximal effective concentration; GE, glucose
excited; GFP, green fluorescent protein; GI, glucose inhibited; GIRK, G-protein        for SN DA neurons from juvenile mice (Kabbani et al., 2012;
coupled inwardly rectifying K+ ; GK, glucokinase; GLUT, glucose transporter; HT,       Dragicevic et al., 2014; Poetschke et al., 2015). NCS-1 is of special
hypothalamus; ISI, interspike interval; K2P (TASK), two-pore domain potassium;         interest as it stimulates mitochondrial function and promotes
K-ATP, ATP-sensitive K+ ; KO, knockout; Kv , voltage-gated potassium channel;          neuronal survival (Catoni et al., 2019; Nakamura et al., 2019).
L-Dopa, Levodopa; LH, lateral hypothalamus; MEA, multi-electrode array; MUA,
multi unit activity; NCS-1, neuronal Ca2+ sensor; PBM, parabrachial medial
                                                                                       In SN DA neurons, NCS-1 regulates the expression of genes
nucleus; PBS, phosphate buffered saline; PCA, principal component analysis;            involved in mitochondrial function, and NCS-1 loss increased
PD, Parkinson’s disease; PN, post-natal; PVN, periventricular nucleus; SD,             their vulnerability in a PD mouse model (Benkert et al., 2019;
standard deviation; SE, standard error; SEM, standard error of the mean; SGLT,         Simons et al., 2019). In remaining human SN DA neurons
sodium glucose co-transporter; SN, substantia nigra; srDNIP, scrambled DNIP;           from post-mortem PD brains, NCS-1 mRNA levels are elevated
SUA, single unit activity; T1R, sweet taste receptor; T2DM, diabetes mellitus
type 2; TH, tyrosine hydroxylase; TRPC, transient receptor potential channel;
                                                                                       (Dragicevic et al., 2014), pointing to a neuroprotective role of
VMH, ventromedial hypothalamus; VMN, ventromedial nucleus; VRAC, volume                NCS-1 in PD. Dopamine, D2-receptors, and NCS-1 are also
regulated anion channels; VTA, ventral tegmental area; WT, wildtype.                   important for regulation of glucose homeostasis, pancreatic

Frontiers in Synaptic Neuroscience | www.frontiersin.org                           2                                    February 2021 | Volume 13 | Article 635050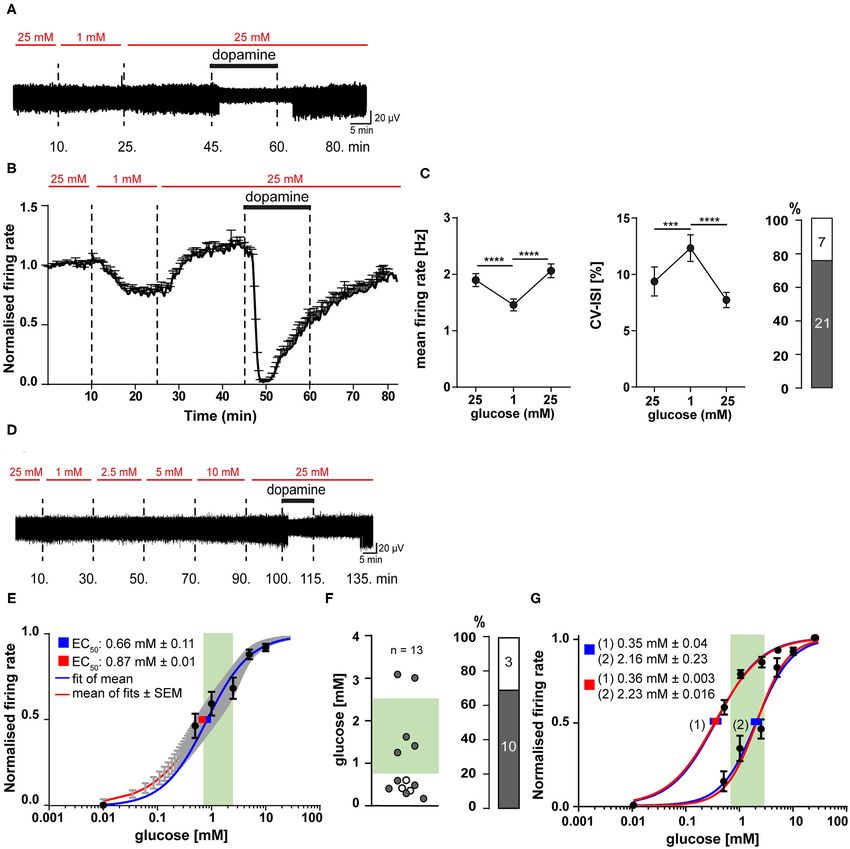
Mannal et al.                                                                                        Dopamine & Glucose Responses in SN Neurons

insulin secretion, and body weight (Gromada et al., 2005; Lopez           recordings were performed and analyzed, as previously described
Vicchi et al., 2016; Hassanabad and Fatehi, 2019; Ratai et al.,           (Dragicevic et al., 2014; Poetschke et al., 2015).
2019; Liu et al., 2020). SN DA neurons and pancreatic beta-
cells (responsible for peripheral glucose sensing and insulin             Multi-Electrode Array (MEA) Experiments
secretion) modulate each other’s function and possess similar             Brain Slice Preparation
signaling mechanisms, like D2-receptors, K-ATP channels, and              Juvenile and adult mice were deeply and terminally anesthetized
Cav mediated activity-modulation (Eberhard, 2013; Fiory et al.,           with isoflurane, and decapitated. During slicing, for orientation,
2019; Farino et al., 2020; Liu et al., 2020). However, direct             a tiny hole was punched into the left side of the brain using a
glucose sensing properties of SN DA neurons have not yet been             blunted 21G cannula.
reported. Glucose sensing neurons are best described in the                   For juvenile mice (∼PN 13), after decapitation, the brain was
hypothalamus, but also in other brain regions (Koekkoek et al.,           quickly removed from the cranial cavity, cooled and cut into
2017; Alvarsson and Stanley, 2018). They alter their electrical           250 µm coronal midbrain slices in ice cold artificial cerebrospinal
activity with changes in extracellular glucose levels. Glucose-           fluid (ACSF) using a vibratome (VibrosliceTM type: HA752,
excited (GE) neurons increase their action potential frequency as         Campden Instruments, UK), and stainless steel blades (Campden
glucose levels increase (similar to pancreatic beta cells), whereas       Instruments Ltd.). ACSF contained (in mM): 125 NaCl, 2.5 KCL,
glucose-inhibited (GI) neurons decrease their activity with rising        25 NaHCO3 , 1.25 NaH2 PO4 , 2 MgCl2 , 2 CaCl2, and 25 glucose,
glucose levels (Routh, 2010).                                             bubbled with carbogen (95% CO2 /5% O2 ) for pH adjustment
   Here, we studied the modulation of SN DA neuron activity by            (7.3) and oxygenation. Slices were allowed to recover for 30 min
dopamine, NCS-1, and glucose. As this analysis is complicated             at room temperature in the same ACSF.
by the particularly high vulnerability of SN DA neurons toward                For adult mice, brain slice preparation was carried out
metabolic stressors, we used optimized extracellular multi-               utilizing a slightly altered version of the “slice it hot” protocol
electrode array (MEA) approaches to study neuronal activity               (Ankri et al., 2014). After brain removal, coronal midbrain slices
in vital mouse brain slices. MEA recordings followed up by                (200 µm) were prepared using a vibratome (Leica VT1200S,
spike-sorting allowed us to analyze SN DA neurons without                 amplitude 1.4 mm, speed 0.6 mm/s) with ceramic blades
selection-bias and with much higher throughput compared to                (Campden Instruments Ltd.) in ACSF at ∼36◦ C. This ACSF
patch clamp techniques. Based on their dopamine-responses, we             contained (in mM): 124 NaCl, 3 KCl, 26 NaHC03 , 1.2 KH2 PO4,
identified two types of SN neurons that were either dopamine-             1 MgCl2 , 1 CaCl2 , 10 glucose, bubbled with carbogen (95%
excited or dopamine-inhibited. Both SN populations were similar           CO2 /5% O2 ) for pH adjustment (7.3) and oxygenation. Slices
in size. The number of dopamine-inhibited SN DA neurons                   were allowed to recover for 1 h at 37◦ C in ACSF-recovery
with desensitized responses was reduced by NCS-1 activity, and            solution containing (in mM): 125 NaCl, 2.5 KCl, 25 NaHCO3 ,
increased by elevated extracellular glucose, but the kinetics of          1.25 NH2PO4 , 1 MgCl2 , 1 CaCl2 , 25 mM glucose.
inhibitory dopamine-responses were not altered. SN DA neurons                 All chemicals were obtained from Sigma, if not
displayed fast and reversible glucose-responsiveness in a dose-           stated otherwise.
dependent manner, with higher electrical activity at elevated
glucose levels, and within the physiological range of brain glucose       MEA Recordings
levels. Thus, SN DA neurons display GE-neuron properties,                 The ACSF for MEA-recordings (“recording-ACSF”) contained
similar as beta-cells.                                                    (in mM): 125 NaCl, 2.5 KCl, 25 NaHCO3 , 1.25 NH2 PO4 , 1
                                                                          MgCl2 , 1 CaCl2 , with variable glucose concentrations (0.5–
                                                                          25 mM). We added 10 µM DNQX disodium salt (Tocris) and
MATERIALS AND METHODS                                                     10 µM Gabazine (Tocris) to block fast synaptic transmission.
                                                                          When glucose was below 25 mM, sucrose was added to get a
Animals                                                                   total of 25 mM sugar in the solution to keep the osmolarity
All mice were bred and housed in the facilities of the University
                                                                          stable (300–315 mOsm/l). ACSF was bubbled with carbogen
of Ulm, according to the German Tierschutzgesetz and the
                                                                          (95% CO2 /5% O2 ) for pH adjustment (7.3) and oxygenation.
directive 2010/63/EU. All animal procedures were approved
                                                                             For MEA-recordings 3D-Biochips were used, manufactured
by the Regierungspräsidium Tübingen (Reg. Nr. 0.147 and
                                                                          by Qwane Biosciences SA (Switzerland). The electrode array
TV1043). Only male mice were analyzed. Wildtype mice are
                                                                          layout of the MEA-chips was customized for covering the shape
derived from C57BL/6J. NCS-1 KO mice (obtained by Olaf
                                                                          of the SN in coronal mouse brain sections. The MEA-chips
Pongs) were back-crossed at least 10 times into C57BL/6J (Ng
                                                                          contain 60 3D tip-shaped platinum electrodes, arranged in a 15
et al., 2016), leading to a 99.9% analogy with C57BL/6J, and losing
                                                                          row × 4 column array. Interelectrode distance is 100 µm in rows
the 129/SvJ original background (Eisener-Dorman et al., 2009).
                                                                          and 90 µm in columns (measured from center to center). Each
Data from littermate NCS-1 +/+ were not significantly different
                                                                          electrode is 30 µm in diameter, and the tip extends 25–40 µm
from those of C57BL/6J and were pooled.
                                                                          from the base. The surface of the chips is covered by a 5 µm layer
                                                                          of SU-8 epoxy and has an electrical impedance of 500–800 k.
Patch Clamp Experiments                                                   For optimized tissue to electrode contact, biochips were plasma
Coronal mouse brain slices were prepared (similar as detailed             cleaned every second week for 2 min under low vacuum (0.5
below for MEA experiments), and perforated patch clamp                    Torr, service of the Electron Microscopy Facility, University of

Frontiers in Synaptic Neuroscience | www.frontiersin.org              3                                  February 2021 | Volume 13 | Article 635050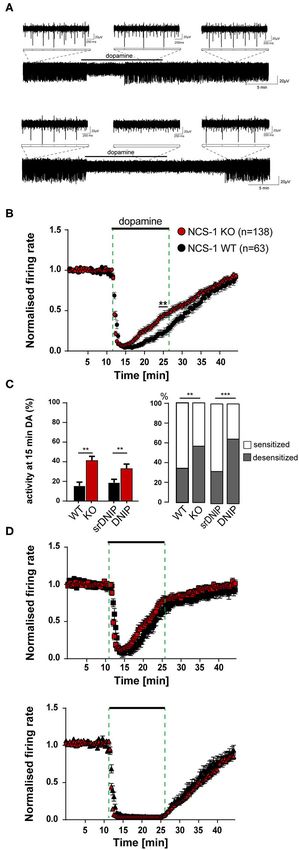
Mannal et al.                                                                                          Dopamine & Glucose Responses in SN Neurons

Ulm). MEA chips were stored at 4◦ C, and reused for 3–6 months              by switching recording-ACSFs with respective different glucose
depending on the intensity of usage.                                        concentrations. Delay-time until dopamine/peptides/altered
    MEA recordings were carried out using either a USB                      glucose reached the recording chamber was about 120 s. For
MEA1060-Up-BC System or a MEA2100-2x60 System                               NCS-1 experiments, results for adult mice (∼PN90) are shown,
(Multichannel Systems, Germany). For the MEA1060-System,                    but SN DA neurons from juvenile mice displayed similar
slices were mounted onto the MEA-chip under a stereoscope                   responses (data not shown; and see Dragicevic et al., 2014;
(Leica M165C). For the 2100 MEA System, slices were directly                Poetschke et al., 2015). For glucose sensing experiments, results
mounted on the amplifier with help of a video table (MEA-                   for juvenile mice are shown (∼PN13) as they coped better with
VMTC-2, Multichannel Systems). Slices were kept in place                    very low glucose concentrations, but SN DA neurons from adult
by a self-made grid, consisting of nylon strings affixed to a               mice displayed similar qualitative glucose responses.
semi-circle platinum wire (3 mm diameter of the wire, 1.3 g
total weight). Careful and correct positioning of the slice on              Data Analysis
the chip and placing the grid without moving or harming the                 Spike Sorting
slice was crucial for successful experiments. Before and after              MEA-recording files were saved as mcd-files. Electrodes that
placing the grid, images were taken to document the MEA chip                recorded a response to dopamine (i.e., change of event-rate)
positioning (Figure 1).                                                     were already marked during the recording, based on the online
    The recording chamber containing the MEA-chip was                       analysis options in the MC_Rack software. To minimize file sizes,
constantly perfused with the carbogenated recording-ACSF                    recording files were re-recorded containing only the electrodes
by a peristaltic pump (∼4 ml/min, Ismatec, Germany). The                    displaying a response to dopamine (either increased or decreased
temperature control of the inlet cannula (TC02 with PH01,                   event-rate). The generated second mcd file was imported into
Multichannel Systems, Germany) was set to 35◦ C and the                     Spike2 and converted to a smrx file.
inbuilt amplifier heating plate to 40◦ C, resulting in a bath                  Spike sorting of MEA recordings was carried out with
temperature of 31–33◦ C (checked by a hand-thermometer before               Spike2 software (8.02e x64, Cambridge Electronic Design Ltd.).
each experiment). After transfer into the recording chamber,                A threshold trigger was manually set by the experimenter,
slices were allowed to equilibrate in recording-ACSF for 30 min.            depending on the signal to noise ratio of the respective recording.
    Data were sampled at 20 kHz using the MC_Rack software                  The detected spikes displayed an amplitude of ∼25-50 µV with a
(version 4, Multichannel Systems, Germany). Data was recorded               background noise of 15-25 µV. Via principal component analysis
using a low pass (3,000 Hz) and a high pass (200 Hz) butterworth            (PCA), Spike2 generates so-called spike templates, by matching
2nd order filter. The software allows simultaneous recordings               and grouping spikes according to their principal components.
and online analysis. The so-called spike analyzer tool was used             These principal components are distinct features of the spikes
to identify the electrodes displaying activity directly during              like shape, amplitude, and length. The algorithm tries to separate
recordings: This tool is an in-built spike sorter that detects spikes       the spikes in a direction of the largest variance. Meaning that
within the signals, recorded by each electrode. The threshold               the principal components with the highest variation in-between
for spike detection is set automatically by the software and                are chosen to generate the final spike templates. Spikes were
individually for each electrode depending on the signal to noise            separated by the software choosing the first two or three principal
ratio. Detected spikes were continuously displayed in the spike             components (Lewicki, 1998). Templates were then automatically
analyzer display. Electrodes showing a reaction to DA application           plotted in a 3D coordinate system as clusters, where every
(i.e., change of event-rate, either elevated or reduced) were               spike is displayed as a single dot and the chosen principal
marked for further data analysis (see below).                               components represent the three axes x, y, and z. This enables
    The basic experimental design, carried out in recording-                manual reassignment of spikes, if necessary. For further details
ACSF, was as follows (with 2.5 mM glucose if not stated                     see manual “Spike2 version 9 for Windows.”
otherwise): 10 min baseline recording of pacemaker-activities
(for determining basal frequency and CV-ISI-values), followed               Identification of Single Unit Activity (SUA) With
by bath-application of 100 µM dopamine hydrochloride for                    Spike2 Software
15 min, and a 20 min wash-out phase of dopamine. For DNIP                   If spike sorting by automatic Spike2 analysis was successful,
(D2R/NCS-1 interaction prevention) experiments the DNIP                     the activity will be split into separate single unit activities.
peptide, or its scrambled (srDNIP) control, were synthesized                This means, that each activity, recorded from the individual
by Genscript according to the published amino acid sequences                electrodes, can be assigned to a single neuron. Since this was not
(Saab et al., 2009; Kabbani et al., 2012). Peptides were dissolved          always the case, after the automatic principal component analysis
in recording-ACSF, and bath-applied at a final concentration                by Spike2 software, manual cluster analysis optimization by the
of 10 µM. DNIP-experiments were carried out as follows:                     experimenter is often necessary, to sort out appropriate SUAs out
after 10 min baseline recordings, slices were incubated for                 of automatically classified multi unit activity (MUA).
30 min with recording-ACSF containing DNIP/srDNIP,                              For identification of a single unit activity (SUA), the sorted
followed by recording of 10 min baseline activity, 15 min                   activity was manually checked in Spike2 for the following pre-
dopamine application, and 20 min washout of dopamine (all                   selection criteria: (a) a lack of events occurring during the
in recording-ACSF with DNIP/srDNIP). For glucose sensing                    first 200 ms (short ISI range) shown in an interval histogram:
experiments, different glucose concentrations were bath-applied             the number of events before the first big peak of the interval

Frontiers in Synaptic Neuroscience | www.frontiersin.org                4                                  February 2021 | Volume 13 | Article 635050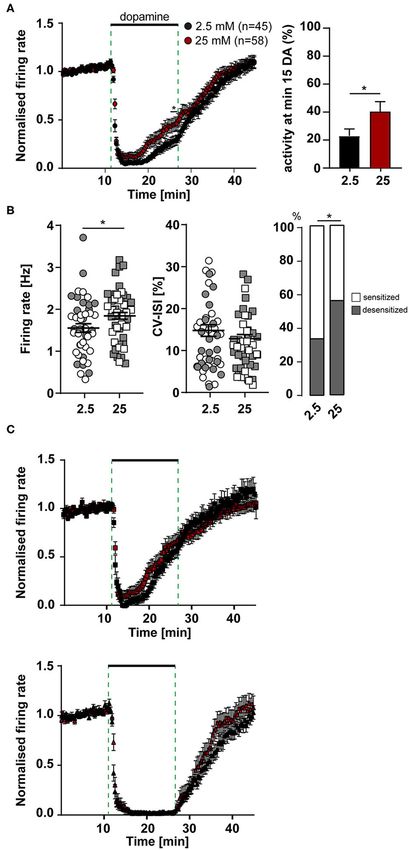
Mannal et al. Dopamine & Glucose Responses in SN Neurons
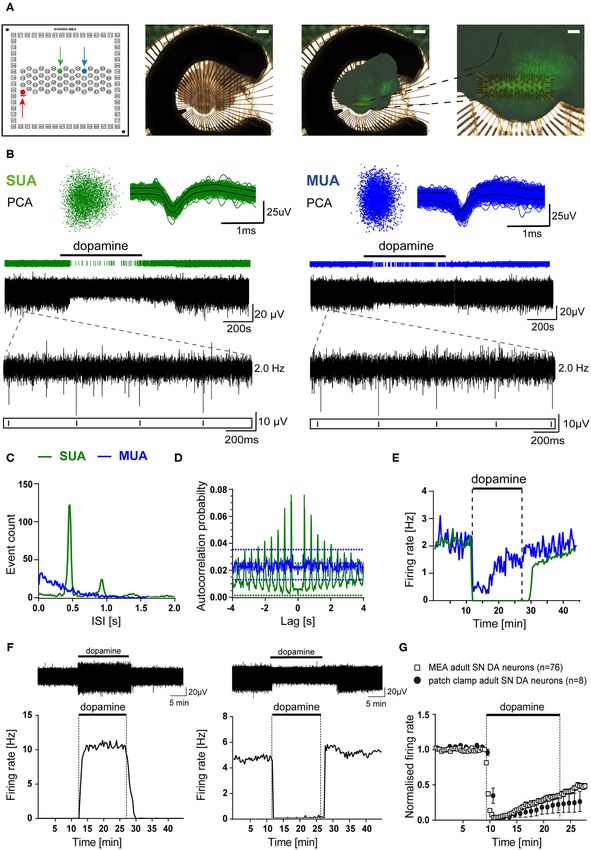
FIGURE 1 | MEA analysis identified dopamine-inhibited and dopamine-excited Substantia nigra neurons in mouse midbrain slices. Recordings were obtained from
C57BL/6J mouse brain slices in ACSF containing 2.5 mM glucose (A) Left panel: schematic channel layout of the used 3D MEA chip, containing 60 platinum
3D-electrodes. The red arrow marks the reference-electrode. The electrodes marked by green and blue arrows correspond to the respective recordings shown
(Continued)
Frontiers in Synaptic Neuroscience | www.frontiersin.org 5 February 2021 | Volume 13 | Article 635050Mannal et al. Dopamine & Glucose Responses in SN Neurons
FIGURE 1 | in (B–E). Middle panel: Image of a typical coronal midbrain slice, mounted on the 3D MEA biochip (scale bar: 1 mm). Right panels: Overlay of the image
before recording with the respective image of the same slice, fixed and stained for tyrosine hydroxylase (TH), after MEA-recording. Magnification (far right) allows
identification of the electrode array positioning within the SN (scale bars: 1 mm, and 250 µm, respectively). (B) Spike sorting analysis of MEA recordings from two
individual electrodes (marked in A, left), with identified single unit activity (SUA, left) and multiunit activity (MUA, right) with inhibitory dopamine-responses
(bath-application of 100 µM dopamine indicated by horizontal bars). Upper panel: 3D-spike templates after principal component analysis (PCA, left) and overlaid
spike-waveforms (right). Lower panel: event-plots and original traces over time. Inserts display enlargements of 2 s, as indicated. (C) Histograms (event counts) of
individual interspike-intervals (ISI, in 20 s bins) for the two electrodes from (A,B). Note one clear peak and no activity below 200 ms, only in the SUA. (D)
Autocorrelation probabilities, plotted against ISI (using a Boxcar filter smoothing routine of three bins in width). Note that only the SUA shows clear regular activity
exceeding the 99% confidence interval. (E) Firing rates (in Hz) plotted over time (in 20 s bins) for both recordings. Note fully inhibited activity by dopamine, typical for
SN DA neurons, only for the SUA. (F) Upper panels: Exemplary SUA MEA-recording traces. Lower panels: Firing rates plotted over time (in 20 s bins) of a
dopamine-excited (left) and a dopamine-inhibited (right) SN neuron (bath application of 100 µM dopamine as indicated). (G) Comparison of mean normalized firing
rates of dopamine-inhibited SN DA neurons from adult mice, recorded with MEA (white squares), or with perforated-patch clamp techniques (black circles). Shown are
normalized mean frequencies, plotted over time (20 s bins for MEA, 1 min bins for patch clamp; MEA: n = 76, perforated patch: n = 8). Data are given as mean ±
SEM. All data and statistics are detailed in Supplementary Figures 1, 4A and Supplementary Tables 1, 2.
histogram must not exceed 15% of this peak. (b) A clear and correlation is typical if the same neuron had been recorded
regular pacemaker activity, belonging to one unit, as judged by from two different electrodes (Berretta et al., 2010). However, we
autocorrelation. The autocorrelation is defined as the correlation cannot exclude that this approach occasionally eliminates SUAs
of the activity of a unit with a delayed copy of itself. (c) from different cells with highly synchronized firing-patterns.
A lack of cross-correlation with other units recorded from
the same electrode (for multi unit activity, only). (d) The Further Analysis of Verified SUA
appropriate typical shape of the waveform average of the unit. For further analysis, the mean firing rate (in 20 s bins) of each
Supplementary Figure 1 shows a typical example of a SUA, verified SUA was exported into excel from Spike2. To define the
derived from a single SN DA neuron. Only units fulfilling these basal firing rate, the mean firing rate of a stable 10 min control
criteria were further analyzed. Clusters representing obvious period at the beginning of each recording was calculated. For
multi unit activity, meaning that they very likely contain describing pacemaker-regularity, the mean interspike-interval
activities of more than one neuron, were excluded from further (ISI = 1/frequency) and its standard deviation (SD) were
analysis. These criteria are used only for pre-selection of determined for this 10 min control period, to calculate the
possible SUAs. Statistical analysis is carried out subsequently with coefficient of variation (CV) of the ISI:
Neuroexplorer, as the options offered by Spike2 are limited, but SD (ISI)
pre-selection is carried out to reduce the amount of data that has CV [%] = ∗ 100
mean (ISI)
to be imported to Neuroexplorer later.
Cells displaying a pacemaker frequency above 6 Hz or CV-ISI
values higher than 30% were excluded from further analysis in
Verification of Single Unit Activity With Neuroexplorer all data-sets, as typical SN DA neurons in mouse brain slices
Software, Exclusion of Multi Unit Activity (MUA), and in synaptic isolation display slower and very regular pacemaker
of Duplicate Recordings activities in the range of ∼1–4 Hz with CV-ISI between about
After Spike2 analysis, smrx files containing traces, including 5 and 15% (Wolfart and Roeper, 2002; Lammel et al., 2008;
timepoints of each spike of potential SUAs, were imported into Poetschke et al., 2015). VTA DA neurons display a faster (still
the Neuroexplorer software (vers. 4.032, Nex Technologies, USA) under 10 Hz) and a less regular pacemaker (Lammel et al., 2008;
to further analyze spontaneous activities of all recorded units Khaliq and Bean, 2010; Morales and Margolis, 2017). Note that
for all electrodes. For this, autocorrelation as well as cross- MEA-derived CV-ISI values can differ from those derived from
correlation probability histograms were generated and analyzed. patch clamp experiments, due to the automated spike-sorting
As before, autocorrelation histograms correlate a unit with a process and missed spikes.
delayed copy of itself, while cross-correlation analysis allows to For analysis of relative firing-rates in dopamine, firing-
identify if the same SUA is recorded by more than one electrode, rates in the last minute in dopamine (i.e., minute 15) were
as all units recorded on one slice are analyzed for correlation. For normalized to the mean firing rate during the 10 min control
both, 10 min of baseline activities were analyzed using a Boxcar period. An inhibitory dopamine D2-AR response was classified as
filter smoothing routine of 3 bins (30 ms) in width (Berretta desensitized if the mean frequency in the last minute of dopamine
et al., 2010). Auto-correlation probability had to exceed the 99% was higher than 5% of the respective basal firing rate.
confidence interval to be identified as SUA and included into the Cumulative glucose dose-response curves were fitted and
dataset. All identified SUAs, recorded with the same MEA-chip EC50 values were determined by using the hill equation (in
were tested for synchrony via their cross-correlation probability PRISM, equation type: log(agonist) vs. response-variable slope,
plots. In case units display a peak cross-correlation probability according to Goutelle et al., 2008):
exceeding the maximal 99% confidence interval, the electrode
with the better sorted signal (better signal to noise ratio) was xhillslope ∗ (top − bottom)
included, the other was excluded from the dataset, as this high y = bottom +
xhillslope + EC50 hillslope
Frontiers in Synaptic Neuroscience | www.frontiersin.org 6 February 2021 | Volume 13 | Article 635050Mannal et al. Dopamine & Glucose Responses in SN Neurons
With y = normalized firing rate, x = glucose concentration, goatserum (Vector Labs), 0.2 BSA (Roth), 0.5 Triton X in PBS,
hillslope = steepness of the curve, top = upper plateau of the for 2 h to prevent unspecific binding of the antibody. Afterwards,
curve, bottom = lower plateau of the curve. Top and bottom slices were washed one time (10 min) with PBS followed by an
were set to 1 and zero, respectively. The hillslope was freely fitted. overnight incubation with the primary antibody (1: 1000, mouse
EC50 values are given as the mean of individual EC50 , derived anti-TH, Merck Millipore). Slices were then washed three times
from individual fits for each analyzed cell (mean of individual for 10 min with PBS, followed by incubation with the secondary
fits), as well as from the fit of the mean values (fit of means, antibody (1:1000, Alexa Fluor 488 goat anti-rabbit, Thermofisher
population analysis). Scientific) for 3 h at room temperature, under light protection,
while shaking. The following steps were performed in darkness
Statistical Analysis using tinfoil to cover the well plates: The slices were washed
Data are given as mean ± standard error of mean (SEM) if not three times for 10 min with PBS. Afterwards, the slices were
stated differently. Standard Error (SE) or Standard Deviation mounted on superfrost glass slides (VWR), dried for 10 min, and
(SD) are given as indicated. The number of identified SUAs (i.e., covered with Vectashield Antifade Mounting Medium (Vector
individual cells) is given by n, number of mice is given by N. Data Laboratories, United States), and stored in the dark at 4◦ C.
were probed for normal distribution by using the Shapiro-Wilk Images were taken with an epifluorescent microscope (Leica
normality test. As some datasets were not normally distributed, DM6500 microscope with a Leica DFC7000 T camera), and
for most comparisons, non-parametric tests were used for documented with LAS-X software.
probing for significant differences. For statistical comparisons Graphical overlays of images taken before the recordings and
of basal firing rate, CV-ISI and relative activities at minute 15 of images after TH-staining were created using the GNU Image
in dopamine, a two-tailed, unpaired, non-parametric Mann- Manipulation Program (GIMP vers. 2.8.14). Neuroanatomical
Whitney-test (for pair-wise comparisons) was used. Differences positioning in maps was based on a mouse brain atlas (Paxinos
in the ratios of sensitized to desensitized D2-AR responses were and Franklin, 2001).
assessed by chi-square test for pair-wise group comparisons. To
evaluate differences in firing rates over time, two-way repeated- Data Availability
measures ANOVA (with Sidak’s multiple comparison post-hoc All datasets presented in this study are available from the
test) was used. For comparison of mean firing rates and CV-ISI corresponding author upon request.
in different glucose concentrations, repeated-measures one-way
ANOVA tests were used (Friedman test with Dunn’s multiple
comparison post-hoc test). For comparison of mean firing rates, RESULTS
CV-ISI and relative activities at minute 15 of DA between NCS-1
KO/WT and DNIP/srDNIP as well as DA-excited and -inhibited
MEA Analysis Identifies
SN neurons unpaired Kruskal-Wallis tests with Dunn’s multiple Dopamine-Inhibited and
comparison were used. To detect differences in the change of Dopamine-Excited Substantia nigra
firing-rate and the CV-ISI between decrease and increase of Neurons in Mouse Midbrain Slices
glucose concentration the Wilcoxon matched-pairs signed rank To allow a comprehensive analysis of neuronal activity patterns,
test was used. A single asterisk (∗ ) denotes a p < 0.05, two without compromising intracellular signaling and with high
(∗∗ ), three (∗∗∗ ), and four asterisks (∗∗∗∗ ) denoting p < 0.01, throughput, we established a suitable protocol for extracellular
0.001, and 0.0001, respectively. All statistical analysis and data brain slice recordings using multi-electrode arrays (MEA). The
transformations were performed in Prism (GraphPad Software utilized MEA-chip (custom-build by Qwane Biosciences SA)
Inc., USA). contained 60 3D tip-shaped platinum electrodes (30 µm tips),
arranged in a 15 row × 4 column array (Figure 1A). Coronal
Immunohistochemistry and Anatomical midbrain slices were mounted on these chips, so that the
Maps electrodes were covering the SN region, and chip positioning
To reconstruct the position of the electrodes, after MEA was documented. For verification of correct positioning of the
recording, slices were immunostained for tyrosine hydroxylase electrodes within the SN, after recordings, slices were PFA-fixed
(TH), similar as previously described (Lammel et al., 2008; and stained for tyrosine hydroxylase (TH), a marker for DA
Benkert et al., 2019). Therefore, after recordings, the grid was neurons in the midbrain (Figure 1A right panels). Electrodes
removed carefully using a forceps, and slices were transferred, located outside of the TH-positive SN, according to picture-
via a suction pipette, into a small glass containing recording overlays, were excluded from further analysis.
ACSF. Slices were immediately fixed with 4% PFA (Thermofisher Electrodes can record activity from more than one neuron
Scientific) in 1 × PBS (phosphate buffered saline, Thermofisher (multi unit activity MUA), but only electrodes with identified
Scientific, tablets, dissolved according to instructions) for 1 h at single unit activity (SUA) were further analyzed. SUA and MUA
room temperature. Slices were then transferred into a storing were identified after spike-sorting and principal component
solution containing (in %): 0.05 sodium azide, and 99.95 PBS, and analysis (PCA). Figure 1B shows examples of a typical SUA and
stored at 4◦ C. Slices were washed three times (10 min each) with MUA, derived from SN DA neurons. MUA were discriminated
PBS, and kept on a microplate shaker (300 rpm, VWR). Slices from SUA by a high number of events in the range before
were then incubated in blocking solution containing (in %): 10 200 ms (Figure 1C; >15% of big peak), an irregular pacemaker
Frontiers in Synaptic Neuroscience | www.frontiersin.org 7 February 2021 | Volume 13 | Article 635050Mannal et al. Dopamine & Glucose Responses in SN Neurons activity, assessed by a higher variation of the inter-spike interval compared to that of dopamine-inhibited cells appeared a bit (ISI, Figure 1D), and an only partial inhibition by dopamine faster but was not significantly different. However, the pacemaker (100 µM, bath-applied for 15 min; Figure 1E). These criteria can (before dopamine) was less precise in adults (CV-ISI inhibited: be used for identifying SUA derived from SN DA neurons, as 9.70 ± 5.28%, excited: 16.07 ± 10.48%; p = 0.0137). We they display in vitro in synaptic isolation a slow, very regular also mapped the anatomical location of dopamine-excited and pacemaker-activity (∼0.5-5 Hz, CV ISI: ∼5–10%), and a well- dopamine-inhibited cells (Figure 2). However, we identified no described full inhibition of pacemaker-activity in response to specific localization of either of these cell-types. extracellular dopamine (Lacey et al., 1987; Mercuri et al., 1994; For our further analysis, we focused on dopamine-inhibited Beckstead et al., 2004; Lammel et al., 2008). SUA derived MEA SN neurons, as this response is well-described for SN DA recordings from SN DA neurons displayed a clear peak in neurons. In juveniles and adult, SN DA neurons with inhibitory the event count histogram, low number of events in the 1- dopamine-responses displayed prominent desensitization in 200 ms range, an autocorrelation probability exceeding the 99%
Mannal et al.                                                                                                              Dopamine & Glucose Responses in SN Neurons

 FIGURE 2 | Mouse SN neurons displayed four different types of dopamine responses. Relative frequencies of four identified different dopamine-responses, and
 anatomical locations of MEA-recorded neurons from juvenile (A) and adult (B) mice. Experiments, MEA recordings, and data analysis described in Figure 1. Data
 were derived from juvenile (∼PN13) and adult (∼13W) C57BL/6J mice, recorded in ACSF containing 2.5 mM glucose. Left panels: SN neurons were classified
 according to their dopamine responses in DA-excited (44%, juveniles, 42% adults) and DA-inhibited (56% juveniles, 58% adults) cells. DA-excited cells were
 subclassified in neurons with (blue) and without (“silent,” red) spontaneous activity before DA-application. DA-inhibited cells were subdivided in neurons with (“desens,”
 grey) and without (white) prominent desensitization of dopamine responses over time. Numbers of DA-excited neurons with activity before DA-application was
 significantly higher in adults (p = 0.0025). Right panels: Maps displaying the anatomical locations of the DA-excited (upper) and DA-inhibited (lower) neurons within the
 SN, on caudal (left), medial (middle), and rostral (right) coronal slices. Maps are derived form the Paxinos mouse brain atlas (reproduced with permission from Elsevier
 Ltd.), figures 56, 57, 60 (Bregma: −3.08, −3.16, −3.52), respectively (Paxinos and Franklin, 2001). All data and statistics are detailed in Supplementary Table 1.

Supplementary Tables 3, 4). This analysis revealed that a general                        in the overall kinetic of the response. Moreover, these results
knock out of NCS-1, as well as prevention of NCS-1 binding                               indicate that SN DA neurons might switch between desensitized
to D2-AR specifically in SN DA neurons, massively increased                              or sensitized dopamine responses, and that NCS-1 is stimulating
the number of SN DA neurons displaying desensitized D2-AR                                sensitized responses.
responses (about 60% in NCS-1 KO, and over 100% in DNIP).                                   Sensitized D2-autoreceptor responses by NCS-1 would reduce
However, the time-course and degree of dopamine inhibition                               electrical activity, Ca2+ load and metabolic stress in SN DA
was neither altered by general NCS-1 knock out nor by the DNIP                           neurons, while desensitized D2-AR responses would increase
peptide. Hence the observed faster desensitization (Figure 3B,                           dopamine-release and thus facilitate movement—but also elevate
Supplementary Figure 2B) is only caused by higher numbers of                             Ca2+ load and metabolic stress levels. Hence, we hypothesized
SN DA neurons with desensitizing DA-responses and no change                              that general activity and the number of SN DA neurons

Frontiers in Synaptic Neuroscience | www.frontiersin.org                             9                                          February 2021 | Volume 13 | Article 635050
Mannal et al.                                                                                                            Dopamine & Glucose Responses in SN Neurons

                                                                                         FIGURE 3 | derived from adult NCS-1 WT, NCS-1 KO, and C57BL/6J mice
                                                                                         (for DNIP experiments; D2/NCS-1 interacting prevention peptide), recorded in
                                                                                         ACSF containing 2.5 mM glucose. (A) Exemplary traces of a SN DA neuron
                                                                                         with desensitized (upper) and with sensitized (lower) inhibitory dopamine
                                                                                         responses (mediated by D2-autoreceptors, D2-AR). Bath application of
                                                                                         100 µM dopamine indicated by horizontal bars. Inserts display enlargements
                                                                                         of 2 s during control period, DA application and wash-out phase. (B)
                                                                                         Normalized mean firing rates plotted over time for all analyzed SN neurons
                                                                                         from NCS-1 WT (black, n = 63) and NCS-1 KO (red, n = 138) mice. (C) Left
                                                                                         panel: Mean relative firing frequencies in the last minute of dopamine. Right
                                                                                         panel: Percentages of cells with desensitized dopamine-responses (grey), for
                                                                                         SN DA neurons from NCS-1 WT and KO, and in the presence of 10 µM DNIP
                                                                                         (n = 64), or 10 µM srDNIP (n = 96; scrambled DNIP, as control), as indicated.
                                                                                         (D) Data from (B), plotted separately for SN neurons with desensitized (upper,
                                                                                         WT: n = 22, KO: n = 77) and with sensitized inhibitory dopamine responses
                                                                                         (lower, WT: n = 41, KO: n = 61). Data are given as mean ± SEM.
                                                                                         Significances/p-values according to unpaired Kruskal-Wallis test with Dunn’s
                                                                                         multiple comparison, Chi-square, and unpaired Mann-Whitney-test. All data
                                                                                         and statistics are detailed in Supplementary Figures 2, 4B,
                                                                                         Supplementary Tables 3, 4.

                                                                                        with desensitized D2-AR responses could be higher at optimal
                                                                                        metabolic conditions, and lower in metabolic stress situation.
                                                                                        To test this, we analyzed pacemaker activity and dopamine-
                                                                                        responses at different glucose concentrations.

                                                                                        Elevated Glucose Levels Increase the
                                                                                        Number of SN DA Neurons With
                                                                                        Desensitized Inhibitory Dopamine
                                                                                        Responses and Their Pacemaker
                                                                                        Firing-Rate
                                                                                        We performed similar experiments, as described before, but
                                                                                        now comparing activity and the inhibitory dopamine response
                                                                                        of SN DA neurons in 2.5 mM glucose with those in 25 mM
                                                                                        glucose (Figure 4). In line with our hypothesis, the number
                                                                                        of SN DA neurons with a desensitized D2-AR response was
                                                                                        significantly higher in 25 mM glucose (∼50%, Figures 4A,B,
                                                                                        Supplementary Tables 5, 6). Again, the mean time-course and
                                                                                        degree of dopamine inhibition was not altered, neither in the
                                                                                        group of neurons with sensitized nor desensitized responses
                                                                                        (Figure 4C). Moreover, we observed that the mean pacemaker-
                                                                                        frequency of SN DA neurons before dopamine application was
                                                                                        significantly higher in 25 mM dopamine (∼20%; Figure 4A,
                                                                                        Supplementary Table 5). Pacemaker precision (CV-ISI) was not
                                                                                        different in 25 mM glucose.
                                                                                           These results suggested that SN DA neurons might display
                                                                                        glucose sensing properties, similar as pancreatic beta-cells, with
                                                                                        higher activity at higher glucose concentrations (termed GE-
                                                                                        neurons; MacDonald et al., 2005).

                                                                                        Transient Glucose Deprivation Reversibly
                                                                                        Reduces Pacemaker Activity of SN DA
 FIGURE 3 | Loss of NCS-1 function increases the number of SN DA neurons
                                                                                        Neurons
 with desensitized inhibitory dopamine-responses. Experiments, MEA                      To systematically address GE-properties of SN DA neurons, we
 recordings, data analysis, and presentation similar as in Figure 1. Data were          carried out a set of MEA experiments, where we continuously
                                                                     (Continued)        recorded pacemaker activities of SN DA neurons while

Frontiers in Synaptic Neuroscience | www.frontiersin.org                           10                                        February 2021 | Volume 13 | Article 635050
Mannal et al. Dopamine & Glucose Responses in SN Neurons
changing extracellular glucose levels, by switching recording-
ACSF solutions. As glucose sensing neurons have been described
in a wide range of glucose concentrations, with so-called high-
GE neurons sensing glucose above 5 mM up to over 20 mM
(Fioramonti et al., 2004; Routh, 2010; Alvarsson and Stanley,
2018), we chose 25 mM as an optimal glucose concentration, and
switched to 1 mM to induce transient glucose deprivation and
metabolic stress.
As illustrated in Figure 5A, after recording baseline
pacemaker activity for 10 min in 25 mM glucose, we switched to
1 mM for 15 min (until frequencies were stable again) and back
to 25 mM glucose for another 20 min, followed by application of
dopamine (and wash-out), for identification of SN DA neurons.
With this paradigm, spontaneous activity of SN DA neurons
was reduced in all tested neurons by switch to 1 mM glucose, by
about 25% (from a mean of 1.9 to 1.5 Hz), and pacemaking was
less precise (∼40%; Figures 5B,C, Supplementary Tables 7A,B).
Furthermore, we detected with about 75% a high amount
of SN DA neurons with desensitized D2-AR responses
(Figure 5C, Supplementary Table 7). We also analyzed the
effect of transient glucose-deprivation separately for sensitized
and desensitized neurons (Supplementary Figures 3A, 4C,
Supplementary Table 7). As before, firing rates were higher
in SN DA neurons with desensitized D2-AR response (∼20%;
Supplementary Figures 3A, 4C, Supplementary Table 7).
SN DA Neurons Display Glucose Sensitivity
Within the Physiological Range of Brain
Glucose Levels
The transient glucose-deprivation experiments demonstrated
for SN DA neurons glucose-sensing properties of the GE-
type. To further quantify glucose sensitivity within the (patho-)
physiological range of brain glucose levels, we carried out
MEA experiments where glucose concentrations were stepwise
elevated from 0.5 mM up to 25 mM to determine dose-response
curves and EC50 values. Experimental design and a typical
response of a SN DA neuron is given in Figure 5D. We also tried
concentrations lower than 0.5 mM, however, SN DA neurons
were not stable enough over the required long recording time
(each recording took more than 2 h). To determine half maximal
effective (EC50 ) glucose-concentrations for individual SN DA, we
fitted dose-response curves for each individual neuron, as well as
FIGURE 4 | More SN DA neurons with desensitized dopamine D2-AR
responses, and with higher pacemaker frequencies in elevated glucose. MEA the mean values at each concentration of all analyzed neurons
recordings, data analysis and presentation similar as in Figures 1, 3. Data (population analysis). Both approaches resulted in similar EC50
were derived from juvenile C57BL/6J mice, recorded in ACSF containing either values, slightly below 1 mM glucose (mean ± SE: 0.87 ± 0.01
2.5 mM (n = 45) or 25 mM (n = 58) glucose. (A) Left panel: Normalized mean and 0.66 ± 0.1, n = 13 Figure 5E, Supplementary Table 8). As
firing rates of all analyzed SN neurons, plotted over time. Right panel: activity
at minute 15 in dopamine. (B) Left panels: Mean pacemaker frequencies and
indicated by the high standard deviation (±1.04) and as evident
pacemaker precision (displayed as CV-ISI), during first 10 min of recordings. in Figure 5F, the individual EC50 values varied substantially and
Right panel: Percentages of SN DA neurons with desensitized D2-AR were not homologous distributed (p = 0.777). Thus, we separated
responses (grey) in 2.5 and 25 mM glucose. (C) Data from (A), plotted the analyzed cells into two groups (>1 mM,Mannal et al. Dopamine & Glucose Responses in SN Neurons FIGURE 5 | SN DA neurons display fast and reversible glucose-sensitivity in the range of brain glucose levels. Experiments, MEA recordings, data analysis and presentation similar as in Figures 1, 3. (A) Exemplary traces, recorded from a mouse SN DA neuron, while glucose was transiently reduced from 25 to 1 mM, as indicated by red horizontal bars. Bath application of 100 µM dopamine indicated by black horizontal bars. (B) Normalized mean firing rates of all analyzed SN DA neurons are plotted over time (n = 28). (C) Left/middle panel: Mean non-normalized firing rates (left) and pacemaker precision (given as CV-ISI, middle) during the first 10 min of the recording in 25 mM glucose, in 1 mM (last 10 min), and back in 25 mM glucose (last 10 min). Right panel: Number/percentage of SN DA neurons from (B,C) with desensitized D2-AR responses (grey). (D) Exemplary trace, recorded from a mouse SN DA neuron, while glucose concentrations were altered as indicated (0.5–25 mM). Bath application of different glucose concentrations (red) and of 100 µM dopamine (black) indicated by horizontal bars. (E–G) Dose-response curves and derived EC50 values for all analyzed SN DA neurons (n = 13). EC50 values were calculated according to the Hill-equation. Values are given as mean ± SE. The range of physiological brain glucose levels is indicated in green, [0.7–2.5 mM], according to Routh et al. (2014). (E) EC50 values were derived from fitting the mean relative firing rates of all cells at each concentration (blue), and by the mean fit of the fits for each individual neuron (red). Values are given as mean ± SE. (F) Left panel: Scatterplot of individual EC50 values, derived from individual fits for each cell (gray dots: cells with desensitized D2-AR responses; white dots: cells with sensitized responses). Right panel: Number/percentage of SN DA neurons from (E) with desensitized D2-AR responses (grey). (G) Separate dose-response curve fits; cells from (E,F) were subdivided into neurons with EC50 higher (n = 5) or lower (n = 8) than 1 mM glucose. Data are given as mean ± SEM. Significances/p-values according to paired Friedman test with Dunn’s multiple comparison and Chi-square test. All data and statistics are detailed in Supplementary Figures 3, 4C,D, Supplementary Tables 7, 8. Frontiers in Synaptic Neuroscience | www.frontiersin.org 12 February 2021 | Volume 13 | Article 635050
Mannal et al.                                                                                             Dopamine & Glucose Responses in SN Neurons

    We also determined EC50 values separately, for sensitized                 action potentials (>2 ms) (Wolfart and Roeper, 2002; Lammel
and desensitized neurons, leading to EC50 values of                           et al., 2008; Khaliq and Bean, 2010; Poetschke et al., 2015)
0.35 ± 0.05 mM (n = 3) and 0.85 ± 0.17 mM (n = 10; mean                       facilitates their identification. However, pacemaker-activity can
± SE Supplementary Figure 3B, Supplementary Table 8),                         be less regular, due to physiological variation (Marinelli and
respectively. All three SN DA neurons with sensitized                         McCutcheon, 2014), and in particular in MEA recordings as
DA-responses fell into the group of neurons
Mannal et al. Dopamine & Glucose Responses in SN Neurons
dopamine, was given, and it also either excited or inhibited enough to allow separate analysis of neurons with sensitized and
DA neurons. Further, they found TH-GFP positive neurons desensitized D2-AR responses as two populations. This analysis
that were excited by dopamine with MEA as well as with revealed that time course and degree of desensitization were
patch clamp whole-cell recordings (personal communication, surprisingly very similar in all analyzed neurons with desensitized
Valentina Carabelli). However, in another MEA brain slice responses, in all conditions. Hence, SN DA neurons do not
study of TH-GFP mice (PN17–PN30), almost all SN neurons display a spectrum of autoreceptor responses with different
in horizontal slices were inhibited by dopamine (30 µM for 2- degrees of desensitization, as previously assumed (Dragicevic
3 min), dopamine-excited cells were not reported (Krashia et al., et al., 2014; Poetschke et al., 2015), but only two states of
2017). The proportion of dopamine (or L-DOPA)—inhibited D2-AR responses: sensitized or desensitized. The dopamine-
and—excited SN neurons was about 50:50% in our study, 81:2% responses when NCS-1 function was lost and when extracellular
(remaining 17% were insensitive) and 80:17% (remaining 3% glucose was elevated support this binary view, as again, the
were insensitive) in the other MEA slice, and MEA DA culture kinetics of individual desensitization was not altered, but only
study, respectively (Berretta et al., 2010; Tomagra et al., 2019). the number of SN DA neurons with desensitized dopamine
Discrepancies in the detection of dopamine-excited SN cells are responses. We propose that SN DA neurons switch between these
likely caused by different ages and/or types of analyzed neurons, two distinct states, rather than gradually change desensitization
or technical differences. of D2-AR responses.
What is the anatomical and neurochemical nature of the Accordingly, we conclude that the previously reported less
dopamine excited SN cells? By mapping the electrodes that pronounced desensitization of dopamine responses—in adult vs.
recorded DA-excited cells, we found no specific anatomical juvenile mice, in cocaine vs. saline treated mice, in Cav1.3 KO
localization. With our approach, we could neither identify vs. wildtype mice (Dragicevic et al., 2014; Poetschke et al., 2015;
the projections of DA-excited cells, nor whether they were Robinson et al., 2017b)—identified by analysis of SN DA neurons
dopaminergic or non-dopaminergic—or even neurons. However, as one population, is reflecting a reduction of the number
the L-DOPA/dopamine excited SN cells in Tomagra et al. (2019) of SN DA neurons with desensitized responses, not a change
displayed a positive fluorescence TH-GFP signal, indicating these in desensitization-kinetics, similar as reported here for loss of
cells were indeed dopaminergic neurons—or at least tyrosine- NCS-1 function and elevated glucose. An alternative explanation
hydroxylase positive cells. Together with the high number of could be that due to NCS-1 function or at lower glucose levels
dopamine-excited SN cells detected, we conclude that they are SN DA neurons with desensitized D2-AR responses die, or were
dopaminergic, and a subpopulation of SN DA neurons exists no longer recorded by MEA, and thus we detect more neurons
that is excited by dopamine. The mechanism for the dopamine- with sustained dopamine responses. However, our very long and
mediated stimulation of presumed SN DA neurons is unclear. metabolically stressful glucose experiments for dose-response
Several ways are possible. It could be mediated directly, via curves that ended with dopamine-application and still showing
stimulatory D1-type dopamine receptors [a small population ∼75% desensitized responses, argue against this.
of D1/D5 expressing SN DA neurons is described (Liss and We have not yet addressed the mechanism of the proposed
Roeper, 2004; Hetzel, 2008; Jang et al., 2011)]. Or D2-AR could switch from desensitized to sensitized D2-AR responses.
stimulate depolarizing low threshold T-Type Cav channels, as Mechanisms of D2-receptor desensitization have been identified
described for calbindin-negative ventral tier SN DA neurons mainly in heterologous systems. Best described is receptor-
(Evans et al., 2017). Also, depolarization by the electrogenic phosphorylation and subsequent beta-arrestin mediated
dopamine-transporter (DAT, co-importing netto one positive internalization (Beaulieu et al., 2015; Chen et al., 2020). However,
charge with each dopamine molecule), in the absence or full for D2-ARs, an internalization-independent, Ca2+ involving
desensitization of inhibitory D2-AR, offers a possible mechanism desensitization mechanism is described (Gantz et al., 2015;
(Sonders et al., 1997; Ingram et al., 2002; Carvelli et al., 2004). Robinson et al., 2017a). Our data would support the latter
Or stimulation could be mediated more indirectly, e.g. by D2- mechanism. The electrogenic DAT (importing 2 Na+ and 1 Cl−
receptor inhibition of inhibitory interneurons that control the ion with each dopamine molecule), could also be involved in
activity of DA neurons, as described for VTA DA neurons mediating desensitization of inhibitory dopamine responses in
(Nestler, 2005; Morales and Margolis, 2017; Bouarab et al., 2019). SN DA neurons, possibly in interplay with D2-receptors and
Identity, mechanisms, and functions of DA-excited neurons will other conductances, as already described (Sonders et al., 1997;
be addressed in future studies. Ingram et al., 2002; Carvelli et al., 2004; Aversa et al., 2018).
What is the physiological function of altered somatodendritic
Two Types of Dopamine Inhibited SN DA D2-AR responses? The physiological function of somatodendritic
local dopamine-release in general is still unclear. However, it
Neurons: Loss of NCS-1 Function and creates activity-related increases in extracellular dopamine in
Elevated Glucose Promote Desensitized the SN that inhibit autoactivity and the activity of neighboring
D2-AR Response neurons, and could contribute to synchronization (Joshua et al.,
We identified SN DA neurons with either sustained or 2009; van der Velden et al., 2020). D2-AR function reduces SN
desensitized dopamine inhibition of spontaneous activity. As DA neuron activity, and thus also excitotoxicity related processes
MEA allowed us to record much more neurons, compared (Rice and Patel, 2015; Duda et al., 2016). A lower number of SN
to our previous patch clamp studies, n-numbers were high DA neurons with desensitized D2-AR response would prolong
Frontiers in Synaptic Neuroscience | www.frontiersin.org 14 February 2021 | Volume 13 | Article 635050You can also read