Cross-SEAN: A Cross-Stitch Semi-Supervised Neural Attention Model for COVID-19 Fake News Detection
←
→
Page content transcription
If your browser does not render page correctly, please read the page content below
Cross-SEAN: A Cross-Stitch Semi-Supervised Neural
                                             Attention Model for COVID-19 Fake News Detection

                                                    William Scott Paka1†? Rachit Bansal2?‡ Abhay Kaushik3‡
                                                            Shubhashis Sengupta4 Tanmoy Chakraborty1
                                         1
                                           IIIT-Delhi, India 2 DTU-Delhi, India 3 IIT-Kanpur, India 4 Accenture Labs, India
                                                            {william18026, tanmoy}@iiitd.ac.in
arXiv:2102.08924v3 [cs.CL] 13 Apr 2021

                                               rachitbansal 2k18ee152@dtu.ac.in; kabhay@iitk.ac.in
                                                            shubhashis.sengupta@accenture.com

                                         Abstract
                                         As the COVID-19 pandemic sweeps across the world, it has been accompanied by a
                                         tsunami of fake news and misinformation on social media. At the time when reliable
                                         information is vital for public health and safety, COVID-19 related fake news has been
                                         spreading even faster than the facts. During times such as the COVID-19 pandemic,
                                         fake news can not only cause intellectual confusion but can also place people’s lives at
                                         risk. This calls for an immediate need to contain the spread of such misinformation on
                                         social media.
                                             We introduce CTF, a large-scale COVID-19 Twitter dataset with labelled genuine
                                         and fake tweets. Additionally, we propose Cross-SEAN, a cross-stitch based semi-
                                         supervised end-to-end neural attention model which leverages the large amount of un-
                                         labelled data. Cross-SEAN partially generalises to emerging fake news as it learns
                                         from relevant external knowledge. We compare Cross-SEAN with seven state-of-the-
                                         art fake news detection methods. We observe that it achieves 0.95 F1 Score on CTF,
                                         outperforming the best baseline by 9%. We also develop Chrome-SEAN, a Cross-
                                         SEAN based chrome extension for real-time detection of fake tweets.

                                         1. Introduction

                                              The increase in accessibility to Internet has dramatically changed the way we com-
                                         municate and share ideas. Social media consumption is one of the most popular activ-
                                         ities online. Nowadays, it is a trend to rely on such platforms for news updates. The
                                         absence of a verification barrier allows misinformation on sites online. Due to the com-
                                         plexity of the issue, the definition of “fake news” is not well defined. A few definitions
                                         used in prior studies are as follows: ‘A news article that is intentionally and verifiably
                                         false’ [1, 2] relating to news that are deceptive in nature, ‘A news article or message

                                            † Corresponding author.
                                            ? Equalcontribution.
                                            ‡ Work done during an internship at IIIT-Delhi.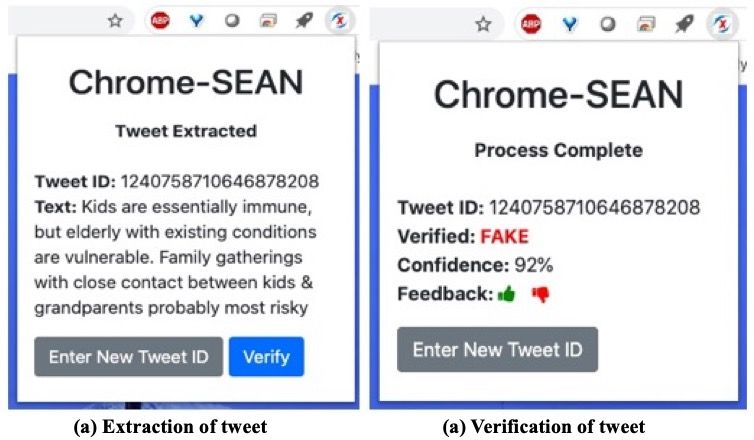
published and propagated through media, carrying false information regardless of the
means and motives behind it’ relating to various forms of false news and misinforma-
tion [3, 4, 5, 6, 7]. A few broader definitions by Zhou et al. [8] state, ‘Fake news is
false news’, ‘Fake news is intentionally false news published by a news outlet.’ For our
purpose, we define COVID-19 fake tweet as any tweet with information which contra-
dicts the statements released by the governmental health organisations1 , and genuine
tweets to be the tweets obtained from their official accounts.
    On 30 January 2020, The World Health Organisation (WHO) has declared COVID-
19 to be a Public Health Emergency of International Concern and issued a set of Tem-
porary Recommendations. A recent study observed 25% increase in average user social
media activity due to the global lockdown [9]. UNESCO stated, “during this coron-
avirus pandemic, fake news is putting lives at risk.” Fake news, ranging from the specu-
lations around origin of the virus to baseless prevention and cures, is spreading rapidly
without any valid evidence. WHO has recently declared the spread of COVID-19 re-
lated misinformation as an ‘Infodemic’; according to their definition, “An infodemic
is an overabundance of information, both online and offline. It includes deliberate at-
tempts to disseminate wrong information to undermine the public health response and
advance alternative agendas of groups or individuals.” WHO, CDC (Centers for Dis-
ease Control and Prevention) and other other government bodies have set up specific
web pages in order to curb major misconceptions about the virus and to maintain public
awareness. Any single false news that gains enormous traction can negate the signif-
icance of a body of verified facts. When a tweet with misinformation is retweeted by
an influential person or by a verified account, the marginal impact grows largely. The
analysis, identification, and elimination of fake news thus have become a task of ut-
most importance. Therefore, there is an immediate need to detect the fake news and
stop their spreading.
    Till now, no verification barrier exists that can authenticate the content being shared
on social media platforms. Due to this, quite often, general people are misinformed
when an unreliable news or information is shared irrespective of intentions. With in-
crease in reliance on social media platforms such as Twitter and Facebook for informa-
tion, the spread of misinformation also tends to increase. Fake news is usually targeted
for financial or political gain with click-bait titles or advertisement links gaining user
attention. The spread of fake news is proven to be a threat in the past during global
events such as US 2016 elections and the Brexit. Studies showed that automated bots
are used for spreading fake content [10]; however, all the posts of bots cannot be con-
sidered as fake since they are devised to post non-fake content too. Genuine users
seldom fall prey to fake content, and with uninformed knowledge sharing among their
network makes genuine users major contributors to its spread.
    Twitter is one of the largest micro-blogging platforms with over 1.5M daily ac-
tive users combating fake news since a long time. The major exploitation of fake
news is highlighted during the 2016 U.S. presidential election campaign. The exis-
tence of ‘echo chamber effect’ on social media allows biased information to be spread

  1 https://en.wikipedia.org/wiki/List_of_health_departments_and_

ministries

                                            2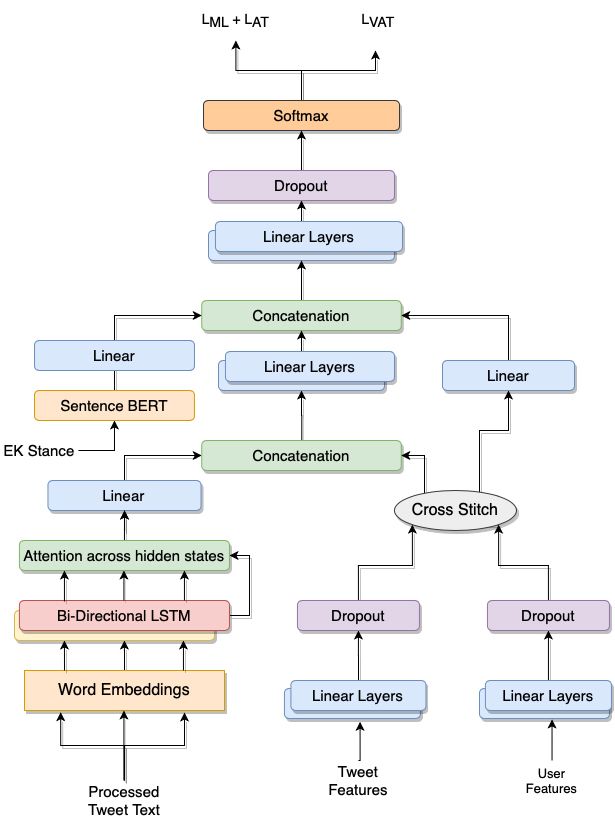
Figure 1: An example of origin, propagation and social context of a popular misinformation. The responses
for a tweet with misinformation seem to be coherent to it, and could ultimately spread it wider and deeper
into the follower networks. Both the tweets and responses contradict the reliable news source.

wider and deeper [11]. Tweets containing fake content show far wider reach, spreading
rapidly than normal tweets, and such variations in propagation can be clearly observed
in tweets related to political news. Such tweet propagation behaviour is partly due to
the innate nature of users to retweet content which is provocative, aligning to their be-
liefs, irrespective of the truthfulness of the content. Social and psychological factors
with ‘valence effect’ [12] play an important role in the spread of fake news. Studies
also showed the involvement of bots to create and spread fake news [10]. News involv-
ing any political figure in power create huge fluctuations in stock markets and trades
economically. For example, a 2013 tweet ‘Breaking: Two Explosions in the White
House and Barack Obama is injured’, from a hacked Associated Press account created
a loss of $136 billion worth of stock value [13]. Twitter has a long history of accounts
getting stolen, and hackers with motivations to create mass hysteria take control of ver-
ified accounts for wider spread of hoax. Although the character limit helps the amount
of textual content being shared, other forms of content such as images, videos and links
are also exploited to spread false information. Twitter usually deletes tweets and users
that are flagged post-verification; however, this is not a scalable solution for automated
fake news verification.
    Due to the lockdown and work from home conditions during COVID-19 pandemic,
Twitter witnessed a 30% rise in daily average usage. With isolation from the external
world, users turn to social media platforms for any updates related to the pandemic.
Due to uninformed knowledge, users tend to retweet content which may not be totally
accurate. At the beginning of the pandemic, very limited information is available to
the public on the realities of the virus. Even verified users such as Elon Musk tweeted
stating that “Kids are essentially immune” which provides statistical evidence in which
there are no infected people below the age 19. Public health experts later released a
statement debunking his claim. We illustrate this in Fig. 1, showing the tweet with

                                                    3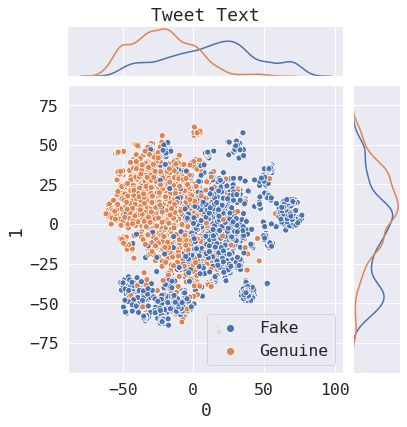
(a) Friend count vs follower count for users tweet-       (b) Favourite count vs Retweet count of users post-
ing genuine and fake tweets (plotted across 500           ing genuine and fake tweets (plotted across 250
samples for each class).                                  samples for each class).

Figure 2: Correlations between (a) user features and (b) tweet features for genuine and fake tweets. In (b),
note that a large number of samples are present close to the origin.

misinformation by Elon Musk along with the ‘responses received in Twitter’ and ‘re-
liable news sources statements’. We can notice that the retweets are coherent to the
misinformed tweet which spread the misinformation across other networks, wider and
deeper. The news from verified sources state otherwise, clearly debunking the said
statement Due to the scarcity of reliable information source, multiple fact checking
sites depend on statements released by Public Health bodies. Although few users tweet
and retweet false content without any ill-intention, there exist users who create and
spread false news for political gains. Diffusion of fake tweets and genuine tweets vary
in a pandemic setting such as this [14]. Tweeting a political tweet with false informa-
tion multiple times from several accounts with various trending hashtags, called ‘Hash-
tag hijacking’ is also observed. Fig. 2(a) shows the count of favourites and retweets for
both genuine and fake tweets, whereas Fig. 2(b) shows the friends and followers count
of users posting genuine and fake tweets. We can clearly observe from Fig. 2(a) that
genuine tweets tend to have higher favourite count compared to retweet count whereas
the fake tweets tend to have higher retweet count, propagating the false information
to a wider range. We can also observe from Fig. 2(b) that users posting genuine con-
tent have higher number of friends than followers, and users posting fake content have
higher number of followers than friends – this setting again allows spread of fake news
towards larger audiences through the users posting fake content.
    The rest of our paper is organised as follows. We discuss related works on fake
news detection and semi-supervised models for text classification in Section 2. Sec-
tion 3 describes our four-stage dataset collection and annotation processes, which is
followed by further analysis of the dataset on various aspects in Section 4. The pro-
posed Cross-SEAN model and training strategies are introduced in Section 5, while its
evaluation and a detailed ablation study are shown in Section 6. For real-time usage of
Cross-SEAN, the developed chrome extension, Chrome-SEAN and the user study are
described in Section 7. Finally, the paper is concluded with discussions, shortcomings

                                                      4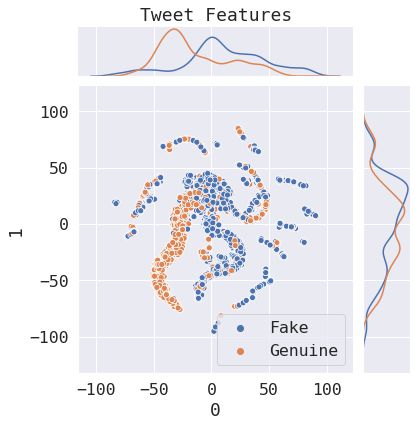
and future work in Section 8.
     Our contribution I: CTF- A COVID-19 fake news dataset and its analysis. With
the aforementioned concerns, it is evident that more research is required to detect and
neutralise fake tweets and keep the users warned. Although research communities are
interested to work on the challenging task of COVID-19 fake news detection which
is one of the pressing issues of our time, the absence of a publicly available labelled
COVID-19 misinformation dataset is a major bottleneck to design automated detec-
tion models. Also, not everyone possesses the resources to collect such a dataset, as
it is cumbersome. We fill this gap by introducing CTF, the first COVID-19 Twitter
fake news dataset, consisting of a mixture of both labelled and unlabelled tweets. Our
dataset contains a total of 45.26K labelled tweets, among which 18.55K are labelled
as ‘genuine’ and 26.71K as ‘fake’. In addition, it contains 21.85M unlabelled tweets,
which can be used to enrich the diversity of the dataset, in terms of linguistic and con-
textual features in general. A detailed analysis of the dataset unfolds many interesting
observations. E.g., fake news content tends to – (i) accompany less URLs and more
multimedia content, (ii) receive much lesser likes and retweets, (iii) exhibit mostly
neutral and negative sentiment, as compared to genuine content. Our dataset collec-
tion is a four stage process, starting from hydration of Tweets, collection of supporting
statements, usage of fine-trained Transformer models such as BERT and RoBERTa, to
manual annotation. As COVID-19 is an emerging topic, we rely on certain government
health organisations and fact checking sites such as PolitiFact, Snopes, TruthOrFiction,
etc, which release statements on widely popular misconceptions. We then use tweets
on the collected facts using BERT and RoBERTa to identify supporting or contradict-
ing claims, which are then partially annotated. The major part of our genuine tweets
are taken from governmental health organisations.
     Our contribution II: Cross-SEAN. Two major issues in any fake news detection
task are the lack of labelled data to train a deep neural model and the inability to detect
fake news that are different from the training data (emerging fake news). To address
these issues, we propose Cross-SEAN, a cross-stitch based semi-supervised attention
neural model. Cross-SEAN works in a semi-supervised way leveraging the vast unla-
belled data to learn the writing style of tweets in general. It considers user metadata,
tweet metadata, and external knowledge in addition to tweet text as its inputs. External
knowledge is collected on the fly in the form of stances close to tweets from trusted
domains and allows a way for Cross-SEAN to not restrict to the train data, as external
knowledge can contain information which is absent in the train data partially helping
with early detection. When multiple inputs are involved, simple concatenation of lay-
ers might undermine few inputs’ significance on the model. We employ cross-stitch
mechanism which provides a way to find the optimal combination of model parameters
that are used to pass the inputs to various sections of the network. Attention mecha-
nisms have the ability of ‘attending to’ particular parts of the input when processing the
data, allowing Cross-SEAN to be capable of representing the words which are being
concentrated on, for a given tweet text.
     We compare Cross-SEAN with seven state-of-the-art models for fake news detec-
tion. Experimental results show that Cross-SEAN achieves 0.95 F1 Score on CTF,
outperforming seven baselines by at least 9%. We show comparative evaluation of
baselines with Cross-SEAN on various features and present a thorough ablation study

                                            5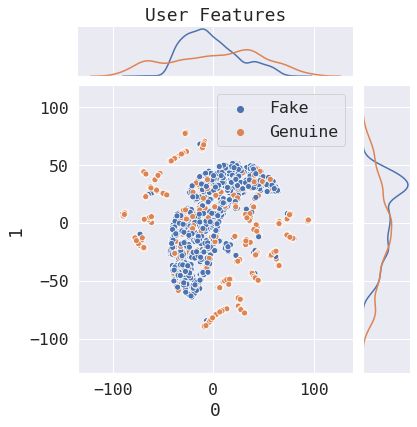
of Cross-SEAN to understand the importance of different features and various compo-
nents of the objective function.
    Our contribution III: Chrome-SEAN. For easy and real-time usage by Twit-
ter users, we finally introduce a chrome extension, called Chrome-SEAN which uses
Cross-SEAN to classify a tweet while in the tweet page. To evaluate Chrome-SEAN,
we collect feedback from human subjects. We further perform online learning condi-
tioned on the feedback and the confidence of model. The extension is deployed and
configured to handle concurrent requests.
    In summary, our major contributions are four-fold:
    • CTF, the first labelled COVID-19 misinformation dataset.
    • Cross-SEAN, a model to curb COVID-19 fake news on Twitter. It is one of the
      few semi-supervised models introduced for the task of fake news detection.
    • Detailed analyses of the dataset to unfold the underlying patterns of the COVID-
      19 related fake tweets.
    • Chrome-SEAN, a chrome extension to flag COVID-19 fake news on Twitter.

Reproducibility: We have made the code and the CTF dataset public at https:
//github.com/williamscott701/Cross-SEAN. Section 6 describes
more about the settings to reproduce the results.

2. Related Work

     As our work revolves around fake news and semi-supervised learning, we present
the related work in two parts: (i) fake news detection, and (ii) text-based semi-supervised
learning. Due to the abundance of literature in both these areas, we focus our attention
to those studies which we deem as pertinent to the current work.
     Fake news detection: Fake news or misinformation on social media has gained a
lot attention due to the exponential usage of social media. Some of early studies tried
to detect fake news on the basis of linguistic features of text [15, 16, 17]. A group of
recent approaches have used temporal linguistic features with recurrent neural network
(RNN) [18] and modified RNN [19, 20] to detect fake news. Hybrid approaches by
Kwon et al. [21] combined user, linguistic, structural and temporal features for fake
news classification. Lately, convolution networks have been adopted along with re-
current networks to detect fake news [22, 23]. Malhotra and Vishwakarma [24] used
the graphical convolutional networks and transformer-based encodings for the task of
rumor detection of tweets. They leveraged the structural and graphical properties of a
tweet’s propagation and tweet’s text. Since satire can also lead to spread of misinforma-
tion, Rubin et al. [25] proposed a classification model using 5 features to identify satire
and humour news. Another study focused on detecting fake news using n-gram analy-
sis through the lenses of different feature extraction methods [26]. Granik and Mesyura
[27] detected fake news using Naive Bayes classifier and also suggested potentials av-
enues to improve their model. Ozbay and Alatas [28] proposed a combination of text

                                            6
mining techniques and supervised artificial intelligence algorithms for the task of fake
news detection. They showed that the best mean values in terms of accuracy, precision,
and F-measure are obtained from the Decision Tree algorithm. Apart from textual fea-
tures, visual features have also been employed for fake news detection. [29] proposed
a similarity-aware fake news detection method which utilizes the multi-modal data for
effective fake news detection. On the similar lines, Varshney and Vishwakarma [30]
developed a click-bait video detector which is another prevalent form of online false
content. Despite the success of supervised models, news spreads on social media at
very high speed when an event happens, only very limited labeled data is available in
practice for fake news detection. Some studies such as [31, 32] have been involved
around weakly supervised learning for fake news detection. In similar directions, Yu et
al. [33] used constrained semi-supervised learning for social media spammer detection,
while Guacho et al. [34] used tensor embeddings to form a semi-supervised model for
content based fake news detection. Dong et al. [35] proposed a two-path deep semi
supervised learning for timely detection of fake news. They verified their system on
two datasets and demonstrated effective fake news detection. Vishwakarma et al. [36]
analysed the credible web sources and proposed a reality parameter for effective fake
news prediction. Varshney et al. [37] developed an automated system Hoax-News
Inspector for real time prediction of fake news. They used content resemblance over
web search results for authenticating the credibility of news articles. Recently, Patwa
et al. [38] prepared an English COVID-19 fake news dataset [39] and a Hindi hostile
post dataset [40]. A few recent studies [41, 42, 8] have provided extensive literary sur-
veys by investigating datasets, features and models along with potential future research
prospects for fake news detection.
Semi-supervised models for text classification: Semi-supervised learning (SSL)
is proved to be powerful for leveraging unlabelled data when we lack the resources
to create large-scale labelled dataset. Prior research on semi-supervised learning can
broadly be divided into three classes– multi-view, data augmentation and transfer learn-
ing [43]. The objective of multi-view approaches is to use multiple views of labelled
as well as unlabelled data. Johnson and Zhang [44] obtained multiple views for text
categorisation by learning embedding of small text regions from unlabelled data and
integrating them to a supervised model. Gururangan et al. [45] and Chen et al. [46]
leveraged variational autoencoders in the form of sequence-to-sequence modelling on
text classification and sequential labelling. Data augmentation approaches involve aug-
menting either the features or labels. Nigam et al. [47] classified the text using a com-
bination of Naive Bayes and Expectation Maximisation algorithms and demonstrated
substantial performance improvements. Miyato et al. [48] utilized adversarial and
virtual adversarial training to the text domain by applying perturbations to the word
embeddings. Chen et al. [49] introduced MixText that combines labelled, unlabelled
and augmented data for the task of text classification. They interpolated text in hidden
space using Mixup [50] to create a large number of augmented training samples. Xie
et al. [51] used advanced augmentation methods (RandAugment and back-translation)
to effectively noise unlabelled examples. Transfer learning approaches aim to initialise
task-specific model weights with the help of pre-trained weights on auxiliary tasks.
Dai and Le [52] used a sequence autoencoder, which reads the input sequence into a
vector and predicts the input sequence again to use unlabelled data for improving se-
7Dataset Collection and Labelling
Using Hashtags Using Statements and
Using URLs
and Keywords Tweets from Organisations
Major No. of Tweets Major No. of Tweets Major No. of Tweets
Keywords Fake Genuine Sources Fake Genuine Services Fake Genuine
bioweapon 4978 0 WHO 3395 4700 Snopes 1696 1650
vaccine 3620 221 CDC 1649 2195 PolitiFact 1484 2250
trump 2874 439 NIH 2231 1705 FactCheck 1060 1500
china 2677 515 CPHO 582 470 TruthOrFiction 1042 1895
WHO 493 4018 PHE 391 425 - - -
at home 0 4552 HHS 405 2255 - - -
Table 1: Different attributes including keywords, hashtags, and sources of statements and URLs along with
the respective number of tweets they are responsible for. The table compiles the numeric details of Section
3. Here, WHO: World Health Organisation, CDC: Centers for Disease Control, NIH: National Institute
of Health, CPHO: Central Public Health Office, PHE: Public Health England, HHS: Human and Health
Services.
quence learning with recurrent networks. Hussain and Cambria [53] employed a semi-
supervised model based on the combined use of random projection scaling, and support
vector machines to perform reasoning on a knowledge base. They showed a significant
improvement in emotion recognition and polarity detection tasks over the state-of-the-
art methods. Howard et al. [54] proposed the Universal Language Model Fine-tuning
(ULMFiT), which has been proved as an effective transfer learning method for various
NLP tasks. Both studies [54, 52] showed the improvement in the performance of text
classification using transfer learning.
The most of the aforementioned methods for fake news detection are tested on
datasets with high volume of labelled data. Moreover, when multiple features are con-
sidered, their optimal combination is not explored. There is no published work related
to COVID-19 fake news detection. We strive to address these issues by first introduc-
ing the novel CTF dataset and then leveraging the unlabelled data in order to reduce the
vast dependency on the labelled data in our proposed Cross-SEAN model. We also em-
ploy cross-stitch for optimal combination of inputs into various sections of the model
and show interesting analysis.
3. Dataset Collection and Annotation
In this section, we introduce our novel dataset, called CTF (COVID-19 Twitter
Fake News). The formation of this dataset underwent four stages mentioned below.
Stage 1. Segregating COVID-19 related tweets: Multiple COVID-19 Twitter
datasets (unlabelled) have recently been made public on Kaggle and other sources;
among them, we used the datasets released by [55], [56], and [57]. Alongside, there
exist a few publicly available datasets containing COVID-19 related tweet IDs being
released everyday in chronological order. We collected the tweet IDs from [58] and
[59]. Due to the hydrating process (which is time consuming) and the non-existence
of fake tweets (as Twitter deletes them upon identification), the tweet IDs did not turn
out to be very useful. However, we still considered them in our dataset to learn the lan-
guage semantics explained in the subsequent sections. We also collected tweets using
8the Twitter API based on some predefined hashtags (e.g., ‘WHO’, ‘covid19’, ‘wuhan’,
‘bioweapon’, etc.). Since the genuineness of news correlates to the credibility of the
source, we collected tweets published by the aforementioned governmental health or-
ganisations and gathered their official Twitter IDs. We extracted tweets from these
accounts and considered them genuine.
Stage 2. Collecting COVID-19 supporting statements: There exist fact checking
sites which analyse popular news across social media and label them as fake or genuine
based on verified sources. We crawled various fact-checking sites such as Snopes, Poli-
tiFact, FactCheck and TruthOrFiction for content related to COVID-19. We extracted
URLs, the content of URLs and their corresponding labels (genuine or fake) from the
fact checking websites. To support this data, more genuine URLs were extracted from
the Twitter accounts of the official health bodies. To increase public awareness about
any widely accepted misinformation, governmental bodies across the world have setup
specific web pages2 3 4 , which are also scraped. This stage resulted in a bulk amount
of data related to the content and URLs which are known to be fake/genuine and act as
the supporting statements for the next stage.
Stage 3: Filtering genuine and fake tweets: We assumed that when a fake or
genuine URL is being shared, all the tweets accompanying the URL also belong to the
same class as URLs are generally added in support to the text. Based on this, a total
of 5.3K and 7.5K tweets were labelled as fake and genuine, respectively. Although
this assumption may garner some unwanted noise since a tweet might contradict the
opinion presented to the referred URL, on manual inspection we found out that this
assumption surprisingly held true for most of the cases, as elaborated in the next sec-
tion. In addition, all the tweets posted by governmental health organisations related
to COVID-19 with specific hashtags as mentioned above, form a majority of our gen-
uine data. This is based on the assumption that such health organisations post content
which either curb fake news or are genuine in itself. We gathered 10K genuine tweets
via this method. Next, we used the pre-processed tweet texts with two Transformer
models, BERT [60] and RoBERTa [61], to populate the dataset further. BERT is used
to generate embeddings of both tweet text and the supporting statements collected and
cosine distance is computed with a high threshold of 0.9 to label the tweet into genuine
or fake based on the polarity. This step resulted in 9.7K tweets labelled as fake. For
RoBERTa, we used the fine-tuned version on the Stanford Natural Language Inference
(SNLI) Corpus [62]; this allowed to take in a pair of sentences and check if they are
contradicting, neutral or entailing. We formed pairs of tweets and supporting state-
ments to identify genuine or fake tweets based on contradicting and entailing results.
This approach gave us an extensive set of 10.6K fake tweets.
Stage 4: Human annotation: We performed manual verification of a part of
45, 261 labelled tweets (26, 706 fake, 18, 555 genuine) obtained from Stage 3. We em-
ployed three human annotators, who are experts in social media and have significant
expertise in fact verification, to verify the labels. The annotators ended up annotating
2 https://www.who.int/emergencies/diseases/novel-coronavirus-2019
3 https://www.cdc.gov/coronavirus/2019-ncov/index.html
4 https://www.coronavirus.gov/
916, 000 tweets (8000 fake and 8000 genuine) with an inter-annotator’s agreement of
0.82 (Krippendorf’s α) with the following instructions provided:
• A tweet is considered to be ‘fake’ if and only if:
– It contradicts or undermines facts from a pre-defined list. Note that a com-
bined list was made from the aforementioned genuine sources.
– It supports or elevates a commonly identified misinformation.
– It is written in the form of sarcasm or humour, but promotes a misleading
statement.
• Other tweets which do not satisfy any of the above, would be either unlabelled
or genuine, as per the annotator’s discretion.
• If the tweet text in itself does not provide enough context to annotate with confi-
dence, the annotators could refer to the tweet and user features.
On further observation, it is found that an average of 92% labels given by the auto-
mated techniques from Stage-3 matched the labels given by the human annotators for
16, 000 samples. Thus, despite using a fully-automated and fast annotation pipeline,
which allowed us to have a relatively large labelled corpus, only a noise of 8% exists.
During cross-validation, we use 20% of the human-verified tweets for testing, and
remaining 80% tweets along with the unverified tweets5 constitute the training set. We
maintain the same distribution of fake and genuine tweets present in the entire dataset
in both the training and test sets.
(a) Hashtags (b) Sentiment (c) Likes
Figure 3: (a), (b) and (c) show the distribution of hashtags, sentiment and likes across the tweets, respectively.
4. Dataset Analysis
In Table 1, we show major keywords, statements and tweets from organisations and
URLs used and the number of tweets that are labelled as fake and genuine.
5 It may plant some noise in the training set which a sophisticated classifier should ignore while being
trained.
10(a) TT-L (b) TF-L (c) UF-L
Figure 4: (a), (b) and (c) show the t-SNE visual representations of tweet text, tweet features and user features
of the labelled data, respectively. Here, TF → Tweet Features, UF → User Features and L → Labelled Data.
Presence of hashtags: Hashtags have long been an important tool on Twitter to
organise, sort, follow and spread tweets. Our dataset consists of a total of 955 and
2, 231 unique hashtags in genuine and fake tweets, respectively. We tabulate the distri-
bution of hashtags for tweets in Fig. 3(a). It is evident that ‘#WHO’ is more prominent
in genuine tweets. The vast number of tweets containing ‘#china’ and ‘#bioweapon’
are fake tweets. Interestingly, the appearance of ‘#trump’ hashtag in the fake tweets is
much higher than the genuine tweets, pointing towards the tendency of politicisation
amongst fake tweets. Even though the vaccine for COVID-19 is still under devel-
opment, the recurrent use of ‘#vaccine’ in fake tweets may suggest the tendency of
spreading rumours with false remedies. The dominance of hashtags such as ‘#togeth-
erathome’, ‘#stayhome’ and ‘#socialdistancing’ in the genuine tweets suggests that
they might have been used to spread positive social messages.
Presence of URLs: To account for prevalence of misinformation, we analyse the
URLs present in our entire dataset. A total of 14, 830 genuine and 8, 761 fake tweets
contain at least one URL, thus averaging to 0.87 and 0.35 URLs per genuine and fake
tweet, respectively. The contrast between the numbers may suggest that in general,
genuine tweets have a higher tendency of supporting the claims.
Presence of multimedia: Twitter supports three types of media formats in a tweet–
photo (P), video (V) and GIF (G). However, it supports only one type of media in a
particular tweet with a limit of four photos and only one video/GIF. In our dataset, fake
tweets contain a total of 2, 491 media files (2036P, 381V, 74G) across 2, 344 tweets,
with an average of 0.0988 per tweet, while genuine tweets contain 1, 473 media (1129P,
339V, 5G) with an average of 0.0834.
Sentiment of tweets: To obtain overall sense of public opinion related to COVID-
19, we analyse sentiment of the tweets [63] using the texblob6 tool. Fig. 3(b) shows that
in the highly negative (-2) and neutral (0) sentiment zones, fake news are grouped more
than the genuine news. The average sentiment polarity for fake tweets is 0.05 compared
to 0.096 in genuine tweets, on a scale of -2 to 2, as shown in Fig. 3(b). Similar results
were also obtained from latest state-of-the-art polarity classification methods for long
reviews and short tweets [64, 65, 66].
6 https://textblob.readthedocs.io/en/dev/
11(a) TT-UL (b) TF-UL (c) UF-UL
Figure 5: (a), (b) and (c) show the t-SNE visual representations of tweet text, tweet features and user features
of the unlabelled data, respectively. Here, TF → Tweet Features, UF → User Features and UL → Unlabelled
Data.
Likes and retweets: The existing propagation based approaches [27, 67] showed
the significance of likes and retweets for fake news detection. The average number of
likes per genuine tweet is found to be 142.65, which is significantly higher than that
(4.25) of fake tweet. The tweet-wise data of likes is summarised in Fig. 3(c). The large
number tweets of popular public health organisation explains the higher average likes
per genuine tweet. About 64% of fake tweets in our dataset are retweets of some other
tweet, 8% of the fake retweets are quoted with the comments, and 35% of genuine
tweets are retweets with 8% of them being retweets with comment.
Visual representations: We show t-SNE visual representations of labelled and
unlabelled tweets on tweet text, tweet features and user features in Figs. 3, 4 and 5. Fig
3 shows tweet text representations on labelled and unlabelled data. Sentence BERT
is used to convert the tweet text to vector form. While the overlap of genuine and
fake tweets can be observed from Fig. 4(a), the polarisation of topics can be observed
from the unlabelled data from Fig. 5(a). Certain user features and tweet features are
identified and are mentioned in Section 5.1; these are in turn used for the visualisations
on labelled and unlabelled data in Figs. 4 and 5 respectively. The polarisation in Fig.
5 supports the same in Fig. 5(a). The labelled representation shows high non-linear
overlap and indicates the complexity of the classification task.
5. Cross-SEAN: Our Proposed Method
In this section, we describe Cross-SEAN7 for fake news detection. We explain
individual components of the model, followed by the training strategy. Fig. 6 shows
the architecture of Cross-SEAN.
5.1. Explicit Tweet and User Features and External Knowledge
Monti et al. [68] showed that content, social context or propagation in isolation
is insufficient for neural models to detect fake news. Hence, we employ additional
7 Cross-Stitch based Semi-Supervised End-to-End Attention Neural Network
12features related to both the users and tweets along with the content of the tweets. For
the tweet features (TFs), we consider the attributes available in the tweet object and
some handcrafted features from the tweet, amounting to a total of 10 features – number
of hashtags, number of favourites, number of retweets, retweet status, number of URLs
present, average domain score of the URL(s), number of user mentions, media count in
the tweet, sentiment of the tweet text, counts of various part-of-speech tags and counts
of various linguistic sub-entities.
Polarisation of users on similar beliefs is widely observed on Twitter [69]. To
capture this, we extract 8 features for each corresponding user (UFs) – verified status,
follower count, favourites count, number of tweets, recent tweets per week, length of
description, presence of URLs and average duration between successive tweets.
These features can provide additional information of the user characteristics and
their activities. These not only help the model identify bots and malicious fake ac-
counts, but also help recognise a pattern amongst users who post false and unverified
information.
On visualising the tweet and user features on labelled and unlabelled data in Fig.
3, we observe the formation of clusters of similar tweets, indicating the polarity of the
tweets. From Fig. 4(c), we also observe that users posting fake tweets tend to form
a cluster, and users posting genuine tweets are scrambled across the whole feature
space. Few features of user posting genuine tweets are highly similar to the features of
users posting fake tweets, thus overlapping with the fake tweet cluster. From Fig. 5,
the unsupervised user features show the dense polarity across the whole latent space,
while the tweet features are wide spread, showing the diverse set of attributes in our
unlabelled data. These features are further used in the classification.
Feature based neural models learn a generalised function from a limited manifold
of the training data, and thus have a tendency to perform poorly when the topics are
variant. To overcome this in Cross-SEAN, we use external knowledge, for the content
relating to tweet text, as an input to the model. We use classical text processing tech-
niques to find a shortened contextual form of the tweet text and use it as a query to
retrieve the top Google Search results, sorted in accordance to relevance([36, 37, 24] ).
From each web-article returned from the search, a particular number of text sentences
are retrieved which are the closest to the original tweet text, as measured using cosine
similarity of the BERT Sentence Embeddings [60] of the two. This is done until k
(=10, by default) sentences are retrieved for the tweet.
In addition to this, we make use of the large amount of unlabelled data (21.85M)
available in CTF–
• We use one-half of the unlabelled data to fine-tune word embeddings to encode
the tweet text. We expect this to help the model learn the linguistic, syntactic
and contextual composition of not only general Twitter Data but also the domain
data, i.e., the COVID-19 pandemic in case of CTF.
• We leverage the other half of the unlabelled data for unsupervised training us-
ing an additional adversarial loss. Experimental results presented in Section 6.2
show that doing this reduces stochasticity and makes the model more robust with
the nature of adversarial training.
13Figure 6: A schematic diagram of Cross-SEAN.
We elaborate on various components of the model architecture and the training
intricacies in the following sections.
5.2. Model Architecture
Our entire training data is composed of labelled and unlabelled samples, denoted by
XL and XU respectively. XL consists of a total of nL data points: (x1L , yL 1
), (x2L , yL
2
),
nL nL i th i
· · · , (xL , yL ), where xL is the i tweet and yL is its label. XU consists of a total of
nU unlabelled data points: x1U , x2U , ..., xnUU . In both the cases, each input sample, xiK
(for K ∈ (L, U )) comprises four input sub-sets – tweet text (xiT T ), external knowledge
text (xiEK ), tweet features (xiT F ) and user features (xiU F ).
In each pass through our model, these four inputs are encoded separately as described
below.
Encoding textual data: The tweet text of sequence length N is represented as
a one-hot vector of vocabulary size V . A word embedding layer E ∈ RV ×D trans-
forms the one-hot vector into a dense tensor e ∈ RN ×D consisting of (e1 , e2 , ..., eN ).
These token vectors are further encoded using a Bidirectional LSTM, the forward and
backward layers of which process the N vectors in opposite directions.
The forward LSTM emits a hidden state hf t at each time-step, which is concate-
nated with the corresponding hidden state hbt of the backward LSTM to produce a
vector ht ∈ R(2×H) ,
ht = hf t ⊕ hbt , ∀t ∈ [1, N ] (1)
14where H is the hidden size of each LSTM layer.
At each layer, a final state output fk ∈ RH is also obtained (∀ k ∈ (f, b)).
At this stage, a net hidden vector h containing N hidden vectors from the two
LSTM layers is combined with the final state vector f using attention across the hidden
states, given as:
XN
v= αij hj ; αij = Sof tmax(hi • fj ) (2)
j=1
where,
f = ff ⊕ fb , f ∈ R2×H (3)
h = h1 · · · ⊕ · · · hN , h ∈ RN,(2×H) (4)
We refer vector v obtained after attention across the hidden states as vT T , repre-
senting the encoded feature of the tweet text.
In addition to this, we use Sentence BERT [60] to find contextual embedding eEK
of the external knowledge corresponding to each input batch. We do this considering
the vast difference between our tweet text input and the external knowledge text. The
eEK vector is then passed through a linear layer to obtain an encoded representation
vEK of the external knowledge.
Encoding tweet and user features: As shown in Fig. 3, we follow a highly concur-
rent yet distinct mechanism to encode both tweet and user features. Firstly, xT F ∈ RKt
and xU F ∈ RKu are passed through separate linear layers which interpolate them to
higher dimensional dense feature vectors vT F ∈ RKT and vU F ∈ RKU , respectively.
As both xT F and xU F are handcrafted, we employ cross-stitch units, which not only
allow the model to learn the best combination of inputs from both the features and share
across multiple layers in the network, but also introduce a common gradient flow path
through the non-linear transformation. The transformation produced by cross-stitch is
as follows:
vj0 = αij • vj + βi , ∀i, j ∈ (1, KT + KU ) (5)
where αij and βi denote the weights of the fully connected layer performing the
cross-stitch operations.
The two outputs of the cross-stitch are denoted by vT U and vU T , respectively8 .
Note that the shape of the two vectors remains unchanged after this transformation.
Connected components in Network: We concatenate vT T and vT U , which are the
transformed feature vectors of the tweet text xT T and tweet features xT F , respectively.
This produces vT = vT T ⊕ vT U , a concatenated representation of all textual features.
8 The first letter in the subscript of v denotes feature vector assuming that it contains most information
from the same vector.
15vTF vTU
Cross-Stitch
Unit
vUF vUT
Figure 7: Working of a cross-stitch unit. Here, the notation is as defined in Eq. 5. Note that the weights of
the linear layers in the Cross-stitch unit are initialised with a unit matrix.
This is done considering the inherent similarity between the tweet text and the tweet
features over user features. We then perform affine transformations of the three vec-
tors, vT , vEK and vU T , through separate feed-forward linear layers and concatenate to
obtain the final decoded vector v, effectively containing transformed feature represen-
tations from all the inputs. The vector v is then down-scaled using a fully-connected
network, regularized using dropout before finally obtaining the probability distribution
across the two classes.
p(y|x; θ) = Sof tmax(v 0 ) = Sof tmax(||vT0 ||vU
0 0
T || ) (6)
where, v 0 represents the transformed vector after it passes through the respective
feed forward sub-network, and θ represents the model parameters at the current time
(from now on, we refer to this as f (x)).
5.3. Training Strategies
For training our model, we use a mixed objective function, which is a weighted
sum of both supervised and unsupervised losses:
Lmix = λM L LM L + λAT LAT + λV AT LV AT (7)
The losses are as follows: (i) LM L represents maximum likelihood loss and min-
imizes the loss between the predicted and true labels. (ii) Additionally, we use the
Adversarial Training Loss LAT , which introduces a regularization with model training
by adding a denoising objective [48]. The goal through this training is to make the
model robust to adversarial perturbations in the input. We find this specially useful for
fake news detection as it allows the model to attend to a wide spectrum of tweets with
minor variations to improve the generality. An adversarial signal radv , defined in terms
of the L2 norm on the gradient gL , with current model parameters is used to perturb
the word embedding inputs e of xT T , e? = e + radv , even when this perturbation de-
pends upon the gradient computed over the output w.r.t all the labelled inputs xL . The
LAT objective function in Eq. 10 is given as a modification of LM L (Eq. 8). (iii) It
can be observed that the above two objectives require us to know the true label of the
data input, thus pertaining to the labelled data only. Here, to expand the concept of
adversarial training to unlabelled data, we make use of virtual adversarial training loss
16LV AT , which too is aimed to add robustness against adversarial inputs. Just as in Eq.
10, we apply the perturbation on the word embedding e, except radv is now defined
as in Eq. 13. δ represents a small random perturbation vector [48], using a 2nd-order
Taylor series expansion followed by the power iteration method. The VAT loss is then
defined as in Eq. 14. We denote f (x) = h(E(x)), where E(x) ∈ RN ×D is the word
embedding vector.
nL
−1 X
LM L = yi log(f (xi )) + (1 − yi ) log(1 − f (xi )) (8)
nL i=1
radv = −L /||gL ||2 ; gL = −∇xL log(f (xL )) (9)
nL
−1 X
LAT = P +Q (10)
nL i=1
where,
P = yi log(h(E(xi )) + radv ) (11)
Q = (1 − yi ) log(1 − f (h(E(xi ) + radv ))) (12)
rv−adv = g/||g||2 ; g = −∇x KL[f (x)||h(E(x) + δ)] (13)
nL +nU
1 X
LV AT = KL[f (x)||h(E(x) + rv−adv )] (14)
nL + nU i=1
Model Features used by the model Performance
TT TF UF UL Accuracy Precision Recall F1 Score
MTL X X 0.79 0.77 0.82 0.79
1HAN X 0.89 0.60 0.87 0.71
16HLT-HAN X 0.87 0.68 0.86 0.76
3HAN X X 0.89 0.77 0.82 0.80
CSI X X 0.87 0.80 0.91 0.85
dEFEND X X 0.89 0.83 0.89 0.86
MixText X X 0.87 0.83 0.84 0.84
Cross-SEAN X X X X 0.954 0.946 0.961 0.953
Table 2: Features used by the competing models and performance comparison on CTF (TT: Tweet Text, TF:
Tweet Features, UF: User Features, UL: Unlabelled Data).
6. Experimental Setup and Results
All our experiments were performed on a single 16 GB Nvidia Tesla V-100 GPU.
Our base model is a single layer Bi-LSTM with a maximum sequence length of 128 and
a hidden dimension of 512. We performed experiments with a wide range of embedding
sizes ranging from 128 to 768 and found the best results with 300 dimensions. We
initially fine-tuned the word embeddings on ∼ 10M unlabelled tweet texts before using
them for training. We used the Adam optimiser for all our experiments with a learning
rate of 0.001, β1 = 0.90, β2 = 0.98 and a decay factor of 0.5. We used dropout with
pdrop of 0.3 in all our feed-forward networks, where the number of layers exceeds 2.
Early stopping with a patience of 20 was also used along with gradient clipping with a
maximum L2 norm of 1. We kept λM L , λAT and λV AT as 1.
17Objective Function Result
ML AT VAT Accuracy F1 Score
X 0.910 0.907
X X 0.936 0.930
X X 0.854 0.860
X X 0.936 0.930
X X X 0.954 0.953
Table 3: Results of Cross-SEAN with different variations of the mixed objective function.
6.1. Comparative Evaluation
We compare Cross-SEAN with seven state-of-the-art methods described as follows.
MTL [70] uses a multitask learning framework by leveraging soft parameter sharing
on classification (primary) and regression (secondary) tasks based on tweet text and
tweet features. 1HAN and 3HAN [71] use hierarchical attention based GRU networks.
1HAN is the base version of 3HAN, where 3HAN uses 3-level hierarchical attention
for words, sentences and headlines learning in a bottom up manner. 16HLT-HAN [72]
uses hierarchical structure by applying attention mechanism at both word and sentence
levels. CSI [73] uses a three module approach that consists of Capture, Score and In-
tegrate, combining what they define as the three common characteristics among fake
news, i.e., text, response and source to identify misinformation. Furthermore, we also
use dEFEND [74] as a baseline, which uses a GRU-based word-level and sentence-
level encoding along with a module for sentence-comment co-attention. MixText [49]
is a semi-supervised approach that produces results by leveraging large amount of train-
ing samples and interpolating text in hidden space.
Table 2 shows that Cross-SEAN outperforms all the baselines by a margin of at
least more than 6% accuracy and 9% F1 Score, with dEFEND being the best baseline.
Linear Layers Attention Cross-Stitch Performance
TF1 UF1 TF2 UF2 TF3 UF3 TF4 UF4 Accuracy F1 Score
128 0.910 0.884
64 256 X 0.932 0.935
64 64 256 256 X X 0.931 0.934
64 256 256 512 0.939 0.942
64 256 256 512 X 0.927 0.944
64 64 256 256 256 X X 0.954 0.953
Table 4: Results with various fully-connected network combinations. Here, TFi and UFi represent the ith
layer transposing a feature vector of tweet features and user features respectively. Two joined cells represent
a concatenated form of the respective vectors feeding as inputs to the corresponding layer.
6.2. Ablation Study
(a) Objective functions: In Table 3, we test the performance of Cross-SEAN on
different combinations of the mixed objective function. We vary the values of λM L ,
λAT , λV AT between 0-1. A steady increase in the performance can be seen as we
move from a vanilla supervised training objective (only maximum likelihood loss) to
an additional semi-supervised mixed objective function.
Fig. 8 shows the variation of different objectives functions – ML, AT and VAT,
individually, when trained with different combinations of the mixed objective function.
18(a) ML Loss (b) AT Loss (c) VAT Loss (d) Net Loss
Figure 8: Variation of individual loss functions of Cross-SEAN with different combinations of the mixed
objective function.
For instance, Fig. 8(a) shows the variation of the individual ML Loss when different
combinations of the net objective function is used.
From Fig. 8(a), the regularisation effect of the two adversarial losses, AT and VAT,
is apparent as it can be observed that their introduction considerably effects the indi-
vidual ML loss, making it drop to a larger extent, in fewer iterations. Even though the
introduction of AT alone seems to make the loss curve more stochastic, the net loss
is considerably lower. This can be seen in addition to the surprising smoothing effect
which is observed wherever the VAT loss is considered, including Fig. 8(b) and 8(c).
These two properties of AT and VAT losses respectively, motivate their usage together,
thus resulting into an efficient and smooth decrease of loss and strengthening our hy-
pothesis of leveraging unlabelled data. This is further ensured by another interesting
observation by using only AT and VAT losses for the training – although as expected,
we achieve a deteriorated accuracy as shown in Table 3, the corresponding losses in
Figs. 8(b)-8(c) show high consistency and smoothness. Fig. 8(d) shows the final loss
curve when all the 3 losses are used, i.e., when λM L = λAT = λV AT = 1.
(b) Model Components: Fig. 4 shows the importance of different components used
in Cross-SEAN such as cross-stitch, attention and feed-forward layers for tweet and
user features. We experiment across several combinations of tweet features and user
features with concatenation and usage of cross passing through various layers as shown
in Fig. 4. We find that the best architecture is with the cross-stitch on tweet and user
features when one output of the cross-stitch is combined in the early stages of the
network and the other output is fused in the later stage. Also the use of attention shows
performance improvement of the final model.
In our initial set of experiments, the cross-stitch was introduced between the en-
coded representation of the tweet text, obtained after passing it through Bi-LSTM, and
a concatenated form of tweet and user features. A considerable difference in the per-
formance is observed between the two, the former being the superior one. We relate
this to the fact that the encoded representation of the tweet text is considerably different
from the additional features, while they in themselves are very similar. Further, since
the tweet features are inherently more similar to the tweet text, the cross-stitch output
corresponding to the tweet features is first concatenated to the encoded tweet text and
lastly with the user features. This is also shown in Table 4, where the architecture
used in the last row evidently outperforms the one in the 3rd row, which represents
concatenation of the three outputs on the same level.
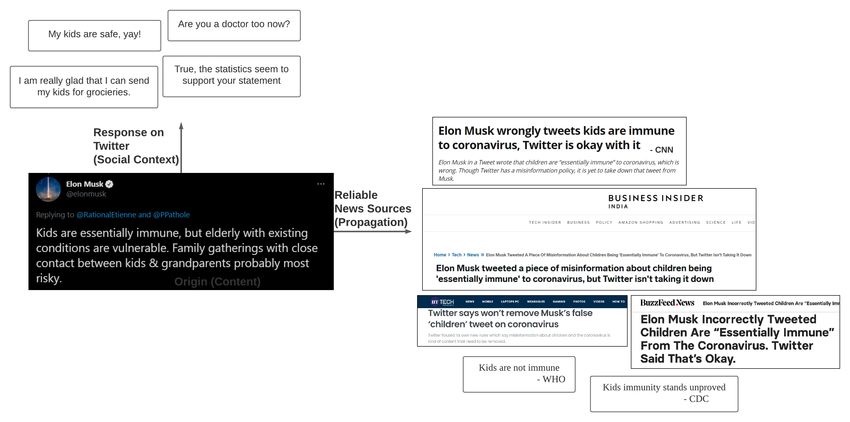
19Figure 9: The working of Chrome-SEAN, a Chrome extension of Cross-SEAN.
7. Chrome-SEAN: A Chrome Extension
Cross-SEAN is an end-to-end model which enables for identification of fake tweets
in real time. Keeping the users warned is a very important step and would help with
an easy access through the browser. In order to help users detect misinformation on
Twitter in real time, we deploy Cross-SEAN as a Chrome browser extension, called
Chrome-SEAN that replicates the performance of the model while performing a lot of
other features as well.
Chrome-SEAN is built as Chrome extension, which uses jQuery9 to send and re-
ceive requests from POST API method. We deployed the Cross-SEAN model using
Flask10 in our local servers which can receive the POST API requests concurrently.
To handle the load balancing over multiple concurrent requests, we use Redis11 . The
server is not burdened with resource intensive requests, and the combination of Flask
and Redis performs efficient communication through APIs.
Chrome-SEAN first identifies the tweet ID through the URL while scanning Twit-
ter, and sends it to the server using an API. Chrome-SEAN also provides the option
to enter the tweet ID manually. Upon requesting to Cross-SEAN, the raw data is first
transformed to the necessary format and then passed through the model. The detected
class along with its confidence from the softmax layer is returned back to the extension
and displayed. Fig. 9 shows the working of Chrome-SEAN in two stages. In the for-
mer stage, the extraction of the tweet is performed in the browser side and is instant,
whereas in the latter stage, verification of the tweet takes on an average of 1.2 seconds
per tweet (single API request).
As shown in Fig. 9, we take users’ feedback on our final classification output and
consider it as a true label in the extended online dataset. Additionally, we employ
an online training mechanism on the basis of users’ feedback if it differs from the
9 https://jquery.com
10 https://flask.palletsprojects.com/en/1.1.x/
11 https://redis.io/
20class identified and check the confidence of the model; the model is trained only if the
confidence is lower than 0.6. We take special care before online training to make the
model robust to attackers attempting to pollute the results. To handle load balancing
on the server, we make use of Redis.
User Study: Chrome-SEAN was tested by 35 users until now. We first randomly
sampled tweets from the human-annotated set of tweets which were not a part of the
training set, assigned them to users and asked them to test on similar tweets, totalling
215 tweet inputs, ranging from a wide variety of sub-topics, users and timelines. It was
observed that 67% of these input tweets were made within the last 7 days, 53% were
from new users with less than 5 tweets, and 85% had a retweets count of less than 10.
We asked users to provide feedback on each tweet they tested with Chrome-SEAN,
in accordance with the true label. We found that 203 out of 215 ratings were positive,
i.e., deeming the prediction by Chrome-SEAN correct, resulting into an accuracy of
94% and F1 Score of 94.3%. Such high level of accuracy on such a diverse set of
inputs depicts Cross-SEAN’s ability to pick the appropriate input features when making
a prediction.
8. Discussion and Conclusion
This work introduced the task of COVID-19 fake news detection on Twitter. We
collected related tweets from diverse sources. Post human annotations, we proposed
CTF, the first labelled Twitter dataset, consisting of COVID-19 related labelled genuine
and fake tweets along with a huge set of unlabelled data. We also presented a thorough
analysis to understand surface-level linguistic features.
As the amount of labelled data is limited, we made use of the vast unlabelled data to
train the neural attention model in a semi-supervised fashion as learning the semantic
structures of language around COVID-19 helps the model learn better. We collected
external knowledge for all the tweets by taking the most relevant stance from credible
sources on the web. As fake news around COVID-19 are emerging, even if the model
is not trained on a certain fake news topics, we assume that external knowledge from
a trusted source could help aid the classification. We built a neural attention model
which takes various inputs such as tweet text, tweet features, user features and exter-
nal knowledge for each tweet. We employed cross-stitch units for optimal sharing of
parameters among tweet features and user features. As tweet text and tweet features
are closely related, we performed optimal sharing of information by concatenating one
output of cross-stitch early in the network and the other latter. Maximum likelihood
and adversarial training are used for supervised loss, while virtual adversarial train-
ing for unsupervised loss. Usage of adversarial losses further adds regularisation and
robustness to the model. We then incorporated this model into Cross-SEAN, a novel
cross-stitch model which performs under a semi-supervised setting by leveraging both
unlabelled and labelled data with optimal data sharing across various tweet informa-
tion.
Cross-SEAN is highly effective, outperforming seven state-of-the-art models sig-
nificantly. We contrasted features of baseline models with Cross-SEAN and showed
various metrics. We showed a thorough ablation study with various fully-connected
21You can also read