World Management Survey at 18: Lessons and the Way Forward - IZA DP No. 14146 FEBRUARY 2021 - Institute of Labor ...
←
→
Page content transcription
If your browser does not render page correctly, please read the page content below
DISCUSSION PAPER SERIES

IZA DP No. 14146

World Management Survey at 18:
Lessons and the Way Forward

Daniela Scur
Raffaella Sadun
John Van Reenen
Renata Lemos
Nicholas Bloom

FEBRUARY 2021

DISCUSSION PAPER SERIES

IZA DP No. 14146

World Management Survey at 18:
Lessons and the Way Forward

Daniela Scur                                                   Renata Lemos
Cornell University                                             World Bank
Raffaella Sadun                                                Nicholas Bloom
Harvard Business School                                        Stanford University and IZA
John Van Reenen
LSE, MIT and IZA

FEBRUARY 2021

Any opinions expressed in this paper are those of the author(s) and not those of IZA. Research published in this series may
include views on policy, but IZA takes no institutional policy positions. The IZA research network is committed to the IZA
Guiding Principles of Research Integrity.
The IZA Institute of Labor Economics is an independent economic research institute that conducts research in labor economics
and offers evidence-based policy advice on labor market issues. Supported by the Deutsche Post Foundation, IZA runs the
world’s largest network of economists, whose research aims to provide answers to the global labor market challenges of our
time. Our key objective is to build bridges between academic research, policymakers and society.
IZA Discussion Papers often represent preliminary work and are circulated to encourage discussion. Citation of such a paper
should account for its provisional character. A revised version may be available directly from the author.

                                                     ISSN: 2365-9793

                                           IZA – Institute of Labor Economics
Schaumburg-Lippe-Straße 5–9                      Phone: +49-228-3894-0
53113 Bonn, Germany                             Email: publications@iza.org                                    www.iza.org
IZA DP No. 14146                                                                                                         FEBRUARY 2021

            ABSTRACT
            World Management Survey at 18:
            Lessons and the Way Forward*
            Understanding how differences in management “best practices” affect organizational
            outcomes has been a focus of both theoretical and empirical work in the fields of
            management, sociology, economics and public policy. The World Management Survey
            (WMS) project was born almost two decades ago with the main goal of developing a
            new systematic measure of management practices being used in organisations. The WMS
            has contributed to a body of knowledge around how managerial structures, not just
            managerial talent, relates to organizational performance. Over 18 years of research, a set
            of consistent patterns have emerged and spurred new questions. We will present a brief
            overview of what we have learned in terms of measuring and understanding management
            practices and condense the implications of these findings for policy. We end with an
            outline of what we see as the path forward for both research and policy implications of
            this research programme.

            JEL Classification:              L2, M2, O14, O32, O33
            Keywords:                        management practices, policy toolkit, world management
                                             survey, productivity

            Corresponding author:
            John Van Reenen
            MIT
            77 Massachusetts Ave
            Cambridge, MA 02139
            USA
            E-mail: vanreene@mit.edu

            * Daniela Scur is the lead author, and subsequent order of names were randomized. We thank Margaret Stevens, an
            anonymous referee and the participants of the authors’ workshop in Oxford for their helpful feedback, and Fabiano
            Dal Ri for excellent research assistance.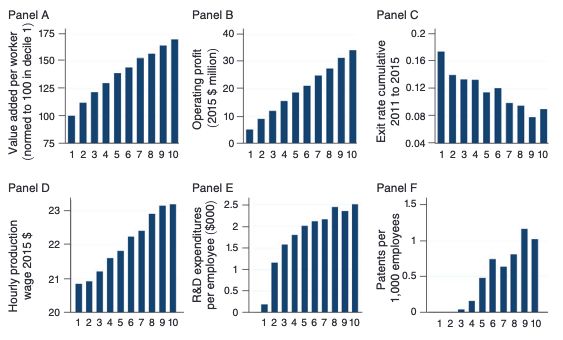
1        Introduction
Social scientists have studied the importance of managers and of management practices for over
a century, and today armed with large and representative datasets are confident that management is
crucial for organizational performance. Understanding how differences in the adoption of management
“best practices” affect organizational outcomes has been a focus of both theoretical and empirical
work in the fields of management, sociology, economics and public policy. Earlier efforts relied
primarily on case studies, but over the past two decades we have seen an explosion of new datasets
and computing power that allow for careful measurement of these practices across a range of
organizational types.
        The World Management Survey (WMS) project was born almost two decades ago with the main
goal of developing a new systematic measure of management practices being used in organisations.
Since 2002, we have been building the largest cross-country dataset including manufacturing and
retail firms, schools and hospitals, and we have provided assistance to other teams looking to use
the methodology in numerous other industries. To date, our dataset includes over 13,000 firms and
4,000 schools and hospitals, spanning over 35 countries.1 Other teams using the WMS methodology
have collected data on government bureaucracies [Rasul and Rogger, 2018, Rasul et al., 2018],
universities [McCormack et al., 2014], primary healthcare facilities and many more. The methods
and availability of WMS data is open to all, and at time of writing over 5,000 researchers have
downloaded the public dataset for research projects and benchmarking exercises.
        The WMS has contributed to a body of knowledge around how managerial structures, not
just managerial talent, relates to organizational performance. A series of stylized facts have taken
form over the past eighteen years of research, both elucidating the robust positive performance-
management relationship, understanding how to improve measurement (such as the more recent
Management and Organizational Practices Surveys) and raising a number of important questions
about mechanisms driving the diversity of management practices. We present a brief overview of
what we have learned in terms of measuring and understanding management practices and condense
the implications of these findings for policy in the form of a simple table: a “management policy
toolkit”. We end with an outline of what we see as the path forward for both research and policy
implications of this research programme.

2        What have we learned thus far
We start by taking stock of what we have learned from the WMS about measurement and the key
relationships between management and performance.
    1
        At time of writing, the latest publicly available dataset includes 35 countries.

                                                               1
2.1 Measurement
2.1.1 Original WMS
Prior to the development of the WMS, research on management was often focused on small (and
often, non-representative) numbers of firms in single countries. Case studies remain extremely
popular, and while much can be learned from these “clinical studies” for formulating theories and
considering mechanisms, it is hard to generalize from them. The typical case study has a sample
size of one and is inherently selected. The goal of the WMS project is to systematically collect
data on the types of practices used at thousands of organisations, across industries, under different
settings and over time, while maintaining comparability.
The original WMS was set up as an interview-based survey tool, where highly trained interviewers
engaged a middle manager in a semi-structured conversation about the day-to-day practices followed
at their establishment [Bloom and Van Reenen, 2007]. The respondent managers were those who
were senior enough in their establishment to have decision powers, but not too senior so as to be
detached from the day-to-day running of the establishment. For example, manufacturing plant
managers, retail shop managers, hospital department nurse managers and school principals or
head teachers. It is set up as an interview, and the questions although structured, are mostly
open-ended so the manager being interviewed is not guided towards what a high or low scoring
answer might be. The advantage of this is that it avoids the manager simply giving the answer she
thinks the interviewer wants to hear. The conversation follows a set of broad practices spanning
operations/monitoring, target setting and people/incentive management practices. Each broad
sector has between 18 and 20 topics and each is scored on a scale of 1 (little to no structure/”weak
practices”) to 5 (well-structured/”best practices”).
The main benefit of this methodology is the many steps ingrained in the data collection process
that yield high quality data. As independent interviewers assign the scores, it is feasible to build a
comparable dataset across countries and industries that mitigates biases borne out of self-response.
For example, common issues such as the mood of the manager, cultural expectations dictating
“right or wrong” answers, different understanding of the question text and survey fatigue are not
as salient in this method. The method is double blind on the side of the interviewees, but also the
interviewers who will not typically know anything about the organization in advance. The average
WMS response rate is usually between 40 and 50 percent, which is extremely high considering that
many firms surveys typically get far lower response rates.2
The main drawback, however, is the cost. Running a full survey usually costs an average of
$300 to $500 per interview. This is because running a full wave of the original survey entails
large fixed costs and even larger personnel costs. The fixed costs include a large room equipped
with desks, chairs, computers, phones, headsets as well as the survey software, calling plans and
2
For example, Altig et al. [2020], Ben-David et al. [2013], Bloom et al. [2019b], Bartik et al. [2020] where response
rates in firms survey range from 0.1% to 13%.
2other phone charges. The personnel costs are also substantial. As the interviews are run on the
phone, it requires recruitment and training of interviewers who can understand and internalize the
methodology well enough to ask open questions, quickly synthesize the manager’s answers to ask
follow up questions and make a judgement of the score the answers warrant. They also need to
have good phone manners and charisma to keep managers engaged in the interview for at least
45 minutes, with only a promise of a report in return. As such, these are not easy workers to
recruit and warrant high wages. For each 5 interviewers, there is also the additional cost of a
calibration supervisor who listens to a large share of calls and scores alongside the interviewer for
later comparison (this process is called “double scoring”).3
The high cost of this method is the main constraint to expanding the sample size. With an eye
to scalability, other methods have arisen that are closer to traditional survey approaches of fixed
scripts and closed answers and require minimal training or supervision. We briefly describe them
in turn, and summarize the pros and cons of the various methods in Figure 1.
2.1.2 Semi-closed, closed and self-respondent methods
The Management and Organizational Practices Survey (MOPS) was born out of a partnership with
the US Census Bureau, where a new module for the Annual Survey of Manufacturers in reference
year 2010 included a set of questions that roughly mirrored those that the WMS measured. The
module was sent to over 40,000 establishments across the United States and achieved an 85%
response rate [Bloom et al., 2019a].4 Since then, similar exercises have been replicated in Australia,
China, Colombia, Denmark, Finland, Germany, Japan, Mexico, the Netherlands, Pakistan and the
UK. The main benefit of this method is the scalability and potentially lower cost of operations,
though a major drawback is the difficult of comparing these management scores across countries
(e.g. we can easily compare management scores from the Office of National Statistics across UK
firms, but less easily to management scores from the Census on US firms). When done in partnership
with government data agencies (such as the US Census, Mexico’s INAGI, or Pakistan’s State Bank
and Bureau of Statistics), however, it can be powerful for large national sample sizes and has a
major benefit of additional linkages with other administrative datasets.
Two intermediate approaches sit between the self-respondent census-style method and the
original phone WMS with open-ended questions. One is to use phone or hand delivery of closed-
ended questionnaires with the goal of mitigating low response rates. This was the approach in
Bloom et al. [2012c] to survey Eastern European and Eurasian firms via the phone, the second
wave of the Pakistan MOPS included hand delivery of the questionnaires. The benefit is that the
level of training and monitoring required of interviewers is lower, enabling surveys to be conducted
in difficult to reach areas in person or by phone.
3
The WMS trainers have also trained multiple waves across years, and help back-score a random set of surveys to
further help with calibration.
4
Answering this survey is mandatory in the United States.
3Another intermediate approach is to keep the same set of open-ended questions but use a much
more detailed scoring grid that almost reaches a checkbox-based scoring rubric. This method is
particularly useful in developing countries, as it allows for finer measurement of the often-thicker
lower tail of badly managed establishments. Additionally, this method does not necessarily require
leveraging highly trained interviewers to collect data: the scoring rubric is detailed enough to
remove room for interpretation. As such, the method is dubbed the “Development WMS”. It was
piloted with primary schools in Andhra Pradesh (see Lemos et al. [2021] for full details), and
subsequently applied in Puerto Rico, Colombia, Mexico, Haiti, Pakistan and Tanzania.5
2.1.3 Leveraging existing non-WMS questionnaires
A more recent approach looks to leverage existing large datasets that include questions on the
management topics being measured by the WMS. For example, in education, standardized tests
are often administered to all schools within a country, or at least to a representative sample with
appropriate weights available to researchers as part of the database. These standardized tests
usually also feature a principal questionnaire (and sometimes student and teacher questionnaires
as well) including questions that reflect some of the topics surveyed in the WMS. Leaver et al.
[2019] developed the method using data from the OECD’s Programme for International Student
Assessment (PISA) as well as the Brazilian Prova Brasil and validated the scores against the WMS
existing dataset. These Education Survey Management Indices (ESMI) allow for a comparison
across a much larger number of countries and schools, though the downside is that questionnaires
sometimes change over time rendering comparisons more challenging.
2.1.4 Caveats
While different methods solve different shortcomings of the original methodology, they all still share
some caveats that are important to highlight.
What is “good management”? The focus of the WMS questions (and indeed the topics in
these alternative indices) are based on a set of practices that were ex-ante likely to be causal
determinants of better performance. The design was based on a consensus of many consultants
and industry experts on what core factors were important in the efficiency of a good or service
that a firm was delivering. While this has been verified to be true empirically, the measure does
not purport to encompass the entire spectrum of “what is management”. It does include fairly
non-controversial topics where there is a consensus in terms of “good” and “bad” practices, from
having a reasonable number of key performance indicators and keeping track of them regularly to
having a system in place to identify which workers are performing well and which ones need help
to improve.
5
The set of questions used in Pakistan, Tanzania and Puerto Rico were a smaller subset from the original 20.
4Our WMS management evaluation, however, leaves out aspects such as innovation, finance,
pricing, marketing, and opening and closing decisions (among many others). In the public sector,
it leaves out topics like funding strategies, management of school safety and of student socio-
emotional development. While these remain crucial for the success of these organizations, they are
less straightforward to judge on a strictly increasing scale as the rest of the management practices
included in the indices.6 Further, the monotonic scale means we may miss some crucial variation
in informal practices that managers may carry out in formally constrained environments, such as
heavily unionized firms or public organizations like schools or hospitals.
At its core is the question of whether these “basic” practices are complements or substitutes
with other more “strategic” aspects. It may well be that a particular type of firm, say, one focused
on the design of highly innovative products, would do worse with strict targets and metrics at
every step of production. On the other hand, efficient data collection and value mapping coupled
with appropriate incentives could make an R&D lab more efficient at churning innovative products.7
From the worker side, on the one hand, a focus on efficiency and formality in targets could make for
a stressful working environment, but on the other hand perhaps formal indicators and transparent
performance evaluations attract good workers and minimize discriminatory practices.8
These are all important empirical questions. While not part of the core measurement, some of
these aspects are measurable in other ways and we review the evidence of the relationship between
basic management practices and various organizational and productivity outcomes in the next
section.
Is “good management” universal? Another concern with the focus of the questions covered
in these indices is that they are culturally biased towards “Anglo Saxon” values or types of practice
that would fail to reflect a real existing relationship with performance. Over the years of data
collection across a large number of culturally diverse countries, we have found that this is not a
major issue. First, we implement methodological steps to ensure interviewers have exposure to firms
from multiple countries by interviewing firms in their target country as well as other countries for
which they have the language skills.9 Second, the practices measured are fairly core and “simple”
(that is, not strategic), such that they are arguably less susceptible to cultural differences. Third, we
can empirically test whether the relationship between these practices and performance is different
across countries (it is not), and whether multinational firms belonging to different home countries
have different practices when operating in foreign countries (they generally do not).
6
To be sure, there are now new initiatives looking to explore these less straightforward aspects, including a World
Strategy Survey and an Educational Financial Management Survey.
7
For example, IDEO is a design firm that is known for its well-defined routines for design thinking [Brown, 2008].
8
Indeed, the limited evidence we have on this suggests firms with better management practices have better work-
life balance, including higher-wages, lower employee turnover and better subjective work-life balance survey responses
(e.g. Bloom et al. [2009]).
9
For example, many interviewers would also interview firms in the UK or the US alongside interviewing firms in
Ethiopia or Japan.
5To be sure, the best test of whether these measures help explain useful and interesting variation
across establishment is matching the data with external measures that we care about (productivity,
profitability, innovation, worker welfare, wage inequality, etc.) and verifying the direction of the
relationship. We review the main stylized facts we and other researchers have found in the next
section.
2.2 Main stylized facts
2.2.1 Management varies across and within countries and sectors
The original WMS method yields individual measures ranging from 1 to 5 across 18 different topics
in manufacturing, 19 in retail, 21 in hospitals and 23 in schools. We briefly describe the topics
and provide a set of example questions in Tables 3 to 6. As the questions are naturally correlated,
they are usually aggregated into the “overall” management index (including all questions) or into
sub-indices of the questions covering each of the portions of the questionnaire (lean operations,
monitoring, target-setting and people management).10 The standard way of combining the management
questions used in most papers is simply standardizing each question, taking the average of the set of
relevant questions, and then standardizing the average. The index value varies slightly depending
on how it is constructed, but as we will review in the next section, the aggregation method does
not seem to matter much for the strength of the management-performance correlation.
Exploring the questions and their relationship with each other can be interesting in itself. A
factor analysis of the 18 manufacturing questions yields one principal component that explains
most of the variance and also loads positively on all questions, suggesting that if a firm scores
highly on one practice, it is likely to score highly on all other practices, too (Table 1). This can be
interpreted as a latent variable of “good management”. The second factor explains much less of the
variation, but it has interesting loadings: opposite signs for general operations questions and people
management questions. We repeat this exercise for public hospitals and public schools, and the
patterns are strikingly similar. Both samples also display a strong first factor that explains a large
share of the total variance, and a second factor with opposite sign loadings approximately divided
along general operations and people management lines. The one exception is public hospitals, where
a third factor also emerges that loads positively on lean operations and people management, and
negatively on monitoring and target setting. The general pattern suggests that across all sectors
there are some clear lines of specialization in general operations versus people management. This
could be reflecting the strength of labour regulations across countries, as some tend to be more
restrictive (such as France) relative to others (such as the US).
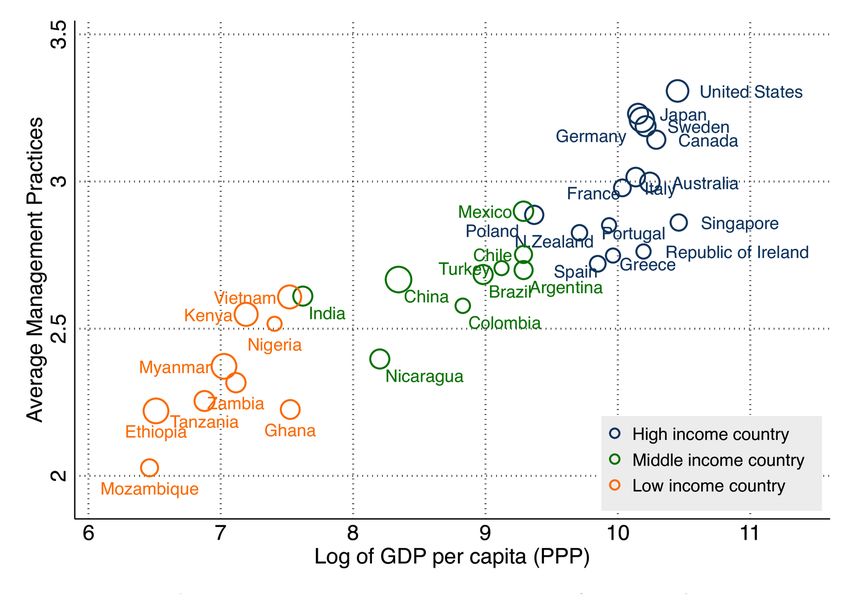
Looking across countries, our WMS manufacturing data shows substantial differences in the
average management practices index across countries as well as within countries. Across countries,
management scores seem to track closely with levels of development (Figure 2). The United States
10
For some purposes, aggregating all the non-people management questions into “general operations” is appropriate.
For example, in Bloom et al. [2015b] or in Cornwell et al. [2020].
6has the highest average management score followed by other high-income countries such as Japan,
Sweden and Canada. Southern European countries such as Spain and Greece have lower average
scores, similar to upper-middle-income countries such as Chile and Mexico. Emerging economies
such as India and China are next, with the African countries in our sample coming last on the
ranking. As the survey eligibility sets the minimum firm size at 50 employees, this is not driven
by low-income countries having smaller firms. In fact, the size of the circles corresponds to the
relative median firm size within the country and they are similar to each other across the sample
of countries.11 But this simple ranking masks substantial within-country heterogeneity.
Figure 3 plots firm level kernel density curves for the 35 countries of the two sub-indices of
management, operations (including core operations, monitoring and target-setting) and people
management. Two distinguishing features of the score leader, the United States, are that it has
an unusually thin left tail of low scoring firms, and the distributions of operations and people
management are not too different from each other. It is worth highlighting that even in the
countries that are closer to the bottom of that average ranking, there are firms that are able to
adopt these practices and do well, so while it is unlikely that something structurally blocks these
practices from being implemented, there certainly are barriers to their diffusion.
We find a mostly similar pattern in the public sector (schools and hospitals), though the United
States is not the leader in the management of public schools. Figure 4a shows the ranking for
hospitals and Figure 4b shows the ranking for schools. While each industry has a set of industry-
specific “core operations” questions, there is a large set of overlapping questions covering monitoring,
target-setting and people management practices. Figure 5a shows the distribution of scores within
each of the countries for which we have all three sectors. On average, scores for hospitals are lower
relative to manufacturing, and schools are lower than hospitals in all countries in our sample. The
deficit is similar across the operations management and people management questions, too. In
all, variation across countries is interesting to observe and important to document. But does this
difference in management practices matter?
2.2.2 Management matters
There is a large literature documenting the importance of management practices in organizations,
much of which will be reviewed in the papers in this issue. As such, we will focus on the lessons
we learned from the WMS (and WMS-like) measures. The various management indices have been
used to explore the relationship between management and establishment performance (productivity,
student achievement, mortality rates), as well as other organizational outcomes (work-life balance,
wage inequality).
Firms The vast majority of studies using the WMS measures are not randomized control trials
(RCTs), but rather use non-experimental regressions with cross-sectional or panel data. Figure
11
We have substantially fewer countries in the retail dataset, but the pattern is consistent.
76 shows the average value of each of six performance outcomes across the deciles of the main
management measure. The relationship is monotonically positive: firms in the higher deciles of
management have higher productivity, operating profit, output growth, exports, Research and
Development expenditures and patents [Bloom et al., 2019a]. This positive relationship has been
consistently verified across a number of studies and settings. Figure 7 summarizes the coefficients
and confidence intervals from these studies.
It is reassuring that the core correlation is robust to so many different (and demanding)
specifications and contexts. The range of specifications include firms in all available countries and
running OLS regressions in levels with the cross-sectional data as well as fixed effects regressions
with panel data. Much of the pooled country analysis comes from semi-public performance data
from public reports data aggregators such as Bureau van Dijk. This could mean a selection bias
towards countries with strong reporting requirements (as in Europe), but a number of papers also
match the WMS data to country-specific confidential administrative datasets and continue to find
the same patterns.12 The core management-performance results for the WMS data with matching
public performance data is robust to this aggregation, or alternative ones using factor analysis or
the more recent Anderson [2008] index.13
Still, non-experimental evidence has limits, including the omnipresent omitted variable bias and
reverse causality issues. Even in panel data analysis including time-invariant fixed effects, estimates
could be susceptible to time-variant unobservables that are correlated with both management and
performance. In cases like this, RCT evidence can be a powerful complement to broad-based
correlational evidence and Bloom et al. [2013] is an example of this. They started with a set of
textile manufacturers in India (a simple technology that is easy to compare across firms), and
divided them into two groups: one that was provided with high quality management consulting to
help them adopt the type of modern management practices measured by the WMS (the treatment
group), and another that was not provided with consulting help but only data collection visits (the
control group). The experiment showed a causal effect of adopting these practices on productivity
that mirrored the magnitudes seen in the correlational work: one standard deviation increase in
management quality led to approximately 10% increase in productivity. A subsequent follow-up
several years after the experiment found that the impacts were lasting: while about half of the
practices originally adopted were still in use, they had spread across untreated plants within the
same firm — though notably not across firms [Bloom et al., 2020b].
But productivity is not the only thing management practices affect. Researchers have also
found a positive relationship between management practices and family friendly policies and work-
life balance [Bloom et al., 2009], energy efficiency [Bloom et al., 2010], good hiring and firing
decisions as well as within-firm wage inequality [Cornwell et al., 2020, Bender et al., 2018, Song
12
For example, Lemos and Scur [2019] and Cornwell et al. [2020] for Brazil, Bloom et al. [2019a] for the US, and
Heyman et al. [2019] for Sweden.
13
Meagher [2013] use Bayesian techniques with WMS data from the UK, US, France and find that there is some
convexity in this relationship for high scores.
8et al., 2018] and tax planning [Bilicka and Scur, 2020].
Public sector The positive relationship between management and performance is also present
in the public sector. In hospitals, better management practices were correlated with better patient
outcomes (survival rates and lower length of stay) [Bloom et al., 2015c, 2020a]. In for-profit
nursing homes, better managed is associated with lower likelihood of bad performance (although
this does not hold in not-for-profit nursing homes. In schools, there is again a positive relationship
between management practices and student test scores [Bloom et al., 2015b, Lemos et al., 2021],
in both public and private schools. In university departments, McCormack et al. [2014] finds
better management is correlated with better teaching scores and research outcomes. In government
services (the post office), better management is correlated with higher efficiency at the county level
[Chong et al., 2014]. In bureaucracies, Rasul and Rogger [2018] find that while the autonomy
of bureaucrats is positively linked to completion rates of engineering projects, incentives and
monitoring are not. As our focus is primarily on the lessons for the private sector, we abstain
from a longer discussion on the public sector here and direct readers to Valero [2021] and Ali et al.
[2021].
3 Potential policy directions
More generally, if we accept that there is a causal relationship between productivity and better
management, there is also a macro effect of improving management and that matters for governments
and government policy. Bloom et al. [2016] estimate that management accounts for, on average,
about a third of the gap in total factor productivity (TFP) between the United States and other
countries in the sample.14 Further, we have growing evidence that managers and management
practices matter in the delivery of public sector services as well [Finizia, 2020, Bloom et al., 2015b,
Rasul et al., 2018]. So what we have learned about what this means for government policy on
management practices?
There is much evidence about the “drivers” of management practices, so we pull this research
together in policy relevant ways. We imagine that a policy maker has a budget for management-
related policies and wants advice on how the funds could be best used. We put together a “policy
toolkit” summarized in Table 2. These are our subjective judgements of the literature on a core
set of common policies, which we justify in the sections below.
In column 1, we split policies into “structural” which are not usually specifically targeted on
management, but where research has produced evidence suggesting an indirect effect on management
(generally, by reducing market frictions) and “direct” which are policies more clearly targeted
on management. The rows for structural policies are competition, trade/FDI, education, labor
14
For some countries, like Portugal and Italy, management can account for as much as half the difference in TFP,
while for countries like Japan and Sweden it accounts for much less, closer to 10% of the gap.
9regulation and governance. For direct policies, they are training (which we divide into consulting
vs. formal classroom) or informational interventions. These are within-organization incremental
changes rather than full system-wide reforms, focused on improving organizational or manager-
specific skills and practices.
Column 2 of Table 2 includes our judgement of the strength of the evidence available for the
effectiveness of each type of policy. Our decision of awarding low, medium or high is based on a
combination of quantity, quality and credibility of research papers and research designs.15 Broadly,
a ranking of low (L) refers to a body of evidence that primarily constitutes of cross-sectional
correlational evidence. A ranking of medium (M) indicates that the evidence includes research
designs with panel data, showing differences across time and some accounting of organizational
fixed effects. A ranking of high (H) indicates that the evidence is arguably causal, with research
designs including natural experiments or randomized control trials. We discuss a set of specific
papers below, but our ranking takes into account consistency and conclusiveness of results in the
literature, as well as whether it extends across contexts in determining the ultimate “strength” of
the evidence.
Column 3 of Table 2 scores the net benefit of the policy, taking into account the overall benefits
for firms minus the costs incurred by the government. In the spirit of focusing on the implications
for management improvements, we abstract from making broader welfare statements that would
need to take into account possible spillover effects from management. In addition, we focus only
on the impact of management and the other potential benefits from these policies (e.g. general
education can improve productivity and growth).
Column 4 of Table 2 considers the difficulty of implementing these policies. While some might
have high net benefits, they might be “costly” in terms of political capital and thus quite difficult to
implement. Our implementation difficulty assessment is based on a combination of the likelihood
of push-back from interest groups or policy recipients, the financial cost of implementing a policy,
and the coordination requirement to get a policy enacted (including cross-departments or across
countries). A ranking of low (L) suggests we expect the policy to be a combination of politically
uncontroversial, relatively cheap, and easy to coordinate. Medium (M) suggests we expect there
would be some challenges to implementing the policy, though they would be tractable. For example,
the policy would require some coordination, allocation of sizeable funds and/or there is some
likelihood of pushback. A ranking of hard (H) suggests we expect there to be severe challenges
to implementation, either from expected push-back from powerful groups, prohibitive costs of
implementation or extreme coordination requirements.
Column 5 considers the time frame of when the expected effects would start materializing after
the policy has been enacted and fully implemented. A short time frame refers to policies that would
yield results within one year, a medium time frame refers to results between one and five years,
15
To be sure, we are not assessing the quality of the research papers on the topic, but rather how useful the evidence
is for the question at hand. Excellent papers sometimes can provide only limited or weak evidence on a particular
topic.
10and a long time frame refers to longer than five years.
3.1 Structural policy types
Product Market Competition Competition has long been recognized as an important driver
of productivity, where organizations either improve their offerings to survive or exit the markets
they operate in [e.g. Syverson, 2004, Galdón-Sánchez and Schmitz, 2002]. Policies include removing
regulatory barriers to entry for new firms and protections for badly run incumbents. One mechanism
through which competition affects productivity is management [van Reenen, 2011, Syverson, 2011].
In particular, Bloom and Van Reenen [2007] used three indicators of competition to show a
strong positive relationship between higher competition and higher management scores: (i) trade
openness,16 (ii) a Lerner index, where high values suggest tough competition17 , (iii) the number of
perceived direct competitors reported in the WMS interview. The relationship has also been found
in the healthcare sector, where Bloom et al. [2015c] find a positive causal effect of competition
on hospital management in the UK. In our data, we consistently find that there is a positive and
significant correlation between number of perceived competitors and management scores across
manufacturing, hospitals and schools.18 Overall, there is substantial strength in the evidence pool
for this policy lever.
There is a very high net benefit of policies that spur competition, five out of five widgets
in our ranking, as the cost is low and the benefit very high. We see it as a policy that has a
medium difficulty of implementation as there may be some special interest groups that would push
against dismantling protectionist barriers, but these actors are often in relatively weaker coalitions
of unproductive firms [e.g. Parente and Prescott, 1999]. The time frame is “medium”, as we would
expect the effect would take at least one year to start materializing, but no more than five years.
Trade and Foreign Direct Investment Trade and openness is a related policy, in that exposure
to more free trade and open markets yields heightened competition. In addition, there may
be benefits in terms of wider export markets, better inputs and the transplantation of better
management through the affiliates of multinationals. Bloom et al. [2015a] use the timing of China’s
accession to the World Trade Organization to estimate the (positive) causal impact of trade-induced
competition on management both within firms and through reallocating employment towards more
productive and better managed firms. Bloom et al. [2020c] show that firms with higher management
scores are more likely to export, have more export destinations, export higher volumes and products
of better quality. Atkin et al. [2017] randomize access to foreign markets for rug producers and
find a causal evidence of learning-by-exporting, with firms showing improvements in technical
16
The measure of trade openness is the ratio of imports to production at the industry-country level.
17
The Lerner Index is calculated as the 1 minus the profits/sales of all other firms int he same industry and country,
and high values are suggestive of low long-run profits, which happens in very competitive markets.
18
For schools, however, the correlation between management and number of competitors loses significance when
we control for observable characteristics though it remains positive.
11efficiency. Verhoogen [2008] finds that higher export share is tied to ISO9000 certification — a set
of international standards on quality measurement that overlap with a set of questions in the WMS
questionnaire. At the frontier, multinational enterprises (MNE) face competition across the world
and tend to have higher management scores everywhere they operate [Bloom et al., 2012b]. Further,
Heyman et al. [2019] finds that differences in MNE management are an important determinant of
productivity among foreign affiliates. Bloom et al. [2019a] show that multinational entry into US
counties raises the management quality of local incumbent plants using “runner up” counties as
a control group. They argue that these management spillovers appear to operate through the
movement of managers between the entering multinational and local firms. Overall, we find that
this policy lever also has a large body of high-quality evidence, so we rank the strength of evidence
as high.
In terms of policy net benefit, we rank this as four and a half widgets out of five, as the benefit
is almost as high as competition policy though the cost is likely to be slightly higher. Liberalizing
trade may not carry direct costs, though some FDI incentives such as giving subsidies for foreign
firms to set up factories and create jobs, could incur at least some financial cost. It is, however, a
potentially difficult set of policies to implement as it depends on the strength of lobby and interest
groups, and the set of actors that need to agree for policy to move forward. If enacted, however,
we expect the time frame of these policies to be between one to five years.
General education There is a large literature on how improving the general education levels
have myriad economic benefits. Using the WMS dataset and geocoded firm and university data,
Feng and Valero [2020] find that firms further away from universities employ fewer skilled workers,
and note that management practices are complementary with skills. They suggest the variation in
the price of skills likely drives this relationships.19 Similarly, Bloom et al. [2020a] find that hospitals
closer to universities offering both medical and business courses have better clinical outcomes and
management practices than those further away. Queiró [2018] finds that entrepreneurs with higher
levels of education start firms that are larger at entry and also growth faster. McKenzie and
Woodruff [2017] survey micro and small firms across a set of emerging economies and find that those
firms with owners with higher human capital tended to have better business practices. Further, the
correlation between formal education of shop-floor workers and managers and management score
is still present when the “worker fixed effect” (the characteristics and skills that are specific to the
worker and carried with them from job to job) is accounted for, and is not country-specific: the
relationship was found in both in an European rich economy like Germany [Bender et al., 2018]
and an emerging economy like Brazil [Cornwell et al., 2020]. In all, we rank the strength of the
evidence for this policy type as medium, because the evidence of a positive correlation is consistent
across contexts and fairly good quality, but it lacks clear causal identification.
The net benefit of this policy is only two widgets out of five because education policy is costly
19
Also see Valero [2021].
12and the benefits for management practices are not as high as the cost. Implementation is not often
politically controversial, but again as a result of the high cost of improving general education we
rank it as medium difficulty. The time frame is undoubtedly long, as benefits would need to work
their way through school cycles that could take at least five years or longer.
Labour deregulation Rigid labour laws can create barriers to adoption of management best
practices, especially as they relate to people management. Bloom et al. [2019a] provide some of
the best evidence to date, using the Management and Organizational Practices Survey (MOPS)
from the US Census for over 35,000 firms. They show that business environment, as measured
by US right-to-work (RTW) laws which generally weaken labour union power, yield higher use
of incentive management practices. There is also cross-sectional evidence suggesting that labour
market regulation across countries has a negative correlation with people management practices
[Bloom et al., 2012a]. Further, the education sector provides additional correlational evidence
as it often has public and private schools operating under more rigid and flexible labour regimes
(respectively). Lemos et al. [2021] show that the difference in personnel management scores between
public and private schools are larger than the difference in operations management scores, and
drastically larger in emerging economies and developing countries. Overall, we rank the strength of
evidence as a medium because there is at least one paper providing good causal evidence supported
by others with correlational evidence, but the strong evidence comes from one particular context.
The net benefit is three widgets out of five because it is relatively cheap to adopt, but benefits
seem to be concentrated on a subset of the practices that we are evaluating. It is also difficult
to implement given the complexities associated with labor-market reforms. The time frame of the
policy, if implemented, is likely to be medium term.
Governance Another relevant type of regulation relates to those that affect firm governance, as
ownership structures and who controls the firm seems to matter for the type of practices adopted
[Bloom and Van Reenen, 2007, Bloom et al., 2015d]. For example, a major policy of this type
involves generous estate tax exemptions for inherited firms. Such policies can likely be credited with
a larger share of second-plus generation family businesses in places such as the UK and Italy. This
matters, as family firms have significantly lower management scores in every country surveyed. In
fact, Lemos and Scur [2019] find that a CEO succession to a family member instead of a professional
manager leads to almost a full standard deviation lower management scores. Bandiera et al. [2015]
show that family firms offer flatter compensation schemes and have lower scores on management
practices related to incentives. Similar to labour deregulation, we rank the strength of the evidence
on this type of policy as a medium because there are a number of papers investigating various
governance structures in correlational studies, but at most one paper with good causal evidence
from multiple countries.
The net benefit of policies that end privileged tax treatment earns four widgets out of five, as
13the policy is cheap — it could even raise government revenue through higher tax intake — and
there is a high potential benefit to improving practices. However, the management benefits only
materialize if the incentives succeed in pushing firms to professionalize the ranks of firm governance.
It ranks as a medium to high difficulty of implementation because it will heavily depend on the
political strength of some lobby groups, such as family business owners. If implemented, the time
frame we would expect for policy results would be long term.
3.2 Direct Management policies
We know much less about the micro-level drivers of management practices and it is a fruitful
and active research area. We see the main policy options in this space as falling in three groups:
first, providing managers with training via consulting services. We define these as programs where
trained consultants work with managers in the establishment to identify their main issues and
how to solve them. The second group includes formal management training, via more traditional
classroom-based training that the managers then take back to their firms and apply to their issues by
themselves. The third group includes mixed type of information and benchmarking provision, where
managers are exposed to information that allows them to compare their practices and performance
to that of their peers.
Training: in-firm consulting There is substantial good evidence that in-firm consulting is
highly effective for improving management practices, and we rank the strength of the evidence
as high. Bloom et al. [2013] ran the first randomized control trial of this kind and found that a
treatment of intensive, high quality management consulting yielded large improvements to practices,
many of which were kept even in the long term [Bloom et al., 2020b]. This first experiment was
run with textile firms in India, but the result has been consistent across other contexts including
small and medium firms across a number of different countries and firm types [e.g. Bruhn et al.,
2018, Karlan et al., 2015, Higuchi et al., 2015, Giorcelli, 2019, Nam et al., 2020].
The policy net benefit is three widgets out of five, as the evidence suggests the benefits are very
high but the cost can also be high depending on the type of consultants used in the interventions.
We rate the difficulty of implementation as medium to low because such policies are generally seen
as positive and should encounter low resistance, though they do require some financial commitment.
The timeline is certainly short, as we have seen the effects show up fairly consistently within one
year.
Training: formal classroom A related policy tool is providing classroom-based training programs
for managers, though the strength of the evidence for this policy is not as strong as for in-firm
consulting. McKenzie [2021] discusses frontier in management training of small firms in the private
sector in this issue, so will keep our comments brief. Of note are papers that specifically tackle the
different modes of this type of training delivery, such as Iacovone et al. [2019] and Higuchi et al.
14[2019]. The primary issue is the large variance in the quality and intensity of the training and the
trainers, which in turn yields mixed results in terms of adoption of practices and the effects on
productivity. Many papers also tend to measure outcomes in the short run, while it has since been
shown that some effects of this type of training shows up in the medium run.
Unlike in-firm consulting, this type of formal training intervention has made its way into the
public sector. For example, experiments such as Fryer [2017], where an intense management training
program for principals in US public schools yield a marked improvement in student achievement.
In healthcare, Dunsch et al. [2017] run a management training experiment with primary healthcare
centres in Nigeria and find short run effects in adoption of practices as well as intermediate outcomes,
but fail to see long term impacts.
The net benefit of policies that provide formal classroom training earns two widgets out of five
in our ranking. This is primarily because the cost is uncertain and varies heavily with the intensity
of the program and the quality of the trainers, and the benefits are also uncertain. The difficulty
of implementation is likely to be low, and the time frame is medium-term.
Information and benchmarking Finally, there are a number of interventions that are adjacent
to consulting and strictly formal classroom training. For example, providing information on the
practices of other firms or leveraging the knowledge of local business people as mentors [Brooks
et al., 2018, Cai and Szeidl, 2017]. These seem to be effective in some contexts, but the evidence is
limited. Providing benchmarking information also seems to be effective [Gosnell et al., 2020, Cai
and Wang, 2020], and indeed Bloom et al. [2013] report that “lack of knowledge” was an often cited
reason for failing to initiate improvements to their management practices.
In the WMS questionnaire, the very last question asks the manager to score their establishment
on the quality of their management practices on a scale of 1 (worst) to 10 (best). The question is
set up to allow for the most honest assessment from the manager: the interviewer is clear that the
reported score is meant to evaluate the average quality of the structures and practices and exclude
the managers themselves, and the question comes at the end of at least one hour of discussing the
practices they are meant to finally evaluate. The majority of managers over-estimate the level of the
practices in their establishments, and this is particularly salient in the public sector establishments.
In all, the evidence on this type of policy initiative is still in its early stages. Our assessment
of the strength of the evidence is low, not because of the quality of the existing papers but rather
because of the limited scope in terms of context and small quantity of the existing research. For
example, evidence from a large-scale program in India providing a mix of information and targeted
support to improving school performance plans shows no impact on management practices nor
student achievement [Muralidharan and Singh, 2020]. A similar program in Mexico, however,
shows positive results on student test scores [de Hoyos et al., 2017]. In the net benefit we rank it
at three widgets out of five, mainly because the cost of providing information is often next to zero
and the benefit is potentially high (though uncertain). The difficulty of implementing its policies
15is low and the expected time frame is medium-term.
4 Conclusion
The last nearly two decades have seen the WMS dataset expand by a factor of twenty, and the
number of researchers using this data is over 5,000.20 The first decade was primarily spent honing
the measurement methods and amassing an arsenal of data with a focus on showing the various
facets of the management and productivity relationship. In the second decade we started to see
papers focusing on outcomes other than productivity, including energy efficiency, IT use and work-
life balance. At the end of this second decade, the outcomes have expanded even further. Papers
now in circulation explore the relationship between management practices and wage inequality,
discrimination, tax avoidance, and more.
We also see an important set of papers pushing further on this idea of the manager vs.
management, and the WMS very specifically focuses on the “technology” of it absent the manager.
But the manager is the often the implementing party, and especially as hard technology starts
changing, the job of the manager and the role of these partially office-based practices is also going
to change. And finally, there is a question also on understanding the lack of adoption and to the
extent that many of these practices are beneficial, why so many organizations fail to adopt them.
In terms of policy work, much has been done on structural drivers such as product market
competition, foreign direct investment and regulation (even if the policy here is hard to do), but
there is still much room for work on the “soft” type of drivers [Azulai et al.] and considering the
effect of training, education, incentives in public vs private sector. Going into this more micro-level
setting will take a large set of projects across various contexts to help us understand the frictions
in each context. This is a fruitful area of research that we hope will continue to grow and develop.
20
A list of the over 170 projects approved for special data access are listed on our website, and the public anonymized
dataset continues to be accessible to all interested researchers: www.worldmanagementsurvey.org
165 Tables and Figures
Table 1: Factor Analysis: management questions
Manufacturing Public hospitals Public schools
Factor 1 Factor 2 Factor 1 Factor 2 Factor 3 Factor 1 Factor 2
Overall operations
Adoption of lean 0.7521 -0.2944 0.4716 -0.4525 0.4387
Rationale for lean 0.6898 -0.2883 0.5657 -0.4143 0.309
Hospital standardization 0.6166 -0.2356 0.1513
Hospital use of human resources 0.6145 -0.227 0.1453
Standard instructional process 0.6089 -0.3457
Personalization of learning 0.7544 -0.1454
Data-driven planning 0.7402 -0.0209
Educational best practices 0.7269 -0.1527
Continuous improvement 0.7699 -0.2287 0.6755 -0.2262 0.0579 0.7411 -0.1582
Performance tracking 0.7691 -0.2664 0.6942 -0.0749 -0.2772 0.7433 -0.2851
Review of performance 0.7845 -0.2199 0.7361 -0.14 -0.3428 0.7525 -0.2858
Performance dialogue 0.7904 -0.2087 0.7287 -0.0481 -0.3066 0.781 -0.2216
Consequence management 0.7423 -0.0765 0.6823 -0.0487 -0.375 0.7286 -0.052
Type of targets 0.7151 -0.0634 0.6842 0.0746 -0.1241 0.7418 -0.1326
Interconnection of goals 0.7641 -0.0487 0.6848 -0.0496 -0.1569 0.7589 0.0166
Time horizon of goals 0.7021 -0.0517 0.63 0.0178 -0.0524 0.7564 -0.0509
Goals are stretching 0.6637 -0.0098 0.6771 -0.0253 -0.0949 0.7606 -0.0344
Clarity of goals 0.601 0.1125 0.5889 0.1219 0.0242 0.7355 0.1542
People management
Talent mindset 0.656 0.2759 0.5892 0.2843 0.2821 0.6783 0.3687
Incentives and appraisals 0.5767 0.4075 0.5001 0.4784 0.0694 0.5558 0.274
Dealing with poor performers 0.4978 0.3606 0.547 0.3591 0.0614 0.6049 0.2954
Developing good performers 0.6525 0.3765 0.6325 0.3448 0.176 0.6477 0.4129
Employee value proposition 0.6684 0.2953 0.4792 0.3976 0.2591 0.4945 0.5207
Retaining talent 0.4413 0.4867 0.6301 0.0222 0.1999 0.7418 0.1791
Eigenvalue 8.48471 1.2507 7.83918 1.30441 1.0429 9.99207 1.22163
% total variance 0.4714 0.0695 0.392 0.0652 0.0521 0.4996 0.0611
Number of observations 12,209 12,209 1,125 1,125 1,125 1,326 1,326
Note: This table reports the results of conducting factor analysis on the World Management Survey sample for
each of manufacturing firms, public hospitals and public schools. All questions from the three respective surveys
are listed on the first column, and where the cell is blank the question does not exist for that particular survey.
The questions from continuous improvement to retaining talent are common across all surveys. The questions of
adoption of lean and rationale for lean are “common” across manufacturing and hospitals, though the scoring for
each is sector-specific. Only the first two factors are listed because, for all three sectors, the third-plus factors
had eigenvalues lower than one.
17You can also read