Feedback from reorienting AGN jets - Jet-ICM coupling, cavity properties and global energetics
←
→
Page content transcription
If your browser does not render page correctly, please read the page content below
Astronomy & Astrophysics manuscript no. 32582corr                                                                                        c ESO 2018
                                               August 21, 2018

                                                                                 Feedback from reorienting AGN jets
                                                                   I. Jet-ICM coupling, cavity properties and global energetics
                                                                     S. Cielo1 , A. Babul2, 3, 4 , V. Antonuccio-Delogu5 , J. Silk1, 4, 6, 7, 8 and M. Volonteri1, 4

                                                     1
                                                         Sorbonne Universités, UPMC Univ Paris 6 et CNRS, UMR 7095, IAP, Paris, 98 bis bd Arago, 75014 Paris, France
                                                         e-mail: [cielo; silk; volonteri]@iap.fr
                                                     2
                                                         University of Victoria, 3800 Finnerty Road, Victoria BC V8P 5C2, Canada
                                                         e-mail: babul@uvic.ca
                                                     3
                                                         Institute of Computational Science, Centre for Theoretical Astrophysics and Cosmology, University of Zurich, Winterthurerstrasse
arXiv:1801.04276v2 [astro-ph.GA] 17 Aug 2018

                                                         190, 8057, Zurich, Switzerland
                                                     4
                                                         Institut d’Astrophysique de Paris, 98 bis bd Arago, F-75014 Paris, France
                                                     5
                                                         INAF/Istituto Nazionale di Astrofisica-Catania Astrophysical Observatory, Via S. Sofia 78, I-95126 Catania, Italy
                                                         e-mail: Vincenzo.Antonuccio@oact.inaf.it
                                                     6
                                                         AIM-Paris-Saclay, CEA/DSM/IRFU, CNRS, Univ Paris 7, F-91191 Gif-sur-Yvette, France
                                                     7
                                                         Department of Physics and Astronomy, The Johns Hopkins University, Baltimore, MD 21218, USA
                                                     8
                                                         BIPAC, University of Oxford, 1 Keble Road, Oxford OX1 3RH, UK

                                                    Received September 15, 20XX; accepted September 16, 20XX

                                                                                                                   ABSTRACT

                                                    Aims. We test the effects of re-orienting jets from an active galactic nucleus (AGN) on the intracluster medium in a galaxy cluster
                                                    environment with short central cooling time. We investigate both the appearance and the properties of the resulting cavities, and the
                                                    efficiency of the jets in providing near-isotropic heating to the cooling cluster core.
                                                    Methods. We use numerical simulations to explore four models of AGN jets over several active/inactive cycles. We keep the jet power
                                                    and duration fixed across the models, varying only the jet re-orientation angle prescription. We track the total energy of the intracluster
                                                    medium (ICM) in the cluster core over time, and the fraction of the jet energy transferred to the ICM. We pay particular attention to
                                                    where the energy is deposited. We also generate synthetic X-ray images of the simulated cluster and compare them qualitatively to
                                                    actual observations.
                                                    Results. Jets whose re-orientation is minimal (. 20◦ ) typically produce conical structures of interconnected cavities, with the opening
                                                    angle of the cones being ∼ 15 − 20◦ , extending to ∼ 300 kpc from the cluster centre. Such jets transfer about 60% of their energy to the
                                                    ICM, yet they are not very efficient at heating the cluster core, and even less efficient at heating it isotropically, because the jet energy
                                                    is deposited further out. Jets that re-orientate by & 20◦ generally produce multiple pairs of detached cavities. Although smaller, these
                                                    cavities are inflated within the central 50 kpc and are more isotropically distributed, resulting in more effective heating of the core.
                                                    Such jets, over hundreds of millions of years, can deposit up to 80% of their energy precisely where it is required. Consequently, these
                                                    models come the closest in terms of approaching a heating/cooling balance and mitigating runaway cooling of the cluster core even
                                                    though all models have identical jet power/duration profiles. Additionally, the corresponding synthetic X-ray images exhibit structures
                                                    and features closely resembling those seen in real cool-core clusters.
                                                    Key words. galaxies: clusters: intracluster medium — galaxies: jets — X-rays: galaxies: clusters — methods: numerical

                                               1. Introduction                                                              that this is indeed what is happening (for a review, see McNa-
                                                                                                                            mara & Nulsen 2007, 2012; Fabian 2012; Soker 2016), there are
                                               Despite early claims that clusters of galaxies are straightforward           a number of critical details associated with this jet-heating pic-
                                               systems to model, steadily improving observations as well as                 ture (commonly referred to as radio-mode AGN feedback) that
                                               decade-long theoretical and computational efforts indicate that              have yet to be properly understood; of these, two particularly
                                               they are anything but. There is, as of yet, no clear consensus on            stand out.
                                               how the remarkable diversity of observed cluster core proper-
                                               ties, ranging from "strong cool core" to "extreme non-cool core"                 The first concerns the origin of the gas whose accretion onto
                                               (i.e. central cooling times ranging from one to two hundred mil-             the SMBH powers the jet: Is it due to hot/Bondi accretion or
                                               lion years up to several gigayears) and everything in between,               a drizzle of cold clouds condensing out of the ambient gas in
                                               has emerged. In the case of cool core groups and clusters, pow-              the cluster cores and free-falling onto the central AGN? For a
                                               erful jets from central supermassive black holes (SMBHs) have                detailed discussion, we refer the reader to Prasad et al. (2015,
                                               long been suspected of injecting the required energy into the in-            2017) and references therein. Here, we simply summarise the
                                               tracluster medium (ICM) to compensate for radiative losses and               current state of affairs by noting that that several different lines
                                               maintain global stability (see for instance Rephaeli & Silk 1995;            of observational evidence seem to collectively favour the “cold
                                               Binney & Tabor 1995; Ciotti & Ostriker 2001; Babul et al. 2002;              rain” model and theoretical studies indicate that the cold clouds
                                               McCarthy et al. 2008), and while today there is broad consensus              are expected to naturally form in the presence of AGN-induced
                                                                                                                                                                         Article number, page 1 of 23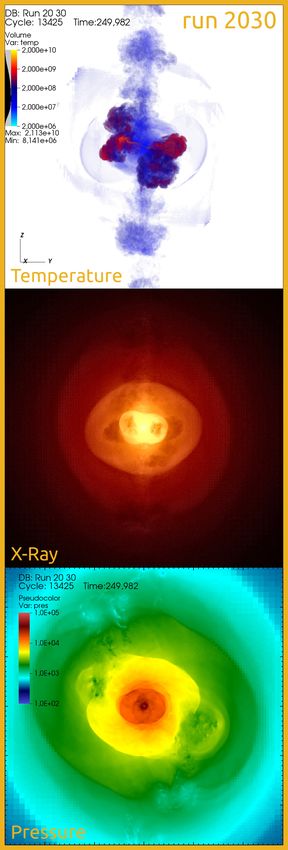
A&A proofs: manuscript no. 32582corr

turbulence. The latter calls attention to a broader set of related     2001; Brüggen 2003; Revaz et al. 2008; Pope et al. 2010; Duan
questions regarding the impact of AGN feedback on gas accre-           & Guo 2018 and references therein), besides being locally ther-
tion processes; for example, does the AGN simply expel the gas         mally unstable and susceptible to in situ cloud/filament forma-
around the SMBH, leading to the shutdown of AGN activity for           tion (c.f. Cowie et al. 1980; Hattori et al. 1995; Heckman et al.
a period of time, or does it promote other mechanisms of ac-           1989; Pizzolato & Soker 2005b, 2010; Nipoti & Binney 2004;
cretion onto the AGN that also contribute to its self-regulation?      Maller & Bullock 2004; McDonald et al. 2010; Hobbs et al.
In a recent study, Cielo et al. (2017) found that jet-induced gas      2011; Sharma et al. 2012; Gaspari et al. 2013; Li & Bryan 2014;
circulation (backflows) can funnel as much as 1 M /yr to the in-       Gaspari et al. 2017; Voit et al. 2017; Prasad et al. 2015, 2017,
nermost parsecs (see also Antonuccio-Delogu & Silk 2010).              and references therein).
     The second issue concerns the coupling between the jets and       (2) The second class of models invoke “ICM weather”, that
the ICM: how does a central SMBH, powering apparently nar-             is, wakes, bulk velocities, and turbulence on scales of a few kilo-
row bipolar outflows, successfully manage to heat the gas in the       parsecs or larger, induced either by mergers or orbiting substruc-
cluster cores in a near-isotropic fashion? In this paper, we focus     ture (Soker & Bisker 2006; Heinz et al. 2006; Morsony et al.
on this latter issue.                                                  2010; Mendygral et al. 2012). One potential issue with this class
     Establishing precisely how bipolar AGN jets interact with         of model is the need for substantial velocity shear across the
and heat the ICM in the cluster cores to prevent cooling catas-        cluster core. In a simulation study of 63 clusters by Lau et al.
trophes has proven to be an especially vexing problem. The is-         (2017), only a small fraction meet this bar.
sue has been the subject of numerous studies dating back to the        (3) The third class invokes occasional changes in the orienta-
early 2000s (c.f. Reynolds et al. 2001, 2002; Omma et al. 2004;        tion of the spin axis of the SMBHs that are powering the jets
Omma & Binney 2004). In what was the first systematic attempt          (and hence, the re-orientation of the jet axis). This can occur as
to address this problem using a series of high-resolution, three-      a result of precession and slewing (or tilting) of the black hole
dimensional hydrodynamic simulations, Vernaleo & Reynolds              spin axis, particularly in combination with intermittent jet activ-
(2006), who considered the standard model where the direction          ity, and spin flips (c.f. Merritt & Ekers 2002; Pizzolato & Soker
of the jets is fixed, found that such jets only managed to delay       2005a; Gitti et al. 2006a; Dunn et al. 2006; Lodato & Pringle
the onset of catastrophic cooling, not prevent it (see also O’Neill    2006; Campanelli et al. 2007; Sternberg & Soker 2008; Kesden
& Jones 2010). The primary reason for the failure was that once        et al. 2010; Falceta-Gonçalves et al. 2010; Merritt & Vasiliev
the initial jet had drilled through the cluster core and excavated     2012; Babul et al. 2013; Gerosa et al. 2015; Franchini et al.
a low-density channel, all subsequent jets took advantage of this      2016; Nawaz et al. 2016). From a macroscopic, cluster core scale
channel to flow freely out of the core, carrying their energy with     perspective, all of these are similar in that they give rise to jets
them. The authors concluded that some additional complexity is         whose orientation changes stochastically. Interestingly, a recent
required to ensure more effective heating of the cluster cores by      multi-wavelength study (O’Sullivan et al. 2012) of the core of
AGN jets.                                                              z=0.442 cool-core galaxy cluster CL 09104+4109, and the Type
     Detailed X-ray and radio observations of individual cool          II quasi-stellar object (QSO) B0910+410 at its centre, offers
core groups and clusters (hereafter collectively referred to as        tantalising support for this scenario. B0910+410 is one of only
“cool core clusters” or CCC) offer intriguing hints about how          two z < 0.5 QSOs at the centre of a galaxy cluster and it seems
nature has addressed the “isotropy” problem in real systems.           to have switched from being a radio AGN to a QSO about 200
Many of the CCCs show evidence of multiple generations of              Myrs ago in response to a significant inflow of gas, and appears
active and relic jets, radio lobes, and X-ray cavities whose an-       to be transitioning back to a radio AGN, with the bud of a new
gular positions/directions in the sky are misaligned with re-          jet clearly misaligned with respect to the old large-scale relic jet.
spect to each other. Since these by-products of AGN jets trace              In this paper, the first of a series, we use numerical simula-
a nearly isotropic angular distribution about the cluster centre,      tions to investigate the latter class of models within the frame-
Babul et al. (2013) argue that the associated heating should do        work of a cool-core galaxy cluster with an initial central cooling
the same. Moreover, since the observations indicate directional        time of 150 Myr. We attempt to capture the basic feature of
changes on time-scales ranging from a few to a few tens of mil-        the different models within this category via stochastically re-
lions of years — which is typically shorter than the core cooling      orienting jets. We investigate explicitly the extent to which such
time — the jets ought to be able to heat and maintain the core in      jets couple to the cooling ICM in the cluster core, the efficacy of
at least a global equilibrium configuration.                           these models in affecting isotropic heating in the cluster cores,
     There are three distinct categories of models proposed to ac-     and more broadly, the impact of such jets on the thermal and
count for the observed misalignment of successive generations          dynamical evolution of the hot diffuse ICM. We explore three
of jet-lobe-cavity features:                                           different prescriptions for jet re-orientation (also running a case
(1) The first invokes jets interacting with, and being deflected by,   without jets and a jetted but non-reorienting one, for reference),
dense clouds and filaments in the ICM (c.f. de Gouveia Dal Pino        and compare the predictions for the properties of the bubbles and
1999; Mendoza & Longair 2001; Saxton et al. 2005; Prasad et al.        the stability of the cool core in each case.
2018). This scenario has not been explored much because histor-             In Sect. 2, we describe the model we use for our re-orienting
ically the ICM was assumed to be largely homogeneous. How-             jets in a CCC, and the set-up of our simulations. Sections 3, 4,
ever, there may be cause to revisit this model. Observations show      and 5 are devoted to a detailed but qualitative description of the
that the central galaxies in cool core clusters are typically sur-     physics and appearance of the cavities and all the visible struc-
rounded by extended filamentary warm-cool gas nebulae (Hatch           tures, obtained by comparing realistic X-ray images from the
et al. 2007; Cavagnolo et al. 2008; Wilman et al. 2009; McDon-         simulations with the physical state of the gas. We also discuss the
ald et al. 2010 — see also Heckman et al. 1989; Crawford et al.        role of projection effects. Section 6 contains a quantitative anal-
1999). Further support comes from theoretical and simulation           ysis of the bubbles’ properties and the heating that re-orienting
studies, which strongly indicate that the ICM in this region ought     jets are able to provide to the core, while Sect. 7 relates these
to be replete with the accumulated detritus of cool gas drawn out      properties to observable large-scale inflows and outflows, to the
of the central galaxies by AGN jets and bubbles (c.f. Saxton et al.    temperature and stability of the cool core, and to the energy bal-
Article number, page 2 of 23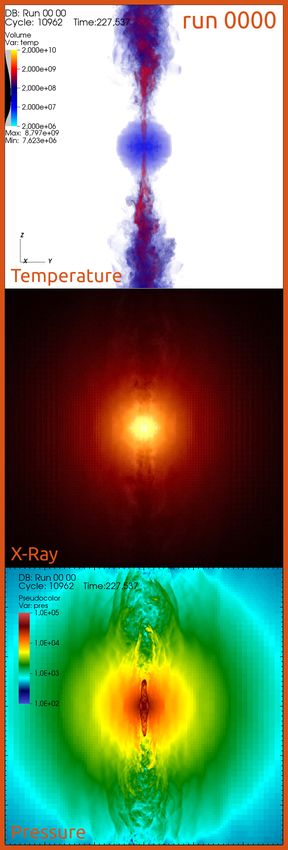
S. Cielo, A. Babul, V. Antonuccio-Delogu, J. Silk and M. Volonteri: Feedback from reorienting AGN jets

ance of X-ray gas. In Sect. 8, we relate our findings to those of              our simulation box. In order to encompass the halo r200 , we use
previous simulation studies and discuss how our results would                  a cubic box of 4 Mpc side.
change by varying the inactivity duration during a jet cycle. In                   Having defined our dark matter halo, we next add to it a
Sect. 9, we draw our conclusions on how re-orienting jets im-                  spherically symmetric hot gas component whose radial profile
pact the shape of the X-ray cavities, the ICM as a whole, and                  is subject to the following three constraints.
the halo core. A following paper featuring the same simulations
will be dedicated to an analysis of energy generation and trans-                Initial entropy profile: For the starting entropy profile of
port, differentiating the effects of the different physical mecha-                the ICM in our simulations, we adopt the functional form
nisms (radiative cooling, shock-heating, advective or convective                  ln(S (r)) = ln(S 0 ) + α ln(r/rc ), where S (r) ≡ kB T (r)/ne (r)2/3 ,
transport, mixing, turbulent dissipation, etc.), and how these de-                kB is the Boltzmann constant, T is the gas temperature, ne
termine the halos’ gaseous profiles. In the following, we refer to                is the gas electron density, calculated by assuming fully ion-
this work as paper II.                                                            ized plasma with the given metallicity, and the power-law
                                                                                  index α = 1.1 when r is larger than the core radius rc , and
                                                                                  α = 0 otherwise. This simple functional form has previ-
                                                                                  ously been used to describe the observed diversity of en-
2. Models and numerical implementations                                           tropy profiles across the cool-core/non-cool core spectrum
We test the reorienting jets model using a total of five numerical                (Cavagnolo et al. 2009) as well as starting configurations in
simulations. These simulations were run using the hydrodynam-                     theoretical and numerical studies (Babul et al. 2002; Mc-
ical, adaptive mesh refinement (AMR) code FLASH v4.2 (Fryx-                       Carthy et al. 2008; Prasad et al. 2015). We choose a core
ell et al. 2000), adopting a modified setup described in Cielo                    radius of rc = 12 kpc and a core entropy S 0 = 12 keV cm2 ,
et al. (2017). In our computational setup, FLASH solves the non-                  which results in a core with a cooling time of 150 Myrs
relativistic Euler equations for an ideal gas, with specific heat ra-             and qualifies our simulated cluster as a cool-core system. We
tio γ = 5/3, initially placed in hydrostatic equilibrium within a                 appreciate that recent studies show that groups and clusters
gravitational potential well. The gravity acting on the gas is that               with short central cooling times do not have isentropic cores,
due to the gas itself as well as a static, spherically symmetric,                 and instead exhibit an r2/3 profile (Panagoulia et al. 2014;
dark matter halo (see below for details).                                         O’Sullivan et al. 2017; Babyk et al. 2018). Since we do not
     The metallicity of the gas is set to [Fe/H]=-0.1 throughout                  couple the jet activity to the state of the ICM (c.f. §2.2), the
and over the course of the simulation, the gas is subject to radia-               detailed structure of the inner entropy profile has no bearing
tive cooling following the same prescriptions as used by Cielo                    on our primary objective, which is to investigate the efficacy
et al. (2017). Specifically, we use the cooling function of Suther-               of the re-orientating jets at affecting near-isotropic heating in
land & Dopita (1993), extended to higher plasma temperatures                      the core region. For this, we only require that the core cool-
(i.e. ∼ 1010 K) as described in Appendix B of Antonuccio-                         ing time is shorter than the simulation run time.
                                                                                Initial hydrostatic equilibrium: We require the gas to be in
Delogu & Silk (2008) to allow for a proper treatment of gas in
                                                                                  hydrostatic equilibrium (HSE) within the dark matter poten-
the jet beams and the cavities.
                                                                                  tial. The HSE equation with the chosen entropy profile is not
     We allow the AMR in FLASH to refine up to level 10 (i.e.                     analytically integrable, so we numerically integrate it sepa-
it refines at most ten times), if density and temperature gradients               rately and import the tabulated profile into FLASH (the spa-
require so1 . At each refinement operation, a block of interest is                tial sampling of the integration is chosen equal to the grid
split in two along every spatial dimension. In addition, all the                  used in the simulations).
blocks are further divided into eight computational cells along                 Profile normalization: In order to get the right hot-gas-to-
each dimension, giving a resolution element of 4 Mpc/(8×210 ) '                   dark-matter ratio for the given halo mass, we normalize the
488 pc. Refinement can be triggered, up to maximum level, any-                    profile so that the ratio of hot gas to dark matter mass at
where in the simulation box, without geometrical restrictions;                    the radius r500 ' 1 Mpc is set to 60% of the cosmic value,
for instance, in refining we do not privilege the central region                  in agreement with the observational results shown in Liang
over the jet-inflated cavities.                                                   et al. (2016) for Virgo-mass systems.
                                                                               The resulting gas temperature is between one and a few kiloelec-
2.1. Initial conditions                                                        tron volts throughout.
All simulations feature the same initial conditions meant to re-
produce a CCC comparable in mass to the Virgo Cluster. We                      2.2. Reorienting jets: parameters and implementation
assume a flat background cosmology corresponding to Ωm h2 =
0.1574, Ωb h2 = 0.0224 and H0 = 0.7 (Komatsu et al. 2011), and                 Our implementation of the jet source terms is essentially the
use a static, spherically symmetric gravitational potential for an             same as in Cielo et al. (2017). There, the bipolar jets were in-
NFW halo (M200 ' 4.2 × 10¹⁴ M , r200 ' 1.7 Mpc) to define our                  troduced as source terms within a rectangular prism consisting
cluster. Guided by the mass-concentration relation by Newman                   of eight central cells (four cells per beam) whose long axis was
et al. (2013), which takes into account the presence of a central              aligned along one of the axes of the simulation grid. The only
BCG (see their Sect. 10.1), and the recent analysis of the Virgo               difference here is that we allow the inclination of the jet axis with
cluster observations by Simionescu et al. (2017), we set our clus-             respect to the simulation grid to vary. This, in turn, means that
ter concentration parameter to c200 = 10. The halo choice defines              the number of injection cells also varies with the jets’ inclina-
                                                                               tion. We parametrize the jets’ orientation using standard spher-
1
   The refinement criterion used is the same as in Cielo et al. (2017), i.e.   ical coordinates θ (angle between the z axis of the grid and the
FLASH’s default refinement strategy based on Löhner’s error estimator          jet axis) and ϕ (angle of the positive direction of the x axis with
(see FLASH user manual, or Löhner 1987). We apply the criterion to             the jet axis projection on the z=0 plane). When jets are injected
both density and temperature, and set this parameter to 0.8 for refine-        at an angle, the injection cells and the momentum direction are
ment and 0.6 for de-refinement.                                                changed to follow that orientation.
                                                                                                                          Article number, page 3 of 23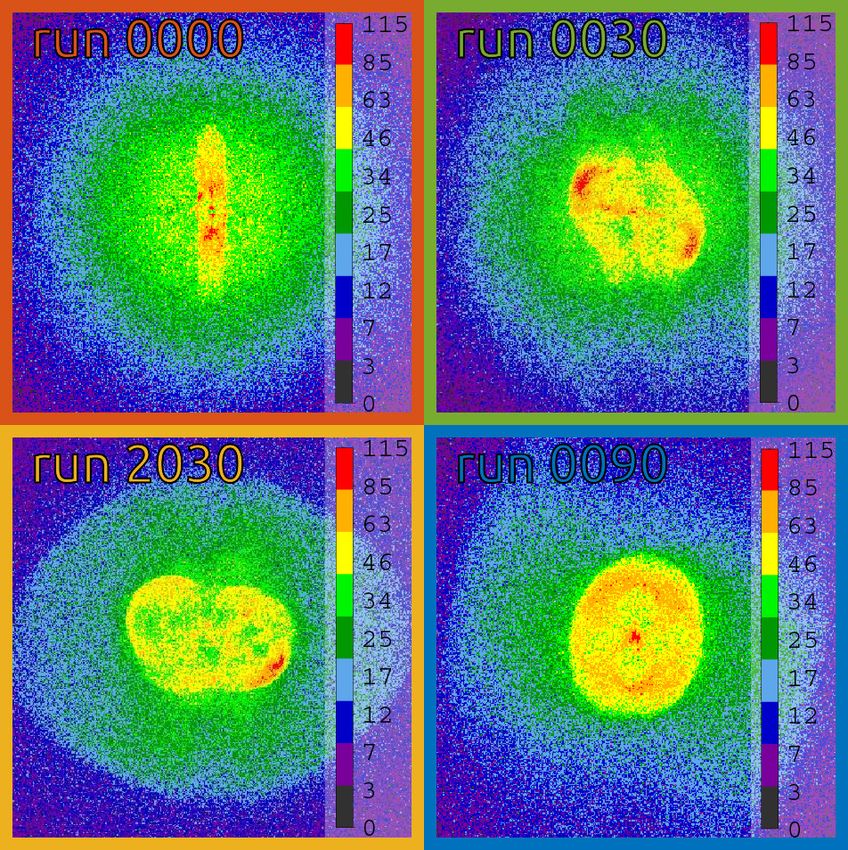
A&A proofs: manuscript no. 32582corr

Table 1. Orientation angles (θ, ϕ) of all jets in each run.                    We note that the first jet is always along the z-axis, while the
                                                                           second lies always in the y = 0 plane for visualization simplicity;
      Jet      ton    0000       0030         2030           0090          as the halo’s initial conditions are spherically symmetric, this is
        #     Myr      deg        deg          deg            deg          just a choice of reference frame.
        1        0    (0,0)      (0,0)        (0,0)          (0,0)             The run duration for the jetted simulations ranges from 227
        2      42     (0,0)     (12,0)       (25,0)         (75,0)         to 277 Myrs; all simulations terminated during the sixth jet
        3      84     (0,0)    (15,173)     (44,167)       (36,96)         event, except run 0090, which reached the seventh jet event.
        4     126     (0,0)    (28,150)     (69,160)      (18,160)         The few hundred million years duration of the simulations cov-
        5     168     (0,0)    (41,161)     (95,136)      (72,177)         ers comfortably the initial central cooling time of the halo of
        6     210     (0,0)    (65,138)     (73,137)       (82,16)         150 Myr, so that in the no-jet run a large cooling flow develops.
        7     252       -          -            -         (75,173)         The number of jet events we covered is in principle not free from
                                                                           statistical under-sampling; however, a visual inspection of the
                                                                           runs reveals that the intended solid angle coverage is achieved in
      We present four simulation runs with jets and a control run          all cases. For instance, in run 0090, cavities never substantially
with no jets. In the jetted runs, we do not couple the trigger-            overlap, so that jets are indeed affecting a portion of solid angle
ing of the jets or their power to the state of the ICM. All four           that is as large as possible; on the contrary, in run 0030, the jets
jetted runs are identical except for the prescription for their re-        quite often end up in the trail of the previous cavity, as we see in
orientation angles, meaning that all jets have the same power,             Sect. 4.
density, internal energy and injection base radius.
      Following Cielo et al. (2014), the jets’ density ρ jet is set
equal to 1/100 of the central halo gas density (see also Perucho           3. Cavities: physical background and method
et al. 2014; Guo 2016). Further, we fix the jet kinetic power to
P jet = 1045 erg/s, in agreement with measures of mechanical lu-           Our refinement criterion keeps the jet/cavity system maximally
minosities from X-ray cavities in galaxy clusters (e.g. Hlavacek-          refined at all times, therefore providing detailed insight on the
Larrondo et al. 2012) and approximately equal to the total radia-          physics of the bubbles, including velocity and turbulent struc-
tive losses of the halo gas.                                               ture, rise and expansion in the external gas, and the implications
      Besides their kinetic power P jet , the jets also have internal      for the energetics of the cool-core halo.
energy, the flux of which, U jet , can be simply computed from                 We are also able to pair this physical view with synthetic ob-
the jet Power P jet and the jet’s internal Mach number M jet :=            servations, via the production of realistic X-ray emissivity maps
v jet / γp jet /ρ jet , which we set to 3:
       p                                                                   (see Sect. 3.2 for details), in order to provide direct compari-
                                                                           son of the individual features from X-ray observations of galaxy
          P jet             2P jet 9                                       clusters. The morphology of real X-ray cavities is often more
                    1
U jet =                   =          = 0.2P jet .                    (1)   complex than a collection of bubble pairs (e.g. Zhuravleva et al.
          M2jet γ (γ − 1)    9 10                                          2016), as several other physical processes are at work. Some are
                                                                           due to the bubbles themselves: shocks, both weak and strong,
 The total energy flux is therefore a constant 1.2 × 1045 erg/s            (Nusser et al. 2006), as well as the generation and dissipation of
whenever the jets are on, and zero otherwise. All jets follow the          pressure waves (Sternberg & Soker 2009; Fabian et al. 2017 and
same on/off schedule: each jet event lasts 40 Myr, followed by             references therein) during the inflation of the bubbles; wakes,
a 2 Myr quiescent period, during which the jet source terms are            ripples and ICM motions excited by buoyantly rising bubbles
switched off. After that, another jet event starts, generally along        (Churazov et al. 2002; Nusser et al. 2006), lifting of and subse-
a different direction. Overall, this means that feedback is active         quent mixing with low-entropy gas (Brüggen 2003; Pope et al.
with constant power for ∼ 95% of the time. Our choice of 40/2              2010), and so on. Other processes are due to the cluster envi-
Myr for the timing of the jet on/off cycle is guided by the typical        ronment: shocks, cold fronts, streams and other transient struc-
timescale between misaligned jet events observed in galaxy clus-           tures associated with mergers (Poole et al. 2006 and references
ters, as catalogued by Babul et al. (2013), as well as the charac-         therein), tails of diffuse ionized gas ram-pressure stripped from
teristic jet alignment timescale in their preferred physical model.        cluster/group galaxies (e.g. Boselli et al. 2016), and so on. Many
    In this work involving constant-power periodic jets, we                of these processes can be isolated and studied simply by process-
mainly explore the parameter space of reorientation angles, for            ing the X-ray images (see Churazov et al. 2016), while simula-
which we adopt the following prescription: the jet polar angles            tions can provide insights about the origins of the various fea-
(θ, ϕ) are chosen at random (from a spherical distribution) in a           tures.
given interval of angular distance with respect to the previous jet
axis; we use this interval to label our simulation runs. For exam-         3.1. Structure generated by a single jet
ple, in run 2030, the axis of any jet will form an angle (chosen at
random) between 20 and 30 degrees relative to the previous jet             Several numerical studies (e.g. Vernaleo & Reynolds 2006;
axis. The runs we present are 0000 (i.e. jets along a fixed direc-         Sutherland & Bicknell 2007; Cielo et al. 2014) have investigated
tion), 0030, 2030, and 0090 (given the bipolar nature of the jets,         the evolution of AGN jets propagating through an unperturbed
0090 means the new direction is chosen totally at random on the            ICM. The evolution follows a characteristic trajectory that also
sphere, with no constraints).                                              provides a fitting description of the first jet event in our simu-
    Table 1 lists all orientation angles (polar, azimuthal) or (θ,         lations. Below, we briefly summarise the main features of this
ϕ) of each jet (in degrees, rounded to the nearest integer) for all        trajectory as it unfolds in our runs.
simulation runs. Random numbers are drawn from a spherical                     The initial interaction between a jet and the ambient gas cre-
distribution; then each direction is chosen so that its angular dis-       ates a ∼ 1010 K hot spot (HS; usually no wider than 1 or 2 kpc)
tance with respect to the previous jet, expressed again in degrees,        and a bow-shock propagating for several tens of kiloparsecs. The
lies within the interval that labels the run.                              two bow-shocks enclose an ellipsoidal cocoon, filled with sparse,
Article number, page 4 of 23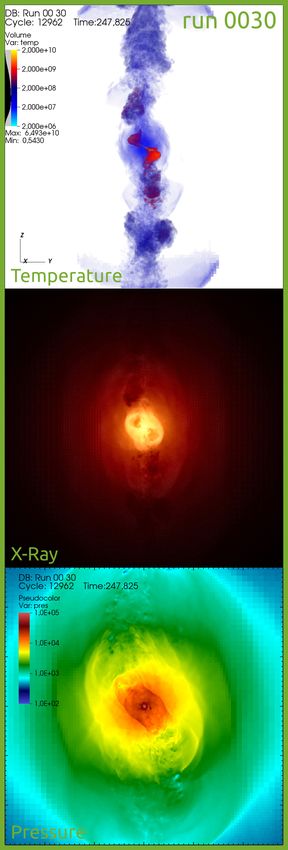
S. Cielo, A. Babul, V. Antonuccio-Delogu, J. Silk and M. Volonteri: Feedback from reorienting AGN jets

hot, and turbulent gas. Internally, the expanding cocoon supports      – the halo’s cool core, extending up to a few tens of kilopar-
large-scale gas circulation that results in backflows, while glob-       sec and presenting the lowest temperatures in the simulation
ally it behaves like an almost uniform overpressurized bubble.           (about and below 107 K);
     Near the HS, the shocked gas collects in two very hot cav-        – the bow-shocks, around 108 K (although they cool relatively
ities, which in a few million years evolve into lobe-like struc-         rapidly to the background gas temperature) are generally
tures, typical of classical radio galaxies. The gas in the “lobes”       more visible only around the most recent jets;
is denser and hotter than in the rest of the cocoon; Cielo et al.      – the jet-inflated bubbles, ranging from a few × 107 to ∼ 2 ×
(2014) name this the lobe phase. The jets then switch off: the           108 K (the younger, the hotter);
bow-shocks lose their drive and slow down, first becoming tran-        – the latest jet beams/Hot Spots, as hot as a few × 1010 K,
sonic and eventually subsonic, while the lobe gas detaches from          depending on the jet age.
the centre, forming hot low-density bubbles.                              The temperature of the cavity gas shown in the three-
     The rising bubbles retain their inner velocity structure, a      dimensional (3D) renderings is a much more reliable proxy of
vortex-ring-like bubble-wide circulation, as expected for light,      their age than their volume or their projected distance from the
supersonic jets (see Guo 2015). The motion of the bubble-ICM          cluster centre. In the presence of multiple bubbles, the combi-
boundary due to vortices inside the bubbles and the backflow          nation of projection effects and unknown relative orientations of
of the ICM around the bubble excite sound waves (Sternberg            the jets that gave rise to them makes age estimates based on vol-
& Soker 2009). As the bubbles ascend and move into regions            ume and distance highly uncertain.
where the ambient gas pressure is lower, they expand and cool.            Admittedly, there are instances where young jet material
Adiabatic cooling dominates over radiative cooling because of         ends up in old bubbles. However, even in this case, it is possi-
the bubble’s low density.                                             ble to discern plasma of different temperatures within the cavity
     The second and subsequent generations of jets that follow        and consequently, a qualitative relation between the age of the
propagate through an already perturbed ICM, so their evolution        plasma and its temperature (or energy, should the emission be
is strongly impacted by encounters with structures generated by       non-thermal, as in the case of pure synchrotron) holds. Radio or
earlier jets. For example, AGN jets possess high velocities but       hard X-ray observations (see Sect. 5) ought to be able to effec-
low inertia: dense older bow-shock fronts can act like walls, de-     tively constrain the re-orientation history.
flecting the jet beams and exciting oblique shocks or “ripples”
in dense regions of the surrounding gas; channels and cavities        Synthetic X-ray maps. The middle panel of each figure
carved by previous jets act as low-resistance conduits for subse-     presents synthetic soft-X-ray observations, in which jets and
quent jet flows.                                                      bubbles appear as voids, providing a view complementary to the
                                                                      temperature. In order to make these images as realistic as possi-
                                                                      ble, we generate them by processing our simulation output with
3.2. Method: physical properties of the gas versus X-ray              the pyXSYM software (based on the work by Biffi et al. 2013).
     maps                                                             The software computes thermal and line emission from the hot
                                                                      gas in the X-ray band, then it generates and propagates the cor-
Figures 1 to 4 show three different panels for a single snapshot
                                                                      responding individual photons through the simulation domain.
of each jetted run, presented from the least to the most isotropic
                                                                      The projection is along the X-axis.
jet distribution, that is, 0000, 0030, 2030 and 0090.
                                                                           For these maps, we choose an X-ray band of [0.5, 7.0] keV,
     By comparing those figures, we observe the different pre-        then set all the sources at redshift z = 0.02 and collect the pho-
dictions for location, visual aspect, and physical state of the hot   tons for 1 Ms from a 6000 cm2 telescope area. These values are
bubbles in the cluster’s gaseous halo. All images still present a     chosen to match the specifics of a realistic observation with the
very high degree of central symmetry; this is due to the absence      Chandra telescope, except for the telescope area, which for our
of substructure or asymmetry in our initial halo, or the absence of   mock observations is about ten times larger than the one of the
a central galaxy (since a central clumpy ISM may induce asym-         ACIS-I detector on Chandra. Typical background counts (about
metry in radio jets, as shown by Gaibler et al. 2010). This is        0.76 photons/cm2 /second) are added, but turn out to comprise
not necessarily true in real CCC cavities, nonetheless most of        less than 1% of the total signal. Galactic absorption is also in-
the complex features we observe in our figures can be directly        cluded with a Tuebingen-Boulder model (see Wilms et al. 2000).
compared with the observations and are indicative of the vari-        The generated photons are then collected on the simulated de-
ous physical jet-jet and jet-ICM interactions taking place in the     tector; spectra and images can be obtained at this stage. Once
central few hundred kiloparsecs. On scales of a few megaparces,       we obtain the raw images, we apply a standard unsharp mask
cosmological accretion as well as the interaction of the ICM with     filter, as is sometimes done in the literature, to emphasize struc-
infalling substructure can give rise to shocks and pressure waves     ture of a specific size; this filtering operation is not included in
(see, e.g. Poole et al. 2006; Storm et al. 2015) but these can be     pyXSIM. The filter does not preserve the photon count in each
easily distinguished from features originated by AGN feedback.        spaxel; however, here we are mostly concerned with the visibil-
     In the following, we describe the content of each panel in       ity and appearance of the cavities rather than flux measurements.
Figs. 1-4, from top to bottom.                                        In these initial X-ray images, we do not simulate any specific
                                                                      detector response, but just collect all generated photons. As a
                                                                      by-product, the image retains some visual imprint of the origi-
Three-dimensional rendering of the gas temperature ob-                nal grid. All images have a rather bright core and a consequently
tained with a ray-casting technique. The line of sight is along       reduced contrast in the peripheral regions, due a to high central
the X-axis. The X-ray gas background has been made transpar-          cooling luminosity (as in run 0000) or to the latest bow-shocks
ent (as indicated by the opacity annotation next to the colour key    (as in 0090). The youngest bubbles are distinguishable most of
in each plot) in order to highlight jets and cavities. From coldest   the time, although they can sometimes be concealed by older
to hottest, we can recognise:                                         bubbles or outshone by a bright bow-shock.

                                                                                                               Article number, page 5 of 23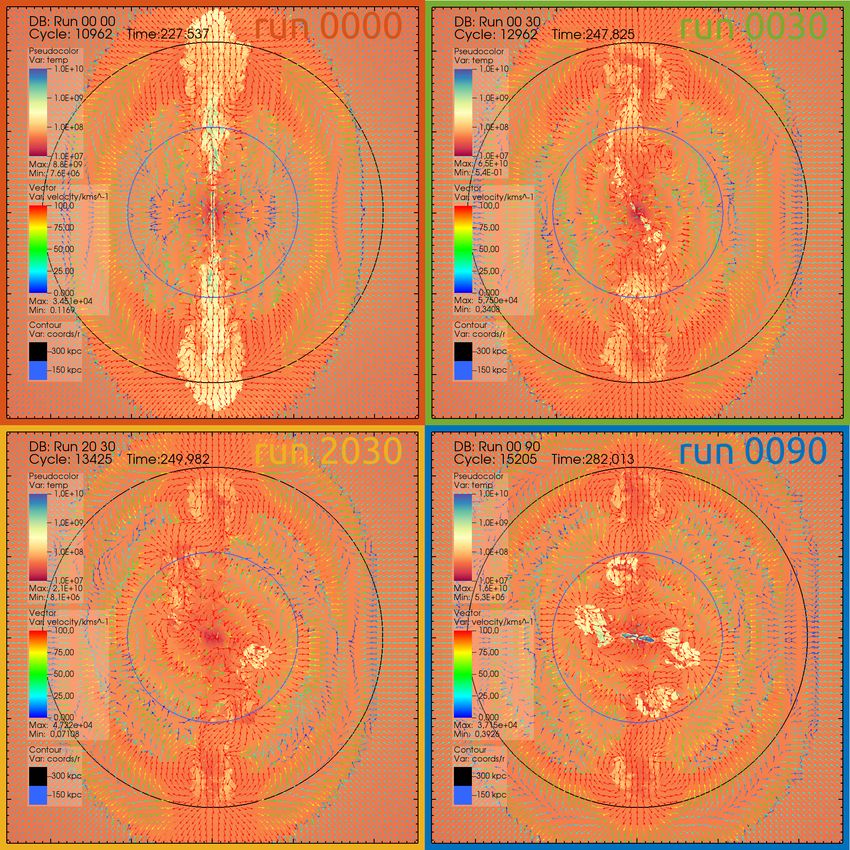
A&A proofs: manuscript no. 32582corr
Pressure slices. Finally, in the bottom panels of Figs. 1 to 4
we show central plane slices of the gas pressure (expressed in
internal units in order to avoid numerical rounding errors; our
unit corresponds to about 3.9 × 10⁻¹⁵ Pascal). While the first two R1
panels are projections along the x direction, these slices are con-
tained in the plane x = 0, the viewing direction being y this time,
in order to provide a different point of view. Only the structure in
the central plane (in which the first two jet beams lie) are visible.
The gas pressure clearly shows the waves and shocks that leave
imprints in the X-ray gas and allow us to track their origin2 . The
full time-evolution movies of the pressure slices, provided as ad-
ditional material to this paper, are very instructive in this respect.
Labels. To facilitate discussion to follow, the various structures
in the panels in each of the figures are annotated and labelled. We
use the letters “B”, “C” and “R” to denote bow-shocks, cavities C1
(both lobes and bubbles) and ripples, respectively. By “ripples”,
we are referring to those complexes of weak shock fronts ap-
pearing in some of our X-ray maps, mostly near the core and in
the vicinity of the youngest bow-shocks. All recognised features
are numbered sequentially from oldest to youngest; features as-
sociated with the same jet event, based on our analysis of the
time-evolution movie, are assigned the same number. The num- R1
bers do not necessarily refer to the jet numbers listed in Table 1,
as we only label what is visible in the last panel, meaning that
some jets may be skipped. Bilaterally symmetric structures are
only labelled on one side.
4. Results: physics of cavities and their appearance
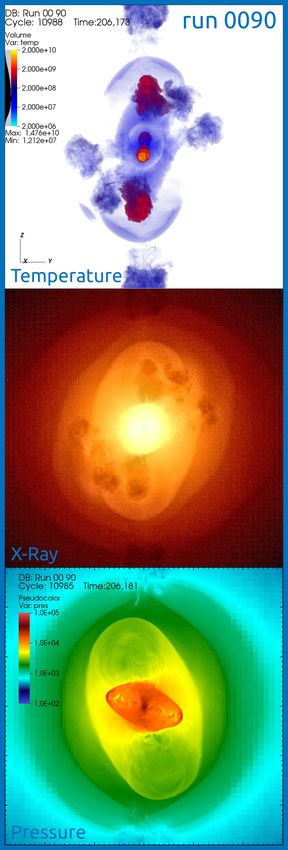
4.1. Run 0000
Run 0000 is shown in Fig. 1. Here all jets keep inflating the
same cavity (labelled as C1): the 2 Myr interval between two C1
successive jet events is sufficiently short that there is not enough
time for the channel carved out by the first jet to collapse, and
all following jets follow this path of low resistance towards C1.
The latter keeps moving further away from the centre and grows
larger but never completely detaches from the centre to form a
proper bubble because the channel is repeatedly refreshed by
a new jet beam. These connections are visible in the X-ray as B1
rather large jet “chimneys” around the jet beams. R1
Most of the energy of the jets reaches C1, yet in the chim-
neys, several weak shocks take place. These include both self-
collimation shocks of the beam, and internal reflections of the
latter on the chimney walls. These shocks leave ripples in the X-
ray gas, such as the ones marked as R3 and R4. In other words: R3 R4
a fresh jet encounters a dense medium, the chimney walls, with
almost-zero attack angle, so the new beam gets almost totally re-
flected. The ripples are the only energy transmitted to the outer
medium. These perturbations are the main visible difference be-
tween a continuous and a pulsating beam. They propagate side-
ways, but weaken and fade in time, so their presence can be asso-
ciated with a specific recent jet. Another ripple structure occurs
close to the boundary of the cavity, interior to the B1 bow-shock.
These ripples are excited by repeated inflation of the cavity by
successive generation of jets, starting with the first one. C1
The most peculiar aspect of run 0000 is the very large size of
the bubble and its corresponding large-scale (∼ 200 − 300 kpc)
bow-shock, B1. In many ways, the complex jet/giant cavity/bow-
Fig. 1. Run 0000: 3D temperature, focusing on cool core and jet mate-
2 rial, line of sight parallel to the x-axis (top); X-ray, projection along the
However additional work is required to distinguish weak shocks from
x-axis (centre), pressure slice in the x = 0 plane (bottom). Size: 400 kpc,
pressure waves, as we will show in paper II.
linear scale. Labels mark cavities (C), bow-shocks (B) and ripples (R),
numbered from oldest to youngest. See text and associated movie.
Article number, page 6 of 23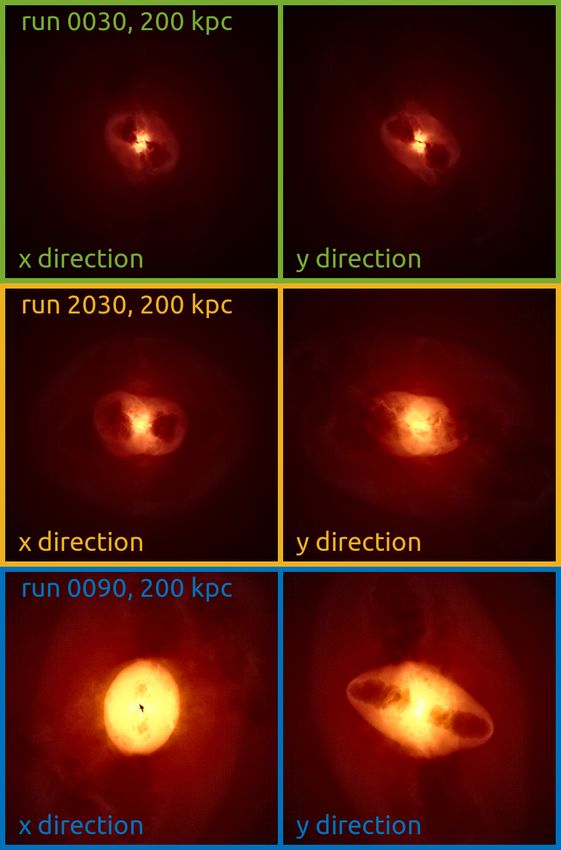
S. Cielo, A. Babul, V. Antonuccio-Delogu, J. Silk and M. Volonteri: Feedback from reorienting AGN jets

shock resembles those of galaxy clusters Hydra A3 (Nulsen et al.
2005; Wise et al. 2007) and MS0735.6+74214 (McNamara et al.
2005, 2009). We see from the temperature panel that run 0000
is the one in which we can observe jet material the farthest from
the AGN (beyond the 200 kpc region shown here), given the
ease with which it propagates within the old cavity, dispersing
all over its volume. In summary, this model predicts emission
from plasmas of different ages from one very large bubble.

4.2. Run 0030                                                                                                  C6
In run 0030 (see Fig. 2), one can distinguish individual bubbles,
but those are still part of a connected structure originating from
the first jet axis, and appear as short thick branches of a main                                            C5
trunk. As a consequence, a significant fraction of the energy still                                                B5
flows through the first carved chimney. Proof of this is the main
bow-shock, B1, almost as large as in run 0000.                                                           C3-C4
     Of all the features, the brightest is the core + B6 complex;
the cavities C6 and C5 are also visible, and C5 shows an elon-
gated morphology. Quite often, two successive jets end up within                                           C1-C2          B1
the same cavity; therefore we observe the frequent formation of
composite bubbles, such as the features labelled as C1-C2 and
C3-C4.
     Finally, we note that the conical structure of interconnected
cavities that emerges in run 0030 is a generic feature of configu-
rations where the jets generally change direction by small angles,                                           R4
regardless of the physical process responsible. Composite cavity
structure appears, for example, in the jet simulations of Mendy-
gral et al. (2012), in which the bulk flows in the ICM cause the                                               R6
jets to deflect by small angles, as well as in simulations of Yang                                    B6
& Reynolds (2016), in which intermittent jets precess about a                                               C6
fixed axis. In both of these cases, the jets either end up intersect-                                               R5
ing and pushing into, or newly forming cavities end up breaking                                               C5
through and expanding into, pre-existing cavities excavated dur-                                                   B5
ing earlier jet cycles.
     In terms of temperature, we can observe two populations of                                          C3-C4
plasma of different ages, and only the most recent bubbles con-
tain young jet plasma. The bleeding of one cavity into another
impacts their size evolution, which in turn will play havoc with
the power estimations based on this measure. The external shape
of older cavities in X-ray matches rather well the correspond-
ing shapes in the temperature view, but provides no information
about its internal structure. Overall, the X-ray map of this run
resembles the numerous X-ray images of real galaxy groups and
clusters that show a single pair of prominent cavities (c.f. Abell
25975 ; McNamara et al. 2001).
     All cavities form secondary bow-shocks, but these are
weaker and fainter than the one associated with the very first
jet, as some of the energy of the subsequent jets tends to flow
along the first jet channel; of all the bow-shocks, only B6 (the
                                                                                                      B6      R6
youngest one) and, partially, B5 are visible in the X-ray image                                                          R5
(they are both clearly visible in the pressure slice as well).
     The youngest jet beam shows clear signs of deflection (in                                                  C5 B5
temperature): a bright hot spot and a “plume” shape, where the
post-shock beam is deflected into the nearest C5 lobe. Plume-
like structures like this one can induce significant (asymmetric)                                          C3-C4
backflows, as observed, for instance, in X-shaped radio galaxies
(e.g. Roberts et al. 2015). The beam deflection is also responsible
for exciting ripple features (R5 and R6).                                                                  C1-C2            B1
3
    see http://chandra.harvard.edu/photo/1999/0087/more/
    0087_comp_lg.jpg                                                    Fig. 2. As in Fig. 1, but for run 0030. We note how cavities are grouped
4                                                                       together, as often two or more jets end up inflating the same bubble. See
    see http://chandra.harvard.edu/photo/2006/ms0735/
5                                                                       text and associated movie.
    http://chandra.harvard.edu/photo/2015/a2597/

                                                                                                                    Article number, page 7 of 23
A&A proofs: manuscript no. 32582corr
4.3. Run 2030
C1
The first jet axis in run 2030 (Fig. 3) is, as in runs 0000 and 0030,
clearly visible as a rising chimney of hot gas in both temperature
and X-ray emission even after 250 Myr; however, unlike the pre- C2
vious runs, the up-down channels are weaker and fading because
they have not been reinforced by subsequent jet flows. C3
The hot bubbles in run 2030 are also much more spatially
spread out than in the previous two runs. The spatial distribution C4
of cavities C1 to C4 in the X-ray and temperature maps may, at
first glance, suggest that these cavities too are simply branches of C6
a main trunk, but this is a projection effect, as confirmed by ob- C5
serving from a different direction (c.f. the pressure map). In fact, B5
physically connected, composite cavities are no longer present,
and all the bubbles can be individually identified and easily la-
belled, especially in the temperature view.
The fact that the cavities are fully detached means that most
of the energy of each jet is spent creating and inflating new bub-
bles closer to the halo centre, rather than inflating old, far-away
cavities. Therefore, jets and young bubbles continuously drive
shocks near the core, keeping its internal energy higher. The
bubbles also spend more time within the innermost 100 kpc (as
C4, C5 and C6 in the shown snapshot) and are distributed over
a rather large solid angle, reducing the space available for the
formation of cooling flows. An intuitive explanation of why the C2
bubbles are now detached from each other can be found by com-
paring this run with the 0000 case: the hot lobes formed by fixed- C3
axis jets define a (bi)conical region of jet influence (in agree-
ment with previous numerical works), whose half-opening angle C4
is roughly 15 degrees. In run 2030, the re-orientation angle is al-
ways forced to be larger than this value. Consequently, the new C6 B6
jets do not interact with the pre-existing channels and bubbles, C5
and instead pierce the surrounding ISM/CGM along a new di- B5
rection. The absence of ripple-like features further confirms this
hypothesis, as ripples typically arise from interactions between B3 B2
the jet flows and the walls of previously formed channels and
cavities.
The three youngest cavities (C4 to C6 in Fig. 3) show a
clearly higher plasma temperature, above 2 × 10⁸ K, and are also
the most visible in X-ray view (despite C4 being partially hidden
by the brighter B5). Given that the cavities are physically dis-
tinct, one would expect that in this scenario the size and shape C1
of the cavities can be straightforwardly extracted from the X-ray
observations. However, since most of the structure is concen-
trated in the central 100 kpc, projection overlaps are likely (e.g.
C2
C4 and B5 in the X-ray map, or C5 and C6 in the X-ray and B2
temperature maps).
The bow-shocks (or their slowed-down remnants) are de- C3 B3
tectable for longer than 100 Myr in both the X-ray and pressure B5
maps as rather bright, sharp, clean fronts, except where they in-
C4
B6
teract with pre-existing bubbles. One can distinguish almost all
of them, from B2 to B6 (B4 is not visible in this particular snap-
shot due to its overlap with the B3 feature, but it is clear at earlier
times). The high brightness of the bow-shocks may however af-
fect the measurements of the gas profile, and therefore have to be
subtracted carefully from the image; but this is usually not an is-
sue if multi-wavelength X-ray data are available (e.g. Churazov
et al. 2016).
The images generated from run 2030 have a number of sim-
ilarities with deep Chandra X-ray observations of the cores of
Perseus6,7 by Fabian et al. (2000) and Fabian et al. (2011), NGC
6 Fig. 3. As in Fig. 1, but for run 2030. This time bow-shocks and cavities
http://chandra.harvard.edu/photo/2000/perseus/more.
are mostly distinct from one another, but subject to projection effects.
html
7 See text and associated movie.
http://chandra.si.edu/photo/2005/perseus/
Article number, page 8 of 23S. Cielo, A. Babul, V. Antonuccio-Delogu, J. Silk and M. Volonteri: Feedback from reorienting AGN jets
58138 by Randall et al. (2015), and especially M879,10 by For-
man et al. (2005, 2017). The deep X-ray image of the M87 re-
veals a series of loops and cavities that are thought to have been C1
produced by a series of outbursts by a swivelling jet.
Finally, we point out that the pressure map for run 2030
shows good qualitative agreement with pressure disturbances C4 C3
seen in Perseus Fabian et al. (2011).
4.4. Run 0090 C2
The bubbles in run 0090 (Fig. 4) are clearly detached and C5
evolve almost completely independently; each jet creates its own
bow-shock, and undergoes all evolutionary stages for single jet
events described in Sect. 3.1, virtually never interacting with pre-
existing cavities. This is most clearly seen in the temperature
and pressure views while in the X-ray, projection uncertainties B4
are still significant, so some cavities appear joined together (e.g.
the C3 and C4 features – and possibly C2 – can be mistaken
for a single large bubble). The complex network of overlapping
shocks and cavities makes it very difficult to unambiguously es-
tablish the bubbles’ ordering and energy unless additional in- C1
formation is available (e.g. temperature). Moreover, there is a
separate indication that the size of the cavities in the X-ray view B1
may not be accurate: in the pressure slice, the cavity is much
more extended than in the X-ray view. This suggests that only
the highest-contrast, central regions of the cavities stand out in C4 C3
the X-ray images (but recall that the viewing direction is differ- B2-B3
ent between X-ray and pressure).
C2
Overall, the X-ray image is similar to the 2030 case, with
well-defined bow-shock fronts as well as easily identifiable ghost B5
cavities and nested cocoons, showing realistic positions and mor-
phologies. The very bright centre in the X-ray map is due to the
cocoon/bow shock of bubble being inflated by a jet aligned close B4
to the line of sight, so that the hot spot points almost towards the
observer.
In X-ray, most of the bubbles (except the young C4 and C5,
which still retain their elongated lobe shape) are roughly spher-
ical. The inner structure of the cavity is visible only in temper-
ature; a further indication that the shape of the cavities in the
X-ray is not necessarily a good indicator of the physical nature C1
of the cavity. Even vortex-ring-like structures may appear almost
spherical in X-ray images.
The pressure panel provides a good view of the youngest jet B1
beam (within C5), with visible individual recollimation shocks C4
and terminal hot spots. This shows that shocks and jets are still
effectively moving X-ray gas away from the central 100 kpc, and
with a solid angle coverage of almost 4π.
The large angle misalignment between the young jet beam C5
and C4 cavities seen in the pressure panel closely resembles the
B5
jet and cavity structure seen in galaxy cluster RBS 79711 . Gitti
et al. (2006b) and Doria et al. (2012) interpret the combination
of radio and X-ray data as suggesting that over the course of the B4
three identified outbursts, the jet axis appears to have changed B2-B3
direction by ∼ 90◦ between outbursts.
8
http://chandra.harvard.edu/photo/2015/ngc5813/
9
http://chandra.harvard.edu/photo/2006/m87/
10 Fig. 4. As in Fig. 1, but for run 0090. This time, the bow-shocks are the
http://chandra.harvard.edu/photo/2008/m87/m87_xray.
brightest features, and one can see many cavities around the distance
jpg
11 (projected) of 100 kpc. See text and associated movie.
http://www.evlbi.org/gallery/RBS797.png
Article number, page 9 of 23A&A proofs: manuscript no. 32582corr
5. Zoom-in X-ray and projection effects We can also observe many features of the jet beams: in run
0000, the beams of the youngest jet and its recollimation shocks
We now present some more detailed X-ray views of the cluster are the brightest features, standing out for about 50 kpc in both
core, which also exemplify the projection effect-related uncer- directions. The recollimation shocks appear brighter than the ter-
tainties in that crowded region. In Fig. 5, we show two different minal shocks, similar to what was recently observed by Clautice
projections side by side, from the x (left) and y (right) direction, et al. (2016) in the (rather favourable) case of 3C 111. Run 0030
for each simulation run except the trivial case of 0000, where is offering perhaps the most interesting insight on the jet kine-
very little structure is present in the inner 200 kpc. The pictures matics, as the beam is clearly seen to bend at the hot spots in a
are identical in all other respects. Labels are put next to each centrally symmetric S-shape. The bend resembles the prominent
feature, to facilitate direct comparison with Figs. 1 to 4. feature seen in the VLA image of M8712 by Owen et al. (2000).
Each panel shows a zoom-in X-ray image of the central The brightest spots are usually the post-shock region immedi-
200 kpc. This time, we use pyXSIM to simulate the ACIS-I de- ately after the terminal parts of the jet beams, offset by a few
tector (response, point spread function, field of view) on board kiloparsec with respect to the jet itself. Run 2030 shows only
the Chandra X-ray telescope. As a side-effect of this operation, one bright HS inside its B6, plus hints of fine ripples and small
the photon counts are now overall lower, but the imprint of the shocks as observed in Fig. 5, but no clear jet beam. Finally, run
simulation grid pattern is lost. The zoom-in also reveals some 0090 has one central HS, indicative of a likely FR I morphology,
more details on the core and the innermost cavity structure; for and again a clearly bright B6, all with photon counts in the hun-
example, in all images, the B5 and B6 features show structure in dreds, but otherwise relatively featureless. In this view, the cav-
their shock fronts. Most of the earlier generation of cavities are ities are not outshone by the youngest bow-shock B6, providing
now mostly invisible. a better view than the soft X-ray. In other words, the soft and
In run 0030, the differences between x and y are minimal hard X-ray bands have the potential to provide useful comple-
(e.g. C5 and C6 are roughly in the same places), as the latest two mentary perspectives that can help disentangle the complicated
jets have similar inclination with respect to the x and y axis. This shock-cavity structures.
is expected, as moderate re-orientation always produces struc- Comparing the 400 and the 200 kpc views, we conclude
ture aligned with the z axis, and both views have the same orien- that a nearby cluster offering a higher resolution view of its
tation with respect to that. core presents some notable advantages, mainly regarding the
youngest cavities. In the soft X-rays, a well-resolved centre can
In the 2030 and 0090 cases, there is no clear axisymmetry,
reveal a fine-structure of weak shocks and ripples at the bound-
so in some projections, smaller bubbles blend into the already
aries of the youngest lobes indicative of its supersonic phase of
dark background of the older ones. In run 2030, for example, C5
expansion. In the 0000 case, very little structure is present in
and C6 appear distinct in the x projection (separated by B6), but
the inner 200 kpc. Imaging of the cavities outside 200 kpc can
largely overlap in the y projection. B6 is still visible as it is a
benefit from higher photon counts, but this tells little about the
young and bright feature, but it is difficult to straightforwardly
stability of the cool core. By looking at the core with high spatial
associate this feature with its corresponding bubble. If the over-
resolution in hard X-ray, one can most importantly see details of
lap is only partial, compound cavities may appear as single, ir-
the jet kinematics inaccessible at lower frequencies, and can pin-
regular cavities (e.g. C5 and C6 in run 2030/y projection, and C3
point where the shocks occur, not necessarily aligned with the jet
and C4 in run 0090/y projection).
beams. Also, young lobes are more visible through the bright co-
Young bubbles can also be outshone by the high brightness coons, therefore their size can be measured with smaller uncer-
of their own bow-shock, if the line of sight is close enough to tainties. Since the cluster is fainter in hard X-ray, actual counts
that jet’s axis (as in run 0090, where B5 almost completely hides can be quite low (a few or a few tens of counts per spaxel) even
C5 in the x projection). In the latter case, only a tiny portion of with the most recent instruments such as NuSTAR (e.g. (Wik
the cavity can be identified, so its volume and shape can not be et al. 2014)); a nearby object is therefore mandatory.
used to infer jet properties, especially with a lower-quality image
such as the one in Fig. 4.
We also highlight the relationship between the degree of jet 6. Cavity properties and energetics
re-orientation and the brightness of the core: the greater the re- In this section, we quantitatively analyse the effects of jets and
orientation, the brighter the core. The core brightness is an in- bubbles on the energy balance of our model ICM. In order to
dicator of shocks and hot, shocked gas. As we have noted pre- compute the energy of the cavities, we isolate them in the 3D
viously, moderate-to-strongly re-orientating jets tend to inflate simulation grid, and evaluate their volume, pressure, and veloc-
cavities that are more localised to the cluster core (the labels in ity over time. The cavities are, by definition, hotter than soft X-
the panels for runs 2030 and 0090 reach lower numbers), and ray gas; we therefore select them using a threshold in the gas
hence, this is also where the shocks associated with the inflat- temperature T > 8 keV. We refer to this selection using the sub-
ing cavities appear. The net result is more efficient heating of the script H, for “Hot”, opposed to X, for “X-ray gas”. The selec-
core gas, which has deep implications for the halo stability, as tion corresponds to the gas highlighted in the temperature ren-
we show in Sect. 7. dering of Figs. 1 to 4, but excluding the bow-shocks and the
Figure 6 shows a view in a harder X-ray band, [10, 30] keV, low-temperature core region.
of the same central 200 kpc, from the x direction. The images
are generated with the same aperture/exposure parameters, this
time just collecting all generated photons; we do not apply the 6.1. Cavity volume
unsharp-mask filter but show the actual photon counts instead. The first important issue that we explore is the volume of the hot
All objects are rather fainter in this band, with counts of about cavities (hereafter, referred to as VH ), the evolution of which is
100 in the brightest pixels, as opposed to several thousand in the shown, in units of 105 kpc3 , in Fig. 7. We emphasise that the plot
soft X-ray. Shocks and hot spots are now more clearly visible,
12
except in run 0000. http://images.nrao.edu/57
Article number, page 10 of 23S. Cielo, A. Babul, V. Antonuccio-Delogu, J. Silk and M. Volonteri: Feedback from reorienting AGN jets
R6 R6
B6 B6
C6 C6
C5
C4
B5
B6 B6
C6
C5-C6
C5
B5
C4-B4
B2-B3 C4 C3 B4 C3-C4
C5 C2 B5
C5 Fig. 5. Synthetic X-ray observations, similar to
the ones appearing in Figs. 2 (run 0030) to 4
B5 (run 0090), but zooming into the innermost 200
kpc and simulating the ACIS-I detector. Projec-
tions are along the x (left column) and y axes
B4 (right column). The labels match the ones in
Figs. 2 to 4, for direct comparison. We note
the increased details at the cavity boundary and
how the different perspective changes the ap-
parent volume of the cavities.
shows the actual total volume occupied by all the cavities within the X-ray gas is lower, enabling the cavities to expand to a larger
the simulation volume. The results indicate that jet re-orientation size than they would have had they remained closer to the clus-
results in a large difference in VH but in terms of the heating of ter centre. As we have noted previously, this configuration may
the ICM, it is not this spread in VH that is important. Rather, it offer an explanation for the gigantic bubbles and cocoon shock
is the underlying reason for the spread. We noted this in Sect. observed in Hydra A (Nulsen et al. 2005; Wise et al. 2007) and
5, touch upon it again below, and return to it in Sects. 6.2 and MS0735.6+7421 (McNamara et al. 2005, 2009).
7, where we discuss the implications for the heating of the ICM At the opposite end, VH in runs 2030 and 0090, the two
globally and within the cool core. with the most isotropic jet/bubble distribution, peaks at a much
After the first jet, identical in all runs, a clear trend appears: smaller value of about 4.5 × 10⁵ kpc3 around 200 Myr, then satu-
as the orientation of the jets becomes more isotropic, the total rates at that point (0090) or even decreases slightly (2030) due to
volume occupied by the cavities declines. The two single cavi- cooling and turbulent mixing with the ambient X-ray gas (no hot
ties inflated in run 0000 are by far the largest. This is partly be- gas has left the simulation box at this point). The reduced size
cause all of the jets pump energy into the same cavity and partly of the cavity volume is directly the result of all the jets primar-
because the thrust from all the jets has pushed the cavities fur- ily inflating detached cavities within the cluster core. The sizes
ther away from the halo centre, where the external pressure of of these cavities is constrained by the high ambient pressure in
Article number, page 11 of 23You can also read