X-ray Spectroscopy of Galaxy Clusters Studying astrophysical processes in the largest celestial laboratories
←
→
Page content transcription
If your browser does not render page correctly, please read the page content below
Noname manuscript No.
                                               (will be inserted by the editor)

                                              X-ray Spectroscopy of Galaxy Clusters
                                              Studying astrophysical processes in the largest celestial laboratories

                                              Hans Böhringer · Norbert Werner
arXiv:0907.4277v1 [astro-ph.CO] 24 Jul 2009

                                              Received: date / Accepted: date

                                              Abstract Galaxy clusters, the largest clearly defined objects in our Universe, are ideal lab-
                                              oratories to study in detail the cosmic evolution of the intergalactic intracluster medium
                                              (ICM) and the cluster galaxy population. For the ICM, which is heated to X-ray radiating
                                              temperatures, X-ray spectroscopy is the most important tool to obtain insight into the struc-
                                              ture and astrophysics of galaxy clusters. The ICM is also the hottest plasma that can be well
                                              studied under thermal equilibrium conditions.
                                                  In this review we recall the basic principles of the interpretation of X-ray spectra from
                                              a hot, tenuous plasma and we illustrate the wide range of scientific applications of X-ray
                                              spectroscopy. The determination of galaxy cluster masses, the most important prerequisite
                                              for using clusters in cosmological studies, rest crucially on a precise spectroscopic determi-
                                              nation of the ICM temperature distribution. The study of the thermal structure of the ICM
                                              provides a very interesting fossil record of the energy release during galaxy formation and
                                              evolution, giving important constraints on galaxy formation models. The temperature and
                                              pressure distribution of the ICM gives us important insight into the process of galaxy clus-
                                              ter merging and the dissipation of the merger energy in form of turbulent motion. Cooling
                                              cores in the centers of about half of the cluster population are interesting laboratories to
                                              investigate the interplay between gas cooling, star- and black hole formation and energy
                                              feedback, which is diagnosed by means of X-ray spectroscopy. The element abundances de-
                                              duced from X-ray spectra of the ICM provide a cosmic history record of the contribution of
                                              different supernovae to the nucleosynthesis of heavy elements and their spatial distribution
                                              partly reflects important transport processes in the ICM.

                                              H. Böhringer
                                              Max-Planck-Institut für extraterrestrische Physik
                                              D-85748 Garching, Germany
                                              Tel.: +49 89 30000 3347
                                              Fax: +49 89 30000 3569
                                              E-mail: hxb@mpe.mpg.de

                                              N. Werner
                                              Kavli Institute for Particle Astrophysics and Cosmology
                                              Stanford University
                                              452 Lomita Mall, Stanford, CA 94305, USA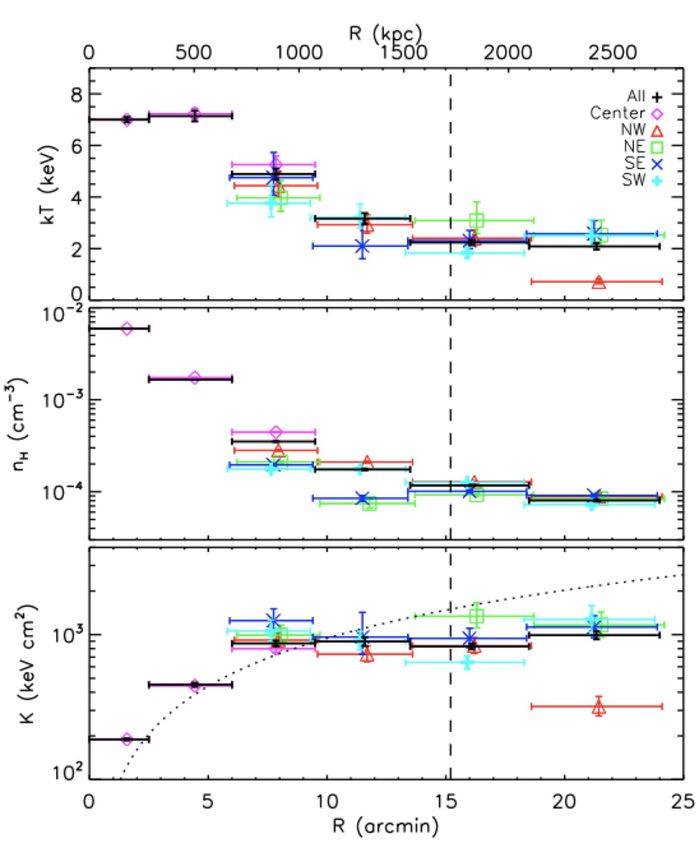
2

    Some discussion of plasma diagnostics for conditions out of thermal equilibrium and an
outlook on the future prospects of X-ray spectroscopic cluster studies complete our review.
Keywords X-ray astronomy, Galaxies:clusters of galaxies, Spectroscopy: X-rays

1 Introduction

Galaxy clusters are contrary to their name more than just a collection of galaxies. In the
1930s Fritz Zwicky (Zwicky 1937) discovered that it requires a large amount of unseen
matter to bind the fast moving galaxies in the Coma galaxy cluster into a long lasting ob-
ject. Today we have a clear cosmic scenario with galaxy clusters as an integral part of the
large-scale structure of the Universe. They are the largest matter aggregates within the large-
scale structure which have collapsed under their own gravity and are closely approaching
a dynamical equilibrium. Much theoretical effort has been spent to understand and char-
acterize this equilibrium structure. To the first order, galaxy clusters are now described as
Dark Matter Halos with a characteristic universal shape of the Dark Matter potential (e.g.
Navarro et al. 1995; Moore et al. 1999; Gao et al. 2008). Observations show indeed, that the
cluster population can be described as constituting a nearly self-similar family with similar
shapes of the matter distribution, where the small scatter is due to the different formation
histories and differently close approaches to the equilibrium configuration.
     Galaxy clusters are therefore very important giant astrophysical laboratories providing
us with a well characterized physical environment in which we can study many interesting
astrophysical phenomena and cosmic processes on giant scales (Sarazin 1986). They also al-
low us to study large coeval galaxy populations and enable us to investigate their evolution in
connection with the chemical and thermal evolution of the embedding intracluster medium
(ICM) (e.g. Dressler 1980; Dressler et al. 1997; Poggianti et al. 1999; Mei et al. 2006).
     As tracers of the cosmic large-scale structure they are also important probes for cosmol-
ogy. It is the growth of structure in the matter distribution of the Universe that has a strong
dependence on the cosmological model parameters and in particular on the nature of Dark
Matter and Dark Energy. Since galaxy clusters are very sensitive tracers of structure growth,
a census of the cluster population as a function of redshift can be used to test cosmologi-
cal models (e.g. Borgani et al. 2001; Schuecker et al. 2003a,b; Henry 2004; Vikhlinin et al.
2003, 2009; Henry et al. 2009).
     The current most important limitation in using galaxy cluster studies for cosmology
is the calibration of the relation between various observables and cluster mass. Therefore
a lot of effort is currently being spent to improve the cluster mass determination and the
understanding of cluster structure (e.g. Arnaud et al. 2007; Vikhlinin et al. 2006; Pratt et al.
2006, 2007). X-ray spectroscopy of the cluster emission plays a crucial technical role in
this effort to characterize cluster structure precisely, to model the cluster population as a
family of self-similar objects with explainable deviations, and to establish scaling relations
of global cluster parameters that allow to draw comprehensive statistical conclusions on
cluster properties from simple observables.
     Most of the detailed knowledge on galaxy clusters has been obtained in recent years
through X-ray astronomy. This is due to the fact that the intracluster medium (ICM) has
been heated to temperatures of tens of Millions of degrees (several keV per particle) which
causes the hot plasma to emit the bulk of the thermal energy in the regime of soft X-rays.
Since this is also the photon energy range where the well developed X-ray telescopes come
into play, galaxy clusters are among the most rewarding study objects for X-ray imaging and
3

             -5110.5
             5109.5

Fig. 1 The Coma cluster of galaxies as seen in X-rays in the ROSAT All-Sky Survey (underlaying red color)
and the optically visible galaxy distribution in the Palomar Sky Survey Image (galaxy and stellar images from
the digitized POSS plate superposed in grey).

spectro-imaging observations. Fig. 1 shows a composite image of the Coma galaxy cluster,
where an optical image from the Palomar Sky Survey showing the dense galaxy distribution
of the Coma cluster is superposed in grey scale on top of an X-ray image from the ROSAT
All-Sky Survey with X-ray brightness coded in red color. We clearly recognize that the X-
ray image displays the cluster as one connected entity. This illustrates the fact that galaxy
clusters are well defined, fundamental building blocks of our Universe.
     As largest cosmic objects they display several interesting astrophysical superlatives: (i)
the ICM is the hottest thermal equilibrium plasma that we can study in detail, with tempera-
tures up to two orders of magnitude larger than the temperature in the center of the sun, (ii)
the gravitational potential of clusters gives rise to the largest effect of light deflection with
deflection angles exceeding half an arcmin, producing the most spectacular gravitational
lensing effects (e.g. Hattori et al. 1999), (iii) the hot plasma cloud of the ICM casts the dark-
est shadows onto the cosmic microwave background through the Sunyaev-Zeldovich effect
(at wavelengths below about 1.4 mm they are seen as surface brightness enhancements)
(e.g. Birkinshaw 1999), and (iv) the merger of galaxy clusters produces the largest energy
release in the Universe after the big bang itself with energies up to orders of 1063 erg (e.g.
Feretti et al. 2002).
     X-ray observations and X-ray spectroscopy are the most important tools to obtain de-
tailed information on cluster properties and the processes occuring in their ICM as will be
illustrated in this article. In section 2 we will explain how observable X-ray spectra can
be understood and modeled. In section 3 we show how this spectral modeling is applied
4

Fig. 2 Thermal equilibrium ionization structure of the oxygen ion family as a function of plasma temperature
(Böhringer 1998).

to study the thermal structure of the ICM that also provides the tool for measuring cluster
masses. Section 4 deals with the diagnostics of the central regions of clusters where massive
cooling is prevented by AGN heating in those objects where the cooling time is short enough
for effective cooling. In section 5 we illustrate how the observed spectral lines can be used
for the chemical analysis of the ICM and what can be learned from these observations. In
section 6 we take a look into the physics of plasma under non-equilibrium ionization con-
ditions and in the last section, 7, we provide an outlook on the capabilities and potential of
X-ray instruments planned for the future.

2 X-ray Spectra of Hot Tenuous Plasma

The plasma of the ICM is very tenuous, with densities of 10−5 to 10−1 cm−3 from the clus-
ter outskirts to the densest regions of cool core clusters. This low plasma density makes
the cluster X-ray spectra modeling simple and enables a very straightforward interpretation.
Three fundamental emission processes involving electronic “transitions” contribute to the
radiation: free-free or bremsstrahlung radiation caused by the deflection of an electron at
close fly-by of an ion, free-bound or recombination radiation caused by the capture of an
electron by an ion following ionization, and bound-bound or deexcitation radiation of an
electron changing the quantum level in an ion. The first two processes give rise to contin-
uum radiation and the latter to line radiation. An exception in bound-bound transitions is the
radiative transition from the 2s to the 1s state, which is completely forbidden by angular mo-
mentum conservation, but can happen as very slow two-photon process. This “two-photon
radiation” involves a distribution function of the branching ratio of the energies of the two
electrons (Spitzer & Greenstein 1951) and thus gives rise to continuum radiation.
    We note that all these radiative processes depend on the collision (or close fly-by) of
an electron and an ion. Due to the very low density of the plasma all the ions excited by
collisions have sufficient time for radiative deexcitation before a second deexciting collision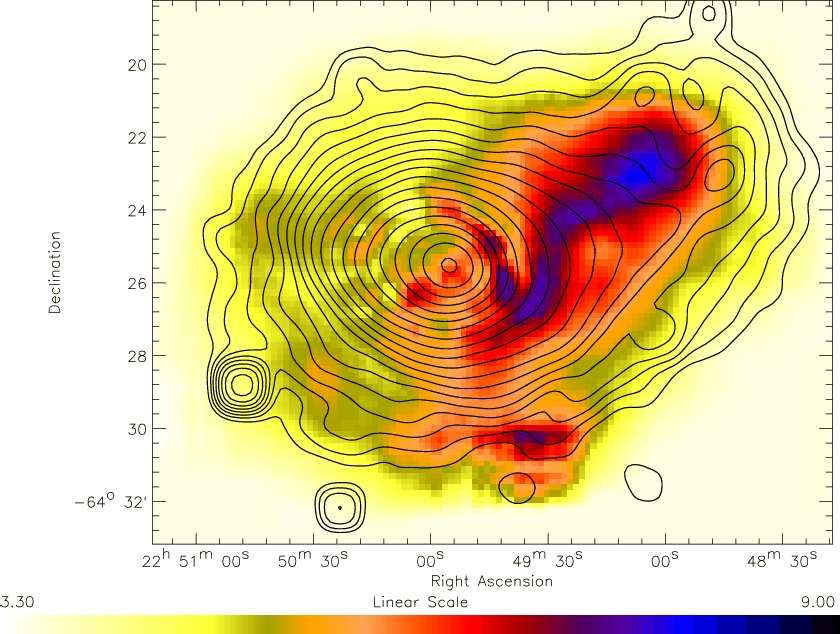
5

Fig. 3 Scheme of the calculation of the radiation spectrum and cooling function of a hot, tenuous plasma in
thermal equilibrium. The shaded boxes include the situation of non-equilibrium ionization (from Böhringer
1998).

occures. Thus contrary to laboratory plasmas, where slow transitions are “forbidden” and
the corresponding excited states are much more rapidly deexcited by electronic collision, all
“forbidden” transitions actually happen in the ICM plasma. This leads to a scenario where
all exciting, recombining, and bremsstrahlung causing collisions lead to the radiation of a
photon, which is referred to as the thin plasma radiation limit (or “coronal limit”, as similar
conditions prevail in the solar corona). The modeling of the thermal plasma spectrum is
therefore a book keeping exercise of all the electron ion collisions rates and – in the case
of several deexcitation channels – their branching ratios. These collision rates are in general
a function of temperature (for thermal plasma) and the outcome is directly proportional to
the electron density and the respective ion density. The shape of the resulting spectrum is
therefore a function of the temperature and chemical composition and its normalization is
directly proportional to the electron density and the ion density. The latter is true for the low
plasma density limit that pertains in the ICM.
     We further note that in general all photons so created leave the ICM plasma due to its
low density. An exception is discussed in section 5.5.3 for the strongest lines in dense cluster
cores. Thus no radiative transfer calculation is necessary for the interpretation of the X-ray
spectra of the ICM. This means in particular that the spectrum we observe from a galaxy
cluster provides an account of the entire ICM plasma, which is very different from e.g. the
spectra of stars, that provide information on merely a very thin skin on their surface. This is
another reason why cluster X-ray spectra are so informative and straightforward to interpret.
     As the radiation contribution specific to an ion species is proportional to the density of
this species in the plasma, the modeling of the overall spectrum also requires the knowledge
of the chemical composition of the plasma and its ionization structure. For thermal equilib-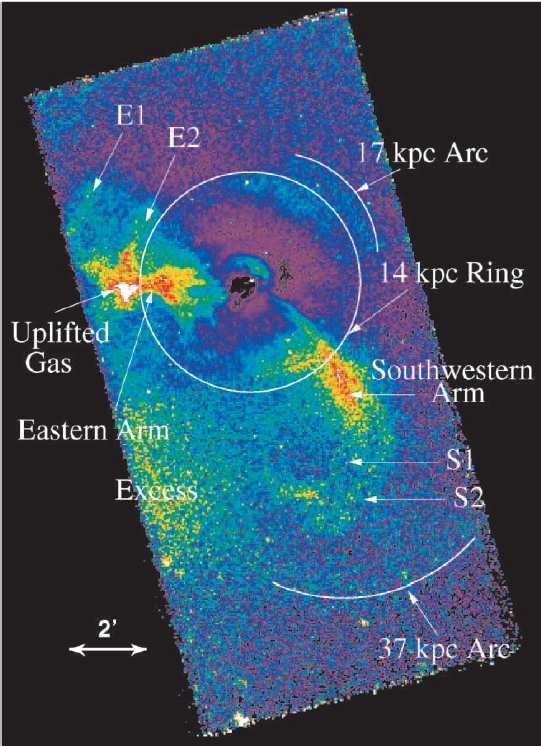
6

Fig. 4 Cooling coefficient of hot plasma as a function of the electron temperature from (Shapiro & Moore
1976). Two scenarios of the cooling of plasma from an initially hot phase of T ∼ 107 K are compared. In the
CIE (collisional ionization equilibrium) case the ionization structure is kept in full thermal equilibrium, in the
NIE (non-ionization equilibrium) case on the contrary, the ionization structure passively follows the cooling
plasma and recombination can lag behind the cooling. The latter implies higher ionization stages at the same
temperature, that is less shell electrons and reduced line cooling.

rium plasma, the ionization structure is characterized by the balance of the ionization and
recombination rates for all the ionization steps of an element:

                   [I n+ ]ne (C ci + C ai ) + [I n+ ] [H + ]Xce1 + [He+ , He++ ] Xce2

                                                                                                              (1)
                         (n+1)+                             (n+1)+
                  = [I            ]ne (C rr + C dr ) + [I            ] ([H]Xce3 + [He] Xce4 ) .

Several processes contribute to the ionization and recombination rate. The ionization com-
prises direct electron impact ionization, C ci , electron impact excitation into an auto-ionization
state with subsequent auto-ionization, C ai , and ionizing charge exchange with H + , He+ ,
and He++ with the rates Xce1 and Xce2 , respectively. Direct ionization is the dominant pro-
cess. Recombination rates include radiative recombination, C rr , dielectronic recombination,
C dr , and electron capture charge exchange with H and He,with the rates Xce3 and Xce4 . In
the dielectronic recombination process the recombination collision complex is energetically
stabilized by the excitation of a second bound electron which subsequently radiates the ex-
cess energy. This is a resonant process which exhibits a strong energy dependence which
is most important for ions with many electrons (e.g. Fe ions). The ionization structure is
calculated from the complete set of linear equations for all important ions and elements (e.g.
Arnaud & Rothenflug 1985; Arnaud et al. 1992; Mazzotta et al. 1998). Fig. 2 shows for ex-
ample the thermal equilibrium ionization structure of oxygen in the temperature range 104
to 108 K (Böhringer 1998).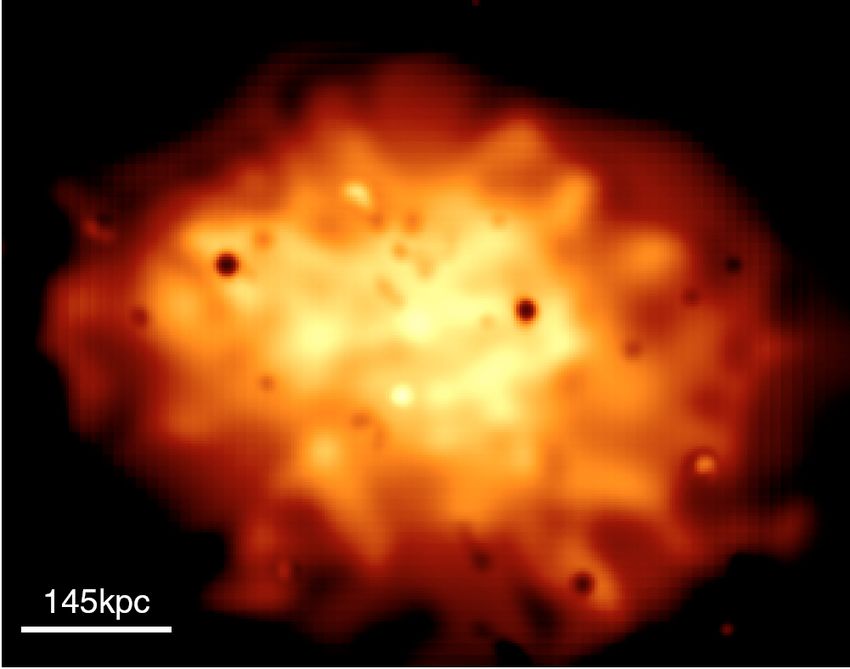
7

Fig. 5 Cooling rate of hot plasma as a function of the plasma temperature. The contribution to the cooling
by the ions of different important abundant elements is indicated (Böhringer & Hensler 1989). Most of this
contribution is in the form of line radiation, which is by far the dominant form of radiation in the temperature
range from about 104 to 2 × 10⁶ K. At higher temperatures over most of the regime of interest for the ICM
the Bremsstrahlung contribution dominates.

    The collision rates that lead to the emission of radiation are then all of the form:
                                               " #" #" #
                                                nI nE nH
                         R = ne nI C I x = n2e                C I x (T ),                                   (2)
                                                nE nH ne

where nE , nI , and nH are the number densities of the elements, ions, and hydrogen nuclei,  h i
respectively, and C I x are the relevant collision rate coefficients for ion I. Consequently, nnEI
                                                                hn i
represents the fractional abundance of ionization stage I, nHE the relative elemental abun-
            h i
dance, and nnHe the Hydrogen nuclei to electron ratio, which is about 1.2. Thus all rates
are proportional to the squared plasma density, n2e . The normalization of the spectrum is
therefore determined from the emission measure, E, given by:
                                                    Z
                                               E=       n2e dV.                                             (3)

 We note that this definition of emission measure is not unique. It conforms to most defi-
Rnitions in text books, but the major public plasma radiation codes use the definition E =
   ne nH dV. The strategy of calculating the radiation spectrum of hot, thin plasma in ther-
 mal equilibrium is thus summarized in Fig. 3. The notion of thermal equilibrium involves
 a thermal Maxwellian equilibrium of the electrons and the thermal ionization equilibrium
 of the ions. A deviation of the temperature of the electrons and the ions will not affect the
 components of the radiation spectrum, but will be detected through thermal line broadening.
8

     With a change of the temperature of the plasma the ionization structure is adjusted on
the time scale of the inverse ionization and recombination rates and thus lags behind the
temperature change. In certain cases this time lag is significant and has to be included in the
modeling, as sketched in Fig. 3 by explicitly following the time evolution of the ionization
structure. As an example, Fig. 4 shows the calculation of a passively cooling plasma starting
at high temperature (Shapiro & Moore 1976) where the instantaneous ionization equilibrium
assumption is compared to the full time dependent ionization structure calculations. We
see that strong deviations occur at temperatures of the order of 105 K, but no significant
deviation from the ionization equilibrium calculations are observed above 106 K, which is
the temperature range in clusters. So far no observed X-ray spectrum of the ICM has required
a non-ionization equilibrium treatment. Fig. 5 shows the contributions of continuum and line
emission and the respective contributions of the most important elements (assuming solar
abundances) to the total radiation power. The regime in which the recombination lags behind
cooling can easily be identified with the temperature range where line radiation from the
important, most abundant elements (particularly Fe) is strongly boosting the line cooling.
We note that continuum bremsstrahlung with a temperature dependence of roughly ∝ T 1/2
is the dominant radiation process at ICM temperatures.
     Early modeling of the emission spectrum of hot, thin plasma include: Cox & Tucker
(1969); Tucker & Koren (1971); Cox & Daltabuit (1971); Cox (1972); Shapiro & Moore
(1976, 1977); Kato (1976); Raymond & Smith (1977); Landini & Monsignori Fossi (1970,
1990); Landini & Fossi (1991); Gaetz & Salpeter (1983); Raymond (1988); Masai (1984);
Masai & Kato (1987); Böhringer & Hensler (1989); Schmutzler & Tscharnuter (1993); Sutherland & Dopita
(1993); Brickhouse et al. (1995); Raymond & Brickhouse (1996). Now the two most fre-
quently used plasma radiation codes are the MEKAL code (Gronenschild & Mewe 1978;
Mewe & Gronenschild 1981; Mewe et al. 1985; Mewe 1990, 1991; Kaastra & Mewe 1994;
Mewe et al. 1995) and the APEC code (Smith et al. 2001). While the older literature con-
tains all the necessary information about the radiation codes including all the details of the
rate calculations and much detail on the underlying physical processes, the modern codes
are too complex to be easily described in the literature. Thus, unfortunately very little doc-
umentation about the new development of the radiation codes is available in written form
after the mid 1990s.
     Fig. 6 shows typical spectra at temperatures of 105 , 106 , 107 , and 108 K with solar ele-
ment abundances, indicating the contribution by line radiation and the continuum emission
from bremsstrahlung, recombination and two-photon transitions. We clearly see the increas-
ing dominance of bremsstrahlung with increasing temperature, which reflects the fact that
fewer ions retain electrons and the plasma is almost completely ionized at the higher tem-
peratures.

3 The Study of the thermal structure of the intracluster medium

We have seen in the previous section that the shape of the spectrum for a thermal equilibrium
plasma is determined by the plasma temperature and the elemental abundances. This is
therefore the basic information we derive from the spectral analysis of the ICM radiation:
a temperature measurement and a chemical analysis. We consequently illustrate in this, and
the next chapter, the scientific insights gained from temperature measurements from the
state-of-the-art spectral analysis, and in section 5 the lessons learned from the chemical
analysis of the ICM.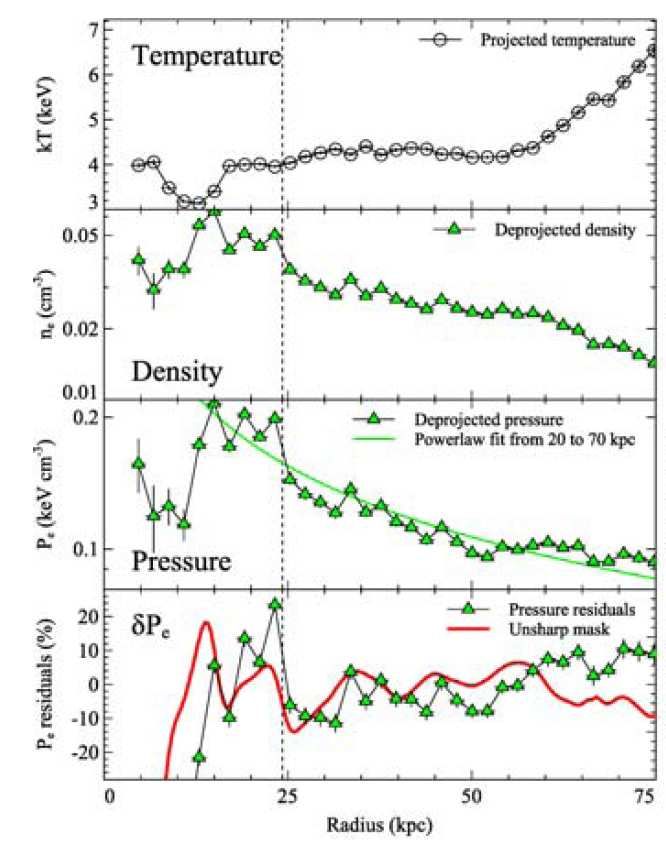
9

                                                                       105 K (8.6 eV)                                                                       106 K (86 eV)
arbitrary units

                                                                                         arbitrary units
                                                                                                                      rec

                                                                                                                                2ph          ff

                         10                 100                 1000             10000                           10                 100            1000              10000
                                             energy [eV]                                                                             energy [eV]

                  107 K (0.86 keV)          Fe                  Fe-L                                       108 K (8.6 keV)
                                                                                                                                                                     Fe
                                      Fe
                                                                   Mg Si
                                     XXIV
                                                                                                                                                   Fe, Ne    Si S
                                                                           S                                      H
                              Si                   Si-L C N O
                              XII                                                                                             Fe
                         H
                                                                                                                             XXIV
arbitrary units

                                                                                         arbitrary units

                         10                 100                 1000             10000                           10                 100            1000              10000
                                             energy [eV]                                                                             energy [eV]

Fig. 6 X-ray spectra for solar abundance at different plasma temperatures. The continuum contributions from
bremsstrahlung (blue), recombination radiation, characterized by the sharp ionization edges (green), and 2-
photon radiation (red) are indicated. At the highest temperatures relevant for massive clusters of galaxies
bremsstrahlung is the dominant radiation process (from the work described in Böhringer & Hensler 1989).
The major emission lines in the panels for the higher temperatures relevant for galaxy clusters are designated
by the elements from which they originate (The labels Fe-L ans Si-L refer to transitions into the L-shell in
ions of Fe and Si, respectively, and two other lines with roman numbers carry the designation of the ions from
which they originate involving transitions within the L-shells.

    It is mostly the shape of the continuum spectrum, dominated by bremsstrahlung, that
provides information on the temperature. The spectral energy distribution for the thermal
bremsstrahlung spectrum for the collision of an electron with ion, i, is given by (e.g. Gronenschild & Mewe
1978):
                                        !1/2
                      16 e6
                                                                                   !
                                  2π                2                        −hν
             ǫ(ν) =                          ne ni Z g f f (Z, T X , ν) exp          ,       (4)
                     3 me c2 3me kB T X                                     kB T X
where me and ne are the electron mass and density, respectively, ni is the respective ion
density, Z is the effective charge of the ion, and g f f is the gaunt factor, a quantity close to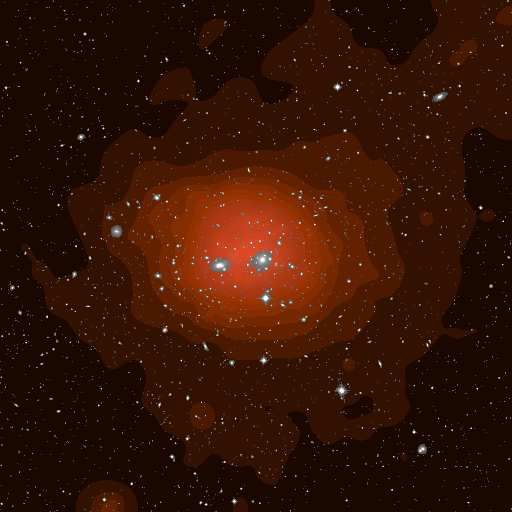
10

Fig. 7 X-ray spectrum of the ICM plasma in the halo of M87 at a temperature around 1.7 keV observed
with XMM-NewtonEMOS, showing exclusively the spectral range with the H- and He-like lines of Si and S
(Matsushita et al. 2002). The spectrum is fitted with a one-temperature MEKAL model (black line) and a two-
temperature model with the temperature components 1.4 keV and 3.3 keV (grey line). The one-temperature
model provides a better fit, supporting the view that the temperature distribution is very narrow. For more
details see the original publication.

unity which must be calculated numerically through a quantum-mechanical treatment. The
most prominent spectral signature of T X is the sharp cut-off of the spectrum at high energies,
due to the exponential term with the argument −hν/kB T . As long as this cut-off is seen in the
energy window of the telescope, one has a good handle on the temperature measurement.
The element abundances are mostly reflected in the intensity of the spectral lines. Only
in well resolved spectra of very high quality, where we can observe several lines of the
same element, is the temperature also constrained by line strength ratios. A prominent such
case occurs at temperatures around 2–3 keV where we can observe the K-shell and L-shell
lines of iron simultaneously in high photon count spectra. Another example of temperature
diagnostics based on the study of the hydrogen and helium like Si and S lines is shown in
Fig. 7 (taken from Matsushita et al. 2002). This work provides a further nice illustrations of
how different temperature indicators can be used to check the consistency of the temperature
measurement and to test if the plasma has a distribution of temperature phases.
    The first X-ray spectral observations of clusters lacked sufficient angular resolution and
thus involved the total ICM emission of the targets and only provided us with information
on the bulk temperature of the cluster ICM. What does this parameter tell us about a clus-
ter? Galaxy clusters form from the gravitational collapse of overdense regions in the matter
density distribution in the Universe and subsequently approach an equilibrium configuration
characterized by a virial relation:

                                                                 GM
                                  Ekinetic = −2E potential ∝        ,                                  (5)
                                                                  R
11
Fig. 8 Correlation of the ICM temperature with the velocity dispersion of the galaxies in clusters (Mushotzky
1984). The temperatures have been derived from X-ray spectra taken with the HEAO-1 satellite A-2 experi-
ment. The dots are data for non-cD clusters and the open symbols for cD clusters (clusters with a central dom-
inant, cD type galaxy). The lines show predictions of polytropic models with various indices (see Mushotzky
1984).
where the mass, M, refers to the total mass of the galaxy clusters including the dark matter.
Analogously to the virial equilibrium of galaxies and dark matter particles, the ICM plasma
thermalizes and attains a “virial temperature” which reflects the depth of the gravitational
potential of the cluster. In the collapse process the potential energy of the ICM is converted
to internal heat. If the gravitational potentials of clusters of different mass have a self-similar
shape, as implied by numerical simulations of gravitational collapse (e.g. Navarro et al.
1995; Moore et al. 1999), then one finds the following self-similar relation between clus-
ter mass and ICM temperature:
T ∝ σ2DM ∝ M/R ∝ M 2/3 , (6)
where σDM is the velocity dispersion of the dark matter particles. (The rightmost relation is
due to M ∝ R3 and ρDM = const. in the self-similar model).
The analysis of the first galaxy cluster spectra indirectly confirmed this trend by show-
ing that the ICM temperature increases with the galaxy velocity dispersion. Fig. 8 shows
one of the first such relations (Mushotzky 1984) with X-ray spectral observations from the
HEAO-1 A2 satellite experiment. Modern versions of these relations - given here directly
as M − T X relations - are shown in Fig. 9 for selected regular clusters from Arnaud et al.
(2007) and for cluster sample from Kotov & Vikhlinin (2006), respectively. The spectro-
scopically determined ICM temperature thus turns out to be one of the best mass proxies as
single observable parameter (e.g. Kravtsov et al. 2006). The tightest relations are obtained,
if the core regions are excluded in the global temperature measurement, due to the dispro-
portionate influence of the central cool cores as will become aparant below, and it has thus
become standard to quote the mean temperature in the radial region r = 0.15 − 1 × r500 as the12
Fig. 9 Left: The mass - temperature relation of a sample of regular clusters from (Arnaud et al. 2007). The
best fitting slope (solid line) is 1.71 ± 0.09 slightly steeper than the self similar relation. Right : The mass
- temperature relation of galaxy clusters and its evolution with redshift derived from two cluster samples at
< z >∼ 0.05 and < z >∼ 0.55 (Kotov & Vikhlinin 2006). The relations have been displaced by a factor of
10 for better visibility. The model predicted redshift evolution (clusters of equal mass get hotter with look-
back time) has been accounted for by scaling with the factor h(z). This predicted evolutionary trend is well
supported by the data.
most reliable single observable mass proxy for clusters (e.g. Arnaud et al. 2005; Pratt et al.
2008)1 .
The advanced X-ray observatories Chandra and XMM-Newton now routinely also pro-
vide localized measurements of the ICM temperature. First attempts had already been made
using observations with the ROSAT observatory e.g. to produce temperature maps featuring
still large temperature uncertainties (Briel & Henry 1994; Henry & Briel 1995) and later
by means of the ASCA observatory, but due to its comparably low angular resolution most
of the results remained somewhat ambiguous and depended on the analysis method used
(e.g. Ikebe et al. 1997; Markevitch et al. 1998; White 2000). With some studies by means
of the Italian-Dutch X-ray mission BeppoSAX some overview on the temperature structure
of clusters was obtained, with decreasing temperature profiles outside ∼ 0.2r500 and a di-
versity of the behaviour in the core region depending on the thermal history of the cluster
(De Grandi & Molendi 2002). This picture has become very precise with systematic studies
with XMM-Newton and Chandra. Fig. 10 shows results on the temperature profiles of cluster
samples studied with both observatories (Vikhlinin et al. 2006; Pratt et al. 2007).
To better understand these results, we have to make a brief excursion to scaling relations.
For the comparison of the structure of galaxy clusters of different mass based on the model
of self-similarity mentioned above, we need a fiducial radius which identifies corresponding
scales in clusters of different mass. A useful definition of such a scale is the radius at which
the mean mass density of the cluster is larger by a certain factor than the critical density
of the Universe at the redshift of the cluster. One of the justifications of this picture comes
from the spherical collapse model in a critical density universe. A good practical choice for
1 r
500 is the radius where the mean total density of the cluster is 500 times the mass density of a Universe
with critical density. This radius describes the same relative scale of clusters of different mass in the self-
similar scenario. See also explanation later in the text.13
Fig. 10 Scaled temperature profiles of galaxy clusters derived from spectroscopic observations with the
Chandra satellite (left, Vikhlinin et al. 2006) and results obtained for a sample of clusters observed with
XMM-Newton (right, Pratt et al. 2007).
the overdensity factor is 500 (see e.g. Evrard et al 1996 who show that inside a region of
∼ r500 randomized galaxy and mass particle orbits dominate clearly over infalling material),
not least from an X-ray observers point of view, since now a larger number of high quality
Chandra and XMM-Newton data cover the cluster ICM spectroscopically out to this radius
(e.g. Vikhlinin et al. 2006; Pratt et al. 2007). We will most often make use of this scaling
radius of r500 , but also use other values of overdensity depending on the literature from
which we draw the examples.
In Fig. 10 the temperature profiles shown are scaled by the overdensity radii (with dif-
ferent overdensity values, which has no importance here). We note that there is a large
diversity of the profiles at small radii. There are two classes of galaxy clusters: the clus-
ters with dense ICM cores show temperature profiles with T X decreasing towards the center
in the core regions, while in clusters with moderate central densities (typically below 10−2
cm−3 ) the temperature profiles are found to be flat or even slightly increasing towards the
cluster center. The clusters will be called cool core and non-cool core clusters in the fol-
lowing. Due to the logarithmic display of the radial range, the inner regions appear more
prominent in Fig. 10. Most of the cluster size and volume is in the outer region, where the
temperature profiles become very similar and appear squeezed into a narrow zone in scaled
radius. This shows that on large scale the thermal structure of clusters can be viewed as fol-
lowing closely a self-similar model. Characterizing this model and understanding the scatter
around the mean model is one of the current important observational goals of X-ray cluster
research.
One of the difficulties in deriving the temperature distribution of the ICM in clusters
from X-ray spectroscopic observations is the fact that the observed radiation is the result
of an integral of radiative emission along the entire line-of-sight through the cluster. There-
fore one observational task is to “deproject” the cluster spectra, which can only be done
by assuming a certain three-dimensional geometrical shape of the cluster, in general spher-
ical symmetry. The requirements for successful spectral deprojection are very good photon
statistics and an angular resolution of the data (instrument point spread function) that is bet-14
ter than the corresponding radial binning used. In general the deprojected spectra are much
more noisy than the observed spectra, but most often the deprojection results show only
small specific differences to the unprojected data (because most of the emission shaping the
spectrum comes from the center-most region).
A further problem in deriving the temperature structure from spectroscopy arises if the
plasma has more than one temperature phase locally, that is within the observed patch from
which the spectrum is extracted and within the deprojection bin. The question is then: what
determines the resulting temperature when this composite spectrum is fit with a single-phase
spectral model? A first intuitive guess is to assume that it is an average of the temperatures
weighted by the radiative emission contributions of the different phases, the so-called emis-
sion weighted temperature, T ew (e.g. Mathiesen & Evrard 2001). However, as shown by
Mazzotta et al. (2004) the resulting fitted temperature is generally biased low compared to
T ew . Mazzotta et al. (2004) derive a simple analytical approximation to calculate the fitting
result from a temperature mixture with an accuracy of a few percent for ICM temperatures
above 3 keV. The resulting fitted temperature they call spectroscopic-like temperature, T sl .
This approach is based on the fact that the temperature dependence of the spectra according
to Equ. 4 can be expressed as:
E E
ǫ(E, T ) ∼ n2e ζ(T, m) T −1/2 exp − ∼ n2e ζ(T, m) T −1/2 1 − (7)
kT kT
where E is the photon energy, m is the metallicity (heavy element abudance) of the
plasma, and ζ(T, m) includes the temperature dependence of the gaunt factor and some effect
of emission lines. The right hand side is a Taylor series expansion for low enough energies
as covered by the energy window of X-ray telescopes (for kB T > 3keV). Then it is easy to
show that temperature phase addition with subsequent single temperature fitting leads to the
following expression for the spectroscopic like temperature:
R
n2 T α /T 1/2 dV
T sl = R (8)
n2 T α /T 3/2 dV
with tests showing that α = 0.75 is a good approximation. Vikhlinin (2006) has gen-
eralized this approach also to low temperatures using a method that requires some more
complex numerical simulations that take into account the specifics of the spectroscopic in-
strument, energy band and galactic absorption providing satisfying results with errors of a
few percent.
The latter approach allows us to derive T sl for a known temperature distribution, but
provides no means to correct for a temperature bias, if the distribution is unknown. For
example the determination of cluster masses (as explained below) rests on a local average of
the pressure which requires a mass weighted temperature average for known density. Since
T sl is always biased low with respect to mass averaging, the mass will be underestimated in
the presence of unresolved multi-temperature structure (e.g. Rasia et al. 2005). A study by
Rasia et al. (2006) showed that the temperature bias can easily lead to a mass underestimate
by 10% on average. With current instrumentation it is difficult to unveil multi-temperature
structure in the temperature range above 3 keV. A simple exercise that can be performed with
XSPEC is to take an equal emission measure of 4 keV and 8 keV plasma and to simulate an
analysis with the instruments of XMM-Newton. Even with a simulated exposure that gives
several ten million photons, a single temperature model with T ∼ 5.5 keV gives a perfect fit
and we are unable to recover the original input phases. At lower temperatures and very good
photon statistics more diagnostics can be performed as seen e.g. in the study shown in Fig. 715 Fig. 11 Upper Left: Mass profiles for a sample of regular clusters with a range of temperatures derived from observations with XMM-Newton (Pointecouteau et al. 2005). Upper Right: Same mass profiles as in the left panel scaled in radius by r200 and in mass by M200 , the mass at the radius of r200 . The solid line shows the fit of a NFW mass distribution model which provides a good description of the data. Lower Panel: Scaled gas density profiles and scaled total density profiles for a sample of galaxy clusters observed with Chandra (Vikhlinin et al. 2006). The yellow line shows the best fitting NFW-model for the total density profile. (Matsushita et al. 2002) and similar studies in other cool core regions e.g. by Fabian et al. (2005) or Simionescu et al. (2008a) shown below, due to the emisson lines characteristic to the different temperature phases. 3.1 Cluster Mass Determination One of the most important applications of the knowledge of the temperature structure in the ICM is the mass determination of galaxy clusters. Assuming the ICM is in hydrostatic equilibrium and the cluster has approximately spherical symmetry, the distribution of the total mass in the cluster is given by the density and temperature profiles by the following
16

equation:
                                                             !
                                       G kB T X logρg logT X
                            M(r) = −           r      +        ,                               (9)
                                        µm p     logr   logr
where G and kB are the gravitational and Boltzmann’s constant, respectively, µ is the mean
particle mass (∼ 0.6), m p the mass of the proton, and ρg the gas density.
    One of the generally interesting results from recent efforts of precise mass determina-
tion is the conclusion that the ”NFW” dark matter halo model proposed by Navarro, Frenk
& White (1995,1997) gives a consistent description of the mass distribution of seemingly
relaxed clusters (clusters that show a high degree of symmetry in projection and no obvious
signs of recent merger activity) as shown in Fig. 11 (Pratt (2006), Vikhlinin et al. (2005), see
also Pratt & Arnaud (2002), Pointecouteau et al. (2005),Buote et al. (2007), Voigt & Fabian
(2006)). First attempts have been made of a rigorous comparison of the cluster masses de-
termined from an X-ray analysis and from gravitational lensing studies (Zhang et al. 2007;
Mahdavi et al. 2008) showing that the X-ray mass determination provides a much smaller
individual uncertainty. We also have first indications that the lensing masses are generally
higher by about 12(±15)% which may partly reflect the above mentioned temperature bias
and additional unaccounted turbulent pressure of the ICM if we assume that the lensing
masses are essentially unbiased. This mass calibration by combining several methods will
constitute an important effort in the coming years.

3.2 Fossil Record of Structure and Galaxy Formation in the ICM Thermal Structure

The temperature distribution in the ICM is also the key to the characterization of the thermal
history and thermal structure, most conveniently expressed by the entropy structure of the
cluster’s ICM. The definition of “entropy”, S , as used in the astrophysical literature of galaxy
clusters deviates from the general definition in physics:

                                                 kB T X
                                           S =            .                                   (10)
                                                 n2/3
                                                  e

This definition is related to the general definition of entropy, s, by s = kB ln S 3/2 (µm p )5/2 +
s0 (Voit 2005). The S value can be seen as a parameter to lable adiabates, and thus S stays
fixed in any hydrodynamic evolution of the ICM in which all processes are adiabatic; S
increases e.g. in shock waves or with dissipation of turbulent motion and descreases with
radiative cooling.
     The most important application of studying the entropy structure in galaxy clusters is the
distinction between heating by gravitational and non-gravitational processes. The term grav-
itational processes refers here to heat that comes from conversion of potential to heat energy
in the formation of structure and the collapse of clusters. This form of heat is determined
by structure formation processes that are mainly driven by the dark matter in the Universe.
Non-gravitational processes are connected to energy input into the ICM in the form of star
formation driven galactic winds (which at the same time lead to chemical enrichment of the
ICM as discussed in section 5) and by AGN providing energy input via jets of relativistic
plasma.
     The way to distinguish the two forms of heating is the study of scaling relations of
thermal cluster properties. The gravitational heating of the ICM during cluster formation
is proportional to the depth of the gravitational potential well of the cluster and thus the
17 Fig. 12 Entropy in groups and clusters measured at a fiducial radius of 0.1 rvirial as a function of the system’s ICM temperature (Ponman et al. 1999). It was inferred from this plot that the entropy appears to converge at low T X to a characteristic floor value of ∼ 100 h−1/3 keV cm2 . entropy gain is proportional to the ICM temperature. Heating processes connected to feed- back from the galaxy population are expected to be related (proportional) to the total stellar mass in the cluster. Assuming to first order a constant stellar to gas mass ratio of the bary- onic cluster component, the amount of non-gravitational energy input per unit gas mass is than also to first order constant. Therefore in this most simple consideration the gravita- tional entropy contribution is proportional to the virial and ICM temperature, while the non- gravitational entropy contribution is an additive constant. The evidence for non-gravitational entropy characterized in this way was provided by Ponman et al. (1999) as illustrated in Fig. 12 (see also David et al. (1996) who showed with ROSAT observations of cooler sys- tems that groups have flatter entropy profiles than clusters). The results imply a so-called entropy floor of about 135 keV cm2 (Ponman et al. 1999; Lloyd-Davies et al. 2000). More modern results do not show the sudden appearance of a step, but rather a slope of the entropy - temperature relation which is shallower than the slope of 1 expected from purely gravita- tional models: instead of the gravitational slope of S (r scaled ) ∝ T , relations around ∝ T 2/3 are found. Purely gravitational models of smooth and cold accretion of gas into the clus- ter (e.g. Tozzi & Norman 2001) predict entropy profiles in clusters of the form S (r) ∝ r1.1 . Observations show profiles which can be as steep as this prediction for the most massive systems, but they are shallower for smaller clusters, which is again a manifestation of the fact that non-gravitational processes have a larger effect on systems with a smaller mass and thus a shallower gravitational potential. As a representative result we show the study of Pratt (2006) involving 10 relaxed appearing clusters (Fig. 13), which illustrates the radial and ICM temperature scaling behaviour of the cluster ICM entropy. The diagnostics of en- tropy profiles has now been pursued in detail for larger cluster samples by Cavagnolo et al. (2009) and representative cluster samples by Prat et al. (2009, in preparation) providing a more detailed picture, the proper interpretation of which has to be assisted by simulations.
18

Fig. 13 Left: The entropy - temperature relation for 10 regular galaxy clusters determined at four different
fiducial radii (Pratt 2006). The slopes of the relations as determined from the orthogonal BCES method
(Akritas & Bershady 1996) are for increasing radii: 0.49 ± 0.15, 0.62 ± 0.11, 0.64 ± 0.11, and 0.62 ± 0.08.
Right: Scaled radial entropy profiles for the same 10 clusters. The radius is scaled by r200 . The entropy, S , has
been scaled with an entropy-temperature relation proportional to T 0.65 using the global cluster temperature.
The grey shaded area corresponds to the 1σ standard deviation. The dashed line shows radial dependence
S ∝ r 1.08 (Pratt 2006).

    Theoretical modeling to explain the quantitative entropy scaling behaviour involves
“preheating” (early entropy increase of the intergalactic medium due to star formation be-
fore the formation of the cluster), cooling and condensing of the low entropy material which
increases S in the remaining gas phase, and feedback heating processes in the cluster. A
complicated balance of all these processes seems to be necessary to reproduce the entropy
profiles, the scaling relations, and the amount of baryons that are converted into stars in the
cluster volume and efforts to obtain a completely consistent and satisfying model are still
ongoing (e.g. Borgani et al. 2004, 2005; Voit et al. 2003; Voit 2005; McCarthy et al. 2008).

3.3 At and beyond the virial radius

The low, stable, and well understood instrumental and particle background properties of the
Suzaku satellite allowed to perform the first pioneering studies of clusters out to and beyond
their virial radius. Reiprich et al. (2008) determined the temperature profile for the rich,
massive, cooling core cluster Abell 2204 from ∼10–1800 kpc, close to the estimated r200 .
They find that the temperature profile between 0.3–1.0r200 is consistent with a drop of 0.6,
as predicted by simulations. The first temperature, density, and entropy profiles beyond r200
were reported for another rich, massive cooling core cluster PKS 0745-191 (George et al.
2009). Between 0.3–1r200 they measure an average temperature drop of ∼ 70%. They find
that near to the virial radius the observed entropy profile is lower than that expected for the
heating by gravitational collapse. Fig. 14 shows the observed profiles in four directions and
the average profiles. The dotted curve at the bottom shows the expected entropy profile for
heating by gravitational collapse, S ∝ r1.1 , and the vertical dashed line shows the estimated
19
Fig. 14 Temperature, density and entropy profiles of PKS 0745-191 determined by Suzaku out to and beyond
the virial radius in each direction. The dotted curve at the bottom shows the expected entropy profile for
heating by gravitational collapse S ∝ r 1.1 . The vertical dashed line shows the estimate of r200 (George et al.
2009).
r200 . The fall of entropy beyond r200 in the NW direction is interpreted by the authors as
evidence for an accretion shock from cooler material falling on the cluster along a filament.
X-ray emission from hot plasma associated with a filament connecting two massive
clusters of galaxies, Abell 222 and Abell 223, was recently detected using XMM-Newton
(Werner et al. 2008). The detection of the tenuous gas permeating the filament was pos-
sible because of its favorable orientation approximately along our line-of-sight. The tem-
perature of the detected gas is kT = 0.91 ± 0.25 keV and assuming that the length of the
filament along the line-of-sight is l = 15 Mpc its baryon density is ≈ 3.4 × 10⁻⁵ cm−3 , which
corresponds to a baryon over-density of ≈ 150. The entropy of the gas in the filament is
S ≈ 870 keV cm2 l1/3 , which suggests strong preheating. We note that if the detected emis-
sion would be associated with the outer region of radially asymmetric clusters (deriving
the gas density by means of the usual geometric deprojection), the corresponding entropy
of ≈ 420 keV cm2 would be much lower than that expected for the virialised cluster gas
(≈ 1000 keV cm2 ) which has already passed through an accretion shock.20
Fig. 15 Temperature map of the merging cluster A3921 by (Belsole et al. 2005). The temperature map has
been produced from XMM-Newton observations obtained with the detectors EMOS1 and EMOS2 with the
multi-scale spectro-imaging technique of Bourdin et al. (2004). The barlike hot region to the NE is interpre-
tated as the signature of an off-axis merger at a stage short after the first close encounter similar to features
observed in simulations (Belsole et al. 2005; Ricker & Sarazin 2001). Superposed to the temperature map
are the contour lines of the surface brightness distribution in the 0.3 - 10 keV band which was adaptively
smoothed. The contours are spaced logarithmicly.
3.4 Diagnostics of Cluster Mergers
Galaxy clusters grow throughout the recent history of our Universe by accreting matter
from their surroundings, preferentially by clumpy accretion from the cosmic network matter
filaments in the intersections of which they are embedded (e.g. Braglia et al. 2007). From
time to time major merger events happen in this accretion process, where two larger systems
are attracted to each other and merge violently. These cluster mergers have always been very
attractive study objects (see e.g. Feretti et al. 2002, for a review). The thermal structure of
the ICM again offers good perspectives to unveil the merger configuration and its history as
well as to understand the heating processes of the ICM resulting from the energy release of
the merger.
We will illustrate the diagnostic potential of X-ray spectroscopy in these studies by con-
centrating here mostly on the example of the most dramatic merging system, 1E0657-56.
But before we describe an earlier result obtained with XMM-Newton for the diagnostics
of the off-axis merger in the cluster A3921 shown in Fig. 15 by Belsole et al. (2005). The
temperature map has been obtained by applying the multi-scale spectro-imaging technique
based on a wavelet analysis described by Bourdin et al. (2004). The general result of this
analysis was subsequently confirmed by spectroscopy of the regions highlighted in the tem-
perature map. While the general gas temperature of the undisturbed Eastern region of the
main cluster has a temperature around 4.9 keV, a hot, bar like region with an extent of about21
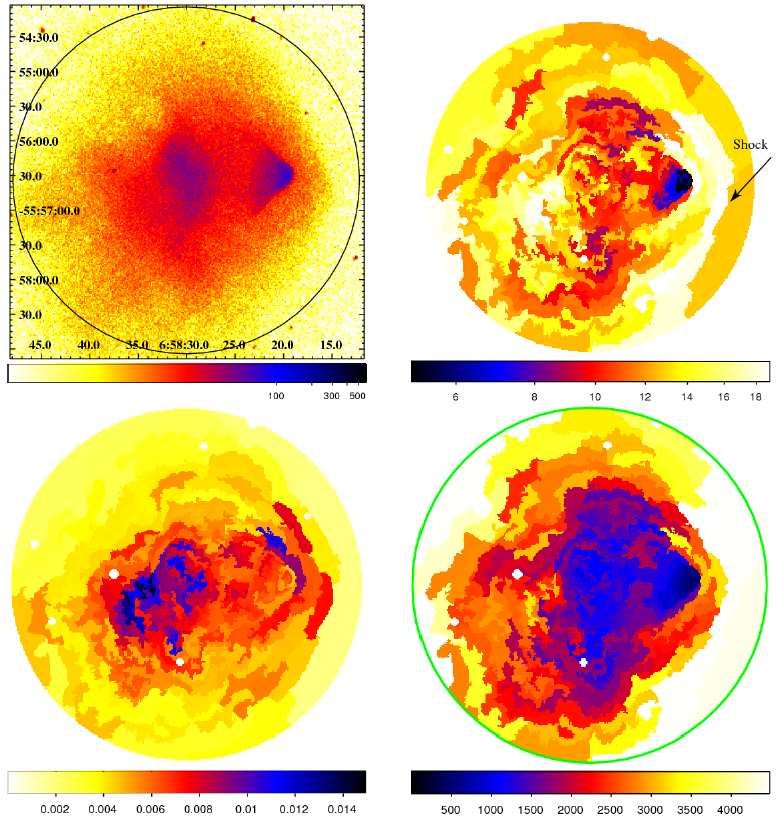
Fig. 16 Thermodynamic maps for the ICM of the “bullet cluster”, 1E0657-56 (Million & Allen 2008) pro-
duced from a 500 ksec observation of this cluster with Chandra. The panels show the X-ray surface brightness
in the 0.8 to 7 keV band (upper left), the temperature, kB T , in units of keV (upper right), the projected pres-
sure in units of keV cm−5/2 arcsec−1 (lower left) and projected entropy in units of keV cm5/3 arcsec−1 (lower
right). The shock front preceding the bullet is marked by an arrow in the temperature map.
160 x 280 kpc is observed in the highly distorted North-Western side which has been found
to have a temperature around 7.25 keV. The signatures have been interpreted as an off-axis
merger (Belsole et al. 2005). The observed features have been found to be similar to those in
the simulations of an off axis merger with a mass ratio of 1:3 an impact parameter of b = 5r s
(where r s is the scale radius of the NFW profile describing the density distribution of the
cluster) and a time of less than about 1 Gyr after the X-ray luminosity reaches its peak as
shown by Ricker & Sarazin (2001) in their Fig. 7. This system seems to show the typical ap-
pearance of an intermediate stage off-axis merger similar to other cases (e.g. Reiprich et al.
2004).
The most detailed and interesting data set on a merging cluster system is that of 1E0657-
56 at a redshift of z = 0.297. This cluster was observed in a very deep observation with
Chandra with an exposure of 500 ksec (Markevitch 2006) and also with XMM-Newton
(Zhang et al. 2006, Finoguenov et al. 2005). As a first exercise to get an overview on the
thermodynamic structure of the cluster ICM, it has become standard for such deep, high22 Fig. 17 Left: Surface brightness profile across the shock front preceding the bullet (Markevitch et al. 2002). The solid line shows the best fit model for the three-dimensional density distribution with a sharp spherical discontinuity at the shock. Right : Projected temperature profile in a narrow sector across the shock front. The vertical lines show the boundary of the bullet and the shock. The dashed line shows the average pre-shock temperature (Markevitch 2006). Both data sets have been derived from deep Chandra observations. photon statistic observations to produce maps of the temperature and density distributions of the ICM and to infer the pressure and entropy distribution from these quantities. Fig. 16 shows such maps produced by (Million & Allen 2008). The temperature is determined from spectroscopy of about 100 image pixels, each containing at least 3000 photons. The binning of these pixels has been guided by regions of similar surface brightness (Sanders 2006). The ICM density is derived from the surface brightness distribution by assuming a certain geom- etry to deproject the emission distribution along the line-of-sight. Although the so derived temperature in the temperature map is a projected quantity, it still gives a good impression about the temperature in the central bin in the line-of-sight because of the large weight of the innermost bin due to the square density dependence of the emissivity and the steep den- sity profile. From these maps of approximate temperature and density distribution in a cross section of the cluster, the approximate distribution of pressure, P = nkB T x , and entropy, S = T/n2/3 , can be constructed. The surface brightness image in Fig. 16 shows a disturbed larger cluster component and a compact, cone like structure to the West. The latteris iden- tified with a compact subcluster, flying through the main cluster at high relative velocity, for which optical images provide further evidence. This component has been named “the bullet” from which the popular name of the whole system, “the bullet cluster”, originates. In the temperature map the bullet shows up as a cool core which also has the lowest entropy in the entropy map. The Mach cone like shape of the bullet suggest that it may fly with supersonic velocity. In the temperature map we observe that the region in front of the bullet has a strongly enhanced temperature that goes hand in hand with high pressure and elevated entropy. This is the signature of a region heated by a shock preceding and being detached from the bullet. The high temperature/entropy region shows a sharp edge at the shock. In the pressure map the region of the bullet shows little enhancement (apart from the narrow band of shock compressed ICM), while the highest pressure values are found in the center of
23

the overall system structure. Thus, despite the disturbances, the pressure maximum is most
probably still indicating the region of the deepest gravitational potential.
    To obtain more quantitative information about the nature of the shock in front of the
bullet, (Markevitch et al. 2002) has studied the temperature and density distribution around
the region of the shocked ICM in more detail. Fig. 17 shows two sharp edges in the surface
brightness profile in the left panel. The inner bump is the contact discontinuity that separates
the bullet from the shock heated ICM, the second bump at 90′′ is the shock. From a density
model that fits the projected surface brightness one infers a density jump that corresponds
to Mach number 3 ± 0.4 shock. The corresponding temperature jump as derived from the
projected spectra, is shown in the right panel. The relatively high Mach number implies
a relative velocity of the bullet and the ICM of about 4700 km/s. For an explanation of
this high velocity see recent simulations that try to reconstruct the merger configuration of
1E0657-56 and recover such high velocities which are partly boosted by the accretion inflow
of ICM at the position of the bullet (Springel & Farrar 2007; Mastropietro & Burkert 2008).
In section 6.2 we discuss the use of the observed shock structure in this cluster to study the
processes controlling the thermalization of the plasma behind the shock.
    So far only two more cases of clear shock signatures in merging clusters are known:
A 520 (Markevitch et al. 2005; Markevitch & Vikhlinin 2007); A2219 (Million & Allen 2008).
    Another type of interesting structures in the ICM are the so called cold fronts, which
also show up in the surface brightness images of clusters as sharp surface brightness discon-
tinuities. But thanks to the spectroscopically determined temperatures one can show that the
pressure across the cold fronts is continuous, such that they are boundaries between colder
denser plasma and a more tenuous, hotter environment. Markevitch & Vikhlinin (2007) pro-
vide a nice recent review about the X-ray observations and the physics of cold fronts and
ICM shocks.

3.5 Observational Studies of Turbulence of the ICM

Galaxy cluster mergers are expected to induce turbulent motions into the ICM (Sunyaev et al.
2003). An investigation of the presence of stochastic turbulence has been performed by
means of a spectral reduction of deep XMM-Newton observations of the Coma galaxy cluster
by Schuecker et al. (2004). The turbulence fluctuation spectrum was studied in the projected
pressure map of the ICM in the central region of the Coma cluster. The Coma cluster has a
very flat appearance, characterized by a very large core radius of the X-ray surface bright-
ness of ∼ 400 kpc (Briel et al. 1992). This enables us to treat the configuration of the central
region of Coma in the first approximation as a slab geometry, with corrections to the power
spectrum applied later. The analysis of the fluctuation spectrum testing for a turbulent power
law spectrum was performed, with the pressure rather than with density or temperature fluc-
tuations, not to confuse the turbulent fluctuations with static entropy fluctuations in pressure
equilibrium, which would be characterized by contact discontinuities. In fact, Fig. 19 (left)
shows that turbulent pressure fluctuations dominate also the density fluctuations rather than
contact discontinuities.
    The map of the projected pressure distribution in the center of the Coma ICM as shown
in Fig. 18 was obtained by calculating the gas density from the X-ray surface brightness
(with an assumed depth of the ICM in the line of sight) and deriving the temperature by a
spectral analysis of the data in pixels of 20 by 20 arcsec2 and alternatively 40 by 40 arcsec2 ,
yielding the pressure by means of the ideal gas equation of state. We see the pressure fluctu-
ations clearly in Fig. 18. A Fourier analysis of these fluctuations seen in projection results in
You can also read