Evaluating metal-organic frameworks for natural gas storage - Royal Society of ...
←
→
Page content transcription
If your browser does not render page correctly, please read the page content below
Electronic Supplementary Material (ESI) for Chemical Science
This journal is © The Royal Society of Chemistry 2014

                                            Supporting Information for:

                Evaluating metal-organic frameworks for natural
                                  gas storage

                          Jarad A. Mason,a Mike Veenstrab and Jeffrey R. Long*a

                  a
                      Department of Chemistry, University of California, Berkeley, CA 94720, USA; E–mail: jrlong@berkeley.edu;
                              b
                                Ford Motor Company, Research and Advanced Engineering, Dearborn, MI 48121, USA.

                                                                 Chem. Sci.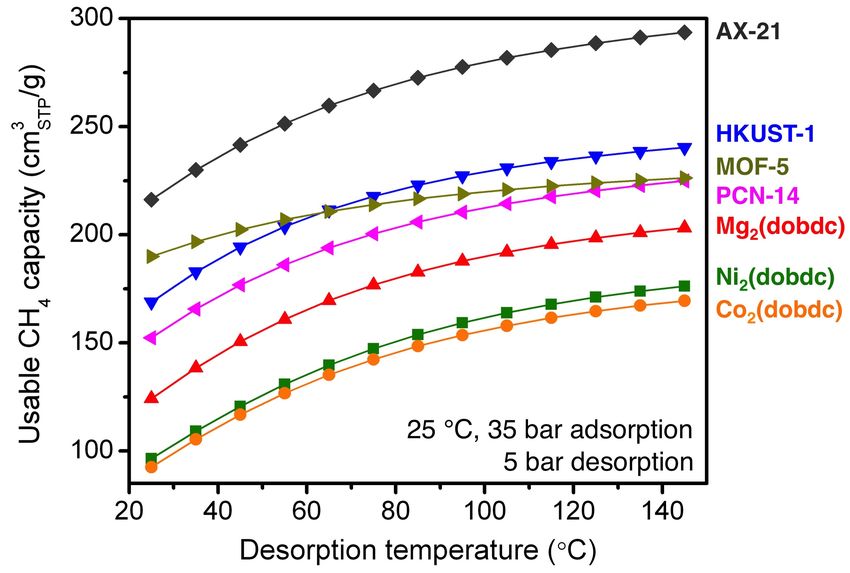
Electronic Supplementary Material (ESI) for Chemical Science
This journal is © The Royal Society of Chemistry 2014

                Table of Contents
                1.    Experimental ..................................................................................................................... S-3
                       General information ...................................................................................................... S-3
                       Low-pressure gas adsorption measurements .............................................................. S-3
                       Metal-organic framework synthesis ............................................................................. S-3
                2.    Powder X-ray diffraction ................................................................................................. S-6
                3.    Surface areas and pore volumes ...................................................................................... S-9
                4.    High-pressure gas adsorption measurements .............................................................. S-14
                5.    Crystallographic density calculations ........................................................................... S-19
                6.    Excess CH4 adsorption isotherms ................................................................................. S-20
                7.    Isotherm fitting ............................................................................................................... S-24
                8.    Isosteric heats of adsorption .......................................................................................... S-28
                9.    PCN-14 literature comparison ...................................................................................... S-29
                10.   CH4 uptake vs. surface area ........................................................................................... S-31
                11.   Usable CH4 capacity ....................................................................................................... S-32
                12.   HKUST-1 pore window adsorption site ........................................................................ S-36
                13.   Optimal binding enthalpy .............................................................................................. S-37
                14.   References ........................................................................................................................ S-38

                                                                                   S-2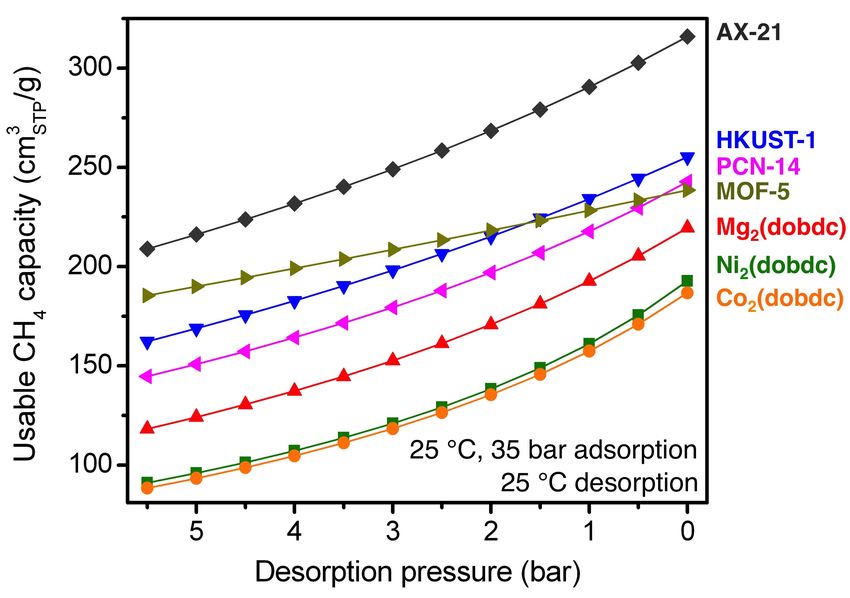
Electronic Supplementary Material (ESI) for Chemical Science
This journal is © The Royal Society of Chemistry 2014

                    1. Experimental
                General information

                    Anhydrous dichloromethane and N,N-dimethylformamide were obtained from a Vac
                anhydrous solvent system. The ligand 5,5´-(9,10-anthracenediyl)-di-isophthalic acid (H4adip)
                was synthesized according to a literature procedure.1 The AX-21 carbon was purchased from a
                commercial vendor and activated at 200 ºC under vacuum for 24 h prior to use. All other
                reagents were obtained from commercial vendors and used without further purification. UHP-
                grade (99.999% purity) helium, nitrogen, and methane were used for all adsorption
                measurements. Infrared spectra were obtained on a Perkin-Elmer Spectrum 100 Optica FTIR
                spectrometer furnished with an attenuated total reflectance accessory. Diffraction data were
                collected with 0.02° steps using a Bruker AXS D8 Advance diffractometer equipped with Cu-Kα
                radiation (λ = 1.5418 Å), a Göbel mirror, a Lynxeye linear position-sensitive detector, and
                mounting the following optics: fixed divergence slit (0.6 mm), receiving slit (3 mm), and
                secondary beam Soller slits (2.5°). The generator was set at 40 kV and 40 mA.

                Low-pressure gas adsorption measurements

                    Gas adsorption isotherms for pressures in the range 0-1.1 bar were measured using a
                Micromeritics ASAP 2020 instrument. For standard measurements in ASAP low-pressure glass
                sample holders, activated samples were transferred under a N2 atmosphere to preweighed
                analysis tubes, which were capped with a Transeal. The samples were evacuated on the ASAP
                until the outgas rate was less than 3 µbar/min. The evacuated analysis tubes containing degassed
                samples were then carefully transferred to an electronic balance and weighed to determine the
                mass of sample (typically 100-200 mg). The tube was fitted with an isothermal jacket and
                transferred back to the analysis port of the gas adsorption instrument. The outgas rate was again
                confirmed to be less than 3 µbar/min.
                    Langmuir surface areas and pore volumes were determined by measuring N2 adsorption
                isotherms in a 77 K liquid N2 bath and calculated using the Micromeritics software, assuming a
                value of 16.2 Å2 for the molecular cross-sectional area of N2.

                Metal-organic framework synthesis

                Ni2(dobdc) (Ni-MOF-74, CPO-27-Ni; dobdc4− = 2,5-dioxido-1,4-benzenedicarboxylate)

                    The compound Ni2(dobdc) was synthesized and activated using a strategy adopted from
                previous reports.2 Specifically, H4dobdc (1.42 g, 7.2 mmol) and Ni(NO3)2•6H2O (5.23 g, 18
                mmol) were combined with 350 mL of anhydrous dimethylformamide (DMF) and 42 mL of
                anhydrous methanol (MeOH) in a 500 mL Schlenk flask under N2. The solution was heated at
                120 ºC under a positive N2 pressure with stirring for 18 h. After cooling, the resulting yellow-
                orange precipitate settled to the bottom of the Schlenk flask, and the reaction solvent was
                removed via cannula, replaced with fresh DMF, and heated to 100 ºC for 5-6 h. The DMF was
                replaced with fresh DMF two additional times. The DMF was then exchanged with MeOH, and
                the mixture was heated to 60 ºC for 5-6 h. The MeOH was replaced with fresh MeOH two
                additional times. The majority of MeOH was then removed via cannula, and the resulting bright

                                                               S-3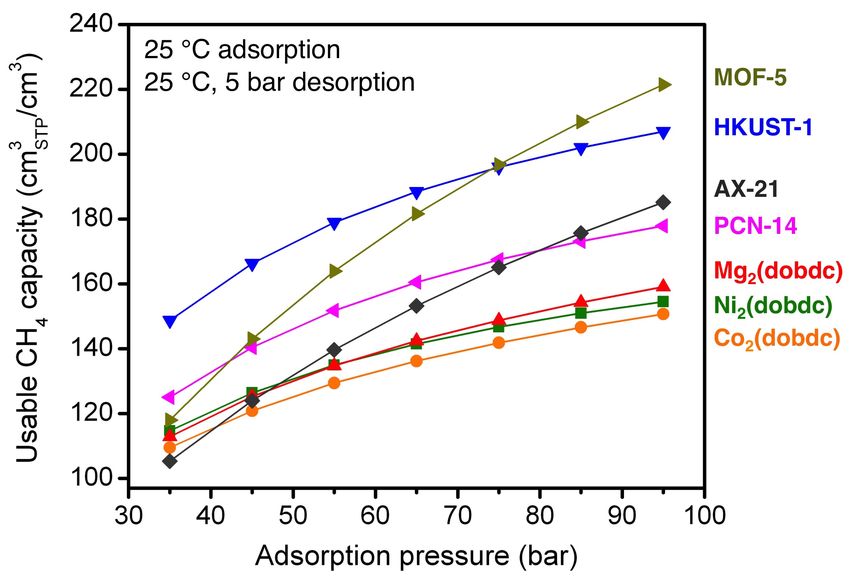
Electronic Supplementary Material (ESI) for Chemical Science
This journal is © The Royal Society of Chemistry 2014

                orange compound was activated at 180 ºC under vacuum for 24-48 hr to yield 1.5 g of desolvated
                Ni2(dobdc). Note that while the solvent exchanges were conducted under N2, anhydrous solvents
                were not used. The successful synthesis and activation of the framework was confirmed by
                comparing the X-ray powder diffraction pattern and Langmuir surface area to those previously
                reported (see Figs. S1, S7).

                Co2(dobdc) (Co-MOF-74, CPO-27-Co)

                    The compound Co2(dobdc) was synthesized and activated using a strategy adopted from a
                previous report.2a Specifically, H4dobdc (0.964 g, 4.9 mmol) and Co(NO3)2•6H2O (4.754 g, 16.3
                mmol) were combined with a 1:1:1 (v/v/v) mixture of DMF:ethanol:H2O (400 mL) in a 1 L jar,
                sparged with N2 for 1 h, and heated at 100 ºC for 24 h. Following the reaction, the resulting red-
                violet crystals were collected by filtration and washed repeatedly with DMF. The compound was
                then soaked in DMF at 120 °C for 5-6 h. The DMF was decanted, replaced with fresh DMF, and
                again heated to 120 °C for 5-6 h. This was repeated one additional time. Then, the DMF was
                decanted and replaced by MeOH, which was heated to 60 ºC for 5-6 h. The MeOH was decanted,
                replaced with fresh MeOH, and again heated to 60 °C for 5-6 h. This was repeated 2 additional
                times. The final product was collected by filtration and then activated under vacuum at 180 °C
                for 24-48 h. The successful synthesis and activation of the framework was confirmed by
                comparing the X-ray powder diffraction pattern and Langmuir surface areas to those previously
                reported (see Figs. S2, S8).

                Mg2(dobdc) (Mg-MOF-74, CPO-27-Mg)

                    The compound Mg2(dobdc) was synthesized and activated using a strategy adopted from
                previous reports.2a,3 Specifically, H4dobdc (1.11 g, 5.6 mmol) and Mg(NO3)2•6H2O (4.75 g, 18.6
                mmol) were dissolved in a 15:1:1 (v/v/v) mixture of DMF:ethanol:H2O (500 mL) and sparged
                with N2 for 1 h. The resulting solution was evenly distributed into thirty-eight 20 mL vials,
                which were sealed with Teflon-lined caps and heated to 120 ºC for 8 h. Following the reaction,
                the resulting yellow microcrystalline material was collected by filtration and washed repeatedly
                with DMF. The solid was then soaked in DMF at 120 °C for 5-6 h. The DMF was decanted,
                replaced with fresh DMF, and again heated to 120 °C for 5-6 h. This was repeated one additional
                time. Then, the DMF was decanted and replaced by MeOH, which was heated to 60 ºC for 5-6 h.
                The MeOH was decanted, replaced with fresh MeOH, and again heated to 60 °C for 5-6 h. This
                was repeated 2-3 additional times, until the DMF C=O stretch (~1650 cm−1) was no longer
                observed in the infrared spectrum. The resulting dark yellow powder was collected by filtration
                and then activated under vacuum at 180 °C for 24-48 h. The successful synthesis and activation
                of the framework was confirmed by comparing the X-ray powder diffraction pattern and
                Langmuir surface areas to those previously reported (see Figs. S3, S9).

                Cu3(btc)2 (HKUST-1; btc3− = 1,3,5-benzenetricarboxylate)

                    The compound HKUST-1 was synthesized and activated using a strategy adopted from a
                previous report.4 Specifically, Cu(NO3)2•2.5H2O (2.4 g, 10.3 mmol) was dissolved in 30 mL
                deionized H2O, and 1,3,5-benzenetricarboxylic acid (0.68 g, 3.2 mmol) was dissolved in 30 mL
                ethanol. The two solutions were combined in a 250 mL one-neck round-bottom flask. DMF

                                                               S-4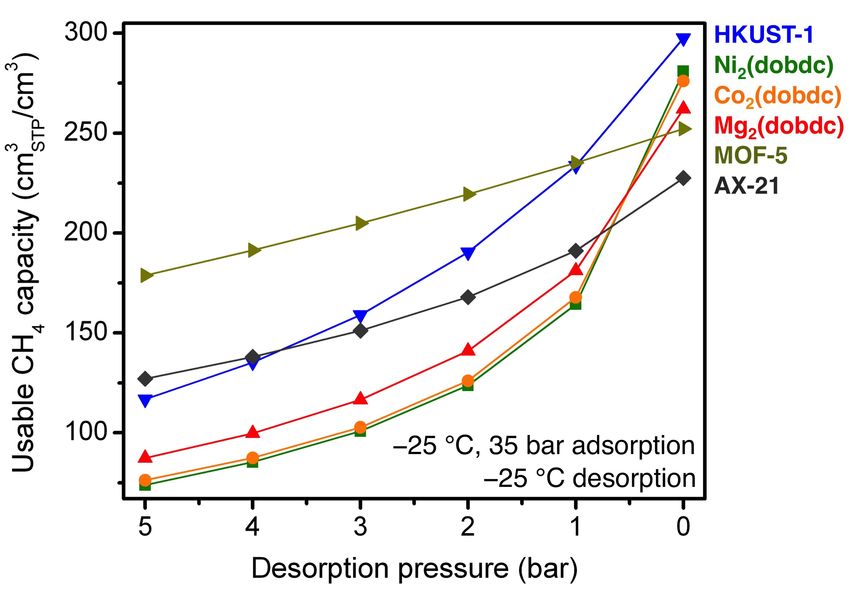
Electronic Supplementary Material (ESI) for Chemical Science
This journal is © The Royal Society of Chemistry 2014

                (2 mL) was added, and the flask was sealed with a rubber septum. The reaction mixture was
                heated at 80 ºC for 24 h with stirring. The resulting light blue compound was filtered and washed
                with H2O and EtOH. The product was further suspended in EtOH at 55 ºC for 12 h. The EtOH
                was removed, fresh EtOH was added, and the suspension was again heated at 55 ºC for 12 h. The
                final product was collected by filtration and activated by heating at 150 ºC under vacuum for 24
                h. The successful synthesis and activation of the framework was confirmed by comparing the X-
                ray powder diffraction pattern and Langmuir surface areas to those previously reported (see Figs.
                S4, S10).

                Cu2(adip) (PCN-14; adip4− = 5,5´-(9,10-anthracenediyl)-di-isophthalate)

                    The compound PCN-14 was synthesized and activated using a strategy adopted from a
                previous report.5 Specifically, H4adip (0.6 g, 1.2 mmol) and Cu(NO3)2•2.5H2O (2.4 g, 10.3
                mmol) were fully dissolved in DMF (180 mL) with 10 drops of HBF4. The solution was evenly
                distributed into twenty-found 20 mL vials, which were sealed with Teflon-lined caps and heated
                to 75 ºC for 24 h. The resulting green powder was collected by filtration and washed with DMF.
                The product was further suspended in DMF for 12 h at room temperature, then the DMF was
                exchanged with MeOH. After 6 h, the MeOH was decanted and replaced with fresh MeOH. This
                was repeated one further time. The final product was collected by filtration and activated by
                heating at 120 ºC under vacuum for 24 h. The successful synthesis and activation of the
                framework was confirmed by comparing the X-ray powder diffraction pattern and Langmuir
                surface areas to those previously reported (see Figs. S5, S11-S13).

                Zn4O(bdc)3 (MOF-5, IRMOF-1; bdc2- = 1,4-benzenedicarboxylate)

                    The compound MOF-5 was synthesized and activated using a strategy adopted from a
                previous report.6 Specifically, H2bdc (0.66 g, 4.0 mmol), Zn(NO3)2•6H2O (3.6 g, 12.1 mmol),
                and diethylformamide (100 mL) were combined in a 250 mL Schlenk flask sealed with a rubber
                septum. The Schlenk flask was heated at 90 ºC for 24 h, then placed under N2, and the reaction
                solvent was removed via cannula and replaced with anhydrous DMF at room temperature. The
                DMF was exchanged with fresh, anhydrous DMF two further times. The DMF was then
                exchanged with anhydrous dichloromethane (DCM) at room temperature. The DCM was
                exchanged with fresh, anhydrous DCM two further times, then the majority of the DCM was
                removed via cannula. The resulting clear, cubic crystals were activated by heating at 150 ºC
                under vacuum for 24 h. The successful synthesis and activation of the framework was confirmed
                by comparing the X-ray powder diffraction pattern and Langmuir surface areas to those
                previously reported (see Figs. S6, S14).

                                                               S-5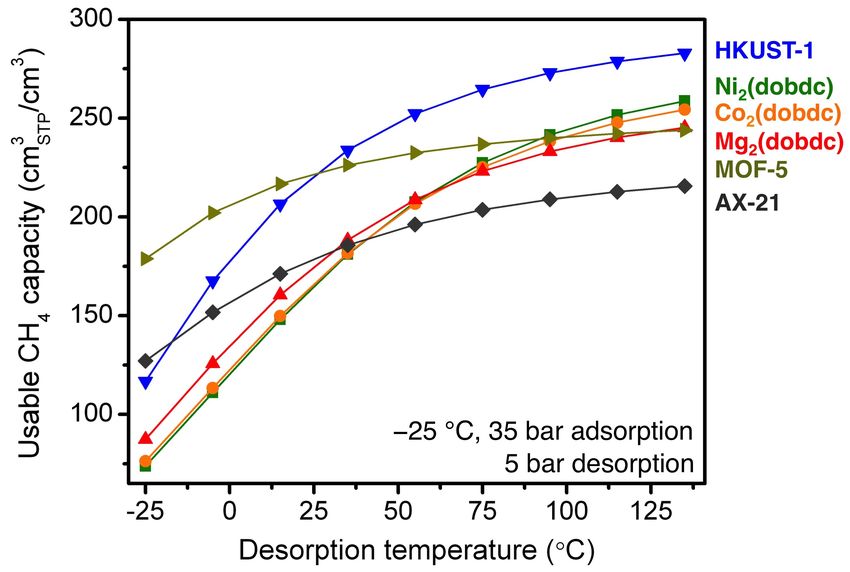
Electronic Supplementary Material (ESI) for Chemical Science
This journal is © The Royal Society of Chemistry 2014

                    2. Powder X-ray diffraction

                Fig. S1 Powder X-ray diffraction pattern of as-synthesized Ni2(dobdc) (λ = 1.5418 Å).
                Calculated peak positions from the crystal structure are shown (blue tick marks).

                Fig. S2 Powder X-ray diffraction pattern of as-synthesized Co2(dobdc) (λ = 1.5418 Å).
                Calculated peak positions from the crystal structure are shown (blue tick marks).

                                                               S-6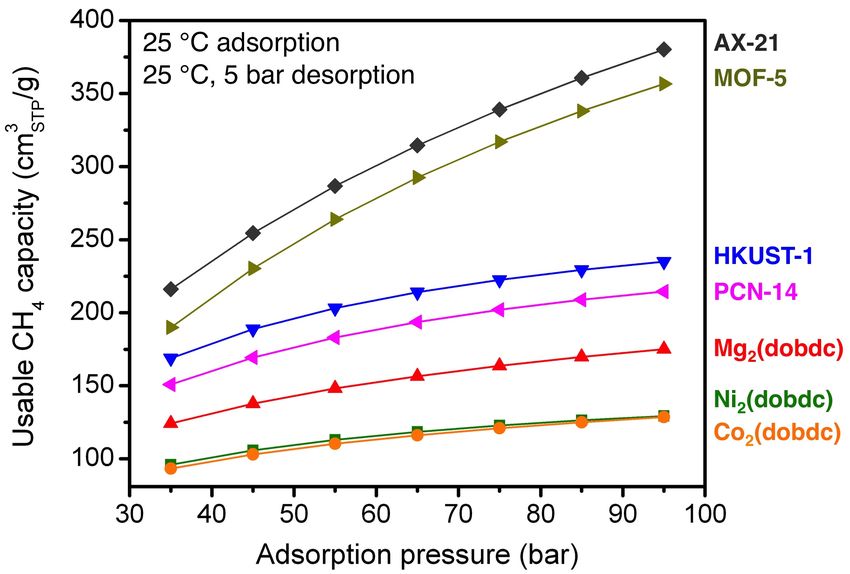
Electronic Supplementary Material (ESI) for Chemical Science
This journal is © The Royal Society of Chemistry 2014

                Fig. S3 Powder X-ray diffraction pattern of as-synthesized Mg2(dobdc) (λ = 1.5418 Å).
                Calculated peak positions from the crystal structure are shown (blue tick marks).

                Fig. S4 Powder X-ray diffraction pattern of as-synthesized HKUST-1 (λ = 1.5418 Å).
                Calculated peak positions from the crystal structure are shown (blue tick marks).

                                                               S-7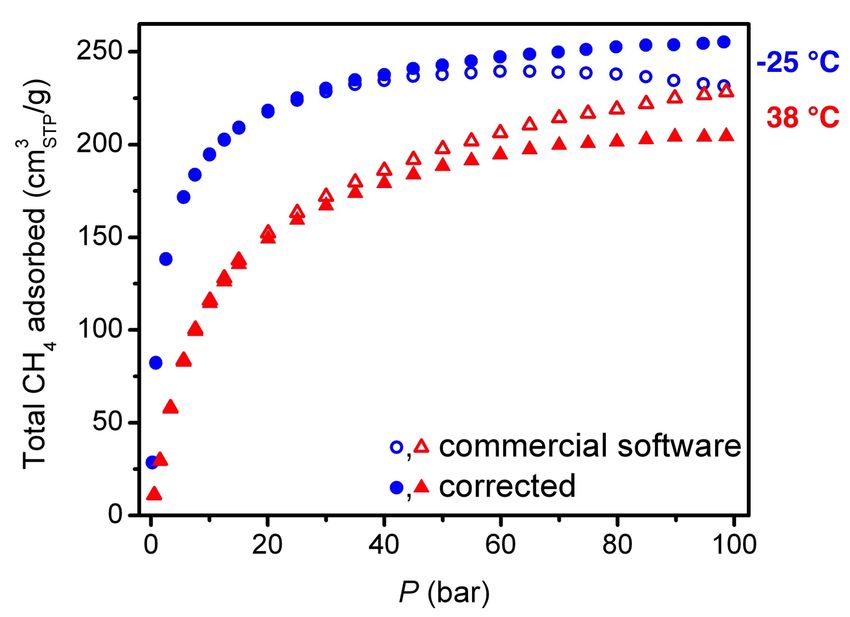
Electronic Supplementary Material (ESI) for Chemical Science
This journal is © The Royal Society of Chemistry 2014

                Fig. S5 Powder X-ray diffraction pattern of as-synthesized PCN-14 (λ = 1.5418 Å). Calculated
                peak positions from the crystal structure are shown (blue tick marks).

                Fig. S6 Powder X-ray diffraction pattern of as-synthesized MOF-5 (λ = 1.5418 Å). The baseline
                is magnified in the inset to make the peak positions more obvious. Calculated peak positions
                from the crystal structure are shown (blue tick marks).

                                                               S-8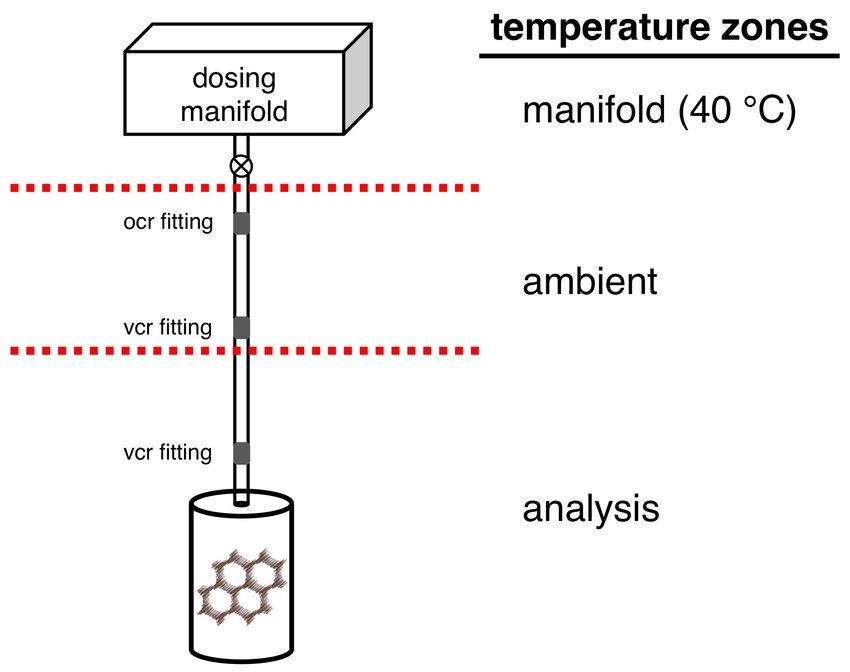
Electronic Supplementary Material (ESI) for Chemical Science
This journal is © The Royal Society of Chemistry 2014

                    3. Surface areas and pore volumes

                Fig. S7 77 K N2 adsorption isotherm for Ni2(dobdc) activated at 180 ºC in the HPVA high-
                pressure adsorption cell. The calculated Langmuir surface area is 1574 m2/g (nsat = 16.1 mmol/g),
                and the total pore volume at p/p0 = 0.9 is 0.56 cm3/g. Here, nsat is the amount of N2 adsorbed at
                saturation (mmol/g), p is the pressure, and p0 is the saturation pressure of N2.

                Fig. S8 77 K N2 adsorption isotherm for Co2(dobdc) activated at 180 ºC in the HPVA high-
                pressure adsorption cell. The calculated Langmuir surface area is 1433 m2/g (nsat = 14.7 mmol/g),
                and the total pore volume at p/p0 = 0.9 is 0.51 cm3/g.

                                                               S-9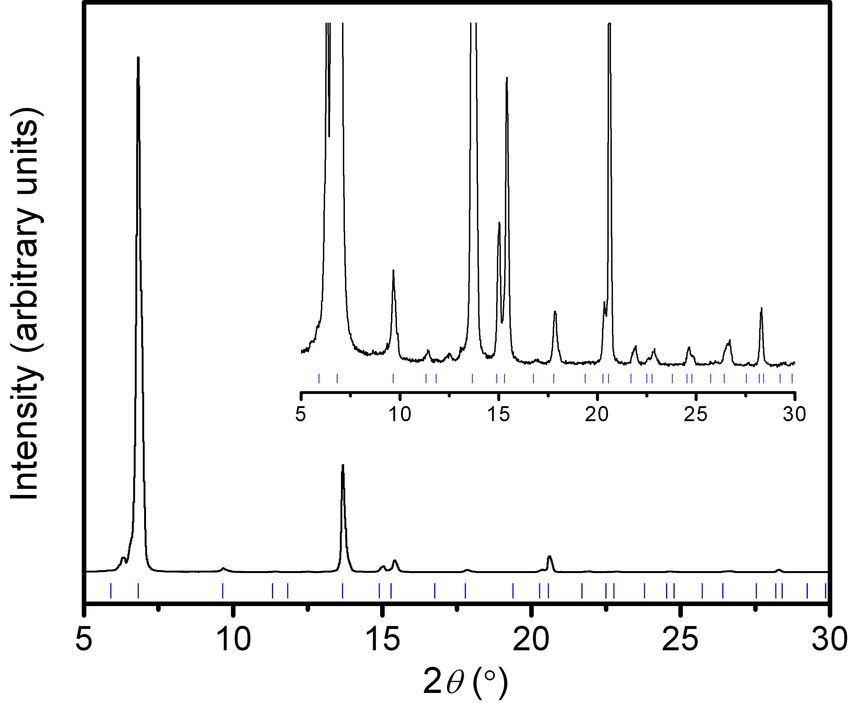
Electronic Supplementary Material (ESI) for Chemical Science
This journal is © The Royal Society of Chemistry 2014

                Fig. S9 77 K N2 adsorption isotherm for Mg2(dobdc) activated at 180 ºC in an ASAP-2020 low-
                pressure sample holder (red) and the HPVA high-pressure adsorption cell (blue). The calculated
                Langmuir surface area is 1957 m2/g (nsat = 20.1 mmol/g), and the total pore volume at p/p0 = 0.9
                is 0.69 cm3/g.

                Fig. S10 77 K N2 adsorption isotherm for HKUST-1 activated at 150 ºC in the HPVA high-
                pressure adsorption cell. The calculated Langmuir surface area is 2190 m2/g (nsat = 22.5 mmol/g),
                and the total pore volume at p/p0 = 0.9 is 0.77 cm3/g.

                                                               S-10
Electronic Supplementary Material (ESI) for Chemical Science
This journal is © The Royal Society of Chemistry 2014
Fig. S11 77 K N2 adsorption isotherm for PCN-14 activated at 120 ºC in an ASAP-2020 low-
pressure sample holder (red) and the HPVA high-pressure adsorption cell (blue). The calculated
Langmuir surface area is 2360 m2/g (nsat = 24.2 mmol/g), and the total pore volume at p/p0 = 0.9
is 0.83 cm3/g. The calculated BET surface area is 1984 m2/g.
Fig. S12 Plot of n(1-p/p0) vs. p/p0 to determine the maximum p/p0 used in the BET linear fit
according to the first BET consistency criterion.7
S-11Electronic Supplementary Material (ESI) for Chemical Science
This journal is © The Royal Society of Chemistry 2014
Fig. S13 Plot of p/p0/(n(1-p/p0)) vs. p/p0 to determine the BET surface area.7 The slope of the
best fit line for p/p0 < 0.03 is 0.049, and the y-intercept is 2.9 x 10⁻⁶, which satisfies the second
BET consistency criterion. This results in a saturation capacity of 20.3 mmol/g and a BET
surface area of 1984 m2/g.
Fig. S14 77 K N2 adsorption isotherm for MOF-5 activated at 150 ºC in the HPVA high-
pressure adsorption cell. The calculated Langmuir surface area is 3961 m2/g (nsat = 40.6 mmol/g),
and the total pore volume at p/p0 = 0.9 is 1.4 cm3/g.
S-12Electronic Supplementary Material (ESI) for Chemical Science
This journal is © The Royal Society of Chemistry 2014
Fig. S15 77 K N2 adsorption isotherm for AX-21 activated at 200 ºC in the HPVA high-pressure
adsorption cell. The calculated Langmuir surface area is 4880 m2/g (nsat = 50.1 mmol/g), and the
total pore volume at p/p0 = 0.9 is 1.64 cm3/g.
Table S1 Summary of gravimetric Langmuir surface area (m2/g), volumetric Langmuir surface
area (m2/cm3) pore volume (cm3/g), and crystallographic density (g/cm3) for all materials
synthesized and evaluated in this work.
Langmuir surface Langmuir surface Pore volume Crystallographic
area (m2/g) area (m2/cm3) (cm3/g) density (g/cm3)
Ni2(dobdc) 1574 1881 0.56 1.195
Co2(dobdc) 1433 1681 0.51 1.169
Mg2(dobdc) 1957 1779 0.69 0.909
HKUST-1 2190 1929 0.77 0.881
PCN-14 2360 1956 0.83 0.819
MOF-5 3961 2460 1.4 0.621
AX-21 Carbon 4880 2377 1.64 0.487
S-13Electronic Supplementary Material (ESI) for Chemical Science
This journal is © The Royal Society of Chemistry 2014
4. High-pressure gas adsorption measurements
High-pressure adsorption isotherms in the range of 0-100 bar were measured on a
HPVA-II-100 from Particulate Systems, a Micromeritics company. In a typical measurement,
0.3-0.7 g of activated sample was loaded into a tared 2 mL stainless steel sample holder inside a
glove box under a N2 atmosphere. Prior to connecting the sample holder to the VCR fittings of
the complete high-pressure assembly inside the glove box, the sample holder was weighed to
determine the sample mass.
The fully assembled sample holder was transferred to an ASAP 2020 low-pressure
adsorption instrument, fitted with an isothermal jacket, and evacuated at the material’s original
activation temperature for at least 1 h. Then, a 77 K N2 adsorption isotherm was measured. This
was used to verify that the high-pressure sample mass was correct and the sample was still of
high quality by comparing the resulting Langmuir surface area to the expected value (Figs. S7-
S15). Note that a specially designed OCR adapter was used to connect the stainless steel high-
pressure adsorption cell directly to the ASAP 2020 analysis port, allowing the measurement of
accurate low-pressure isotherms on the exact same samples used for high-pressure measurements
in the same sample holders.
The sample holder was then transferred to the HPVA-II-100, connected to the instrument’s
analysis port via an OCR fitting, and evacuated at room temperature for at least 1 h. The sample
holder was placed inside an aluminum recirculating dewar connected to a Julabo FP89-HL
isothermal bath filled with Julabo Thermal C2 fluid, for which the temperature stability is
± 0.02 °C. Note that while the majority of the sample holder is placed inside the temperature bath
(analysis zone), there is still a significant volume that is exposed to the air (ambient zone) and is
affected by fluctuations in room temperature (Fig. S16). A small upper volume of the sample
holder above the analysis port is inside a temperature controlled heated enclosure, along with the
gas dosing manifold (manifold zone). While this setup is typical of most volumetric adsorption
instruments, it creates challenges in determining the free space (or empty volume) of the sample
holder that is in each temperature zone. Accurately determining these volumes is particularly
important because nonideality corrections have a significant temperature dependence that can
lead to large errors at higher pressures.
For measurements at room temperature, the ambient and analysis zones will be at the same
temperature. Since the dosing manifold volume is known accurately from volume calibrations
during manufacturing, He can be used to determine the total free space in the sample holder by
using the standard method of expanding from the dosing manifold to the evacuated sample
holder and recording the change in pressure, assuming He adsorption is negligible. Note that the
HPVA-II-100 is equipped with two pressure transducers: 1) a 100,000 torr GE Sensing
UNIK5000 series transducer (accuracy of ± 0.04% full scale), and 2) a 1000 torr transducer
(accuracy of ± 0.15% reading). The addition of the low-pressure transducer allows the He free
space measurement to be performed at lower pressures (0.7-0.8 bar), where He adsorption is
negligible for most materials.8
For measurements at non-ambient temperatures, it further becomes necessary to determine
both the volume of the sample holder that is at ambient temperature and the volume that is at the
analysis temperature. Note that there are several approaches to doing this.9 By default, the
commercial HPVA-II-100 software uses He to measure the total volume in both the ambient and
analysis temperature zones, with all volumes set to the ambient temperature. Then, the
temperature of the analysis zone is changed to the desired analysis temperature, and the resulting
S-14Electronic Supplementary Material (ESI) for Chemical Science
This journal is © The Royal Society of Chemistry 2014
change in He pressure is used to calculate the volume that is in the analysis temperature zone.
Unfortunately, the pressure changes that result from most temperature changes are relatively
small (especially for measurements near ambient temperature), and the 1000 torr transducer is
not accurate or stable enough to reliably determine the analysis volume using this method.
Indeed, small errors in the pressure readings were found to lead to large errors in the calculated
analysis volume, and consequently, large errors in the resulting isotherms, especially at the high
pressures where the temperature-dependent nonideality corrections are most significant (Fig.
S17).
Fig. S16 For the HPVA-II-100 high-pressure instrument, there are three distinct temperature
zones on the sample holder: 1) manifold zone inside a heated enclosure that contains both the
upper part of the sample of the sample holder (3.5 mL) and the calibrated dosing volume, 2)
ambient zone that is the upper portion of the sample holder outside of the constant temperature
analysis bath (5-6 mL), and 3) analysis temperature zone that is the lower portion of the sample
holder inside the constant temperature bath (4-5 mL).
Fig. S17 Using the default analysis routine of the HPVA software can lead to large errors in the
free space of the sample holder that is in each temperature zone, causing large errors in the
resulting adsorption isotherm, especially at the higher pressures where temperature dependent
nonideality corrections are most significant.
S-15Electronic Supplementary Material (ESI) for Chemical Science
This journal is © The Royal Society of Chemistry 2014
An alternative method, which was used here, is to determine the volumes of the ambient and
analysis temperatures zones for an empty sample holder. Since the portion of the sample holder
containing the sample is always fully immersed in the constant temperature bath and the bath is
always placed at the exact same height on the sample holder, the ambient volume will always be
constant, regardless of the amount of sample present. On the other hand, the analysis volume
will depend on the amount of sample present, but it can be easily determined by subtracting the
volume of the sample from the analysis volume of the empty sample holder. Here, the sample
volume is determined by subtracting the total free space of the filled sample holder from that of
the empty sample holder. The total free spaces of the empty or filled sample holders were
determined using ambient temperature He free space measurements, which were repeated 20
times and averaged. The analysis volumes of the empty sample holder were determined by
performing He free space measurements at each potential analysis temperature and calculated
using the ideal gas law with the measured total empty volume of the sample holder, the ambient
temperature, the analysis temperature, the He dose pressure, the He equilibrium pressure, the
known dosing manifold volume, and the dosing manifold temperature. It is worth noting that by
using this technique, it is only necessary to measure the He free space at ambient temperature for
a new sample, and it is not necessary to measure He free space at any other analysis
temperatures.
Other approaches to accounting for the different temperature zones are certainly possible, but
regardless of the exact method used, it is critical to ensure that background CH4 adsorption is
negligible, or at least properly corrected for, at all relevant pressures and temperatures. To this
end, background CH4 adsorption were measured for a sample holder containing 0.34 mL of glass
beads (similar in volume to a typical sample) at −25, 0, 25, 38, 50, 75, 100, and 150 °C. All
background measurements were repeated at least 3 times at each temperature. With the
exception of at −25 °C, background CH4 adsorption was less than ± 4 cm3STP at pressures from
0-100 bar. At 35 bar, the background CH4 adsorption was less than ± 1 cm3STP. This relatively
low background confirms that all volume and temperature calibrations are accurate, and provides
an estimate of the error of a typical measurement, which is inversely proportional to the sample
mass used. For instance, the error for a 0.5 g sample can be estimated a ± 2 cm3STP/g at 35 bar
and ± 8 cm3STP/g at 100 bar.
For the −25 °C background measurements, a significant negative background was observed,
which is most likely due to a temperature gradient between the analysis and ambient zones on the
sample holder (Fig. S19). This would affect the accuracy of nonideality corrections that assume
there is a sharp temperature change between the ambient and analysis temperature. However, the
background at −25 °C is consistent across several measurements, and as a result, it was fit with a
3rd order polynomial that was used to perform a background correction on all subsequent −25 °C
isotherms.
S-16Electronic Supplementary Material (ESI) for Chemical Science
This journal is © The Royal Society of Chemistry 2014
Fig. S18 Background CH4 adsorption isotherms at 0, 25, 38, 50, 75, 100, and 150 °C for the
HPVA sample holder containing 0.34 cm3 of glass beads.
Fig. S19 Background CH4 adsorption isotherms at −25 °C for the HPVA sample holder
containing 0.34 cm3 of glass beads. The black line represents a 3rd order polynomial fit to the
background adsorption that was subsequently applied as a correction to all isotherms at −25 °C.
The background adsorption is most like the result of a temperature gradient between the ambient
and analysis zones on the sample holder.
S-17Electronic Supplementary Material (ESI) for Chemical Science
This journal is © The Royal Society of Chemistry 2014
Fig. S20 Excess CH4 adsorption isotherms for Ni2(dobdc) at 25 °C from 0 to 100 bar repeated
eight times.
S-18Electronic Supplementary Material (ESI) for Chemical Science
This journal is © The Royal Society of Chemistry 2014
5. Crystallographic density calculations
Table S2 Summary of crystallographic density calculations.
Asymmetric Total mass of Z Unit cell Temp Density Crystal
unit asymmetric volume (°C) (g/cm3) structure
unit (g) (Å3) ref
-21
Ni2(dobdc) NiC4HO3 4.657 x 10 18 3898.3 22 1.195 10
Co2(dobdc) CoC4HO3 4.664 x 10⁻²¹ 18 3977.3 195 1.173 11
Mg2(dobdc) MgC4HO3 3.629 x 10⁻²¹ 18 3992.5 27 0.909 12
-20
HKUST-1 Cu3C18H6O12 1.608 x 10 16 18247.4 25 0.881 13
PCN-14 CuC15H7O4 1.882 x 10⁻²⁰ 36 22697.7 −183 0.829 5
-20
MOF-5 Zn4C24H12O15 1.066 x 10 8 17153.6 27 0.621 14
Note that all crystal structures were chosen to be as representative of the state of each metal-
organic framework during ambient temperature CH4 adsorption as possible, but in some cases,
there are potentially important differences:
• The unit cell volumes of Ni2(dobdc), Co2(dobdc), and Mg2(dobdc) are all taken from
crystal structures of the fully desolvated frameworks. Note that the Co2(dobdc) structure,
however, was at elevated temperature (195 °C).
• The unit cell volume of HKUST-1 is for the fully desolvated framework at 25 °C.
• The crystal structure of PCN-14 is for the solvated framework at 90 K. All solvent
molecules were removed for the calculation, but possible changes in unit cell volume
upon desolvation and warming to ambient in temperature are not accounted for.
• The unit cell volume of MOF-5 is for the fully desolvated framework at 27 °C.
• Since the activated carbon AX-21 is not crystalline, its density, ρbulk, was estimated at
0.487 g/cm3 based on the measured pore volume, Vp, from 77 K N2 adsorption
(1.64 cm3/g) and the skeletal density, ρsk, from a He free space measurement at 25 °C
(2.42 g/cm3) using the following equation:
ρsk
ρ bulk = (1)
ρskVp +1
To the best of our knowledge, this density calculation is the most appropriate for a
meaningful comparison with the volumetric uptakes of metal-organic frameworks as it
should represent the maximum achievable density of AX-21 in the absence of any
packing losses.
S-19Electronic Supplementary Material (ESI) for Chemical Science
This journal is © The Royal Society of Chemistry 2014
6. Excess CH4 adsorption isotherms
Fig. S21 Excess CH4 adsorption isotherms for Ni2(dobdc).
Fig. S22 Excess CH4 adsorption isotherms for Co2(dobdc).
S-20Electronic Supplementary Material (ESI) for Chemical Science
This journal is © The Royal Society of Chemistry 2014
Fig. S23 Excess CH4 adsorption isotherms for Mg2(dobdc).
Fig. S24 Excess CH4 adsorption isotherms for HKUST-1.
S-21Electronic Supplementary Material (ESI) for Chemical Science
This journal is © The Royal Society of Chemistry 2014
Fig. S25 Excess CH4 adsorption isotherms for PCN-14.
Fig. S26 Excess CH4 adsorption isotherms for MOF-5.
S-22Electronic Supplementary Material (ESI) for Chemical Science
This journal is © The Royal Society of Chemistry 2014
Fig. S27 Excess CH4 adsorption isotherms for AX-21.
S-23Electronic Supplementary Material (ESI) for Chemical Science
This journal is © The Royal Society of Chemistry 2014
7. Isotherm fitting
Prior to fitting the CH4 adsorption isotherms, experimentally measured excess adsorption
(nex) was converted to total adsorption (ntot) using total pore volumes (Vp; Table S1), as
determined from N2 isotherms at 77 K (P/P0 = 0.9), and the bulk gas density at each temperature
and pressure from the NIST Refprop database (Eqn 2).15
ntot = nex +Vp ⋅ ρ bulk ( P,T ) (2)
Total CH4 adsorption isotherms for each material were then fit with either a single- or dual-
site Langmuir equation (Eqn 3), where n is the total amount adsorbed in mmol/g, P is the
pressure in bar, nsat,i is the saturation capacity in mmol/g, and bi is the Langmuir parameter in
bar−1 for up to two sites 1 and 2. The Langmuir parameter can be expressed using Eqn 4, where
Si is the site-specific molar entropy of adsorption in J/mol•K, Ei is the site-specific binding
energy in kJ/mol, R is the gas constant in J/mol•K, and T is the temperature in K. The fitted
parameters for each adsorption isotherm can be found in Table S3. Plots of the total adsorption
isotherms with the corresponding single- or dual-site Langmuir fits can be found in Fig. S28-
S34. Note that isotherm data at all measured temperatures were fit simultaneously with one set
of parameters.
nsat,1b1P nsat, 2 b2 P
n= + (3)
1+ b1P 1+ b2 P
bi = e−Si /R e Ei ⋅1000/RT (4)
Table S3 Single- or dual-site Langmuir parameters for all isotherm fits.
Ni2(dobdc) Co2(dobdc) Mg2(dobdc) HKUST-1 PCN-14 MOF-5 AX-21
nsat,1 (mmol/g) 7.2 8.5 11.1 16.9 10.4 30.5 28.3
S1 (−R) 10.0 9.7 9.6 9.7 9.9 9.2 9.2
E1 (kJ/mol) 21.0 19.7 18.6 17.1 16.2 12.3 10.7
nsat,2 (mmol/g) 4.3 3.7 5.9 - 6.0 - 10.5
S2 (−R) 10.0 11.6 11.9 - 9.3 - 9.0
E2 (kJ/mol) 16.1 17.6 16.4 - 18.3 - 16.6
S-24Electronic Supplementary Material (ESI) for Chemical Science
This journal is © The Royal Society of Chemistry 2014
Fig. S28 Total CH4 adsorption isotherms for Ni2(dobdc) at −25, 0, 25, 38, 50, 75, 100, and
150 °C and the corresponding dual-site Langmuir fits (black lines). See Table S3 for the dual-site
Langmuir parameters.
Fig. S29 Total CH4 adsorption isotherms for Co2(dobdc) at −25, 25, 38, 50 °C and the
corresponding dual-site Langmuir fits (black lines). See Table S3 for the dual-site Langmuir
parameters.
S-25Electronic Supplementary Material (ESI) for Chemical Science
This journal is © The Royal Society of Chemistry 2014
Fig. S30 Total CH4 adsorption isotherms for Mg2(dobdc) at −25, 25, 38, 50 °C and the
corresponding dual-site Langmuir fits (black lines). See Table S3 for the dual-site Langmuir
parameters.
Fig. S31 Total CH4 adsorption isotherms for HKUST- at −25, 0, 25, 38, 50, 75, 100, and 150 °C
and the corresponding single-site Langmuir fits (black lines). See Table S3 for the single-site
Langmuir parameters.
S-26Electronic Supplementary Material (ESI) for Chemical Science
This journal is © The Royal Society of Chemistry 2014
Fig. S32 Total CH4 adsorption isotherms for PCN-14 at 17, 25, 38, 50 °C and the corresponding
dual-site Langmuir fits (black lines). See Table S3 for the dual-site Langmuir parameters.
Fig. S33 Total CH4 adsorption isotherms for MOF-5 at −25, 25, 38, 50, 75, 100, and 150 °C and
the corresponding single-site Langmuir fits (black lines). See Table S3 for the single-site
Langmuir parameters.
S-27Electronic Supplementary Material (ESI) for Chemical Science
This journal is © The Royal Society of Chemistry 2014
Fig. S34 Total CH4 adsorption isotherms for AX-21 at −25, 25, 38, 50 °C and the corresponding
dual-site Langmuir fits (black lines). See Table S3 for the dual-site Langmuir parameters.
8. Isosteric heats of adsorption
Using the single- and dual-site Langmuir fits, the isosteric heat of adsorption can be
calculated for each material as a function of the total amount of CH4 adsorbed using the
Clausius-Clapeyron relation (Eqn 5). The isosteric heat of adsorption for a single-site Langmuir
model is constant by definition. For a dual-site Langmuir model, however, it is necessary to
derive an expression for the loading dependence of the isosteric heat of adsorption (Eqn 6).16
Note that, as written, Eqn 6 gives the isosteric heat of adsorption as a function of pressure, rather
than the amount adsorbed. To calculate the isosteric heat of adsorption for evenly spaced
loadings, Mathematica was used to solve each dual-site Langmuir equation at 25 °C for the
pressures that correspond to specific loadings, and these calculated pressures were then used in
Eqn 6 to determine the heat of adsorption as a function of the total amount of CH4 adsorbed
(Fig. 5).
# ∂ln P &
−Qst = RT 2 % ( (5)
$ ∂T 'n
E1nsat,1b1 (1+b2 P )2 +E2 nsat,2 b2 (1+b1P )2
−Qst = nsat,1b1 (1+b2 P )2 +nsat,2 b2 (1+b1P )2
(6)
S-28Electronic Supplementary Material (ESI) for Chemical Science
This journal is © The Royal Society of Chemistry 2014
9. PCN-14 literature comparison
Fig. S35 Comparison of the excess CH4 adsorption isotherms at 17 °C for PCN-14 as originally
reported in Ref. 5 and as measured in this work.
Fig. S36 Comparison of the total CH4 adsorption isotherms at 17 °C for PCN-14 as originally
reported in Ref. 5 and as measured in this work.
S-29Electronic Supplementary Material (ESI) for Chemical Science
This journal is © The Royal Society of Chemistry 2014
Fig. S37 Comparison of the CH4 isosteric heats of adsorption for PCN-14 as originally reported
in Ref. 5 and as measured in this work.
S-30Electronic Supplementary Material (ESI) for Chemical Science
This journal is © The Royal Society of Chemistry 2014
10. CH4 uptake vs. surface area
Fig. S38 There is a moderate correlation between gravimetric surface area and total gravimetric
CH4 adsorption at 25 °C and 35, 65, and 100 bar for M2(dobdc) (M = Ni, Co, Mg), PCN-14,
HKUST-1, and AX-21.
Fig. S39 There is little correlation between volumetric surface area and total volumetric CH4
adsorption at 25 °C and 35, 65, and 100 bar for M2(dobdc) (M = Ni, Co, Mg), PCN-14,
HKUST-1, and AX-21.
S-31Electronic Supplementary Material (ESI) for Chemical Science
This journal is © The Royal Society of Chemistry 2014
11. Usable CH4 capacity
Fig. S40 The gravimetric usable CH4 capacity as a function of desorption temperature for
adsorption at 25 °C and 35 bar and desorption at 5 bar.
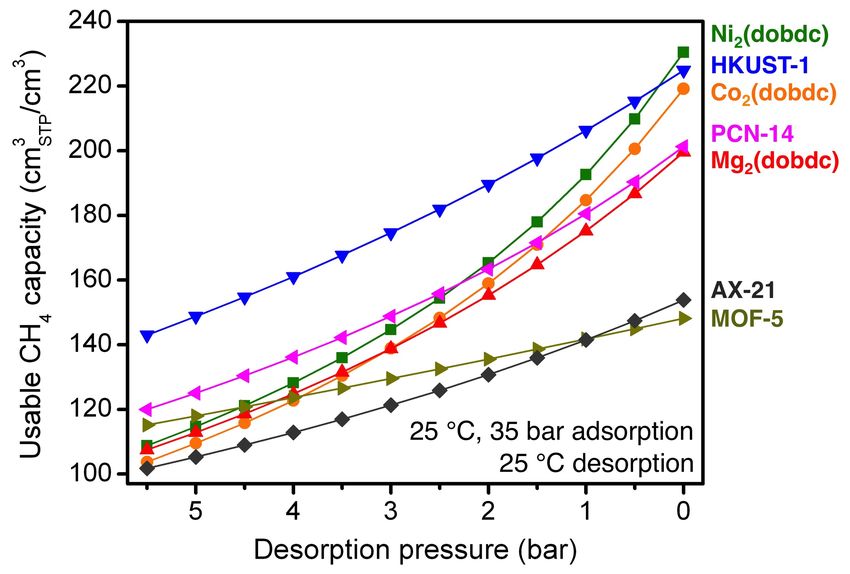
Fig. S41 The volumetric usable CH4 capacity as a function of desorption pressure for adsorption
at 25 °C and 35 bar and desorption at 25 °C.
S-32Electronic Supplementary Material (ESI) for Chemical Science
This journal is © The Royal Society of Chemistry 2014
Fig. S42 The gravimetric usable CH4 capacity as a function of desorption pressure for
adsorption at 25 °C and 35 bar and desorption at 25 °C.
Fig. S43 The volumetric usable CH4 capacity as a function of desorption temperature for
adsorption at −25 °C and 35 bar and desorption at 5 bar.
S-33Electronic Supplementary Material (ESI) for Chemical Science
This journal is © The Royal Society of Chemistry 2014
Fig. S44 The volumetric usable CH4 capacity as a function of desorption pressure for adsorption
at −25 °C and 35 bar and desorption at −25 °C and pressures from 5 to 0 bar.
Fig. S45 The gravimetric usable CH4 capacity as a function of adsorption pressure for
adsorption at 25 °C and pressures from 35 to 95 bar and desorption at 25 °C and 5 bar.
S-34Electronic Supplementary Material (ESI) for Chemical Science
This journal is © The Royal Society of Chemistry 2014
Fig. S46 The volumetric usable CH4 capacity as a function of adsorption pressure for adsorption
at 25 °C and pressures from 35 to 95 bar and desorption at 25 °C and 5 bar.
S-35Electronic Supplementary Material (ESI) for Chemical Science
This journal is © The Royal Society of Chemistry 2014
12. HKUST-1 pore window adsorption site
Fig. S47 View of a CD4 molecule adsorbed at one octahedral cage window site of HKUST-1
that highlights the close interactions of CD4 with framework O atoms, which are in the range of
2.7-3.2 Å. Green, gray, red, and light blue spheres represent Cu, C, O, and D atoms,
respectively; H atoms have been omitted for clarity. The atomic coordinates are taken from a
powder neutron diffraction structure at 4 K with a loading of 1.1 CD4 per Cu2+.17
S-36Electronic Supplementary Material (ESI) for Chemical Science
This journal is © The Royal Society of Chemistry 2014
13. Optimal binding enthalpy
Using a single-site Langmuir model, it is possible to calculate the optimal binding enthalpy
for maximizing the usable capacity for a given set of adsorption-desorption conditions.18 In this
simple model, it is assumed that the pore surface contains one type of adsorption site with a
maximum capacity of nsat, a binding energy of E, and a molar entropy of adsorption of S. Based
on this, the usable capacity can be calculated for different adsorption pressures, Pads, and
temperatures, Tads, and desorption pressures, Pdes, and temperatures, Tdes (Eqn 7). Here,
adsorption was assumed to be at 35 bar and 25 °C, while desorption was at 5 bar and
temperatures ranging from 25 to 145 °C. The usable capacity can then be calculated at different
binding energies, assuming a constant S.
For CH4, S is often assumed to be near −9.5R, however, there is a correlation between
adsorption enthalpy and entropy, whereby as the binding energy increases, the entropy also
increases.19 This enthalpy-entropy correlation results in higher optimal binding energies than
would otherwise be predicted, but the relationship between desorption temperature and optimal
binding enthalpy is unchanged. To illustrate the affects of the enthalpy-entropy correlation, the
percentage of the saturation capacity that is usable (nusable/nsat) is plotted as a function of binding
energy and desorption temperature using a molar entropy of adsorption of −9.5R (Fig. 7) and
10.5R (Fig. S48). The optimal binding energy at each desorption temperature occurs at the
maximum of each curve. For example, the optimal binding energies for 25 °C desorption are
−17.1 kJ/mol and −19.6 kJ/mol for entropies of −9.5R and −10.5R, respectively.
nsat e−S/R e E⋅1000/RTads Pads nsat e−S/R e E⋅1000/RTdes Pdes
nusable = − (7)
1+ e−S/R e E⋅1000/RTads Pads 1+ e−S/R e E⋅1000/RTdes Pdes
Fig. S48 Assuming a single-site Langmuir isotherm, the percentage of the saturation capacity
that is usable is plotted for isosteric heats of adsorption, Qst, ranging from 10 to 25 kJ/mol and
desorption temperatures from 25 to 145 °C, with adsorption at 35 bar, desorption at 5 bar, and a
molar entropy of adsorption of −10.5R. As the desorption temperature increases, the optimal Qst
and usable capacity also increase. Note that the higher entropy value leads to higher optimal
binding enthalpies (see Fig. 7 for comparison).
S-37Electronic Supplementary Material (ESI) for Chemical Science
This journal is © The Royal Society of Chemistry 2014
14. References
(1) Y.-H. Kim, H.-C. Jeong, S.-H. Kim, K. Yang and S.-K. Kwon, Adv. Funct. Mater., 2005,
15, 1799.
(2) (a) S. R. Caskey, A. G. Wong-Foy and A. J. Matzger, J. Am. Chem. Soc., 2008, 130,
10870. (b) E. D. Bloch, L. M. Murray, W. L. Queen, S. Chavan, S. N. Maximoff, J. P.
Bigi, R. Krishna, V. K. Peterson, F. Grandjean, G. J. Long, B. Smit, S. Bordiga, C. M.
Brown and J. R. Long, J. Am. Chem. Soc., 2011, 133, 14814.
(3) J. A. Mason, K. Sumida, Z. R. Herm, R. Krishna and J. R. Long, Energy Environ. Sci.,
2011, 4, 3030.
(4) N. C. Jeong, B. Samanta, C. Y. Lee, O. K. Farha and J. T. Hupp, J. Am. Chem. Soc.,
2012, 134, 51.
(5) S. Ma, D. Sun, J. M. Simmons, C. D. Collier, D. Yuan and H.-C. Zhou, J. Am. Chem.
Soc., 2008, 130, 1012.
(6) S. S. Kaye; A. Dailly, O. M. Yaghi, and J. R. Long, J. Am. Chem. Soc., 129, 14176.
(7) K. S. Walton and R. Q. Snurr, J. Am. Chem. Soc., 2007, 129, 8552.
(8) P. Malbrunot, D. Vidal, J. Vermesse, R. Chahine and T. K. Bose, Langmuir, 1997, 13,
539.
(9) (a) S. Sircar, Ind. Eng. Chem. Res., 1999, 38, 3670. (b) S. Sircar, AIChE J., 2001, 47,
1169. (c) K. Murata, M. El-Merraoui and K. Kaneko, J. Chem. Phys., 2001, 114, 4196.
(d) A. L. Myers and P. A. Monson, Langmuir, 2002, 18, 10261. (e) D. D. Do and H. D.
Do, Carbon, 2003, 41, 1777. (f) S. Gumma and O. Talu, Langmuir, 2010, 26, 17013.
(10) P. D. C. Dietzel, B. Panella, M. Hirscher, R. Blom and H. Fjellvåg, Chem. Commun.,
2006, 959.
(11) P. D. C. Dietzel, R. E. Johnsen, R. Blom and H. Fjellvåg, Chem. Eur. J., 2008, 14, 2389.
(12) W. L. Queen, C. M. Brown, D. K. Britt, P. Zajdel, M. R. Hudson and O. M. Yaghi, J.
Phys. Chem. C., 2011, 115, 24915.
(13) Y. Wu, A. Kobayashi, G. J. Halder, V. K. Peterson, K. W. Chapman, N. Lock, P. D.
Southon and C. J. Kepert, Angew. Chem. Int. Ed., 2008, 47, 8929.
(14) W. Zhou, H. Wu, T. Yildirim, J. R. Simpson and A. R. Hight Walker, Phys. Rev. B, 2008,
78, 054114.
(15) (a) E. W. Lemmon, M. L. Huber and M. O. McLinden, NIST Standard Reference
Database 23: Reference Fluid Thermodynamic and Transport Properties-REFPROP,
Version 8.0, National Institute of Standards and Technology, Standard Reference Data
Program, Gaithersburg, 2007. (b) U. Setzmann and W. Wagner, J. Phys. Chem. Ref.
Data, 1991, 20, 1061.
(16) P. M. Mathias, R. Kumar, J. D. Moyer, Jr., J. M. Schork, S. R. Srinivasan, S. R. Auvil
and O. Talu, Ind. Eng. Chem. Res., 1996, 35, 2477.
(17) S. Cavenati, C. A. Grande, A. E. Rodrigues, C. Kiener, and U. Müller, Ind. Eng. Chem.
Res., 2008, 47, 6333.
(18) S. K. Bhatia and A. L. Myers, Langmuir, 2006, 22, 1688.
(19) E. Garrone, B. Bonelli and C. Otero Areán, Chem. Phys. Lett., 2008, 456, 68.
S-38You can also read