Robeco Global Consumer Trends - Review current situation and long term positioning - ClickDimensions
←
→
Page content transcription
If your browser does not render page correctly, please read the page content below

Robeco Global Consumer Trends
     Review current situation and long term positioning
    Name presenter
    March 2020
    Date

For professional investors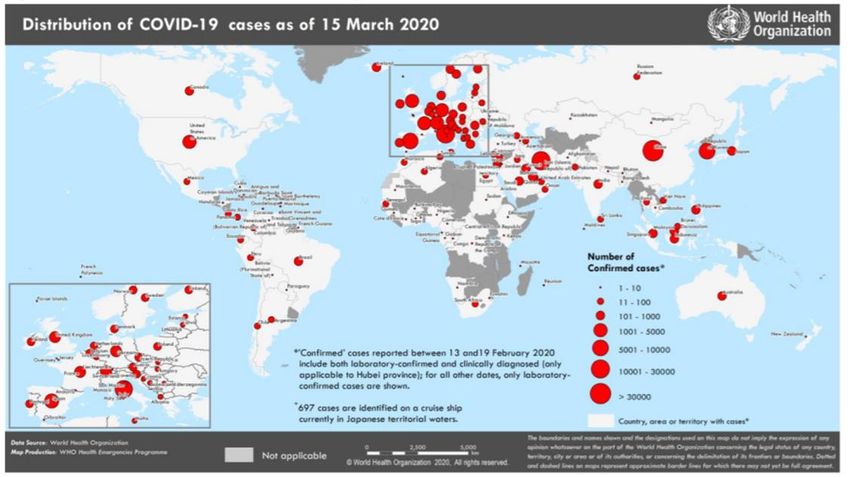
Agenda

Review
> What do we see in current markets

Positioning
> What works well/ what doesn’t

Outlook
> What to do next?

Regular product presentation
> for reference and more background

2                                     Robeco Global Consumer Trends | Robeco Global Consumer Trends
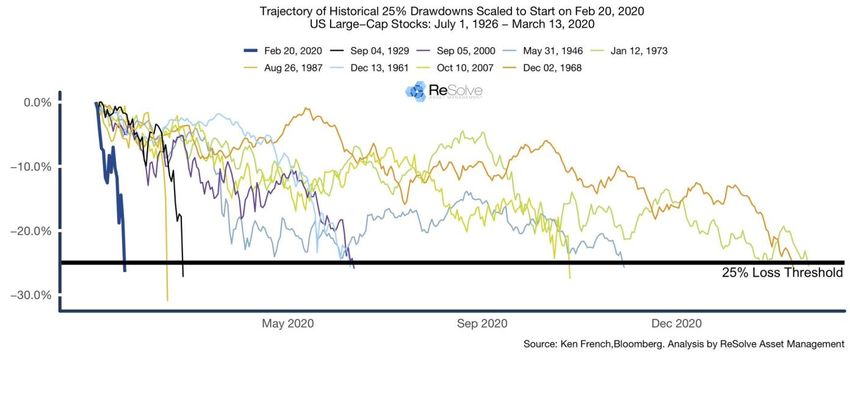
Review: what do we see in current markets?

Extremely volatile and negative markets
> Markets go up -and mostly- down with high percentage moves
> Markets hope for fiscal stimulus; low interest rates is not enough to stabilize sentiment and/ or economy
> Consumer spending is found in structurally attractive sectors, less cyclical, more downside protection
> Consumer sentiment is negatively impacted and people distance themselves;
> Later -when the number of Corona cases slows down- a low oil price and fiscal stimulus might help spending again

3                                                Robeco Global Consumer Trends | Robeco Global Consumer Trends
Review: what do we see in current markets?

What about Robeco Global Consumer Trends?
> Negative absolute returns yet strong outperformance YTD and MTD
> Growth/ quality outperforms cyclical value significantly again; less impacted by recession fears
> Some parts of consumer spending are clearly impacted by the market volatility (luxury, travel, retail)
> Other parts show stronger resilience (home entertainment, food delivery, staples, India )

Not in our portfolio:
> Structurally avoidance of cyclical sectors like banks, energy, airlines, cars
> Only Strong Brand retail; however still impacted (in portfolio Apple, Starbucks, Nike, Adidas)
> Sold in second half of 2019: Carnival, Booking, Sands China

4                                                  Robeco Global Consumer Trends | Robeco Global Consumer Trends
Positioning: different buckets in portfolio; diversified approach

Main worries
> Luxury, cosmetics (due to travel)
                                                                                         Long term positioning is confirmed and even helping in
> Retail
                                                                                                            current markets
> Live Events
                                                                                           We buy gradually and selectively, no drastic portfolio
Relatively strong                                                                                           changes needed
> Staples
                                                                                             Our diversified and quality approach is essential in
> India/ China
                                                                                                               nervous times
> Home entertainment
> Food delivery
> Companies with strong balance sheets

Current and longer term “ structural changes” due to the virus
> Digital payments
> Ecommerce
> Cloud, working from home etc.
> Food delivery
> Health awareness
5                                                  Robeco Global Consumer Trends | Robeco Global Consumer Trends
Outlook: What to do next?
Current markets provide a buying opportunity, but we advise gradual buying into equities/ time diversification

Invest now in equities? Yes, but cautiously using a step by step approach (timing a bottom is impossible)
> In extremely volatile markets it can help to maintain a view on structural positioning, away from daily volatility
    1. Maybe hard to imagine today, but the Corona theme will also fade off one point in time
    2. The effect on sentiment and economic growth will however remain significant
    3. The market is hoping for fiscal stimulus
    4. As the markets have sold off with unprecedented velocity, most investors have automatically gone relatively low in equities,
        compared to their long term desired allocation
    5. History has taught investors that it is important to stick to their long term allocations and diversify their portfolios

6                                                 Robeco Global Consumer Trends | Robeco Global Consumer Trends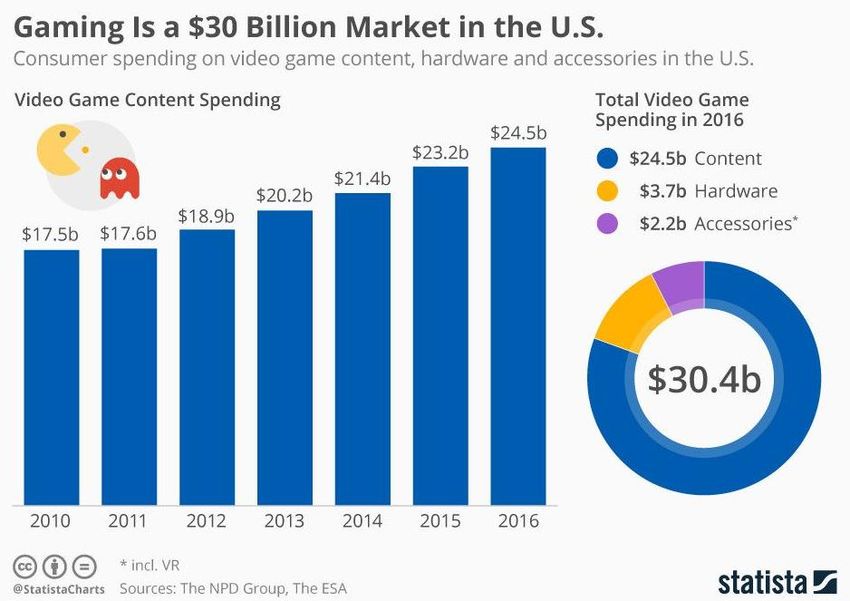
Outlook: What to do next? Current markets provide a buying opportunity, but we advise gradual buying into equities/ time diversification Why Robeco Global Consumer Trends? > Well diversified approach; portfolio of quality compounders benefitting from structural changes in consumer spending > Very strong long term track record, especially well in low growth environments. Positive up AND down market capture. > Also YTD the fund outperforms strongly again despite worries on recession, travel, luxury, retail etc. > Quality companies with compounding characteristics are expected to recover more quickly once sentiment turns positive. These are companies investors know and trust and that have strong balance sheets. Investors might also prefer liquid stocks. Main (relative) risks > Main risk in terms of relative performance is actually an (unexpected) strong improvement in economic climate and strongly rising interest rates. In such an environment investors will favor cyclical value above structural growth/ quality 7 Robeco Global Consumer Trends | Robeco Global Consumer Trends

Robeco Global Consumer Trends
    Focus, structural winners and a balanced approach

8                                    Robeco Global Consumer Trends | Robeco Global Consumer Trends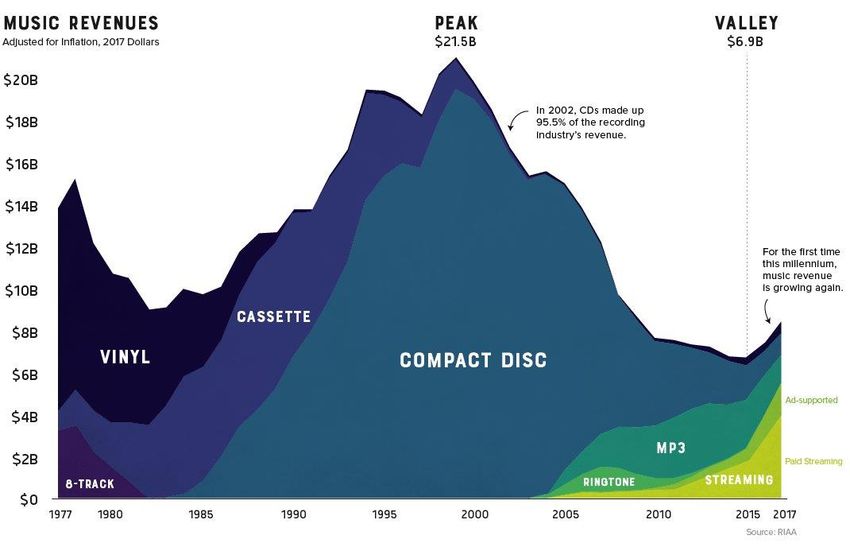
Introduction: Focus, structural winners and a balanced approach
Trends in consumer spending
> Identify strong secular global growth trends from a consumer perspective
> Focus on three strong trends to provide risk diversification:
1. Digital consumer
2. Emerging consumer
3. Strong brands
Structural Winners
> Preference to invest in structural winners within their industry
> Focus on 50-70 most attractive stocks with higher quality and higher growth profile
Significant excess return compared to the MSCI AC World
> 6.5% annual excess performance over the past five years*
> Consistent first quartile performance versus peers on 1, 3, 5 and 10 year horizon**
> Assets under Management EUR 3,441 million/ USD 3,785 million (February 2020)
* CGF Robeco Global Consumer Trends Equities (EUR D-shares), gross of fees, based on Gross Asset Value. In reality costs (such as management fees and other costs) are charged. These have a negative effect on the returns shown.
Source: Robeco Global Performance Measurement. The value of your investments may fluctuate. Results obtained in the past are no guarantee for the future.
** Source Morningstar Direct, net of fees, EUR
© 2018 Morningstar, Inc. All Rights Reserved. The information contained here in: (1) is proprietary to Morningstar; (2) may not be copied or distributed; and (3) is not warranted to be accurate, complete or timely. Neither Morningstar nor its
content providers are responsible for any damages or losses arising from any use of this information. Past performance is no guarantee of future results.
9 Robeco Global Consumer Trends | Robeco Global Consumer Trends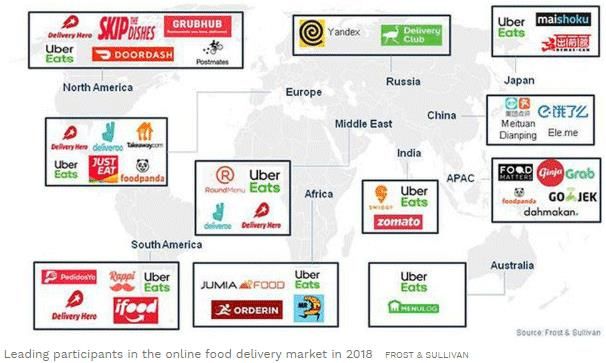
Index

Robeco Global Consumer Trends
Investment Team
Investment philosophy & process
Track record & portfolio positioning
Appendix

10                                     Robeco Global Consumer Trends | Investment Team
Investment team: Seasoned growth investors

Jack Neele
>    20 years investment experience
>    At Robeco since 2006
>    Portfolio manager of GCT since 2007
>    Portfolio Manager at Generale Bank and Fortis MP before
>    Long-term, bottom-up growth investor

Richard Speetjens
>    19 years investment experience
>    At Robeco since 2007
>    Portfolio manager of GCT since 2010
>    Managing European Equities at Philips Pension fund and van Lanschot before
>    Bottom-up investor

11                                                Robeco Global Consumer Trends | Investment Team
Collective expertise: Long tenure, stability, strong culture of collaboration

12                                  Robeco Global Consumer Trends | Investment Team
Proprietary Trend research

Broad array of topics
> Strong Brands
> Emerging consumer
> Solar energy
> Fintech
> Robo-Advice
> Mobile payments in emerging markets
> Disruption of business models
> Artificial intelligence
> Self-driving cars
> Electrical vehicles
> E-Sports
> Internet of things

13                                      Robeco Global Consumer Trends | Investment Team
Index

Robeco Global Consumer Trends
Investment Team
Investment philosophy & process
Track record & portfolio positioning
Appendix

14                                     Robeco Global Consumer Trends | Index
Investment philosophy

We believe in
>    Investing in three long-term growth trends to provide diversification without sacrificing returns

>    Investing in pure play exposure to these growth trends

>    Investing in proven businesses instead of stocks

>    A preference for structural winners with an “unfair“ competitive advantage

>    Investing according to conviction level instead of versus a index

15                                                   Robeco Global Consumer Trends | Investment philosophy & process
Structural winners & market dominance

Structural winners                                                                        Disney’s pricing power
>     Companies who have a competitive advantage compared to the                          Since 2000, the price for admission to Disneyland Resort has nearly tripled
      competition through either:
                                                                                           $160
      >      A higher quality product or service;                                                                                                                        $149
      >      A superior brand name;
      >      A scale advantage;
      >      The ability to charge premium prices;                                         $120
      >      Other (e.g. lower cost of production, etc.)

>     This enables these companies to earn a superior return on capital which –
      according to us – will prove to be sustainable over time                              $80

Example of market dominance: Walt Disney
                                                                                                     $43
>     Walt Disney’s empire ranges from film studios like Disney and Pixar, to
      sport network ESPN and of course the world famous Disney Theme Parks.                 $40
>     Given their dominant position in the theme park industry and the well
      known characters in the parks, Disney has been able to more than triple
      admission prices in the last 18 years
>     Walt Disney’s operating income nearly doubled in last 10 years from USD                 $0
      7.4bn to USD 14.2bn, driven by theme parks and media networks                                   '00 '01 '02 '03 '04 '05 '06 '07 '08 '09 '10 '11 '12 '13 '14 '15 '16 17 18

Source: Orange Country Register archives; Robeco

16                                                         Robeco Global Consumer Trends | Investment philosophy & process
Investment process: Combine top-down and bottom-up insights
Trend Determine Identify Portfolio
selection trend exposure structural winners construction
Identify global longer- term Identify companies Conduct in-depth Construct portfolio in line
growth trends from a across sectors that fundamental, ESG and with investment
consumer perspective clearly benefit from the valuation analysis guidelines. Position size
longer term trends based on conviction level
750-800 stocks 200-250 stocks 100-120 stocks 50-70 stocks
17 Robeco Global Consumer Trends | Investment philosophy & processPerformance drivers
We aim to add alpha, not risk:
1) Identifying top-down trends which:
> Exhibit secular growth
> Offer alpha generating opportunities
> Provide opportunities across sectors and regions
> Growth is under-estimated in the long term
2) Selecting stocks that have:
> Pure play exposure to a secular growth trend
> An “unfair” competitive advantage
> A largely untapped market opportunity
18 Robeco Global Consumer Trends | Investment philosophy & processTrend selection: Combining multiple attractive trends
Trend breakdown Global Consumer Trends
1) Digital consumer 100%
90%
80%
2) Emerging consumer
70%
60%
3) Strong brands
50%
40%
30%
We believe combining secular growth trends 20%
in a diversifying way leads to an attractive
long term risk-return profile 10%
0%
Other Strong Brands Emerging Consumer Digital Consumer
Source Robeco. Data as of end December 2019.
19 Robeco Global Consumer Trends | Investment philosophy & processDynamic positioning over time – example digital consumer
250.00
225.00
200.00
175.00
150.00
125.00
100.00
75.00
Robeco Global Consumer Trends Equities D-share (EUR)
50.00
25.00
2009
2010
2011
2012
2013
2014
2015
2016
2017
2018
2019
20 Robeco Global Consumer Trends | Investment philosophy & processStreaming
Consumers prefer streaming subscription-based services
> Relatively low monthly payments
> Ease of use (mobile app, cancellation policy, etc.)
Video
> Over-the-top (OTT) solutions are becoming mainstream with Netflix (167
million global subscribers) the market leader
> Competition for streaming video content is rising (YouTube, Facebook, Amazon
Prime Video, Hulu, etc.)
Source: Ark Investments, 2020
> Premium content owners (Walt Disney, 21st Century Fox) focus on live events
(sports, news) to remain relevant
Music
> The music industry is finally showing growth again driven by streaming
services (free ad-based services or premium subscriptions)
> Spotify (>124 million paid subscribers) has a rich content library combined
with a unique ability to match artists, songs and playlists to users’ tastes –
delivered seamlessly across platforms.
21 Robeco Global Consumer Trends | Investment philosophy & processDigital consumer: Payments We’re still early in the digital payments race > Cash is still the dominant payment form > PayPal, the largest online and mobile payment platform, is currently mostly used in e-commerce transactions > Small and medium sized businesses take advantage of innovative payment offerings like Square > Customer adoption of digital wallets remains low as changing consumer habits is a long and difficult process Peer-to-peer (P2P) payments popular with millennials > Venmo, owned by PayPal, processed about USD 100 bln in payment volumes last year > Per year, millions of payments are sent with just a single emoji like or Visa & Mastercard remain in control > PayPal, Square or Apple Pay: all new payment forms make use of the existing payment infrastructure 22 Robeco Global Consumer Trends | Investment philosophy & process
Digital consumer: Gaming

The video game industry has become more attractive to investors
> Historically revenues were very lumpy (hit-or-miss games) but developers are now
   focusing on building long term franchises
> Digital downloads cut out the middle man (video game retailer or electronics store)
   leading to higher profitability

Many new monetization opportunities
> Incremental revenues from the sale of virtual items or in-game add-ons (new levels)
  through micro transactions
> Mobile games offer developers the opportunity to attract high margin advertising
  dollars

eSports a future growth driver
> eSports is a professional video gaming competition
> The final of League of Legends was played in Beijing with 73 million viewers live
   streaming the event (for minimal 1 hour)
> Twitch.tv, owned by Amazon, is the leading streaming video game platform. It
   attracts more daily viewers than CNN (!)

23                                                 Robeco Global Consumer Trends | Investment philosophy & process
Digital consumer: On-line food delivery

Food delivery market moving online
     >   Share of online in total food delivery orders still low at ca 10-20%
     >   Global market growth ca 15% driven by online shift and additional delivery
         frequency
Different business models, different economics
     >   Marketplace model, by offering access to multiple restaurants on single online
         portal. Asset light model and rapid in market consolidation led to market
         leaders with high margins, eg TakeAway.com, Just Eat and Delivery Hero
     >   Food delivery platforms, which do the actual delivery such as Uber Eats,
         Deliveroo and Doordash. Asset heavy business model and high delivery costs
         mean less favorable economics
     >   Business models are increasingly converting
Why now?
     >   Rapid in-market consolidation like Germany, China and South Korea
     >   Food delivery platforms increased focus on profitability means more rational
         competition

>
24                                                    Robeco Global Consumer Trends | Investment philosophy & process
Trend selection: Digital consumer Source Robeco. This is not a buy, sell or hold recommendation for any particular security. The information is for illustrative purposes only. No representation is made that these examples are past or current recommendations, that they should be bought or sold, nor whether they were successful or not. 25 Robeco Global Consumer Trends | Investment philosophy & process
Trend selection: Emerging consumer

     The Asian consumer will surpass
     the US consumer by 2022

Emerging consumption potential
>    Emerging markets are an attractive asset class because of their higher growth
     prospects compared with developed markets
>    Asia-Pacific is the most promising region from a long-term consumption perspective
>    As incomes rise consumer preferences change from basic necessities to more
     discretionary items
Diversification is key
>    Because emerging markets tend to be more cyclical & volatile, we seek a
     combination of both direct & indirect exposure
>    Local firms generally have better knowledge about the customer base and often
     have distinctive products that appeal more to local tastes
>    International luxury goods companies are in prime position to benefit

26                                                 Robeco Global Consumer Trends | Investment philosophy & process
Emerging consumer – India
The biggest growth story in emerging markets
> Consumption expenditures expected to triple to $4 trillion by 2025, making India the
third-largest consumer market
> Rising affluence is the biggest driver of increasing consumption
> Urbanization is another driver: the migration to urban centers is not concentrated in
a few cities as much of this growth will take place in – currently – small towns
> Shifting family structures will also play a role as the extended joint family is giving
way to regular households (singles or couples) that spend 20-30% more per capita
Shifting growth drivers for consumption
> For many consumer companies increasing market penetration (better availability)
has been the biggest driver of growth
> As incomes rise Indian consumers are expected to trade up towards higher- quality,
higher-price products and will shop more frequently
> Elite and affluent households will spend more on both basic categories (like biscuits)
and discretionary products and/or services (like restaurants or travel)
27 Robeco Global Consumer Trends | Investment philosophy & processTrend selection: Emerging consumer Source Robeco. This is not a buy, sell or hold recommendation for any particular security. The information is for illustrative purposes only. No representation is made that these examples are past or current recommendations, that they should be bought or sold, nor whether they were successful or not. 28 Robeco Global Consumer Trends | Investment philosophy & process
Strong brands – Global powerbrands

Global Powerbrands
A strong brand is one of the most powerful and durable competitive
advantages

>    Very high customer loyalty
>    Consumers are less sensitive to price increases
>    Better product quality
>    Word of mouth (lower advertising cost)

Digital savviness an important differentiator
>    Many firms use social media and online brand influencers to
     position their brands with younger consumers
>    Cosmetics firms with exposure to the premium beauty market
     are in prime position to benefit from the experience seeking
     ‘selfie generation’

29                                                     Robeco Global Consumer Trends | Investment philosophy & process
Strong brands: Healthy lifestyle Millennials & Gen Z exercise more and have a healthier lifestyle > They use fitness trackers & smart watches to track training data & health information > They are willing to spend more money on compelling sporting goods and athleisure brands > Young consumers eat more natural and organic foods with healthier ingredients and fresh herbs & spices. Consumer health & hygiene > We like companies with more predictable revenue & profit streams, as they add a defensive element to our portfolio > Many of these firms show countercyclical behavior in the sense that their stock prices tend to outperform the overall market especially in times of market weakness 30 Robeco Global Consumer Trends | Investment philosophy & process
Trend selection: Strong brands

Source Robeco. This is not a buy, sell or hold recommendation for any particular security. The information is for illustrative purposes only.
No representation is made that these examples are past or current recommendations, that they should be bought or sold, nor whether they were successful or not.

31                                                                                     Robeco Global Consumer Trends | Investment philosophy & process
Trend selection: Outlook
Three trends that are shaping consumers’ spending preferences

Food Delivery
    > Online food ordering and delivery is a relatively young market
    > After heavy investments, consolidation is happening
    > Small number of dominant players will emerge
    > Controling delivery costs will be key

Humanization of Pets
   > Pet-owning households is rising globally
   > Amount of money spent is increasing
   > Pet spending is moving on-line

Streaming Wars
    > Recent initiatives can reshuffle the cards (Netflix, Apple, Disney)
    > Streaming music represents almost 50% of total music revenues
    > Changing business models lead to new opportunities (concert promotion,
    operating venues or selling tickets)

Source Robeco. This is not a buy, sell or hold recommendation for any particular security. The information is for illustrative purposes only.
No representation is made that these examples are past or current recommendations, that they should be bought or sold, nor whether they were successful or not.

32                                                                                     Robeco Global Consumer Trends | Investment philosophy & process
Stock selection: Fundamental analysis Companies are investigated on different criteria: > Quality and sustainability of business model > Competitive environment and industry growth > Management skills and track record > ESG profile Inputs for fundamental analysis: > Company meetings (around 100 per annum) > Annual reports and press releases > In-house analysts > Conferences > Industry sources > General press, weblogs, twitter etc. 33 Robeco Global Consumer Trends | Investment philosophy & process
Stock selection: Robeco proprietary tools

1) Value Dynamic Framework (VDF)
        > Proprietary valuation model* based on cash economic drivers of value creation
        > Output is a price target which is the sum of invested capital and PV of future economic value

2) Proprietary Quantitative Stock Selection Model
        > Based on long-term proven variables backed by behavioral finance theory
        > Stocks ranked on valuation, momentum, earnings revisions and responsible management**
        > Used as an idea generator and sanity check

3) Sustainable Investing incorporated in investment and decision making process
        > RobecoSAM sustainability scores
        > Robeco Environmental, Social and Corporate Governance Policy
        > Robeco Exclusion Policy

* Historical data from Holt
** Including sustainability score

34                                                     Robeco Global Consumer Trends | Investment philosophy & process
Portfolio construction: Portfolio principles No index for portfolio construction purposes Position size based on conviction and risk characteristics > Standard initial position is 1%, average position 2% and maximum 5% > Portfolio weights are based on conviction level > Conviction level typically determined by length and consistency of the company’s track record > Companies with more cyclical/volatile characteristics are kept at a below average weight Buy / sell discipline: > Buy exposure towards growth trends > Buy companies with sound business models, strong cash flows, trend exposure > Sell companies when fundamental case is broken 35 Robeco Global Consumer Trends | Investment philosophy & process
Risk management: Internal guidelines

Measures of risk                                                                                         Portfolio limits

                                       >     Monitoring relative VAR* (maximum 150%)
Risk management                                                                                          Position size                   > Minimum: 1%, maximum: 5%
                                       >     Liquidity screening

                                       >     Quarterly portfolio review meeting Head of                                                  > Maximum direct exposure to emerging markets:
Management review                                                                                        Country
                                             Investments                                                                                   30%

                                       >     Monitoring client and portfolio manager
                                                                                                                                         > Maximum 5% (for trading purposes and cash
Compliance                                   restrictions                                                Cash
                                                                                                                                           flow)
                                       >     Pre-trade and post-trade warnings

* 1-month horizon, 99% confidence interval

36                                                                     Robeco Global Consumer Trends | Investment philosophy & process
Index Robeco Global Consumer Trends Investment Team Investment philosophy & process Track record & portfolio positioning Appendix 37 Robeco Global Consumer Trends | Index
Track record (D EUR share class)

Annualized returns Robeco Global Consumer Trends                                                                                                                                                                                    28-02-2020
                                                                                         YTD                             1-Year                           3-Year                             5-Year                           10-Year

Robeco Global Consumer Trends*                                                        -1.57%                            19.74%                            16.96%                            12.50%                            18.01%

Index**                                                                                -7.10%                             7.69%                            5.78%                              5.99%                            10.56%

Excess return                                                                           5.53%                            12.05%                            11.17%                             6.51%                             7.46%

Beta                                                                                                                                                         0.93                              0.94                              0.96

Calendar year returns Robeco Global Consumer Trends

                                                                                        2019                              2018                              2017                              2016                              2015

Robeco Global Consumer Trends*                                                        37.73%                             3.06%                            23.33%                             1.32%                            17.44%

Index**                                                                                28.93%                            -4.85%                            8.89%                             11.09%                             8.76%

Excess return                                                                           8.81%                             7.91%                            14.43%                            -9.77%                             8.68%

Source: Robeco Global Performance Measurement. Figures for CGF Robeco Global Consumer Trends Equities (D-shares), gross of fees, based on Net Asset Value, all figures in EUR. In reality costs (such as management fees and other costs) are
charged. These have a negative effect on the returns shown.
*Fund name changed into Robeco Global Consumer Trends Equities as of January 15, 2011. Name was Robeco Consumer Trends Equities as of December 1, 2009 and was previously Consumer Goods Equities.
**Index is MSCI AC World. Performance data before January 2012 is compared with MSCI World.
The value of your investments may fluctuate. Results obtained in the past are no guarantee for the future.

38                                                                                      Robeco Global Consumer Trends | Track record & portfolio positioning
Track record (D USD share class)
Annualized returns Robeco Global Consumer Trends 28-02-2020
YTD 1-Year 3-Year 5-Year Since Dec-10
Robeco Global Consumer Trends* -3.68% 15.51% 18.25% 12.03% 13.88%
Index** -9.09% 3.89% 6.96% 5.55% 8.07%
Excess return 5.41% 11.62% 11.29% 6.48% 5.80%
Beta 0.97 0.96 1.01
Calendar year returns Robeco Global Consumer Trends
2019 2018 2017 2016 2015
Robeco Global Consumer Trends* 35.25% -1.89% 40.41% -1.63% 5.44%
Index** 26.60% -9.42% 23.97% 7.86% -2.36%
Excess return 8.65% 7.53% 16.43% -9.50% 7.80%
Source: Robeco Global Performance Measurement. Figures for CGF Robeco Global Consumer Trends Equities (D-shares), gross of fees, based on Net Asset Value, all figures in EUR. In reality costs (such as management fees and other costs) are
charged. These have a negative effect on the returns shown.
*Fund name changed into Robeco Global Consumer Trends Equities as of January 15, 2011. Name was Robeco Consumer Trends Equities as of December 1, 2009 and was previously Consumer Goods Equities.
**Index is MSCI AC World. Performance data before January 2012 is compared with MSCI World.
The value of your investments may fluctuate. Results obtained in the past are no guarantee for the future.
39 Robeco Global Consumer Trends | Track record & portfolio positioningPerformance characteristics: Upside and downside capture
Bull months (82) Bear months (39) Beta (5 yr)
Batting Average: 66% Batting Average: 69%
Global Consumer Trends Global Consumer Trends Global Consumer Trends
MSCI AC World MSCI AC World MSCI AC World
16% 34% 0.97
Stronger upside Reduced downside Comparable beta
vs index during bull months vs index during bear months vs index
Source: Robeco, Factset, since 1 December 2009 until end of December 2019, EUR. Based on CGF Global Consumer Trends Equities (EUR) D-share, gross of fees
The value of your investments may fluctuate. Results obtained in the past are no guarantee for the future.
40 Robeco Global Consumer Trends | Track record & portfolio positioningPeer Group* analysis (28-02-2020) *Reclassified by Morningstar into Global Large Cap Growth
> Strong absolute performances over 1, 3, 5 & 10 year horizon
> Strong performance versus peers over 1, 3, 5 & 10 year horizon
> Highest Sharpe ratio: highest performance per unit of risk
Morningstar category Global Equity Growth / Global Trends (N) Total return (month-end) EUR
3 Yr 5 Yr 10 Yr Std. Dev. Sharpe Morningsta Sustainability Ongoing charges
Fund Firm 1 mo. 3 mo. YtD 1 Yr Fund Size
(Annlzd.) (Annlzd.) (Annlzd.) 3 Yr ratio 3 Yr r Rating Rating KIID/ TER
MS INVF Global Opportunity I MSIM -7.28 -2.85 -3.25 16.65 16.48 15.52 14.84 1.13 5 Above Average 0.94 8,475
Robeco Global Consumer Trends Eqs F € Robeco -4.38 -0.72 -1.52 18.84 15.97 11.49 16.68 12.23 1.33 5 High 0.96 3,395
Comgest Growth World EUR I Acc Comgest -6.37 -3.37 -4.90 9.74 12.54 9.35 10.26 1.26 4 Average 0.91 678
Wellington Glbl Quality Gr S EUR Acc Uh Wellington -6.67 -2.98 -4.41 13.83 12.47 11.48 11.73 1.09 5 High 0.85 5,253
T. Rowe Price Glb Foc Gr Eq Q EUR T. Rowe -8.32 -3.23 -4.79 11.43 12.28 11.37 13.61 14.37 0.88 4 Below Average 0.86 1,744
AB Concntr Glbl Eq I USD Acc AllianceBernstein -5.60 -4.90 -5.36 15.14 12.12 9.20 12.12 1.03 4 Above Average 1.13 356
LO Funds Generation Global EUR MA Lombard Odier -7.32 -6.75 -6.64 9.90 10.76 11.23 13.60 12.24 0.91 5 High 1.46 1,504
AXAWF Framlington Evvg Trnds F Cap EUR AXA -4.55 -0.92 -2.38 18.24 10.44 7.78 13.14 0.82 3 Above Average 1.03 104
AB Sustainable Glb Tmtc I USD AllianceBernstein -4.23 -1.25 -2.15 15.16 10.33 8.16 10.01 11.68 0.91 Above Average 1.20 705
Threadneedle Global Select Z Acc Threadneedle -8.83 -5.01 -6.58 13.29 10.27 8.77 11.94 14.13 0.75 4 Above Average 1.63 1,126
BMO Sustainable Opports Glb Eq C Acc BMO -8.54 -6.73 -7.66 12.56 10.04 13.67 0.76 4 High 0.96 60
Baillie Gifford Global Alpha Gr B Acc Baillie Gifford -8.69 -4.61 -6.65 11.07 9.95 9.01 14.87 0.69 4 Below Average 0.60 3,813
AXA Framlington Global Thematics Z Acc AXA -7.89 -2.76 -3.95 16.72 9.92 7.42 11.54 14.87 0.69 3 Above Average 0.86 108
Capital Group New Pers (LUX) A4 Capital -5.98 -2.87 -4.41 12.84 9.83 8.64 12.68 11.65 0.87 5 Average 0.60 5,322
BNY Mellon Long-Term Glbl Eq EUR C Acc BNY Mellon -6.52 -5.55 -6.90 9.48 9.36 8.18 11.04 11.70 0.83 4 Above Average 1.11 1,376
Morningstar category: Consumer Trends (M)
MS INVF Global Brands Z MSIM -9.92 -5.17 -6.10 12.23 9.77 10.06 13.73 11.84 0.85 5 High 0.90 13,911
Investec GSF Glb Franchise I Acc USD Investec -6.35 -2.27 -3.53 13.66 9.02 9.14 12.63 10.73 0.87 5 Above Average 0.95 5,301
Pictet-Premium Brands I EUR Pictet -10.58 -9.84 -10.52 7.17 8.10 2.75 10.31 12.71 0.66 3 Above Average 1.16 606
Invesco Global Consumer Trnds C USD Acc Invesco -10.81 -7.26 -9.21 -0.45 6.60 8.29 15.84 18.27 0.38 5 Average 1.37 1,202
Source: Morning Star Direct, Robeco Global Performance Measurement, Fundsize is per end of earlier month
The value of your investments may fluctuate. Results obtained in the past are no guarantee for the future.
41 Robeco Global Consumer Trends | Track record & portfolio positioningPerformance Review 2019
Best year for global stocks since 2009
• MSCI AC World rose 26.6% (in USD) while the Global Consumer Trend fund posted a gain of 35.2% outperforming global markets for
the third year in a row.
• Japan and Emerging Markets lagged the rest of the world as the trade war impacted sentiment
• Growth stocks outperformed value stocks by a wide margin as investors steered clear from riskier, cyclical stocks
• Technology stocks led market higher, with Health Care & Energy lagging
All three trends Strong Brands, Emerging Consumer and Digital Consumer outperformed in 2019
Global Consumer Trends MSCI All Country World Attribution Analysis
Selection /
Port. Bench. Allocation Total
Contribution Contribution Interaction Total
Ending Total Return Ending Total Return Effect Currency
To Return To Return Effect Effect
Weight Weight (Local) Effect
Consumer Trends (Local)
Digital Consumer 29.70 31.35 10.63 8.74 36.23 3.03 1.85 -1.19 0.05 0.71
Emerging Consumer 24.46 44.80 9.93 3.88 31.61 1.18 0.75 2.85 -0.24 3.36
Strong Brands 45.84 42.06 18.62 16.58 40.88 6.14 2.98 0.73 -0.03 3.68
non-Trend Universe -- -- 0.00 69.86 25.31 18.28 2.41 -- -0.07 2.47
Total 100.00 39.18 39.18 100.00 28.93 28.93 8.02 2.39 -0.27 10.26
* Source: Robeco, Factset, as at end of December 2019 EUR
* Source: Robeco, Factset, as at end of April 2019, EUR
42 Robeco Global Consumer Trends | Track record & portfolio positioningPerformance Review 2019
Highlights
• Digital payment stocks (Pagseguro, Worldpay, Mastercard) were among the best performing segments
• Sporting and luxury goods stocks (Lululemon, Adidas, LVMH) kept strong earnings momentum with M&A boosting prey and
predators
• Apple and Microsoft surpassed one trillion in market value as shares rose a staggering 86% and 55% respectively
• Uber was the worst performer because of the fierce battle with competitor Lyft and the end of the lock-up period that triggered
huge selling pressure.
Top 5 contributors and detractors versus MSCI AC World
Name Trend Portfolio weight Portfolio return Total effect
MercadoLibre Emerging Consumer 1.98% 105.54% 1.18%
Pagseguro Emerging Consumer 1.58% 87.87% 1.04%
Lululemon Athletica Strong Brands 2.45% 92.41% 1.03%
WorldPay Digital Consumer bought by FIS 81.26% 0.92%
Mastercard Strong Brands 3.45% 61.23% 0.76%
Xilinx Digital Consumer 1.44% -6.53% -0.33%
Brittania Industries Emerging Consumer 1.32% -0.40% -0.39%
IFF Strong Brands 0.00% -6.95% -0.43%
Chr. Hansen Strong Brands 1.24% -9.25% -0.46%
Uber Digital Consumer 1.84% -27.39% -0.67%
* Source: Robeco, Factset, as at end of December 2019, EUR
43 Robeco Global Consumer Trends | Track record & portfolio positioningPortfolio Positioning (28-02-2020)
Trend Allocation Geographical Allocation Sector Allocation
Strong Brands 41% North America 55% Consumer Discretionary 30%
Digital Consumer 32% Europe 26% Information Technology 25%
Emerging Consumer 27% Emerging Markets 16% Consumer Staples 22%
Japan 3% Communication Services 14%
Health Care 5%
Materials 3%
Source Robeco. This is not a buy, sell or hold recommendation for any particular security. The information is for illustrative purposes only. Industrials 2%
No representation is made that these examples are past or current recommendations, that they should be bought or sold, nor whether they were successful or not.
44 Robeco Global Consumer Trends | Track record & portfolio positioningPortfolio Holdings (28-02-2020)
Theme Weight Theme Weight
Mastercard Strong Brands 3.2% Apple Strong Brands 2.1%
Visa Strong Brands 2.8% Lululemon Athletica Strong Brands 2.0%
Microsoft Strong Brands 2.5% Alibaba Emerging Consumer 2.0%
Square Digital Consumer 2.2% Uber Digital Consumer 2.0%
Nestle Strong Brands 2.2% Netflix Digital Consumer 2.0%
Top 10 23.0%
Source Robeco. This is not a buy, sell or hold recommendation for any particular security. The information is for illustrative purposes only.
No representation is made that these examples are past or current recommendations, that they should be bought or sold, nor whether they were successful or not.
45 Robeco Global Consumer Trends | Track record & portfolio positioningPortfolio holdings per trend (December 2019) Source Robeco. This is not a buy, sell or hold recommendation for any particular security. The information is for illustrative purposes only. No representation is made that these examples are past or current recommendations, that they should be bought or sold, nor whether they were successful or not. 46 Robeco Global Consumer Trends | Track record & portfolio positioning
Key characteristics: Higher quality, higher growth, higher valuation

                                                                                                                 Robeco Global
 28-02-2020                                                                                                                                                    MSCI AC World
                                                                                                                Consumer Trends
Return on Equity                                                                                                           17.6%                                   18.7%

Return on Assets                                                                                                           9.0%                                    7.8%

LT Debt/ Capital                                                                                                           41.5%                                   40.9%

Operating Margin                                                                                                           15.8%                                   19.9%

Est. EPS growth (3-5 year)                                                                                                 20.7%                                   10.4%

Hist. 3 YR Sales Growth                                                                                                    22.9%                                   10.2%

Price/Earnings NTM                                                                                                         27.9                                    14.9

Market Cap – Average (in USD bn)                                                                                           144.0                                   148.6

Active Share                                                                                                               84.5                                      -

Turnover*                                                                                                                  27%

Source: Factset, MSCI, Robeco
* Average over 5 years through December 2019, lower of purchases and sales divided by the average assets for the period.

47                                                                                      Robeco Global Consumer Trends | Track record & portfolio positioning
Summary: focus, structural winners and a balanced approach
Trends in consumer spending
> Identify strong secular global growth trends from a consumer perspective
> Focus on three strong trends to provide risk diversification
1. Digital consumer
2. Emerging consumer
3. Strong brands
Structural Winners
> Preference to invest in structural winners within their industry
> Focus on 50-70 most attractive stocks with higher quality and higher growth profile
Significant excess return compared to the MSCI AC World
> 6.5% annual excess performance over the past five years*
> Consistent first quartile performance versus peers on 1, 3, 5 and 10 year horizon**
> Assets under Management EUR 3,441 million/ USD 3,785 million (February 2020)
* CGF Robeco Global Consumer Trends Equities (EUR D-shares), gross of fees, based on Net Asset Value. In reality costs (such as management fees and other costs) are charged. These have a negative effect on the returns shown.
Source: Robeco Global Performance Measurement The value of your investments may fluctuate. Results obtained in the past are no guarantee for the future.
** Source Morningstar Direct, net of fees, EUR © 2018 Morningstar, Inc. All Rights Reserved. The information contained here in: (1) is proprietary to Morningstar; (2) may not be copied or distributed; and (3) is not warranted to be accurate, complete
or timely. Neither Morningstar nor its content providers are responsible for any damages or losses arising from any use of this information. Past performance is no guarantee of future results.
© 2018 Morningstar, Inc. All Rights Reserved. The information contained here in: (1) is proprietary to Morningstar; (2) may not be copied or distributed; and (3) is not warranted to be accurate, complete or timely. Neither Morningstar nor its content
providers are responsible for any damages or losses arising from any use of this information. Past performance is no guarantee of future results.
48 Robeco Global Consumer Trends | Track record & portfolio positioningIndex Robeco Global Consumer Trends Investment Team Investment philosophy & process Track record & portfolio positioning Appendix 49 Robeco Global Consumer Trends | Index
Appendix
     Biographies

50                 Robeco Global Consumer Trends | Appendix: Biographies
Biographies
Portfolio Managers Client Portfolio Managers / Analysts
Jack Neele, CEFA, Portfolio Manager Global Consumer Trends Equities Ed Verstappen, CEFA, Client Portfolio Manager
Jack Neele is Portfolio Manager of the Robeco Global Consumer Trends Equities Fund (since 2007). Jack started his Ed Verstappen is Client Portfolio Manager Trend Investing Equities with Robeco since August 2011. Before joining
career in the investment industry in 1999 and, prior to joining Robeco, he was a global equity portfolio manager at Fortis Robeco Ed worked for 11 years (2000-2011) at ABN AMRO Private Banking as Discretionary Portfolio Manager. From
MeesPierson. He holds a Master’s degree in Econometrics from the Erasmus University in Rotterdam and is an EFFAS 2008-2011 he was Regional Head of Discretionary Portfolio Management. Prior to this Ed worked for F. Van Lanschot
certified Financial Analyst. In June 2012 he participated in the “Strategy: Building and Sustaining Competitive Belgium and for Rabobank Breda. He holds a Master's degree in Business Economics from Tilburg University. In 2000 he
Advantage” Executive Program at Harvard Business School. In 2013, Jack was ranked in the top ten of best fund obtained his CFA/CEFA registration.
managers over the past five years by London-based financial publishing and information group Citywire.
Carl Ghielen, CEFA, Client Portfolio Manager
Richard Speetjens, CFA, Portfolio Manager Global Consumer Trends Equities Carl Ghielen is Client Portfolio Manager Trend Investing Equities with Robeco since March 2019. Before joining Robeco,
Richard Speetjens is fund manager of Robeco Global Consumer Trends Equities since December 2010. He joined Robeco Carl joined from NN IP (ING IM) where he worked for 19 years, initially as a portfolio manager in Equities, during the last
as a Senior Portfolio Manager in June 2007 as a member of the European High Conviction Equities team. Previously, nine years as Client Portfolio Manager Equity. Prior to this Carl worked as portfolio manager for Mn Services and GIM
Richard was employed by Van Lanschot Asset Management as a Portfolio Manager European Equities. Before his move Algemeen Vermogensbeheer. He holds a Master's degree in Business Economics from Tilburg University. In 1993 he
to Van Lanschot Asset Management he held a position as a Portfolio Manager European Equities at Philips Investment obtained his CFA/CEFA registration.
Management. Richard is a CFA charterholder and obtained a Master's degree in Business Economics and Finance from
Maastricht University. Steef Bergakker, Trend Analyst
Steef Bergakker is trend researcher within the Robeco Trends Investing team and portfolio manager of Digital
Innovations. Before he was the portfolio manager of Robeco Infrastructure Equities. Prior to rejoining Robeco in 2008,
Steef held different functions at IRIS (Institute for Research and Investment Services), the former research joint venture
of Robeco and Rabobank. From 1998 through 2008 he served as head of IRIS Equity Research, and before that he
worked as equity analyst for eight years. Steef started his career in the investment industry at Robeco in 1990, as a
junior analyst. He holds a Master’s degree in Monetary Economics and Finance and Investments from Erasmus
University, Rotterdam.
51 Robeco Global Consumer Trends | Appendix: BiographiesAppendix
Industry Recognition
52 Robeco Global Consumer Trends | Appendix: Industry RecognitionGlobal Consumer Trends: an Award winning strategy Examples of European Awards: > Numerous Lipper Awards in Austria, France, Germany, Netherlands, Spain, Switzerland, UK: Best fund over 3, 5 and 10 years in the Category Equity Sector Consumer and Global Equity in the 10 years between 2009 and 2019. > Les Grands Prix de la Gestion d'Actifs in France: runner-up in the category sector equities in 2012 > The European Funds Trophy in France: Best fund in the category equities international large cap, based on consistence of outperformance versus peers, over 4-year period in 2013 > The Fund Award of €uro and €uro am Sonntag in Germany: Best fund over a 10-year period in category sector consumer funds in 2013 Examples of Asian awards: > Lipper Award Hong Kong: Best fund over 10 years Category Global Equity in 2017, 2018 and 2019 > Benchmark Magazine Award as “Outstanding Achiever” Consumer Goods & Services Sector in 2014 and 2017 and “Best in Class” in 2011 > Asia Asset Management “Best of the Best” Award for Global Equity over 10- year category in 2016 > The FSA Hong Kong Award in the category Sector Equities in 2016 © 2018 Morningstar, Inc. All Rights Reserved. The information contained here in: (1) is proprietary to Morningstar; (2) may not be copied or distributed; and (3) is not warranted to be accurate, complete or timely. Neither Morningstar nor its content providers are responsible for any damages or losses arising from any use of this information. Past performance is no guarantee of future results. 53 Robeco Global Consumer Trends | Appendix: Industry Recognition
Appendix
     Growth of assets

54                      Robeco Global Consumer Trends | Appendix: Growth of assets
Assets under Management
Strong returns & strong client interest drive AUM growth
4,000
3,500
3,000
2,500
2,000
1,500
1,000
500
0
2009 2010 2011 2012 2013 2014 2015 2016 2017 2018 2019 YTD*
Source: Robeco. Data as of end February 2020
55 Robeco Global Consumer Trends | Appendix: Growth of assetsAppendix
ESG Integration
56 Robeco Global Consumer Trends | Appendix: ESG IntegrationA long history of sustainability investing
23 years of experience in sustainability investing
We are fully committed to Sustainability Investing. We have been active in this space for many years and have adapted and improved
our methods and strategies as markets and clients have themselves evolved.
Launch World’s first Voting & Highest Robeco signs
Robeco Sustainable Engagement Among the ESG integration scores on all Dutch SDG
Founding of Sustainable Private service first to sign in all UN PRI investing
Robeco equity fund Equity FoF initiated the UN PRI capabilities categories agenda
1929 1995 1999 2001 2004 2005 2006 2010 2013 2014 2015 2016 2017
Founding of Cooperatio World’s first World’s first RobecoSAM Among the first to Smart ESG Impact Launch of
RobecoSAM n with Dow Sustainable Clean Tech member of sign the UN PRI scores Investing Sustainable
Jones water fund Private Robeco introduced platform Global
Equity FoF Group launched Impact
Equities fund
57 Robeco Global Consumer Trends | Appendix: ESG IntegrationIntegrating sustainability leads to better informed decisions
3 Step ESG integration: identify, analyze and determine the impact of material ESG factors:
Identify and focus on most Analyze impact of Determine impact
material ESG factors on conviction levels and Better informed
material ESG issues
on the business model portfolio weights decisions
58 Robeco Global Consumer Trends | Appendix: ESG IntegrationStep 1: Identification of material factors Which ESG factors are financially material to the performance of a company? ESG Dashboard: bottom-up Materiality Framework: top-down Source: RobecoSAM, Robeco. This is not a buy, sell or hold recommendation for any particular security. The information is for illustrative purposes only. No representation is made that these examples are past or current recommendations, that they should be bought or sold, nor whether they were successful or not. 59 Robeco Global Consumer Trends | Appendix: ESG Integration
Step 2 and 3: Analyze and determine ESG impact on investment decision
How is the company exposed to material ESG factors?
                                                                                                                                                                                  Type and        Impact on
                                                                                                                                                                  Impacted
ESG factor                  Performance                                                                                                                                           Degree          investment
                                                                                                                                                                  value drivers
                                                                                                                                                                                  of Impact       decision
Information                 > Cyber security crucial both for customer acquisition and retention; found to be #1 criteria for customers in     > WACC and > Positive and                          > Increased
Security &                    choosing payment provider. In addition, Square has to compensate losses from fraud itself, so also financially     growth     high impact                             conviction
Cybersecurity                 it is key to have the right tools and analytics in place to manage that risk.
                            > Square encrypts payment data and uses algos to check for malicious or suspicious activity. Square openly
                              rewards those who find bugs (bugcrowd.com).
                            > Square is PCI compliant (data security standard for Payment Card Industry) and part of the Vendor Security
                              Alliance (VSA), an industry initiative to determine standards to assess suppliers security practices/third party
                              risk.
                            > Our cyber security analysis of Square is generally positive, highlighting a good cyber strategy and culture as
                              well as internal controls. However, certain vulnerabilities have been detected, most importantly a device
                              vulnerability that allowed merchants to initiate fraudulent transactions and skim credit card information. We
                              will follow up with the CTO regarding how that has impacted internal controls and procedures as well as how
                              security is taken into account in Square’s product development process.
Human Capital               > Talent in engineering and Fintech is scarce and sought after. Company publishes diversity & inclusion report                        > Growth        > Neutral but   > None
Management                    but not an employee retention rate.                                                                                                                   important
                            > Company culture is very entrepreneurial. There is a lot of room for own initiative, which will be help in                                             factor
                              attracting talent. Dependency on Jack Dorsey is large in terms of signaling function.
Empowering                  > Lack of independent chair, other than that board independence is good. CEO/chair double function, who is                            > WACC/CA > Neutral and         > None
shareholders                  also the CEO of Twitter, leading to questions around capacity/focus but no evidence of lack of management                             P               medium
                              attention. This is also the result of internal controls with empowerment of lower management levels.                                                  impact
                            > Jack Dorsey is not easily approachable to investors.
                            > Note the significant outstanding number of employee options – positive side is alignment of incentives, but
                              substantial dilution (up to 18% if all in the money).
Source: Robeco. This is not a buy, sell or hold recommendation for any particular security. The information is for illustrative purposes only.
No representation is made that these examples are past or current recommendations, that they should be bought or sold, nor whether they were successful or not.

60                                                                                     Robeco Global Consumer Trends | Appendix: ESG Integration
Stewardship in practice: what it means to be an active owner
Our duty as an asset manager towards the companies we invest in
Voting Engagement cases:
We encourage good governance and sustainable corporate practices, Robeco Global Consumer Trends Equities
and safeguard shareholder value through voting and (co-)filing shareholder
proposals. NIKE Living wage in the garment industry
PepsiCo Social risks of sugar
Engagement Nestle Social risks of sugar
We create value by improving the conduct of companies we invest in, by Improving sustainability in the meat and fish
means of our value engagement program. Novozymes supply chain
We act on misconduct of companies we invest in the enhanced engagement PayPal Cybersecurity / Tax Accountability
program. Heineken Good Governance
Visa Cybersecurity
Exclusions Adidas Living wage in the garment industry
We avoid making any investments which we or our clients deem unsuitable, Square Cybersecurity
based upon controversial behavior, controversial products, and Improving sustainability in the meat and fish
controversial countries. Chr Hansen supply chain
The five steps of engagement
1 2 3 4 5
Identify Financial Conduct Extensive Define SMART Initiate Dialogue Achieve impact and
Material ESG Theme Baseline Research Engagement Objectives with company report to clients
61 Robeco Global Consumer Trends | Appendix: ESG IntegrationFootprint Ownership (based on USD 3.9 bln invested)
The Footprint Ownership chart
shows the portfolio’s environmental
footprint based on the amount
invested. By measuring the
portfolio environmental footprint
on these key environmental
footprint metrics, investors gain an
understanding of the magnitude of
their portfolio’s environmental
footprint per invested dollar.
If a benchmark has been selected,
the benchmark’s environmental
footprint with respect to these
areas is provided alongside the
portfolio figures. Additional alerts
highlight the portfolio’s footprint
relative to that benchmark and
tangible equivalents of what the
data expresses: emissions, water
use, energy consumption and
waste generation are expressed in
terms of household activities.
To ensure comparability between
portfolio and benchmark, the
footprint amount has been scaled
by the data coverage to simulate
full coverage.
CGF CONS EUR
MSCI All Country World
European average figures per year: www.ec.europa.eu/eurostat and www.ee.europa.eu
62
© 2019 RobecoSAM AG Source: RobecoSAM AG. Certain underlying data is sourced from third parties (such as e.g. CDP Europe Services GmbH).Appendix
Company examples
63 Robeco Global Consumer Trends | Appendix: Company examplesExample strong brands: the Walt Disney company
Investment rationale Interesting Facts
> World’s biggest media company > Founded by Walt and Roy Disney in October 1923
> Superior and sustainable returns > Disneyland, California, opened in 1955 and Shanghai Disneyland in 2016
> Launch of own streaming service
Walt Disney share price
Structural winner
> Competitive advantage through superior brand name, scale advantage
and pricing power
Buy: in portfolio since Jun 2007 @ USD 34
The Walt Disney Co. is a diversified international family entertainment and media
enterprise. It operates through the following segments: Media Networks, Parks &
> Leading media brands (Disney, Pixar, Marvel, ESPN) Resorts, Studio Entertainment and Consumer Products & Interactive Media.
64 Robeco Global Consumer Trends | Appendix: Company examplesExample digital consumer: Netflix
Investment rationale Interesting facts
> Market leading streaming media platform with growing subscriber base > 149 million global subscribers
and attractive price positioning
> Available in 190 countries worldwide
> Huge investments in premium content
> Responsible for 15% of global Internet traffic
> International expansion drives profitability
Netflix share price
Structural winner
> Prime beneficiary of irreversible consumer shift to streaming
> Gains from scale advantages: Buy: in portfolio since Aug
2015 @ USD 104
Netflix is the world's leading internet entertainment service with paid memberships
worldwide offering TV series, documentaries and feature films across a wide variety
of genres and languages.
65 Robeco Global Consumer Trends | Appendix: Company examplesExample emerging consumer: Mercado Libre
Investment rationale Interesting facts
> E-commerce market in Latam underpenetrated > Internet penetration in Latin America is still low at 43%
> Further leverage of its successful MercadoPago payment system > Ebay sold the majority of its 19.5% stake in October 2016
> PayPal (spun off by Ebay in 2015) recently acquired 3% stake
Mercado Libre share price
Structural winner
> Strong management with long term focus and dedication to Buy: inportfolio since July
improvement of consumer experience 2011 @ USD 80
> well positioned for higher e-commerce use through a combination of a
strong brand, an increasingly potent network effect
> Payment subsidiary MercadoPago very successful and consumers
increase usage both on and off (bricks & mortar) the e-commerce
platform Mercado Libre is the largest e-commerce and payment company in Latam. The
company enables commerce through its marketplace platform in Latam. Subsidiary
MercadoPago facilitates transactions both on and off the Mercado Libre
marketplace.
66 Robeco Global Consumer Trends | Appendix: Company examplesExample strong brands: L Brands
Divestment rationale
> Decided to sell the full position in Jan 2017 after another warning on
profits. L Brands share price
> The company lost direction after they expanded too much into adjacent
categories like bodywear and swimwear
> A slowdown in consumer spending impacted sales growth because of
their high exposure to US malls where traffic is declining
Sell: Jan 2017 @
> Increased (on-line) competition in lingerie and home fragrances USD 63
> Victoria’s Secret lost connection with their customers and given their
high cost base (too many stores) this has hurt profitability Buy: in portfolio since
Nov 2012 @ USD 42
Interesting facts
> Victoria’s Secret CEO and former Nike executive stepped down after just
2 years
> Pop singer Rihanna’s “Savage x Fenty” brand is a fierce competitor and L Brands operates specialty retail business. The company is focused on women’s
intimate and other apparel, personal care, beauty and home fragrance categories.
more rivals are springing up The company’s segments include Victoria’s Secret, Bath & Body Works and PINK.
67 Robeco Global Consumer Trends | Appendix: Company examplesImportant information
Important Information This document is not directed to, or intended for distribution to or use by any person or entity who is a citizen or resident of or
located in any locality, state, country or other jurisdiction where such distribution, document, availability or use would be
Robeco Institutional Asset Management B.V. has a license as manager of Undertakings for Collective Investment in Transferable contrary to law or regulation or which would subject any Fund or Robeco Institutional Asset Management B.V. to any
Securities (UCITS) and Alternative Investment Funds (AIFs) (“Fund(s)”) from The Netherlands Authority for the Financial Markets registration or licensing requirement within such jurisdiction. Any decision to subscribe for interests in a Fund offered in a
in Amsterdam. particular jurisdiction must be made solely on the basis of information contained in the prospectus, which information may be
different from the information contained in this document. Prospective applicants for shares should inform themselves as to
This document is solely intended for professional investors, defined as investors qualifying as professional clients, have legal requirements also applying and any applicable exchange control regulations and applicable taxes in the countries of their
requested to be treated as professional clients or are authorized to receive such information under any applicable laws. Robeco respective citizenship, residence or domicile.
Institutional Asset Management B.V and/or its related, affiliated and subsidiary companies, (“Robeco”), will not be liable for any
damages arising out of the use of this document. Users of this information who provide investment services in the European The Fund information, if any, contained in this document is qualified in its entirety by reference to the prospectus, and this
Union have their own responsibility to assess whether they are allowed to receive the information in accordance with MiFID II document should, at all times, be read in conjunction with the prospectus. Detailed information on the Fund and associated
regulations. To the extent this information qualifies as a reasonable and appropriate minor non-monetary benefit under MiFID risks is contained in the prospectus. The prospectus and the Key Investor Information Document for the Robeco Funds can all be
II, users that provide investment services in the European Union are responsible to comply with applicable recordkeeping and obtained free of charge at www.robeco.com.
disclosure requirements.
Additional Information for US investors
The content of this document is based upon sources of information believed to be reliable and comes without warranties of any
kind. Without further explanation this document cannot be considered complete. Any opinions, estimates or forecasts may be Neither Robeco Institutional Asset Management B.V. nor the Robeco Capital Growth Funds have been registered under the
changed at any time without prior warning. If in doubt, please seek independent advice. It is intended to provide the United States Federal Securities Laws, including the Investment Company Act of 1940, as amended, the United States Securities
professional investor with general information on Robeco’s specific capabilities, but has not been prepared by Robeco as Act of 1933, as amended, or the Investment Advisers Act of 1940. No Fund shares may be offered or sold, directly or indirectly,
investment research and does not constitute an investment recommendation or advice to buy or sell certain securities or in the United States or to any US Person. A US Person is defined as (a) any individual who is a citizen or resident of the United
investment products and/or to adopt any investment strategy and/or legal, accounting or tax advice. All rights relating to the States for federal income tax purposes; (b) a corporation, partnership or other entity created or organized under the laws of or
information in this document are and will remain the property of Robeco. This material may not be copied or used with the existing in the United States; (c) an estate or trust the income of which is subject to United States federal income tax regardless
public. No part of this document may be reproduced, or published in any form or by any means without Robeco's prior written of whether such income is effectively connected with a United States trade or business. Robeco Institutional Asset Management
permission. US Inc. (“RIAM US”), an Investment Adviser registered with the Securities and Exchange Commission under the Investment
Advisers Act of 1940, is a wholly owned subsidiary of ORIX Corporation Europe N.V. and offers investment advisory services to
Investment involves risks. Before investing, please note the initial capital is not guaranteed. Investors should ensure that they institutional clients in the US. In connection with these advisory services, RIAM US will utilize shared personnel of its affiliates,
fully understand the risk associated with any Robeco product or service offered in their country of domicile (“Funds”). Investors Robeco Nederland B.V. and Robeco Institutional Asset Management B.V., for the provision of investment, research, operational
should also consider their own investment objective and risk tolerance level. Historical returns are provided for illustrative and administrative services.
purposes only. The price of units may go down as well as up and the past performance is not indicative of future performance. If
the currency in which the past performance is displayed differs from the currency of the country in which you reside, then you Additional Information for investors with residence or seat in Australia and New Zealand
should be aware that due to exchange rate fluctuations the performance shown may increase or decrease if converted into your
local currency. The performance data do not take account of the commissions and costs incurred on trading securities in client This document is distributed in Australia by Robeco Hong Kong Limited (ARBN 156 512 659) (“Robeco”), which is exempt from
portfolios or on the issue and redemption of units. Unless otherwise stated, the prices used for the performance figures of the the requirement to hold an Australian financial services license under the Corporations Act 2001 (Cth) pursuant to ASIC Class
Luxembourg-based Funds are the end-of-month transaction prices net of fees up to 4 August 2010. From 4 August 2010, the Order 03/1103. Robeco is regulated by the Securities and Futures Commission under the laws of Hong Kong and those laws may
transaction prices net of fees will be those of the first business day of the month. Return figures versus the benchmark show the differ from Australian laws. This document is distributed only to “wholesale clients” as that term is defined under the
investment management result before management and/or performance fees; the Fund returns are with dividends reinvested Corporations Act 2001 (Cth). This document is not for distribution or dissemination, directly or indirectly, to any other class of
and based on net asset values with prices and exchange rates of the valuation moment of the benchmark. Please refer to the persons. In New Zealand, this document is only available to wholesale investors within the meaning of clause 3(2) of Schedule 1
prospectus of the Funds for further details. Performance is quoted net of investment management fees. The ongoing charges of the Financial Markets Conduct Act 2013 (‘FMCA’). This document is not for public distribution in Australia and New Zealand.
mentioned in this document are the ones stated in the Fund's latest annual report at closing date of the last calendar year.
68 DisclaimerYou can also read