EU Economic Modelling System: Assessment of the European Institute of Innovation and Technology (EIT) Investments in Innovation and Human Capital ...
←
→
Page content transcription
If your browser does not render page correctly, please read the page content below

EU Economic Modelling System:
Assessment of the European
Institute of Innovation and
Technology (EIT) Investments in
Innovation and Human Capital

 Olga Ivanova, d’Artis Kancs
 Mark Thissen

 2019

 EUR 27796 EN

This publication is a Technical report by the Joint Research Centre (JRC), the European Commission’s science
and knowledge service. It aims to provide evidence-based scientific support to the European policymaking
process. The scientific output expressed does not imply a policy position of the European Commission. Neither
the European Commission nor any person acting on behalf of the Commission is responsible for the use that
might be made of this publication.

Contact information
Name: d'Artis Kancs
Address: European Commission, Joint Research Centre (JRC), Via E. Fermi 2749, 21027 Ispra,
Italy. Email: d'artis.kancs@ec.europa.eu
Tel.: +39 229-59203

JRC Science Hub
https://ec.europa.eu/jrc

JRC100796

EUR 27796 EN

 PDF ISBN 978-92-79-57276-0 ISSN 1831-9424 doi:10.2791/184008

Luxembourg: Publications Office of the European Union, 2019

© European Union, 2019

The reuse policy of the European Commission is implemented by Commission Decision 2011/833/EU of 12
December 2011 on the reuse of Commission documents (OJ L 330, 14.12.2011, p. 39). Reuse is authorised,
provided the source of the document is acknowledged and its original meaning or message is not distorted.
The European Commission shall not be liable for any consequence stemming from the reuse. For any use or
reproduction of photos or other material that is not owned by the EU, permission must be sought directly from
the copyright holders.

All content © European Union 2019, except: bottom cover: © xresch - pixabay.com

How to cite this report: Olga Ivanova, d'Artis Kancs and Mark Thissen; EU Economic Modelling System:
Assessment of the European Institute of Innovation and Technology (EIT) Investments in Innovation
and Human Capital; EUR 27796 EN, Publications Office of the European Union, Luxembourg, 2019,
ISBN 978-92-79-57276-0, doi:10.2791/184008, JRC100796.
EU Economic Modelling System: Assessment of the
 European Institute of Innovation and Technology (EIT)
 Investments in Innovation and Human Capital1

 Olga Ivanova*, d'Artis Kancs** and Mark Thissen*

Abstract: This is the first study that attempts to assess the regional economic impacts of the
European Institute of Innovation and Technology (EIT) investments in a spatially explicit
macroeconomic model, which allows us to take into account all key direct, indirect and spatial
spillover effects of EIT investments via inter-regional trade and investment linkages and a
spatial diffusion of technology via an endogenously determined global knowledge frontier with
endogenous growth engines driven by investments in knowledge and human capital. Our
simulation results of highly detailed EIT expenditure data suggest that, besides sizable direct
effects in those regions that receive the EIT investment support, there are also significant spatial
spillover effects to other (non-supported) EU regions. Taking into account all key indirect and
spatial spillover effects is a particular strength of the adopted spatial general equilibrium
methodology; our results suggest that they are important indeed and need to be taken into
account when assessing the impacts of EIT investment policies on regional economies.
Keywords: EIT, innovation, productivity, human capital, SCGE model, spatial spillovers.

1 Introduction
Innovation and human capital have been widely recognised as key drivers of a sustainable
economic growth in the long-run (Aghion and Howitt 2008). Indeed, around two-thirds of the
Europe's economic growth over the last decades has been driven by innovation (EIS 2019). To
promote the innovation activity in Europe, the European Union is implementing a number of
policy instruments including among others the Framework Programme (FP), the European
Structural and Investment Funds (ESIF) and the European Fund for Strategic Investment (EFSI).
More recently, the European Institute of Innovation and Technology (EIT) investment support is
being implemented to complement the innovation support policies of FP, ESIF and EFSI. The
innovation support policies of the EIT aim at strengthening sustainable innovation ecosystems
across Europe; fostering the development of entrepreneurial and innovation skills in a lifelong
learning perspective and support the entrepreneurial transformation of EU universities; and
brining new solutions to global societal challenges to the market.4 Whereas impacts of FP, ESIF

1 This study has been prepared in support of the Impact Assessment accompanying the document "Proposal for a
Decision of the European Parliament and of the Council on the Strategic Innovation Agenda of the European Institute
of Innovation and Technology (EIT) 2021-2027: Boosting the Innovation Talent and Capacity of Europe"
(52019SC0330R(01)). The authors acknowledge helpful comments from Peter Benczur, Peder Christensen, Georgi
Dimitrov, Aurelien Genty, Patrizio Lecca, Philippe Monfort, Sandor Szabo, Janos Varga, Peter Voigt as well as
participants of the conference Geography of Innovation in Stavanger and research seminars at the European
Commission and KU Leuven. We are grateful to Bruno Bortolin for granting access to the European Institute of
Innovation and Technology investment data. The authors are solely responsible for the content of the paper. The
views expressed are purely those of the authors and may not under any circumstances be regarded as stating an
official position of the European Commission.
*Netherlands Environmental Assessment Agency, Urbanisation and Transport (PBL).
**European Commission, Joint Research Centre (JRC).
4 https://eur-lex.europa.eu/legal-content/EN/TXT/?uri=CELEX:52019SC0330R(01)

 1

and EFSI have been studied widely in the literature (see e.g. Varga and in 't Veld 2011;
Brandsma and Kancs 2015; Le Moigne et al. 2016; Christensen 2018; Breidenbach et al. 2019),
potential impacts of the EIT investment support are largely unknown. In order to narrow this
evidence gap, the present study aims at assessing the impacts of the European Institute of
Innovation and Technology investments for the period 2020-2050 using a spatially explicit
macroeconomic model for Europe with a regional and sectoral detail that captures spatial
spillovers from investment in the knowledge and human capital.
The previous literature has extensively documented how EU-wide innovation policies affect
economy, society and environment in many different ways, posing challenges to the
methodological framework for capturing all the impacts, as they are diverse and complex due to
various inter-sectoral, inter-regional and inter-temporal linkages and interdependencies
(Rinaldi and Nunez Ferrer 2017; Marinescu 2019; Kim and Yoo 2019).
In order to account for all potential direct, indirect and spatial spillover effects of EIT
investments, the present study employs a spatially explicit general equilibrium model for
Europe with a regional and sectoral detail that can capture various spillovers from investment
in knowledge and human capital. The employed EU Economic Modelling System (EU-EMS) is a
new spatial computable general equilibrium (SCGE) model developed by the PBL Netherlands
Environmental Assessment Agency within the EU Framework Programme for Research and
Innovation – Horizon 2020.5 EU-EMS is a global modelling system capturing the entire world,
which is disaggregated into 62 countries and one Rest of the world region. Such a detailed
global geographic representation allows us to account for the increasing inter-dependent global
value chains. The EU28 Member States are further disaggregated into 276 NUTS2 regions and
each regional economy is disaggregated into 63 NACE Rev.2 economic sectors. Goods and
services are consumed by households, government and firms; they are produced by firms in
markets that are either perfectly or imperfectly competitive. EU-EMS includes New Economic
Geography features such as monopolistic competition, increasing returns to scale and a labour
migration. Spatial interactions between regions are captured through trade of goods and
services (which is subject to trade and transport costs), factor mobility and knowledge
spillovers. This makes EU-EMS a particularly well-suited modelling tool for analysing EU-wide
policies related to the human capital, R&I and innovation of which we will make use in the
present study. Indeed, EU-EMS is increasingly being used by EU policy makers; it has already
been employed for the assessment of the European Institute of Innovation and Technology
(EIT) investments and the European Investment Bank (EIB) investments.
Running simulations with the 2021-2035 EIT expenditure data until 2050, we show how the
spatial general equilibrium approach adopted in the present study helps to identify the
potential impact of policy interventions at the regional level, policy leakages across space via
value added chains and the shift of the pattern of the impact between regions and sectors over
time. First, we assess the direct impacts of EIT investments on the regional GDP for the period
2020-2050. Direct impacts of EIT investments take place in those regions that are receiving the
EIT support. Regions that are receiving larger EIT investments experience larger productivity-
induced changes in the sectoral value added contributing to growth of the regional GDP. Hence,
in addition to the econometrically estimated sector-specific productivity parameters, also the
sectoral structure of regions determines crucially the impact of the EIT investment support.
Second, we assess the total effects of EIT investments on the regional GDP for the period 2020-
2050. Our simulation results suggest that the total effect can be either positive or negative,
meaning that an additional growth triggered by the policy support in those regions that are
directly supported by EIT investments can result in an economic decline in some other regions.
For example, this can be due to an increased relative competitiveness and increasing market
shares of supported regions, which may be followed by a relocation of economic activities to
these regions from non-supported regions.

5 European Union’s Horizon 2020 Research and Innovation Programme, grant agreement No 727114.

 2
Our results offer several methodological considerations and policy conclusions. First, the EIT
investment support indeed contributes to strengthening the innovation capacity and improving
the innovation performance in the EU. Second, the spatial distribution of innovation gains
resulting from the EU investment support is highly uneven across the EU, which among others is
due to a high regional concentration of the EIT investment support – only a small subset of
NUTS2 regions benefits directly from the EIT support. Third, spatial spillover effects induced by
EIT innovation policies are sizeable – for the EU in total they are considerably larger than direct
policy effects – and their share increases over time. Finally, our study offers also methodological
insights from bringing complex theoretical concepts to empirical applications. In particular, our
results suggest that spatial spillover effects induced by policies may be important indeed and
hence need to be taken into account when assessing the impacts of EU-wide policies on regional
economies.
Our study complements the broader literature on assessing the impacts of EU-wide policies on
regional economies (Bröcker et al. 2001; Tavasszy et al. 2011; Bröcker and Korzhenevych 2013;
Takayama et al. 2014; Brandsma et al. 2015; Figus et al. 2019) and provides a value added along
several dimensions. First, this is the first study that analyses potential regional economic
impacts of the European Institute of Innovation and Technology investments in a spatial general
equilibrium framework, which allows us to account for all key direct, indirect and spatial
spillover effects of EIT investments e.g. between those directly supported and indirectly affected
EU regions. Often, they have been neglected in the previous literature employing either reduced
form or spatially aggregated or partial equilibrium approaches. Second, in order to implement
the developed spatial general equilibrium framework empirically for the entire EU and rest of
the world aggregates, we estimate all key model parameters related to research, innovation and
human capital econometrically based on structural specifications derived from the theoretical
model. Third, for the construction of the EIT policy scenario, we use disaggregated project-level
data, which allow us to implement thematic policy expenditures (research and innovation,
education and business support) precisely into the model and allocate to supported NUTS2
regions. The EIT investment policies that we assess are in line with the Proposal for a
Regulation of the European Parliament and of the Council on the European Institute of
Innovation and Technology.6
The rest of the paper is organised as follows: section 2 presents the European Institute of
Technology (EIT), explains the policy background and describes the investment scenarios that
we analyse in the paper. Section 3 presents the modelling approach that we employ for the
simulation analysis – a combination of a spatial CGE model and econometric estimations of key
innovation parameters of the model. Section 4 presents the results of our analysis and
disentangles between direct, indirect and spatial spillover effects of EIT investments at the
regional level. Section 5 concludes and derives policy recommendations.

2 European Institute of Innovation and Technology (EIT) and
innovation support
2.1 Overview of the EIT
About two-thirds of the Europe's economic growth over the last decades has been driven by
innovation (EIS 2019). In the same time, Europe still faces a number of structural weaknesses in
the innovation capacity and is lagging behind the global competitors from North America and
Asia in many innovation areas. For example, EU companies spend less on innovation than their
competitors. Venture capital remains underdeveloped in Europe, resulting in companies moving
to business ecosystems where they have better environment to grow fast. The public R&D
investment across the EU falls short of the 3% GDP target. The R&D intensity is still uneven

6 COM(2019) 331 final https://eur-lex.europa.eu/legal-content/EN/TXT/?uri=CELEX:52019PC0331

 3
among EU regions, with investment and research heavily concentrated in Western Europe. Last but not least, around 40% of the human capital in Europe lacks the necessary digital skills (EIS 2019). A number of innovation and human capital policies are being implemented at the EU level to address the knowledge and innovation gap in Europe, thereby supporting the Union's strategic objectives and policy priorities, including a long-term growth and competitiveness as well as wider societal impacts. Among others, the EU's innovation policies are being implemented under the Framework Programme (FP), the European Structural and Investment Funds (ESIF) and the European Fund for Strategic Investment (EFSI) and other types of the innovation support at the EU level. The European Institute of Innovation and Technology (EIT) is complementing EU-wide innovation and human capital policies of FP, ESIF and EFSI; the EIT has been set up under the Framework Programme in response to the need to address specific societal challenges by tackling structural weaknesses in the EU’s innovation capacity and improving the innovation performance of the EU. The EIT’s overall mission is to boost a sustainable European economic growth and competitiveness by reinforcing the innovation capacity of EU Member States and the Union as a whole. The EIT seeks to integrate the knowledge triangle of higher education, research and innovation, reinforce the Union's innovation capacity and address global societal challenges. In line with Article 17 of the EIT Regulation the Strategic Innovation Agenda,7 the general objectives of the EIT are: (i) strengthening sustainable innovation ecosystems across Europe; (ii) fostering the development of entrepreneurial and innovation skills in a lifelong learning perspective and support the entrepreneurial transformation of EU universities; and (iii) bringing new solutions to global societal challenges to the market. Compared to other innovation programmes implemented at the EU-level (FP, ESIF and EFSI), the EIT has a specific role to play in addressing structural weaknesses in the EU’s innovation capacity which are common to EU Member States: The under-utilisation of existing research to create economic or social value; The lack of research results brought to the market; Low levels of entrepreneurial activity and mind-set; Low leverage of private investment in research and development; An excessive number of barriers to collaboration within the knowledge triangle of higher education, research, business and entrepreneurship on a European level. In order to address these challenges and achieve innovation objectives in the EU, the EIT provides an investment support to innovation in selected policy areas with the greatest benefits for society: Climate, Digital, Innovative Energy, Health, Raw Materials, Urban Mobility and Added Value Manufacturing. The EIT's innovation support activities are operationalised through Knowledge and Innovation Communities (KICs) that are large-scale institutionalised European partnerships of businesses, research institutes and higher education institutions. KICs aim at reinforcing innovation capacities by running a portfolio of activities in three areas: Research/Innovation projects: aimed at supporting and developing new innovative products, services and solutions that address societal challenges in the KICs areas of activity. These projects include demonstrators, pilots or proofs of concept. Education: these include innovative educational and training programmes offered by each KIC in the form of post-graduate (MSc/PhD) programmes, executive/ professional development courses, lifelong learning modules, summer schools, etc. The EIT Label 7Regulation (EC) No 294/2008 of the European Parliament and of the Council of 11 March 2008 establishing the European Institute of Innovation and Technology (OJ L 97, 9.4.2008, p. 1). Amended by Regulation (EU) No 1292/2013 of the European Parliament and of the Council of 11 December 2013 (OJ L 347, 11.12.2013, p. 174). 4
ensures quality of the KIC education programmes and recognition within and beyond the EIT Community. Business creation and support activities: these include start-up and accelerator schemes to help entrepreneurs and potential entrepreneurs translate their ideas into successful business. The focus is primarily on access to market, access to finance, and access to networks, mentoring & coaching. The bottom-up approach of EIT activities aims primarily at making better use of already existing research results and encouraging greater knowledge and human capital investment in selected policy areas. These are essential to address the structural weaknesses in the EU’s innovation capacity, and the knowledge and innovation gap in Europe, thereby supporting the Union's strategic objectives and policy priorities, including a long-term growth and competitiveness but also wider societal impacts. 2.2 Scenario construction The EIT policy scenario that we simulate and assess in this study is based on the Proposal for a Regulation of the European Parliament and of the Council on the European Institute of Innovation and Technology (COM(2019) 331 final).8 The construction of the EIT investment support scenario involves the following four steps: (i) aggregating all relevant project-level EIT expenditure data into four broad category: Higher Education, Research and Innovation, Business Support, and Other; (ii) specifying sets of parameters through which the EIT policy shocks will be implemented in the simulation model; (iii) estimating econometrically the specified innovation and human capital parameters; and (iv) computing the shock size for each region and sector using the EIT expenditure data and the estimated parameters. As shown in Table 1, for the 2021-2027 programming period a proposed budget of 3 billion Euro the EIT will fund the activities of Knowledge and Innovation Communities and support the innovation capacity in Europe. The Business Support will have a budget of around 826.71 Million Euro, Higher Education – 970.50 Million Euro, Other types of investment support – 869.58 Million Euro, and Research – 333.20 Million Euro (see Table 1). As regards policy areas (columns in Table 1), the Innovation for Climate Action (CLIMAT) and the Digital Innovation (DIGITAL) will allocate most of their budget to Higher Education. Table 1: EIT investment support expenditures in five largest Knowledge and Innovation by the category of investment, Euro Total RAW INNO DIGITAL HEALTH CLIMAT Business 826716365 4795146 30780591 27856827 5552749 15389171 Education 970502890 5976521 14293579 33434517 12060801 33283886 Other 869578414 8220929 34990810 10031896 10820800 24684540 Research 333202331 4004985 4076699 16449116 3998657 5477097 Source: European Institute of Innovation and Technology. In order to undertake a comparative scenario analysis and assess impacts of selected EIT investment support policies, first, a baseline scenario is constructed and simulated. There is no EIT supported investment implemented in the baseline scenario; baseline variables, such as impact on the GDP or additional investment leverage of private investments, are used as benchmark against which to assess EIT policy scenario outcomes. Second, alternative EIT investment support (counterfactual) scenarios are constructed and simulated. The policy scenario construction requires data on private co-funding rates for each year in the EIT scenario. These are summarised in Table 2 below. The rest of the co-funding is 8 https://eur-lex.europa.eu/legal-content/EN/TXT/PDF/?uri=CONSIL:ST_11228_2019_INIT 5
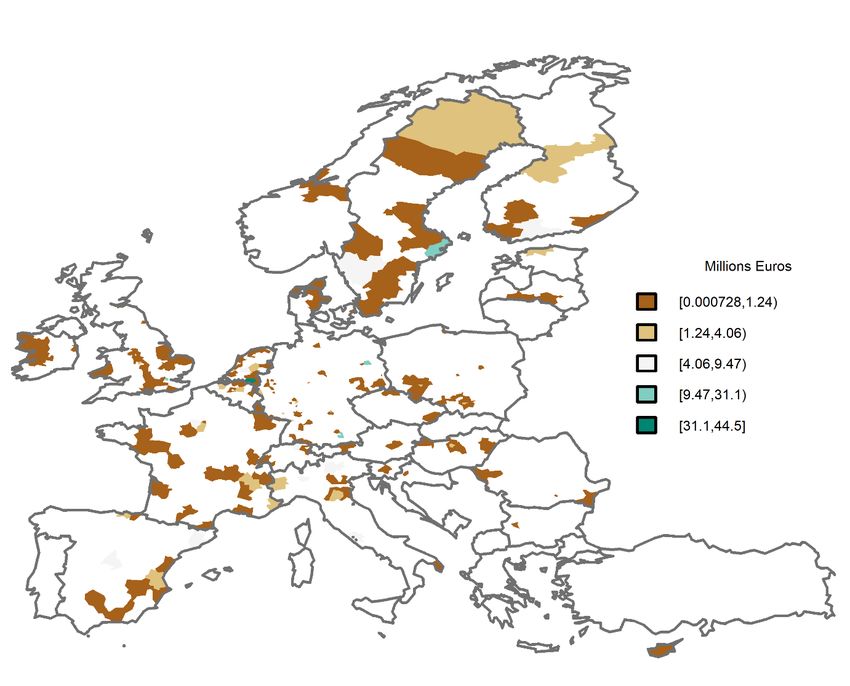
coming from the EIT funding in line with the Proposal for a Regulation of the European
Parliament and of the Council on the European Institute of Innovation and Technology,9
according to which the EIT will invest in total 3 billion Euros over the course of seven years
from 2021 to 2027. Further, we assume that the spatial investment pattern of the EIT will
remain the same as in the base year EIT expenditure data (2016), meaning that only a subset of
EU28 regions will receive the funding and that the regional pattern of investments remains the
same until 2027 (see Figure 1).10

Figure 1 Regional distribution of the EIT investment in 2016, Million Euro
The distribution of the total EIT investment budget between Knowledge and Innovation
Communities (KIC), direct EIT investment into knowledge and human capital and the EIT
administrative budget is ca 83%, 15% and 1.8 %, respectively. Table 2 below summarises the
yearly distribution of the EIT budget between main expenditure categories until 2035.
Table 2: Overview of the EIT investment support scenario assumption

 2021 2022 2023 2024 2025 2026 2027 2028 2029 2030 2031 2032 2033 2034 2035

 Private/public investment support, budget share in percent

 11.50 11.13 12.17 12.23 12.17 12.33 11.83 11.83 11.83 11.83 11.83 11.83 11.83 11.83 11.8

 Administrative budget, share in percent

9 COM(2019) 331 final.
10This assumption seems to be reasonable and robust at least in the short- to medium run, as KICs are established
and will remain in the region for at least 15 years (Article 9, COM(2018) 435 final).

 6
0.20 0.23 0.27 0.30 0.33 0.33 0.33 0.33 0.33 0.33 0.33 0.33 0.33 0.33 0.33

 EIT direct investment, budget share in percent

 0.67 1.33 2.00 2.33 2.67 2.67 3.00 3.00 3.00 3.00 3.00 3.00 3.00 3.00 3.00

 Private co-funding rate, share in percent

 0.00 0.00 0.00 20.00 20.00 20.00 30.00 30.00 30.00 40.0 50.0 60.0 70.0 80.0 90.0

Source: European Institute of Innovation and Technology.
Finally, we compute the direct impacts of the EIT investments for the period 2020-2035. We use
the econometrically estimated parameters (productivity elasticity with respect to the R&D and
human capital investment) to align EIT investments and the changes in sectoral productivity
triggered by the R&D investment in each EU NUTS2 regions.

3 Methodological framework
3.1 Expected impacts and methodological considerations
Previous studies have shown that EU-wide innovation policies affect economy, society and
environment in many different ways, posing challenges to the methodological framework for
capturing all the impacts, as they are diverse and complex due to various inter-sectoral, inter-
regional and inter-temporal linkages and interdependencies (see e.g. Varga and in 't Veld 2011;
Brandsma and Kancs 2015; Le Moigne et al. 2016; Christensen 2018; Breidenbach et al. 2019).
In the context of the EIT investment in the areas of research/innovation, education and business
creation/support for improving the innovative performance of the EU, three types of effects of
EIT-supported investments are of particular importance: (i) demand effects (e.g. hiring of
workers, machinery), structural effects (e.g. productivity and human capital growth) and
macroeconomic effects (e.g. on GDP and employment) and hence need to be captured in the
analysis.11
As noted by Dimitrov and Kancs (2019), economic impacts of EIT investment support policies
are not only multi-faceted and non-linear, many of them are unobservable and hence cannot be
identified by simply looking at data. For example, when the EIT Digital invests in a broadband
network, direct observable activities include the amount of workers' time required to lay
network cables underground, machinery and materials such as the fibre optic cables. The length
of cabling kilometres can be observed, the workers' time can be measured – in Figure 2 they are
referred to as the demand effect on the economy. The constructed broadband network connects
homes and businesses enabling faster communication services. Eventually, these effects can be
observed and measured directly too. It is less straightforward, however, to measure how the
new services may help to create new businesses or disrupt existing ones, how productivity may
be increasing, fostering the changing nature of work, etc. In Figure 2 they are referred to as the
structural effect on economy. These structural effects are confounded by other simultaneous
developments and policies, making it extremely challenging to establish a causal link to EIT
investments. Given that it would be impossible or prohibitively expensive to measure them on a
case-by-case basis, a model-based scenario analysis is required that allows to simulate the
potential development of the economy with and without the EIT digital interventions and
compare/quantify the difference between alternative policy options.
Another example, the EIT InnoEnergy supports the supply of energy produced in a sustainable
and affordable manner. The elaboration of such new innovative energy technologies is human
capital and physical capital intensive, creating an immediate demand for these factors (highly

11Generally, there are many more economic impacts, as well as societal and environmental effects which, however,
are beyond the scope of the present analysis.

 7
skilled workers and machinery) in the economy. Again, in Figure 2 they are referred to as the
demand effect on the economy. These demand effects can be observed and their use and the
associated costs can be accounted for relatively straightforwardly. In the medium- to long-run,
the newly innovated sustainable and renewable energy production technologies also reduce the
EU economy's dependence on the imported energy, increase the efficiency of the energy
production and consumption, as well as create new energy supplying businesses in the EU. In
Figure 2 they are referred to as the structural effect on economy. These structural effects in the
EU economy are associated with a much larger uncertainty – as innovation is an inherently
uncertain process – their causality and size are much more challenging to establish. Therefore, a
model-based scenario analysis is required, as already noted above.

 Demand
 effects

 EIT
 investment
 EIT-Supported region Direct GDP
 (direct + indirect effects) effects
 activity

 Structural effect on economy
 Innovation,
 New products, Higher relative
 productivity
 lower costs competitiveness
 growth

 Demand
 effects
 Knowledge
 spillovers

 Non-supported region Spatial spill-
 (indirect effects) over effects

 Structural effect on economy
 Innovation, Higher/lower
 New products,
 productivity relative
 lower costs
 growth competitiveness

Figure 2 Mechanics of the EIT investment support impact in a 2-region 1-sector economy
Demand side effects (direct, indirect and induced effects) together with structural effects (e.g.
productivity, cost-advantage and competitiveness effects) result in total macro-economic effects
on the economy, such as GDP and employment. In Figure 2 they are referred to as the direct
effect on economy. Although, production, consumption, trade, GDP, employment, etc. can be
observed and measured, due to simultaneous developments and confounding factors, it is
rather challenging to establish a direct causality between EIT-supported investments and
growth of these indicators. For such purposes, a model-based scenario analysis needs to be
undertaken that allows to simulate the potential development of the economy with and without
EIT interventions and quantify/compare differences in production, consumption, trade, GDP,
employment, etc. between alternative policy options.
For a holistic and comprehensive understanding of net effects of EIT-supported investments, in
addition to the impact on economy, also inputs and their costs need to be accounted for. Indeed,

 8
the EIT investment budget – similarly to the entire EU budget – has certain sources of revenues
that can be traced back to taxes paid by households and business in each Member State and
region. Part of the required EIT funding comes from extra household savings, part of it comes
from a borrowing abroad, yet another part is derived from relocating existing savings that may
have been invested differently. A similar line of argument applies also to the measurement and
tracking of inputs needed to finance these investments. In the context of funding and financing,
advantages of using a general equilibrium model are that funding can be linked to sources and
all inputs and their costs can be thoroughly accounted for.
Finally, there are also spillovers to other regions and sectors, even those not directly benefiting
from EIT-supported investments. For example, through inter-sectoral input-output linkages,
through cross-border trade of goods and services, knowledge spillovers and a spatial diffusion
of technology, also not directly supported regions/sectors benefit from EIT-supported
investments in the medium- to long-run. On the other hand, policy-induced crowding-in and
pro-competitive effects on input and output markets may increase competition and eventually
crowd out less competitive companies in some regions/sectors (Michalek et al. 2016). In Figure
2 they are referred to as spatial spillover effects.
To be able to capture all key direct, indirect and spatial spillover effects of EIT investments ̶
both positive and negative ̶ and to form a more comprehensive policy evidence of the total net
economic impact, a spatially and sectorally disaggregated model-based analysis is required.
According to the European Commission’s Better Regulation Toolbox (p.359),12 a general
equilibrium framework, which captures linkages between markets across the entire economy, is
the most appropriate when indirect impacts are likely to be the most significant ones in terms of
magnitude of expected impacts:
 "General equilibrium models are able to simulate the shifts in supply curves and
 corresponding demand changes that can result from any change in the economy,
 from a price shock in raw materials to a new form of price regulation.
 Accordingly, they are able to model the links between connected markets in a
 way that shows the ultimate impact on outputs and consumption of goods and
 services in the new market equilibrium; and they can also determine a new set of
 prices and demands for various production factors (labour, capital, land). As a
 final result, they can also provide indications and estimates as regards
 macroeconomic changes, such as GDP, overall demand, etc." (European
 Commission 2017)
In light of requirements to the modelling approach discussed above and the relative strengths of
a spatial general equilibrium framework vis-vis other modelling tools, in the present study we
employ a spatially explicit general equilibrium model for Europe with a regional and sectoral
detail that can capture various spillovers from investment in the knowledge and human capital.
The adopted modelling framework is introduced in the next section.

3.2 EU-EMS: EU Economic Modelling System13
The employed EU Economic Modelling System (EU-EMS) is a newly developed spatial
computable general equilibrium (SCGE) model built by the PBL Netherlands Environmental
Assessment Agency within the EU Framework Programme.14 The model includes a
representation of 62 countries of the world and one Rest of the world region. The EU28 Member
States are further disaggregated into 276 NUTS2 regions and each regional economy is
disaggregated into 63 NACE Rev.2 economic sectors. Goods and services are consumed by

12 https://ec.europa.eu/info/better-regulation-guidelines-and-toolbox_en
13 See Appendix A1 for formal description of the EU-EMS.
14 European Union’s Horizon 2020 Research and Innovation Programme, grant agreement No 727114.

 9
households, government and firms and are produced in markets that are either perfectly or
imperfectly competitive. The model includes New Economic Geography features such as
monopolistic competition, increasing returns to scale and labour migration. Spatial interactions
between regions are captured through trade of goods and services (which is subject to trade
and transport costs), factor mobility and knowledge spillovers. This makes EU-EMS a
particularly well suited modelling tool for analysing policies related to the human capital, R&I
and innovation of which we will make use in the present study.
The theoretical underpinning of modelling innovation and the factor productivity growth
follows Griffith et al. (2001) and Acemoglu et al. (2006), where firms invest into both innovation
(knowledge production) and adoption of technologies from the world technology frontier. In
this framework, the selection of high-skill workers and firms is more important for innovation
than for adoption. Regions and countries at early stages of development pursue an investment-
based strategy, which relies on existing firms and managers to maximise investment but
sacrifices selection. Closer to the world technology frontier, economies switch to an innovation-
based strategy with short-term relationships, younger firms, less investment, and better
selection of firms and managers. Griffith et al. (2001) propose a general equilibrium model of
endogenous growth with both channels of productivity adjustments to R&D investments.
Griffith et al. augment the conventional quality ladder model to allow the size of innovations to
be a function of the distance behind the technological frontier. Griffith et al. find a strong
empirical evidence for the second channel of R&D in the adoption of knowledge.
Following Griffith et al. (2001) and Acemoglu et al. (2006), we assume that R&D affects the
development of TFP through two channels. The first is the knowledge creation or stimulation of
innovation that has received a lot of attention in both the theoretical and empirical literature.
The second channel is the adoption or imitation of knowledge that has been created in other
regions, countries and sectors. As in Griffith et al. (2001) and Acemoglu et al. (2006), the
following relationship between the R&D investment and productivity growth is specified in EU-
EMS:

 ln Aijt = ∆ ln AFjt − 1 ln ( ) − 2 ln ( ) ln ( )
 −1 −1 −1

 − 3 −1 ln ( ) + 1 ( ) + 2 −1 + (1)
 −1 −1
where the TFP growth, ∆ ln AFjt , over a certain period of time depends on the knowledge
adoption that is captured by the growth of the technological frontier, ∆ ln AFjt , and interaction
between the technological gap, ln( / ) −1 , and the R&D per unit of sectoral output,
( / ) −1 , as well as the interaction between the technological gap, ln( / ) −1 , and the
human capital, −1 . The level of the human capital and R&D capture the absorptive capacity
of the particular sector. The TFP growth is also linked to the knowledge creation that is
captured by the R&D stock, ( / ) −1 , and the human capital stock, −1 .
Once parameterised, the employed macroeconomic model will help us to analyse how the EIT
investment support in knowledge and human capital affects the supported regional economies
and to what extent the investment support may spill over to other (non-supported) regions.

3.3 Empirical implementation
The EU-EMS database has been constructed by combining national, European and international
data sources;15 it contains a detailed regional level (NUTS2 for EU28 plus 34 non-EU countries)
multi-regional input-output (MRIO) table for the world. The main datasets used for the

15 http://themasites.pbl.nl/winnaars-verliezers-regionale-concurrentie/

 10
construction of MRIO include the OECD database, the BACI trade data, the Eurostat regional
statistics and national Supply and Use tables as well as detailed regional level transport
database ETIS-Plus from the DG MOVE.16
The EU-EMS database has a detailed sectoral and regional dimensionality, EU28 Member States
are disaggregated as 276 NUTS2 regions. Both sectoral and geographical dimensions of the
model are flexible and can be adjusted to the needs of specific policy or research question. The
sectoral and geographical details of EU-EMS are summarised in Tables 3 and 4, respectively.
Regional structure
In total, the EU-EMS contains 62 countries of the world, which are reported in Table 3 below.
Being built upon the framework of spatial general equilibrium modelling and incorporating the
representation of 276 NUTS 2 regions in the EU and 34 non-EU countries of the world, the EU-
EMS has an extremely detailed and rich structure of spatial interconnections between regions.
For example, regional economies are connected via an inter-regional trade of goods and
services, relocation of factors and economic activity and income flows. The trading of goods
between regions is costly, as it is necessary to pay for the services of the transportation sector.
Transportation costs in EU-EMS are both good-specific and differentiated between the origin
and destination regions. The inter-regional trade flows data at the level of NUTS2 are unique, as
these data are not available from official statistical sources. These unique inter-regional trade
flows data are used also by other regional models of the European Commission (e.g. Thissen et
al. 2019).
Table 3 Overview of countries represented in EU-EMS

Code Country Code Country

AUS Australia ARG Argentina
AUT Austria BGR Bulgaria
BEL Belgium BRA Brazil
CAN Canada BRN Brunei Darussalam
CHL Chile CHN China
CZE Czech Republic CHN.DOM China Domestic sales
DNK Denmark CHN.PRO China Processing
EST Estonia CHN.NPR China Non processing
 goods exporters
FIN Finland COL Colombia
FRA France CRI Costa Rica
DEU Germany CYP Cyprus
GRC Greece HKG Hong Kong SAR
HUN Hungary HRV Croatia
ISL Iceland IDN Indonesia
IRL Ireland IND India
ISR Israel KHM Cambodia
ITA Italy LTU Lithuania
JPN Japan LVA Latvia
KOR Korea MLT Malta
LUX Luxembourg MYS Malaysia
MEX Mexico PHL Philippines
MEX.GMF Mexico Global ROU Romania
 Manufacturing
MEX.NGM Mexico Non-Global RUS Russian Federation
 Manufacturing
NLD Netherlands SAU Saudi Arabia
NZL New Zealand SGP Singapore

16 http://viewer.etisplus.net/

 11
NOR Norway THA Thailand
POL Poland TUN Tunisia
PRT Portugal TWN Chinese Taipei
SVK Slovak Republic VNM Viet Nam
SVN Slovenia ZAF South Africa
ESP Spain RoW Rest of the World
SWE Sweden
CHE Switzerland
TUR Turkey
GBR United Kingdom
USA United States

Sectoral classification
In EU-EMS, economies (regions within EU, countries outside EU) differ by the type of production
sectors, which dominate overall production activities in the region. Some specialise in
traditional sectors like agriculture, whereas others specialise in skill- and knowledge-intensive
sectors such as finance and industry. Different economic sectors are characterised by a different
degree of agglomeration and its importance for innovation, as innovation activities tend to be
highly concentrated in space (Brandsma and Kancs 2015). Traditional sectors do not experience
any agglomeration effects whereas skill- and knowledge-intensive sectors do and that may
result in some sectors growing faster than others.
In order to capture inter-sectoral differences in the innovation activity and performance –
which are of a particular relevance for the present study – we have regrouped all economic
sectors into six broad groups following the Eurostat classification of the economic sectors
according to their R&D intensity: (1) Traditional, (2) Low-tech industry, (3) Medium-tech
industry, (4) High-tech industry, (5) Knowledge intensive services and (6) Other services (see
Table 4). This classification follows the Eurostat’s definition, where for the purpose of our
analysis we merge together groups “High-technology” and “Medium-high technology” into
“High-technology”. These aggregated groups of sectors are also used in the econometric analysis
for the estimation of key innovation parameters in the model that as detailed below uses the
EU-KLEMS database.
Table 4 Sectoral classification of EU-EMS
Sectoral NACE Description of the sectors
classification Rev2 codes

Traditional A01 A02 A03 Products of agriculture, hunting and related services; Products of forestry,
 B logging and related services; Fish and other fishing products; aquaculture
 products; support services to fishing; Mining and quarrying

Low-technology C10-C12 Food products, beverages and tobacco products; Textiles, wearing apparel and
manufacturing C13-C15 C16 leather products; Wood and of products of wood and cork, except furniture;
 C17 articles of straw and plaiting materials; Study and study products; Printing and
 C18 C31_C32 recording services; Furniture; other manufactured goods

Medium- C19 C22 C23 Coke and refined petroleum products; Rubber and plastics products; Other non-
technology C24 C25 C33 metallic mineral products; Basic metals; Fabricated metal products, except
manufacturing machinery and equipment; Repair and installation services of machinery and
 equipment

High- C21 C26 C20 Basic pharmaceutical products and pharmaceutical preparations; Computer,
technology C27 C28 C29 electronic and optical products; Chemicals and chemical products; Electrical
manufacturing equipment; Machinery and equipment n.e.c.; Motor vehicles, trailers and semi-
 C30
 trailers; Other transport equipment

 12
Knowledge H50 H51 J58 Water transport services; Air transport services; Publishing services; Motion
intensive J59_J60 J61 picture, video and television programme production services, sound recording
service sectors and music publishing; programming and broadcasting services;
 J62_J63 K64
 Telecommunications services; Computer programming, consultancy and related
 K65 K66 services; information services; Financial services, except insurance and pension
 M69_M70 funding; Insurance, reinsurance and pension funding services, except
 M71 M72 compulsory social security; Services auxiliary to financial services and insurance
 services; Legal and accounting services; services of head offices; management
 M73
 consulting services; Architectural and engineering services; technical testing
 M74_M75
 and analysis services; Scientific research and development services; Advertising
 N78 N80- and market research services; Other professional, scientific and technical
 N82 services; veterinary services; Employment services; Security and investigation
 O84 P85 services; services to buildings and landscape; office administrative, office
 Q86 Q87_Q88 support and other business support services; Public administration and defence
 services; compulsory social security services; Education services; Human health
 R90-R92 R93
 services; Social work services; Creative, arts and entertainment services; library,
 archive, museum and other cultural services; gambling and betting services;
 Sporting services and amusement and recreation services

Other service C33 D35 Repair and installation services of machinery and equipment; Electricity, gas,
sectors E36 E37-E39 steam and air-conditioning; Natural water; water treatment and supply services

 F G45 G46 Sewerage; waste collection, treatment and disposal activities; materials
 recovery; remediation activities and other waste management services;
 G47 H49
 Constructions and construction works; Wholesale and retail trade and repair
 H52 H53 services of motor vehicles and motorcycles; Wholesale trade services, except of
 I L68B motor vehicles and motorcycles; Retail trade services, except of motor vehicles
 L68A N77 and motorcycles; Land transport services and transport services via pipelines;
 Warehousing and support services for transportation; Postal and courier
 N79 S94
 services; Accommodation and food services; Real estate services (excluding
 S95 S96 imputed rent); Imputed rents of owner-occupied dwellings; Rental and leasing
 TU services; Travel agency, tour operator and other reservation services and
 related services; Services furnished by membership organisations; Repair
 services of computers and personal and household goods; Other personal
 services; Services of households as employers; undifferentiated goods and
 services produced by households for own use; Services provided by
 extraterritorial organisations and bodies

3.4 Parameter estimation
Total factor productivity
The econometric framework is designed to estimate parameters for the underlying macro-
economic model; it represents private R&D decisions and productivity developments at the
level of economic sectors. In line with the theoretical framework introduced in the previous
section, the total factor productivity is determined both by innovation and adoption process
that are present also in the multifactor productivity equation. This formulation constitutes a
reduced form representation of the canonical Schumpeterian growth theory, where innovation-
imitation processes lie at the heart of the productivity growth and allow poorer countries to
catch-up with the richer ones.
The econometrically estimable equation of the multi-factor productivity growth is derived from
the theoretical framework (equation 1) and takes the following form:

 13
∗

 ln ( ) = 1 ln ( ∗ )
 −1 −1
 −1 −1
 + 2 ln ( ∗ ) + 3 −1 + 4 −1 ln ( ∗ ) + 5 −1
 −1 −1
 −1
 + 6 −1 ln ( ∗ ) + + + (2)
 −1
where subscripts c, s are country and sector indexes respectively, while t denotes the time
period. The level of the total factor productivity is given by TFP, with TFP* being the leader’s
total factor productivity. Variable H denotes the level of the human capital stock as measured by
the share of highly skilled workers in the total employment, and RD is the level of R&D intensity
as measured by private expenditures per value added (output).
The first two terms on the right-hand-side in equation (2) are standard in the literature and
measure the productivity growth at the frontier and the technological gap between frontier and
non-frontier sectors (“catch-up” term) respectively. The productivity growth of the
technological leader captures the link between the TFP growth for the catching-up sector
through the innovation and knowledge spillovers. The catch-up term aims to explain how the
adoption of new technologies affect the innovation process of different sectors. The intuition
behind is that there are greater potentials in adopting new technologies the higher the
technological gap is. In this setup, the adoption of the existing technology and knowledge could
occur via different channels (machinery and equipment, trade, employment, networks etc.) that
show up in the productivity gap between industries.
As can be seen from equation (2), our framework for modelling innovation and productivity
follows closely Griffith et al. (2001) and Acemoglu et al. (2006), where two channels of
adjustment are at work between R&D and the productivity growth. Firstly because higher R&D
spending could create new knowledge and secondly because it facilitates the adoption of
knowledge or technology created elsewhere. For this reason, we include in our regressions the
interactions between R&D and productivity gap. Benhabib and Spiegel (2005) have proposed
that a similar idea holds for the human capital. On the one hand, higher human capital could
create more knowledge in the economy. On the other hand, could increase the ability of a
firm to adopt new technologies. To control for the possible latter effect, we have included
another interacting term between human capital and productivity gap in the estimable
equation.
For econometric estimations, we combine four different databases that provide data about
variables in the estimable equation (2). For sectoral level data, we use the EU-KLEMS database
which covers 28 countries of which most of them are OECD countries until the year 2016.
Depending on the variable, these data series span a long time period starting from around 1970
for mainly Western European countries, Korea and Japan and from the 1990s from non-Western
European countries. In this database, information is contained for 107 categories of industries,
of which 37 categories form head categories at a 2-digit level of which one is at a 1-digit level for
total industries. The coverage of services counts 45 sectors in which both 3-and 2-digit category
levels are included. Within the business services category, 12 out of totally 32 represent head
categories on a 2-digit level. The personal services category has in total 7 head categories on 2-
digit level of which two services sector no data is given. We use the latest release of the database
from the end of 2019 that provides NACE Rev.2 sectoral classification presented in Table 4
above. For measuring the human capital stock, we use OECD country level data on the share of
highly skilled people in the total employment. Finally, we complement our dataset with OECD’s
main science and innovation indicators (MSTI). From the MSTI database, we use series on
government-financed expenditures on R&D, on education and social programs as a percentage
of government budget allocations for R&D, and on government expenditures on R&D policies in
OECD countries.

 14
Table 5 Sector-specific multi-factor productivity estimates
 Pooled Traditional High-tech Medium- Low-tech Knowledge Other
 Manufact. tech Manufact. intensive services
 Manufact. services

D.TFP* 0.100** 0.24*** 0.20*** 0.036 0.041 0.049** 0.034
Gap -0.47*** -0.21*** -0.22*** -0.51*** -0.13*** -0.077*** -0.14***
HC 0.027
HC # Gap 0.29**
RD 0.26
RD # Gap 0.47*
Time Dummy No No No Yes Yes Yes Yes
Sector FE Yes Yes Yes Yes Yes Yes Yes
Country-Sector Yes Yes No No No No No
FE
Country FE No No Yes Yes No No No
Observations 5750 372 744 572 788 1863 1411
Adjusted R2 0.354 0.389 0.345 0.324 0.203 0.328 0.277

Notes: * p < 0.05, ** p < 0.01, *** p < 0.001.
We estimate equation (2) using the least square dummy approach (or within group estimator),
where we add three different types of dummy variables that capture industry specific fixed
effects ( ), country-industry specific fixed effects ( ) and country specific trends ( ).
Estimation results are reported in Table 5.
Table 5 reports the main results of parameter estimation for the multi-factor productivity.
According to these results, there is a fairly consistent pattern across most sectoral parameters
regarding the two main determinants of the productivity growth. In line with the underlying
innovation-imitation Schumpeterian growth mechanics, our estimation results suggest that
both innovations taken at the technological frontier (D.TFP*) and the absorptive capacity of
sectors to use new technologies (Gap) are essential drivers to productivity growth for the great
majority of sectors.
Our econometric estimates suggest that the technological leader’s productivity growth is
positive and statistically significant, implying that there are important positive spillovers from
technological innovations occurring at the frontier that help to increase the pace of innovations
in follower regions. The strength of such spillovers appears to vary across industries with the
strongest among them found in industries comprising the traditional sector. Spillovers are
statistically insignificant also for the medium and low-tech manufacturing sector, as well as for
the service industry, which are knowledge extensive. These estimates also suggest that the
spillover effects from frontier growth differ between sectors with respect to the technology
needed or used within the manufacturing sector.
A similar, yet even more robust estimation result across different industries, is for the catch-up
term. According to our estimations, there are significant potentials for closing the productivity
gap within industries by either adopting or investing in new technologies. These results hold
true for all sectors. As expected, the catch-up is stronger for knowledge extensive service
industries compared to knowledge intensive sectors.
The estimation results for other model parameters determining the TFP growth are more
nuanced. Among others, there is a significant inter-sectoral variation, implying that different
economic sectors respond to different drivers of the TFP growth in a different way and with a
different intensity. These results are in line with Kancs and Siliverstovs (2016) and underline
the importance to distinguish between technological and skill intensities between sectors, as

 15
proposed in the present study. These estimated TFP coefficients will be used to parameterise
the theoretical model and for the policy scenario construction. For those sectors, for which the
estimation results are not significantly different from zero or are not sufficiently robust, we use
pooled sample estimates.
Private R&D investment
The econometric estimation of multi factor productivity parameters is complemented by an
econometric estimation of the private R&D intensity's development over time, t. To estimate
R&D intensity parameters, we follow Griffith et al. (2001) and assume that the R&D decision
follows an AR(1) process with a constant term:
 = ∗ −1 + + (15)
where and are the parameters to be estimated and is the error term. This specification
assumes that current R&D investment are affected by past R&D investments with the elasticity
 , which determines their persistence over time. The inclusion of the constant term c
determines the average R&D expenditures around which all R&D decisions deviate in each
period.
The data used to estimate equation (15) are based on the EU-KLEMS dataset as described above.
Following the standard approach in literature, our measure of the RD intensity is based on
private R&D expenditures as a share of the value added - defined as the output of each industry
excluding intermediate goods - in constant prices. On average, R&D expenditures are equal to
roughly 3 per cent of total value added, with the highest shares being observed in industries
comprising the high-tech manufacturing sector equal to roughly 10 per cent of total value added
while the lowest R&D investments as a fraction of value added is found within the traditional
sector and equal about 0.9 percent.
The estimation methodology is based on standard dynamic panel estimators of Arellano and
Bond. The estimation results are reported in Table 6. They suggest that in most sectors the R&D
investment exhibits a significant degree of persistence over time. This means that the levels of
the R&D investment do not significantly change from one period to another and to a large extent
persist over periods. Exception to this finding is the medium-tech sector, where the estimated
elasticity for the medium-tech manufacturing is not statistically different from zero.
Table 6 Sector-specific private R&D investment estimates
 Pooled Traditional Manufact. Services High-tech Low-tech Knowledge Other
 regression Manufact. Manufact. intensive services
 services
RDt-1 0.976*** 0.990*** 0.902*** 0.986*** 0.958*** 0.928*** 0.985*** 0.907***

cons 0.00129*** 0.000278* 0.00640 0.000326*** 0.00627** 0.00161*** 0.000522*** 0.000366***

Obs. 7347 472 2646 4229 925 996 2375 1854

Notes: * p < 0.05, ** p < 0.01, *** p < 0.001.
These estimated R&D coefficients will be used to parameterise the theoretical model.
Specifically, based on this equation we make projection for the development of the RD intensity
across sectors in the future, and therefore are able to calculate the expected long-run values for
the research intensity. For example, under standard stationarity assumptions, calculating the
long-run first moment of the variable RD in equation (15), we are able to uncover the expected
value to which R&D investment decision are expected to evolve in the long-run.

 16
You can also read