Re-Opening of the Economy and Managing Risks of Additional Waves
←
→
Page content transcription
If your browser does not render page correctly, please read the page content below

Consumer and Investment Management Division

  Re-Opening of the Economy and Managing Risks of Additional Waves
  (Eleventh in a Series)

  April 30, 2020

      Investment Strategy Group
This material represents the views of the Investment Strategy Group (“ISG”) in the Consumer and Investment Management Division of Goldman Sachs. It is not a product of
Goldman Sachs Global Investment Research. The views and opinions expressed herein may differ from those expressed by other groups of Goldman Sachs.
Overview of Today’s Call

• Taking Stock of COVID-19          Luciana Borio, Vice President, In-Q-Tel
                                    •   Former Director for Medical and Biodefense Preparedness Policy,
                                        National Security Council
                                    •   Former Acting Chief Scientist of the Food and Drug Administration
                                    •   Adjunct Assistant Professor of Medicine at Johns Hopkins University

• Roadmap to Re-Opening             Mark McClellan, Director, Duke-Margolis Center for Health
                                    Policy at Duke University
                                    •   Former Administrator of the Centers for Medicare & Medicaid Services
                                    •   Former Commissioner of the Food and Drug Administration
                                    •   Former member of the President’s Council of Economic Advisers

• Role of Serological Testing       Florian Krammer, Professor of Vaccinology, Icahn School of
                                    Medicine at Mount Sinai
                                    •   First in the nation to develop a COVID-19 antibody test
                                    •   Previously focused on the design of a universal influenza vaccine
                                    •   Principal Investigator of the Sinai-Emory Multi-Institutional
                                        Collaborative Influenza Vaccine Innovation Center that aims to
                                        develop improved seasonal and universal influenza vaccines

Source: Investment Strategy Group                                                                             2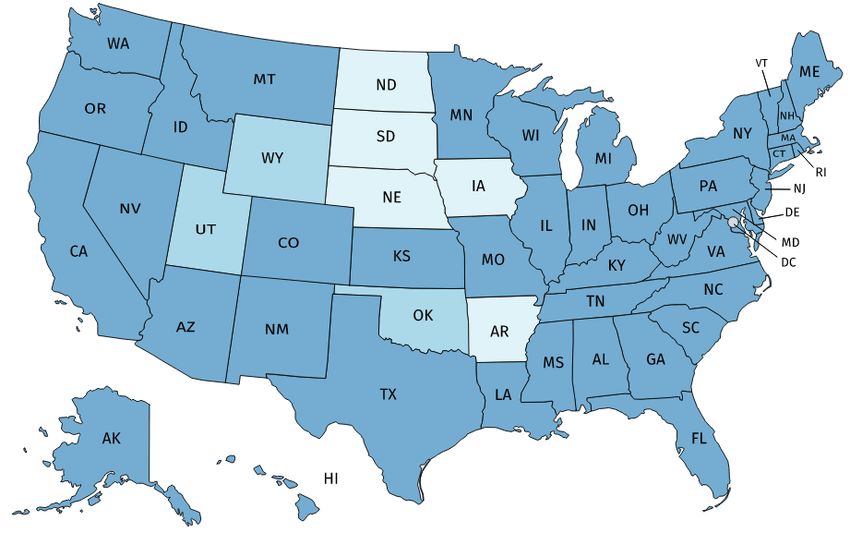
SARS-CoV-2 Pandemic Timeline

* As of April 29, 2020                                                                                                                          3
Source: Investment Strategy Group, WHO, CDC, National Health Commission of People’s Republic of China, John Hopkins University, Worldometers.
COVID-19 Infections and Fatalities in the United States

               United States (daily new cases)        United States (7-day Average)                        US Fatalities (Daily New Cases)      US Fatalities (7-day Average)
 45,000

 40,000                                                                                        3,000

 35,000       Total infections: 1,064,194                                                      2,500     Total fatalities: 61,656
              (as of midnight 29 April 2020)                                                             (as of midnight 29 April 2020)
 30,000
                                                                                               2,000
 25,000

 20,000                                                                                        1,500

 15,000                                                                                        1,000
 10,000
                                                                                                 500
  5,000

      0                                                                                            0
     21-Jan-20                  23-Feb-20              27-Mar-20                 29-Apr-20        29-Feb-20                 20-Mar-20           09-Apr-20                 29-Apr-20

  • While the number of new daily infections and fatalities remains high in the United States, the outbreak appears to
    have plateaued and may now be on a downward trajectory.

* As of April 29, 2020                                                                                                                                                            4
Source: Investment Strategy Group, WHO, CDC, National Health Commission of People’s Republic of China, John Hopkins University, Worldometers.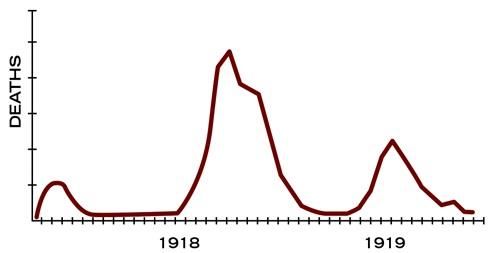
US States

1. Infections in Select US States (Daily New Cases and 7 Day Moving Average)

                      New York                                                    New Jersey                                     California
                   (Population: 19.4mm)                                         (Population: 8.9mm)                          (Population: 39.5mm)

 12,000                                                         12,000                                         12,000
 10,000                                                         10,000                                         10,000
  8,000                                                          8,000                                          8,000
  6,000                                                          6,000                                          6,000
  4,000                                                          4,000                                          4,000
  2,000                                                          2,000                                          2,000
         0                                                          0                                              0
         10-Mar               04-Apr               29-Apr           11-Mar            04-Apr          28-Apr       10-Mar              04-Apr              29-Apr
                  Confirmed infections: 299,691                                                                             Confirmed infections: 46,500
                  Confirmed fatalities: 18,015                                                                              Confirmed fatalities: 1,887

                      Michigan                                                   Georgia                                         Florida
                                                                             (Population: 10.6mm)
                   (Population: 9.9m)                                                                                       (Population: 21.5mm)
12,000                                                          12000                                          12,000
10,000                                                          10000                                          10,000
 8,000                                                           8000                                           8,000
 6,000                                                           6000                                           6,000
 4,000                                                           4000                                           4,000
 2,000                                                           2000                                           2,000
     0                                                              0                                              0
     07-Mar                 02-Apr                28-Apr            10-Mar            04-Apr          29-Apr       10-Mar              04-Apr              29-Apr

* As of April 29, 2020                                                                                                                                              5
Source: Investment Strategy Group, The COVID Tracking Project
Case Fatality Rate
1. Worldwide Case Fatality Rate (reported fatalities over confirmed infections) 2. Fatalities in Settings with Robust or Anti-Body Testing
8.0%
7.086% N Tested Infected Fatalities CFR
7.0%
USS Theodore Roosevelt 4,845 All 940 1 0.11%
6.0% USS Kidd 380 239 64 0 0%
Gangelt (Germany)* 12,446 -- -- -- 0.37%
5.0% Iceland 364,134 46,377 1,792 10 0.56%
Charles de Gaulle (ship) 1,800 All 1,081 0 0%
4.0%
New York State** 19.4mm 3,000 417 -- 0.5%
3.0% *For Gangelt, CFR was derived based on cluster study of 1,000 inhabitants.
**For New York state, CFR was derived based on results of a Phase I anti-body
2.0% testing announced by Governor Cuomo on 23 April.
1.0%
0.0%
20-Jan 9-Feb 29-Feb 20-Mar 9-Apr 29-Apr
• The case fatality rate, based on confirmed infections and fatalities, has been increasing steadily since mid-
February.
• However, in locations with robust or near universal testing, and now with anti-body testing, the case fatality rate is
significantly lower.
* As of April 29, 2020 6
Source: Investment Strategy Group, WHO, Worldometers, LA Times, US Navy, Navy Times, University Hospital Bonn.Reproduction Number (R0) – How Have Control Measures
Impacted the Spread of the Virus
1. Reproduction Number (R0) (in the early days of the outbreak) 2. Estimates of the Reproduction Number (R0)
SARS MERS SARS-CoV-2 H1N1 Seasonal Flu
R0
Without controls 2.2 - 3.28
R0 (reproduction number)* 2 - 4Therapies and Vaccines: Recent Developments
1. Potential Therapies
Product Developer Anticipated Next Steps
Remdesivir Gilead FDA's Emergency Authorization Use
Favilavir Fujifilm Phase 2 trial in US started April 2020
RECOVERY trial results expected by
Chloroquine or hydroxychloroquine June 2020
Lenzilumab Humanigen, Inc. Phase 3 recruitment expected
REGN3048-3051, Antibodies from mice Regeneron Phase 1 expected to start June 2020
2. Potential Vaccines
Product Developer Anticipated Next Steps
Phase 1 started March 2020, study ends
mRNA Moderna June 2021; Phase 2 to start Q2 2020;
Phase 3 to start fall 2020
Non-replicating viral vector; Ad26 (alone FIH study starts in Sep 2020; First
Johnson&Johnson
or with MVA boost) batches available in Q1 2021
Non-replicating viral vector; ChAdOx1 Jenner Institute, Oxford Phase 1/2 began April 2020
University
BCG Vaccine Texas A&M University Recruiting volunteers
8
Source: Investment Strategy Group, Milken Institute. Texas A&M, NY TimesSome US States Are Moving to Lift Restrictions
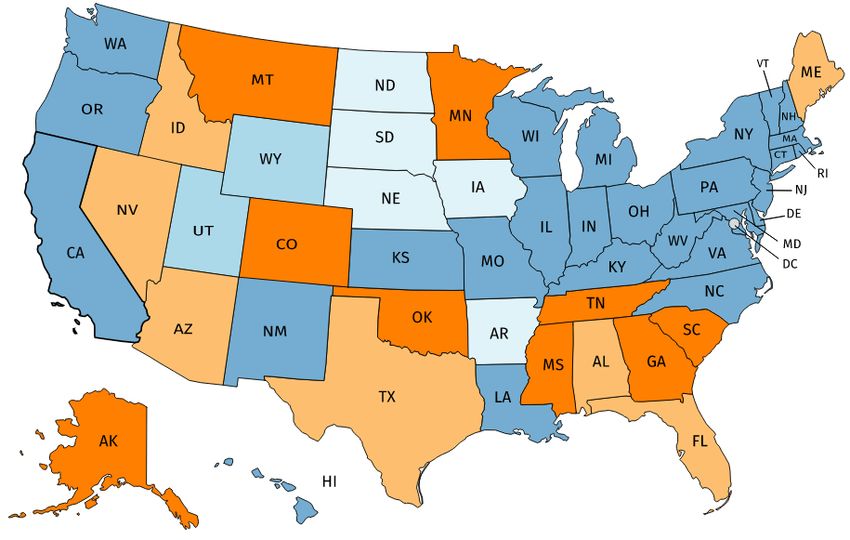
1. US states with restrictions in effect (week of 20 April 2020) 2. US states with restrictions in effect (week of 27 April)
Statewide orders Lifting restrictions
Orders in parts of a state Restrictions expire on 30 April
Few to no restrictions
• During the height of the pandemic from March to mid-April, the majority of US states imposed some level of
temporary restrictions on socio-economic activities.
• Some governors are now moving to lift elements of these restrictions and more are expected to modify theirs as
they approach the expiration date on their orders.
Source: Investment Strategy Group, New York Times; Wall Street Journal; Mapchart 9A Roadmap to Reopening
“
This report provides a road map for navigating through the
current COVID-19 pandemic in the United States. It outlines
specific directions for adapting our public-health strategy as
we limit the epidemic spread of COVID-19 and are able to
transition to new tools and approaches to prevent further
spread of the disease. We outline the steps that can be taken
as epidemic transmission is brought under control in different
regions. These steps can transition to tools and approaches
that target those with infection rather than mitigation tactics
that target entire populations in regions where transmission is
widespread and not controlled. We suggest measurable
milestones for identifying when we can make these
transitions and start reopening America for businesses and
”
families.
10
Source: Investment Strategy Group, AEIWhite House Guidelines to Reopening
Phase 1 + no rebound Phase 2 + no rebound Phase 3
Gating Criteria
• Symptoms • Individuals • Individuals • Individuals
Downward trajectory of Vulnerable individuals should Vulnerable individuals should Vulnerable individuals can
influenza-like illnesses reported continue to shelter in place. continue to shelter in place. resume public interactions.
within 14 days When in public, maximize When in public, maximize Low-risk populations should
Downward trajectory of COVID- physical distance from others. physical distance from others. minimize time spent in crowds
like syndromic cases reported Avoid socializing in groups of Avoid social settings of 50+
within 14 days 10+. Non-essential travel can resume
Minimize non-essential travel
• Cases • Employers • Employers • Employers
Downward trajectory of Encourage telework Encourage telework Resume unrestricted staffing
documented cases within 14 days Return to work in phases Close common areas
Downward trajectory of positive Close common areas Non-essential travel can resume
tests as a % of total tests within a Minimize non-essential travel Consider special accommodation
14-day period (flat or increasing Consider special accommodation for vulnerable individuals
volume of tests) for vulnerable individuals
• Hospitals • Specific Employers • Specific Employers • Specific Employers
Schools that are currently closed Schools can re-open Visits to senior living facilities
Treat all patients without crisis
should remain closed Visits to senior living facilities can resume
care
Visits to senior living facilities should be prohibited Large venues can operate under
Robust testing program in place
should be prohibited Large venues can operate under limited distancing protocols
for at-risk healthcare workers,
Large venues can operate under moderate distancing protocols Bars may operate with increased
including antibody testing
strict distancing protocols Resume elective surgeries standing room occupancy
Resume elective surgeries Bars may operate with reduced
Bars should remain closed standing room occupancy
11
Source: Investment Strategy Group, The White HouseA Roadmap to Reopening
American Enterprise Institute National Coronavirus Response: A Roadmap to Reopening 1
Triggers to Move to
Phase 1 Slow the Spread Next Phase
• Sustained reduction in
• Maintain physical distancing • Implement surveillance systems cases for 14 days
• Increase testing capacity, build data sharing • Scale contact tracing, isolation and quarantine • Safe hospital care without
infrastructure • Encourage public to wear masks crisis standards
• Ensure functioning of health care system • Able to test all people with
• Increase supply of PPE symptoms
• Active monitoring of
confirmed cases and their
Phase 2 State by State Re-opening contacts
• Implement case-based interventions • Accelerate development of therapeutics
• Begin to relax physical distancing measures • Identify those who are immune
• Once a vaccine has been
• Special care for vulnerable populations
developed, has been tested
for safety and efficacy, and
receives FDA emergency
use authorization, states
Phase 3 Establish Immune Protection; Lift Physical Distancing
can move to Phase III
• Mass vaccination or therapeutic distribution • Serological surveys to determine population
when supply is abundant immunity
• Global vaccine scale-up and vaccination
Phase 4 Rebuild Readiness for Next Pandemic
• Develop vaccines for novel viruses in months, • Establish a national infectious disease
not years forecasting center
• Modernize & fortify the health care system • Move to coordinated governance system
Source: Investment Strategy Group, AEI. (1) Mark B. McClellan et al “National Coronavirus Response: A Roadmap to Reopening,” American Enterprise Institute, March 28, 2020. 12ICUs Appear to Have Withstood the High Demands of this Wave
of the Outbreak
1. Total Intensive Care Beds Capacity in US Community Hospitals 2. Projected COVID-19 Related ICU Needs (per day)*
Medical-Surgical Intensive Care Beds 55,663 Uncertainty ICU Beds Needed (projected)
Today: 9,670 (2,460 - 29,556)
40,000
Cardiac Intensive Care Beds 15,160
35,000
30,000
Neonatal Intensive Care Beds 22,721
25,000
20,000
Pediatric Intensive Care Beds 5,115
15,000
10,000
Burn Care Beds 1,198
5,000
Other Intensive Care Beds 7,419 0
3-Jan-20 11-Feb-20 21-Mar-20 29-Apr-20 7-Jun-20 16-Jul-20
Note: Intensive care bed counts as reported to the American Hospital Associations. *Based on modeling done by the Institute for Health Metrics and Evaluation
Total intensive care beds are not summed because the care provided is specialized.
• The expansion of ICU capacity in places like New York and California and efforts by doctors, nurses, and other
healthcare professionals avoided overwhelming the healthcare system during the peak of this wave of the outbreak.
*As of April 28, 2020 13
Source: Investment Strategy Group, American Hospital Association, Institute for Health Metrics and Evaluation.Diagnostic Testing – Key to Re-opening the Economy
1. Diagnostic Testing in the United States 2. Current and Recommend Diagnostic Testing Levels (per week)
Daily New Tests Total Tests
6,026,170 Current (as of this week) 1,597,426
7,000,000 350,000
6,000,000 300,000
230,442
American Entreprise Institute 750,000
5,000,000 250,000
Total Tests
Daily Tests
4,000,000 200,000 Rockefeller Foundation 3,000,000
3,000,000 150,000
Vital Strategies 3,150,000
2,000,000 100,000
Harvard Global Health Institute 3,815,000
1,000,000 50,000
0 0
28-Feb-20 14-Mar-20 29-Mar-20 13-Apr-20 28-Apr-20 *Note: Rockefeller Foundation’s recommendation above is the minimum.
The recommended maximum is 30,000,000 tests per week.
• After initial struggles, diagnostic testing for COVID-19 in the United States has improved considerably.
• As more states move to lift their restrictions and businesses prepare to re-start their activities, demand for both
diagnostic and anti-body testing is likely to increase further.
*As of April 29, 2020 14
Source: Investment Strategy Group, The COVID Tracking, AEI, STAT, Rockefeller FoundationContact Tracing Through Apps
• CDC deems contact tracing a key strategy for preventing 1. Select Contact Tracing Apps And Developers Around the World
further spread of COVID-19.
• However, contact tracing is a labor-intensive process.
During the high of the outbreak in Wuhan, Chinese
authorities dispatched more than 1,800 teams, with a Australia Norway China
minimum of 5 people per team to trace tens of thousands of
contacts a day.
In the US, the CDC has indicated that a substantial
expansion of public health fieldworkers will be needed to
undertake contact tracing. Independent assessments have Czechia Israel Iceland
suggested that some 300,000 fieldworkers may be needed
in order to effectively conduct contact tracing.
• A number of countries are turning to smartphone apps to help
with contact tracing.
North Macedonia Singapore Austria
• In the US, Apple and Google are expected to release by mid-
May a mobile software tool that will let iPhones and Android
devices talk to each other and enable future digital contact
tracing.
Source: Investment Strategy Group; WHO; StatNews; Google; Apple, Alipay, USA Today 15Mount Sinai Laboratory’s COVID-19 Antibody Test
1. COVID-19 ELISA IgG Antibody Test
• On March 17, a team led by virologist Florian Krammer,
PhD, at Mount Sinai, managed to develop the first in the
nation serological enzyme-linked immunosorbent assay
(ELISA) test
• There are three main advantages to this test:
Providing an accurate picture of how many people
have been infected;
Identifying people with new immunity to SARS-
CoV-2 who could care for COVID-19 patients at
zero or minimal risk; and
Identifying newly recovered patients with high
antibody levels who can donate their antibody-rich
blood, known as convalescent plasma, to
potentially save patients with severe COVID-19.
On April 15, the US Food and Drug Administration
authorized the emergency use of Mount Sinai’s test.
Source: Investment Strategy Group, Mount Sinai, FDA 16US Serological Tests
1. List of FDA Authorized Serological Test (as of 27 April)
Date of EUA Manufacturer Technology
4/1/2020 Cellex Inc. Serology IgM and IgG
4/14/2020 Ortho Clinical Diagnostics, Inc. Serology Total Antibody
4/14/2020 Chembio Diagnostic System, Inc Serology IgM and IgG
4/15/2020 Mount Sinai Laboratory Serology IgG
4/24/2020 Autobio Diagnostics Co. Ltd. Serology IgM and IgG
4/24/2020 DiaSorin Inc. Serology IgG only
4/24/2020 Ortho-Clinical Diagnostics, Inc. Serology IgG only
4/26/2020 Abbott Laboratories Inc. Serology IgG only
• Anti-body tests are proliferating in the United States and internationally, but their quality is uneven.
Source: Investment Strategy Group, FDA 17Testing the results of anti-body tests
1. Specificity in blood donor plasma specimens collected before July 2018
Total N Positive % 95% CI
Lateral Flow Assays (LFAs)
BioMedomics (US) 107 14 86.92% 79.02-92.66
Bioperfectus (China) 104 5 95.19% 89.14-.98.42
DecomBio (China) 107 11 89.72% 82.35-94.76
DeepBlue (China) 108 17 84.26% 76.00-90.55
Innovita (China) 108 4 96.30% 90.79-98.98
Premier Biotech (US) 108 3 97.22% 92.10-99.42
Sure Biotech (US/HK) 108 0 100.00% 96.64-100.00
UCP (US) 107 2 98.13% 93.41-99.77
VivaChek (US) 99 5 94.95% 88.61-98.34
Wondfo Biotech (China) 106 1 99.06% 94.86-99.98
Enzyme-linked immunosorbent assays (ELISAs)
Epitope 108 11 89.81% 82.51-94.80
Krammer Lab, Mount Sinai 108 1 99.07% 94.95-99.98
• A recent analysis of 10 rapid tests that deliver a yes-no signal for antibodies (LFAs) and two tests using a lab
technique known as ELISA demonstrated specificity greater than >99% only for two LFAs (Sure Biotech, Wondfo)
and one ELISA (Krammer Lab, Mount Sinai Hospital)
• False positives can become dangerous when making policy and personal decisions about who can go back to work.
Source: Investment Strategy Group, NYT, COVID Testing Project 18A Second Wave or a Temporary Breakdown in Strategy?
1. Daily New Infections
1600 Hong Kong Taiwan Singapore South Korea Japan
1400
1200
1000
800
600
400
200
0
20-Jan-20 09-Feb-20 29-Feb-20 20-Mar-20 09-Apr-20 29-Apr-20
• After successfully containing the initial outbreak in January and February, Japan and Singapore have recently
experienced an increase in the new number of infections.
* As of April 29, 2020 19
Source: Investment Strategy Group, Worldometers, WHO, National Health Commission of PRCLikelihood of Additional Waves
1. The 1918 Flu Pandemic (H1N1 Virus) – “Spanish Flu” 2. China: Some Restrictions Re-Imposed Due to Imported Cases
200 New confirmed cases per day
Beijing, Shanghai, Guangdong
Heilongjiang, Inner Mongolia
150
100
50
Note: There were 3 different waves of illness during the pandemic, starting in March
1918 and subsiding by summer of 1919. Pandemic peaked in the U.S. during the second
wave, in the fall of 1918. This highly fatal second wave was responsible for most of the 0
U.S. deaths attributed to the pandemic. 16-Jan 31-Jan 15-Feb 1-Mar 16-Mar 31-Mar 15-Apr
“
There’s a possibility that the assault of the virus on our nation
next winter will actually be even more difficult than the one we
just went through… We’re going to have the flu epidemic and the
coronavirus epidemic at the same time.
“
[A second round of the coronavirus] is inevitable… If
by that time we have put into place all of the
countermeasures that you need to address this, we
should do reasonably well. If we don't do that
successfully, we could be in for a bad fall and a bad
CDC Director Robert Redfield winter.
Interview with The Washington Post NIAD Director Anthony Fauci
21 April 2020
Interview with CNN
29 April 2020
Source: Investment Strategy Group, Washington Post; CNN, CDC, GIR 20Consumer and Investment Management Division Disclosures
Important Information

Thank you for reviewing this presentation. Please review the important information below.
Our Relationship with Clients. Depending on our relationship with you, we may act as an advisor, a broker-dealer, or both. Our role and obligations vary depending on the capacity in which we act.
Where we act as an advisor, our primary role is to give you advice, help you manage your investments or, where applicable, help you hire another advisor to do so. Where we act as a broker, our
primary role is to execute trades for you based on your instructions and any advice we give you is incidental to our brokerage services. How we are compensated by you (and sometimes by issuers or
managers of investments who compensate us based on what you buy) and how your Private Wealth Management (“PWM”) team is compensated may change over time and will vary depending on
various factors including, but not limited to, whether you are classified as a professional or retail client, have an advisory or brokerage account, and on the investments made in your account. Please
ask us questions to make sure you understand your rights and our obligations to you, the difference between advisory and brokerage accounts, and / or how we are compensated based on the
capacity in which we act. We are part of a full-service, integrated investment banking, investment management, and brokerage firm. Other firm businesses may implement investment strategies that
are different from the strategies used or recommended for your portfolio.
Entities Providing Services. Investment advisory services may be provided by Goldman Sachs & Co. LLC (“GS&Co.”), an affiliate, or an external manager under the wrap program sponsored by
GS&Co. Brokerage services are provided by GS&Co., member Financial Industry Regulatory Authority (“FINRA”) / Securities Investor Protection Corporation (“SIPC”). Brokerage services, banking
services (including check-writing, debit cards, direct debit, direct deposit, electronic bill pay, overdraft protection and Bank to Bank Transfers via ACH), custody, margin loans and strategic wealth
advisory services are provided by GS&Co. Financial counseling services are provided by The Ayco Company, L.P. Over-The-Counter (“OTC”) derivatives, foreign exchange forwards and related
financing are offered by GS&Co. Trust services are provided by The Goldman Sachs Trust Company, N.A. or The Goldman Sachs Trust Company of Delaware. All of these affiliated
entities are subsidiaries of The Goldman Sachs Group, Inc. (“Firm” or “GS”). Deposit products, mortgages, and bank loans are offered by Goldman Sachs Bank USA, member Federal
Deposit Insurance Corporation (“FDIC”) and an Equal Housing Lender.
GS&Co. may provide family office services to clients (“Family Office Services”). Some Family Office Services may be provided by GS&Co. and/or its affiliates; other Family Office Services may be
provided by subcontractors, independent service providers, or other third parties (collectively, “Third Party Vendors”), who are not acting as financial or investment advisors. The scope, duration,
deliverables, assigned personnel, referrals to Third Party Vendors, and delivery channels through which Family Office Services are provided will vary among clients, based upon the facts, requested
services, circumstances, personal financial goals, net worth, complexity, and/or needs of each client. Third Party Vendor services are wholly independent of those provided by GS&Co. and additional
terms of service may apply for clients entering into any separate agreements with Third Party Vendors in furtherance of Family Office Services.
Investment Strategy Group (“ISG”). ISG is focused on asset allocation strategy formation and market analysis for PWM. ISG material represents the views of ISG in the Consumer Investment
Management Division (“CIMD”) of GS. It is not financial research or a product of GS Global Investment Research (“GIR”) and may vary significantly from those expressed by individual portfolio
management teams within CIMD, or other groups at Goldman Sachs. It was not prepared in compliance with applicable provisions of law designed to promote the independence of financial analysis
and is not subject to a prohibition on trading following the distribution of financial research. If shown, ISG Model Portfolios are provided for illustrative purposes only. Your actual asset allocation may
look significantly different based on your particular circumstances and risk tolerance. If a model performance calculation is provided, it assumes that (1) each asset class was owned in accordance
with the recommended weight; (2) all tactical tilts were implemented at the time the recommendation was made; and (3) the portfolio was rebalanced every time a tactical tilt change was made and at
the end of every quarter (unless a tactical tilt was made within a month of quarter-end). If model performance is shown, it is calculated using the daily returns (actual or interpolated) of indices that ISG
believes are representative of the asset classes included in the model. Results shown reflect the total return but generally do not take into account any investment management fees, commissions or
other transaction expenses, which would reduce returns. The results shown reflect the reinvestment of dividends and other earnings. All returns are pre-tax and are not adjusted for inflation. Additional
information about the model portfolio performance calculation, including asset class benchmarks used for modeling performance and a history of tactical tilts, is available upon request.
Investment Risks and Information. Risks vary by the type of investment. Additional information regarding investments and risks may be available in applicable product materials. Before transacting
or investing, you should review and understand the terms of a transaction/investment and the nature and extent of the associated risks, and you should be satisfied the investment is appropriate for
you in light of your individual circumstances and financial condition.
•   Alternative Investments. Alternative investments may involve a substantial degree of risk, including the risk of total loss of an investor’s capital and the use of leverage, and may not be
    appropriate for all investors. Private equity, private real estate, hedge funds, and other alternative investments structured as private investment funds are subject to less regulation than other types
    of pooled vehicles and liquidity may be limited. You should review the Offering Memorandum, the Subscription Agreement, and any other applicable offering documents for risks, potential conflicts
    of interest, terms and conditions and other disclosures.
•   Commodities. Commodity investments may be less liquid and more volatile than other investments. The risk of loss in trading commodities can be substantial due, but not limited, to volatile
    political, market and economic conditions. An investor’s returns may change radically at any time since commodities are subject to abrupt changes in price. Commodity prices are volatile because
    they respond to many unpredictable factors including weather, labor strikes, inflation, foreign exchange rates, etc. In a single account, because your position is leveraged, a small move against
    your position may result in a large loss. Losses may be larger than your initial deposit. No representation is made regarding the suitability of commodity investments.
                                                                                                                                                                                                        22
Important Information
• Currencies. Currency exchange rates can be extremely volatile, particularly during times of political or economic uncertainty. There is a risk of loss when an investor has exposure to foreign
currency or holds foreign currency traded investments.
• Over-the-Counter (“OTC”) Derivatives You should carefully review the Master Agreement, including any related schedules, credit support documents, addenda and exhibits. You may be
requested to post margin or collateral at levels consistent with the internal policies of GS to support written OTC derivatives. Prior to entering into an OTC derivative transaction you should be
aware of the below general risks associated with OTC derivative transactions:
- Liquidity Risk: There is no public market for OTC derivative transactions and, therefore, it may be difficult or impossible to liquidate an existing position on favorable terms.
- Risk of Inability to Assign: OTC derivative transactions entered into with one or more affiliates of Goldman Sachs cannot be assigned or otherwise transferred without Goldman Sachs’ prior
written consent and, therefore, it may be impossible for you to transfer any OTC derivative transaction to a third party.
- Counterparty Credit Risk: Because Goldman Sachs may be obligated to make substantial payments to you as a condition of an OTC derivative transaction, you must evaluate the credit risk of
doing business with Goldman Sachs. Depending on the type of transaction, your counterparty may be Goldman Sachs & Co. LLC, a registered U.S. broker-dealer, or other affiliate of The
Goldman Sachs Group, Inc. As a broker dealer regulated by the Securities and Exchange Commission (“SEC”), Goldman Sachs & Co. LLC is subject to net capital, financial responsibility
rules, and other regulatory requirements designed to protect customer assets. Other subsidiaries of The Goldman Sachs Group, Inc. may not be registered as a U.S. broker dealer and
therefore are not be subject to similar SEC regulation.
- Pricing and Valuation: The price of each OTC derivative transaction is individually negotiated between Goldman Sachs and each counterparty and Goldman Sachs does not represent or
warrant that the prices for which it offers OTC derivative transactions are the best prices available. You may therefore have trouble establishing whether the price you have been offered for a
particular OTC derivative transaction is fair. OTC derivatives may trade at a value that is different from the level inferred from interest rates, dividends and the underlyer. The difference may
be due to factors including, but not limited to, expectations of future levels of interest rates and dividends, and the volatility of the underlyer prior to maturity. The market price of the OTC
derivative transaction may be influenced by many unpredictable factors, including economic conditions, the creditworthiness of Goldman Sachs, the value of any underlyers, and certain
actions taken by Goldman Sachs.
- Early Termination Payments: The provisions of an OTC derivative transaction may allow for early termination and, in such cases, either you or Goldman Sachs may be required to make a
potentially significant termination payment depending upon whether the OTC derivative transaction is in-the-money at the time of termination.
- Indexes: Goldman Sachs does not warrant, and takes no responsibility for, the structure, method of computation or publication of any currency exchange rates, interest rates, indexes of such
rates, or credit, equity or other indexes, unless Goldman Sachs specifically advises you otherwise.
• Emerging Markets and Growth Markets. Emerging markets and growth markets investments involve certain considerations, including political and economic conditions, the potential difficulty of
repatriating funds or enforcing contractual or other legal rights, and the small size of the securities markets in such countries coupled with a low volume of trading, resulting in potential lack of
liquidity and price volatility.
• Equity Investments. Equity investments are subject to market risk. The value of the securities may go up or down in respect to the prospects of individual companies, particular industry sectors
and/or general economic conditions. The securities of small and mid-capitalization companies involve greater risks than those associated with larger, more established companies and may be
subject to more abrupt or erratic price movements.
• Fixed Income. Fixed income securities investments are subject to the risks associated with debt securities generally, including credit/default, liquidity and interest rate risk. Any guarantee on an
investment grade bond of a given country applies only if held to maturity.
• Master Limited Partnerships ("MLPs"). MLPs may be generally less liquid than other publicly traded securities and as such can be more volatile and involve higher risk. MLPs may also involve
substantially different tax treatment than other equity-type investments, and such tax treatment could be disadvantageous to certain types of retirement accounts or charitable entities.
• Money Market Funds. Money market fund investments are not insured or guaranteed by the Federal Deposit Insurance Corporation or any other government agency. Although money market
funds seek to preserve the value of your investment at $1.00 per share, it is possible to lose money.
• Non-US Securities. Non-US securities investments involve the risk of loss as a result of more or less non-US government regulation, less public information, less liquidity, and greater volatility in
the countries of domicile of the issuers of the securities and/or the jurisdiction in which these securities are traded. In addition, investors in securities such as ADRs/GDRs, whose values are
influenced by foreign currencies, effectively assume currency risk.
• Options. Options involve risk and are not suitable for all investors. The purchase of options can result in the loss of an entire investment and the risk of uncovered options is potentially unlimited.
You must read and understand the current Options Disclosure Document before entering into any options transactions. The booklet entitled Characteristics and Risk of Standardized Options can
be obtained from your PWM team or at http://www.theocc.com/about/publications/character-risks.jsp. A secondary market may not be available for all options. Transaction costs may be significant
in option strategies that require multiple purchases and sales of options, such as spreads. Supporting documentation for any comparisons, recommendations, statistics, technical data, or other
information will be supplied upon request. 23Important Information
• Real Estate. Real estate investments involve additional risks not typically associated with other asset classes, such as sensitivities to temporary or permanent reductions in property values for the
geographic region(s) represented. Real estate investments (both through public and private markets) are also subject to changes in broader macroeconomic conditions, such as interest rates.
• Structured Investments. Structured investments are complex, involve risk and are not suitable for all investors. Investors in structured investments assume the credit risk of the issuer or
guarantor. If the issuer or guarantor defaults, you may lose your entire investment, even if you hold the product to maturity. Structured investments often perform differently from the asset(s) they
reference. Credit ratings may pertain to the credit rating of the issuer and are not indicative of the market risk associated with the structured investment or the reference asset. Each structured
investment is different, and for each investment you should consider 1) the possibility that at expiration you may be forced to own the reference asset at a depressed price; 2) limits on the ability to
share in upside appreciation; 3) the potential for increased losses if the reference asset declines; and 4) potential inability to sell given the lack of a public trading market.
• Tactical Tilts. Tactical tilts may involve a high degree of risk. No assurance can be made that profits will be achieved or that substantial losses will not be incurred. For various reasons, GS&Co.
and its affiliates may implement a tactical tilt, invest in an affiliated fund that may invest in tactical tilts, or unwind a position for its client advisory accounts or on its own behalf before your advisor
does on behalf of your account, or may implement a tactical tilt that is different from the tactical tilt implemented by advisors on client accounts, which could have an adverse effect on your
account and may result in poorer performance by your account than by Goldman Sachs or other client accounts.
• U.S. Registered Mutual Funds / Exchange Traded Funds (“ETFs”) or Exchange Traded Notes (“ETNs”). You should consider a fund’s investment objectives, risks, charges and expenses,
and read the summary prospectus and/or the Prospectus (which may be obtained from your PWM Team) carefully before investing, as they contain this and other relevant information. You may
obtain documents for ETFs or ETNs for free by 1) visiting EDGAR on the SEC website at http://www.sec.gov/; 2) contacting your PWM team; or 3) calling toll-free at 1-866-471-2526. Unlike
traditional mutual funds, ETFs can trade at a discount or premium to the net asset value and are not directly redeemable by the fund. Leveraged or inverse ETFs, ETNs, or commodities futures-
linked ETFs may experience greater price movements than traditional ETFs and may not be appropriate for all investors. Most leveraged and inverse ETFs or ETNs seek to deliver multiples of the
performance (or the inverse of the performance) of the underlying index or benchmark on a daily basis. Their performance over a longer period of time can vary significantly from the stated daily
performance objectives or the underlying benchmark or index due to the effects of compounding. Performance differences may be magnified in a volatile market. Commodities futures-linked ETFs
may perform differently than the spot price for the commodity itself, including due to the entering into and liquidating of futures or swap contracts on a continuous basis to maintain exposure (i.e.,
“rolling”) and disparities between near term future prices and long term future prices for the underlying commodity. You should not assume that a commodity-futures linked ETF will provide an
effective hedge against other risks in your portfolio.
Security-Specific References. Any reference to a specific company or security is not intended to form the basis for an investment decision and is included solely to provide examples or provide
additional context. This information should not be construed as research or investment advice and should not be relied upon in whole or in part in making an investment decision. GS, or persons
involved in the preparation or issuance of these materials, may from time to time have long or short positions in, buy or sell (on a principal basis or otherwise), and act as market makers in the
securities or options, or serve as a director of any companies mentioned herein. In addition, GS may have served as manager or co-manager of a public offering of securities by any such company
within the past 12 months. Further information on any securities mentioned in this material may be obtained upon request.
Assets Held at a Third Party Custodian. Any information (including valuation) regarding holdings and activity in accounts held by third party custodians is for your convenience and has been
supplied by third parties or by you. GS assumes no responsibility for the accuracy of such information. Information may vary from that reflected by your custodian and is as of the date of the materials
provided to us. As an accommodation to you, we may also reflect certain investments unrelated to services provided by GS, for which GS does not perform any due diligence, verify the accuracy of
information, or provide advice. Unless otherwise agreed in writing, we have not assessed whether those investments fit within your investment objective and the asset classification shown may not be
accurate.
Off-Platform Investments. To the extent you ask us for guidance in connection with investment opportunities not offered by GS, such as investments in private funds, private debt or equity, real
estate or other opportunities you source away from us, any such guidance, views, or other information we may provide is on an accommodation basis only and we will not be acting as your advisor.
We assume no obligation to determine whether the opportunity is suitable for you in connection with such investment decisions and will not assume any liability for such investment decisions. Please
review our Form ADV for information on conflicts of interest we may have in connection with any such requests.
ISG/GIR Forecasts. Economic and market forecasts presented (“forecasts”) reflect either ISG’s or GIR’s views and are subject to change without notice. Forecasts do not take into account specific
investment objectives, restrictions, tax and financial situation or other needs of any specific client. Forecasts are subject to high levels of uncertainty that may affect actual performance and should be
viewed as merely representative of a broad range of possible outcomes. Forecasts and any return expectations are as of the date of this material, and should not be taken as an indication or
projection of returns of any given investment or strategy. Forecasts are estimated, based on capital market assumptions, and are subject to significant revision and may change materially as
economic and market conditions change. Any case studies and examples are for illustrative purposes only. If applicable, a copy of the GIR Report used for GIR forecasts is available upon request.
Forecasts do not reflect advisory fees, transaction costs, and other expenses a client would have paid, which would reduce return.
Client Specific Markets. Investments held in your name with a subcustodian in the local market where traded in order to comply with local law will be indicated on your statements. 24Important Information
Performance / Estimated Income / Estimated Cash Flow. Past performance is not a guide of future results and may include investments no longer owned in current or closed accounts. Current
performance may be lower or higher than the performance data quoted. To request the most current or historical performance data, or asset classification schema information, please contact your
PWM team at the number provided on your monthly statement or toll-free in the U.S. at 1-800-323-5678. Performance reports, where shown, generally present the relevant time weighted
performance, which is a combination of daily returns compounded over a specified time period with the removal of the deposit and withdrawal impacts, and may show internal rate of return
calculations where requested. Aggregate performance may not equal the sum of returns at an investment level. Performance for advisory accounts is currently calculated net of any management fees
and might include investments for which actual market prices are not currently available, and does not include private equity positions. Performance for alternative investments is calculated using the
value of the last available partnership capital statement or NAV. If included, estimated income figures and estimated private equity future cash flows are estimates of future activity, and actual results
may vary substantially. GS&Co. has adjusted performance calculations for certain asset classes or strategies and may do so in the future. Performance of net cash (i.e., cash less margin debit) is
generally included in the total performance calculation but not displayed separately. Option performance is included in the performance of the asset class of the underlier. Margin loans are generally
excluded from advisory performance but included in brokerage performance calculations. Mutual fund and ETF investment returns and the principal value of your investment will fluctuate. As a result,
your shares when redeemed may be worth more or less than their original cost. The performance data for ETFs does not reflect a deduction for commissions that would reduce the displayed
performance. You are not subject to a sales charge for mutual funds purchased through PWM. If a sales charge were applicable, the sales charge would reduce the mutual fund’s performance.
Indices / Benchmarks. Any references to indices, benchmarks, or other measure of relative market performance over a specified period of time are provided for your information only and is not
indicative of future results. In addition to the benchmark assigned to a specific investment strategy, other benchmarks (“Comparative Benchmarks”) may be displayed, including ones displayed at your
request. Managers may not review the performance of your account against the performance of Comparative Benchmarks. There is no guarantee that performance will equal or exceed any
benchmark displayed. Where a benchmark for a strategy has changed, the historical benchmark(s) are available upon request. Inception to date (“ITD”) returns and benchmark / reference portfolio
returns may reflect different periods. ITD returns for accounts or asset classes only reflect performance during periods in which your account(s) held assets and / or were invested in the asset class.
The benchmark or reference portfolio returns shown reflect the benchmark / portfolio performance from the date of inception of your account or your initial investment in the asset class. If displayed,
estimated income figures are estimates of future activity obtained from third party sources.
Indices are unmanaged. The figures for the index reflect the reinvestment of all income or dividends, as applicable, but do not reflect the deduction of any fees or expenses which would reduce
returns. Investors cannot invest directly in indices. Where appropriate, relevant index trademarks or index information has been licensed or sub-licensed for use. Inclusion of index information is not
intended to imply that the relevant index or its affiliated entities sponsor, endorse, sell, or promote the referenced securities, or that they Period Gross Return Net Return Differential
make any representation or warranty regarding either the advisability of investing in securities (generally or specifically) or regarding the
1 year 6.17% 4.61% 1.56%
ability of the index to track market performance. Contact your PWM team for more information.
The following table provides an example of the effect of management and incentive fees on returns. The magnitude of the difference 2 years 12.72% 9.43% 3.29%
between gross-of fee and net-of-fee returns will depend on a variety of factors, and the example has been simplified. 10 years 81.94% 56.89% 25.05%
Pricing and Valuations. Prices do not necessarily reflect realizable values and are based on information considered to be reliable but are not guaranteed for accuracy, currency, or as realizable
values. Certain positions may be provided by third parties or may appear without a price if GS is unable to obtain a price and/or the security is not actively traded for a certain amount of time. Pricing
sources and methods are available upon request and are subject to change.
Fees and Charges. We have two pricing models for advisory relationships: a comprehensive fee model and a product based model. You should consider factors, including, but not limited to, your
financial needs and circumstances, investment objectives, services provided under the model, your preferences, and the size of your account. Certain account fees and expenses may be more or
less expensive depending on the model chosen. Actual fees may differ from estimated fees due to differences in strategies and amounts invested in particular strategies or overall. Charges applied to
your accounts and transactions may include execution charges (including commissions, commission equivalents, mark-ups, mark-downs and dealer spreads), investment advisory fees, and custody
fees. When we act as broker, we are generally compensated by an execution charge on a trade by trade basis. When we act as advisor, we generally earn a fee based on assets under management
and may also be earning execution charges. More information about fees and charges is included in our account agreements, fee schedules and trade confirmations. If estimated fees are shown
herein, we have included a description of our fee calculation methodology.
Where applicable, GS receives fees for certain of the Family Office Services. In the course of providing such Family Office services, GS or its subsidiaries or affiliates may offer additional services
and/or products for which additional fees or commissions are charged. These offerings create a conflict of interest and clients may be asked to acknowledge their understanding of such conflict.
Certain fees associated with Family Office Services are either charged as a single bundled fee while other fees are charged as supplemental fees, which are identified in the Family Office Services
Supplement to clients’ Customer Agreement. GS reserves the right to adjust the Family Office Services fees in the event of extraordinary circumstances.
Consolidated Reporting. Any consolidated report that GS may provide is at your request and is for informational purposes only; it is not your official statement. Information (including valuation)
regarding holdings in third party accounts or other non-GS investments may be included as a courtesy and is based on information provided by you. GS does not perform review or diligence on,
independently verify the accuracy of information regarding, or provide advice on such non-GS investments; GS assumes no responsibility for the accuracy of the source information and such assets
may not be included on GS’s books and records. While we may inform you of how a non-GS investment fits within your overall asset allocation, our classification of the investment may be different 25Important Information
than your custodian or external adviser’s classification. You should review and maintain the original source documents (including third party financial statements) and review them for any notices or
relevant disclosures. Assets held away may not be covered by SIPC. Please contact your PWM Team with any questions regarding the consolidated reporting process, including its limitations.
Tax Information. GS does not provide legal, tax or accounting advice, unless explicitly agreed in writing between you and GS, and does not offer the sale of insurance products. You should obtain
your own independent tax advice based on your particular circumstances. Where clients receive Family Office Services, the Family Office may review with you the general income tax consequences
of your investments, estate planning, philanthropic endeavors, real estate holdings, and certain other activities that may affect your income tax. The information included in this presentation, including,
if shown, in the Tax Summary section, does not constitute tax advice, has not been audited, should not be used for tax reporting, and is not a substitute for the applicable tax documents, including
your Form 1099, Schedule K-1 for private investments, which we will provide to you annually, or your monthly GS account statement(s). The cost basis included in this presentation may differ from
your cost basis for tax purposes. Information regarding your alternative investments and transactions for retirement accounts are not included in the Tax Summary section.
Notice to ERISA / Qualified Retirement Plan / IRA / Coverdell Education Savings Account (collectively, “Retirement Account”) Clients: Information regarding your Retirement Account(s)
included in this presentation is for informational purposes only and is provided solely on the basis that it will not constitute investment or other advice or a recommendation relating to any person’s or
plan’s investment or other decisions, and that none of GS, its affiliates or their employees is a fiduciary or advisor with respect to any person or plan by reason of providing the material or content in
the presentation including under the Employee Retirement Income Security Act of 1974 or Department of Labor Regulations. Unless GS agrees otherwise, any target allocation shown for such
Retirement Account represents decisions you have communicated to GS regarding such asset allocation, without any advice or recommendations from GS, after considering your financial
circumstances, objectives, risk tolerance and goals.
GS Family Office Services. Where GS provides or refers Family Office Services, it will do so based on individual client needs. Not all clients will receive all services and certain activities may fall
beyond the scope of the Family Office Services. Any asset management services provided are governed by a separate investment management agreement (as may be applicable). Personnel
providing Family Office Services do not provide discretionary management over client investments. Where GSFO provides art advisory services, such services are generally limited to education; GS
does not recommend purchasing art or collectibles as an investment strategy, provide formal or informal appraisals of the value of, or opine on the future investment potential of, any specific artwork
or collectible. Upon your request, the Family Office Wealth Advisory Services (“WAS”) team may discuss with you various aspects of financial planning; the scope of such planning services will vary
among clients and may only include episodic and educational consultations that should not be viewed as tax advice. GS assumes no duty to take action pursuant to any recommendations, advice, or
financial planning strategies discussed with you as part of WAS services. It is your responsibility to determine if and how any such recommendations, advice, or financial planning strategies should be
implemented or otherwise followed, and you are encouraged to consult with your own tax advisor and other professionals regarding your specific circumstances. GS is not liable for any services
received from your independent advisors or the results of any incident arising from any such services or advice. Cybersecurity consultations provided by GS&Co. are intended to provide a general
overview of cyber and physical security threats, but are not comprehensive; GS is not liable for any incident following such consultations. GS is not liable for clients’ ultimate selection and utilization of
any Third Party Vendor for any Family Office Services, or the results of any incident arising from any such referral. GS is not responsible for the supervision, monitoring, management, or performance
of such Third Party Vendors and is not liable for any failure of Third Party Vendors to render services or any losses incurred as a result of such services.
Other Services. Any provided financial planning services, including cash flow analyses based on information you provide, are a hypothetical illustration of mathematical principles and are not a
prediction or projection of performance of an investment or investment strategy. Such services may not address every aspect of a client’s financial life; topics that were not discussed with you may still
be relevant to your financial situation. In providing financial services, GS will rely on information provided by, or on behalf of, clients and is not responsible for the accuracy or completeness of any
such information, nor for any consequences related to the use of any inaccurate or incomplete information. Where materials and/or analyses are provided to you, they are based on the assumptions
stated therein, which are likely to vary substantially from the examples shown if they do not prove to be true. These examples are for illustrative purposes only and do not guarantee that any client will
or is likely to achieve the results shown. Assumed growth rates are subject to high levels of uncertainty and do not represent actual trading and may not reflect material economic and market factors
that may have an impact on actual performance. GS has no obligation to provide updates to these rates.
Not a Municipal Advisor. Except in circumstances where GS expressly agrees otherwise, GS is not acting as a municipal advisor and the opinions or views contained in this presentation are not
intended to be, and do not constitute, advice, including within the meaning of Section 15B of the Securities Exchange Act of 1934.
Additional Information for Ayco Clients. References in this presentation to “PWM team” shall include your Ayco team. Ayco may provide tax advice, accounting advice, bill pay, and bookkeeping
services to certain clients. Ayco does not provide brokerage services. As part of its financial counseling services, Ayco may provide you with certain reports where similar information contained herein
is presented differently or in more or less detail. You should view each report independently and raise any questions with your Ayco team.
No Distribution; No Offer or Solicitation. This material may not, without GS’ prior written consent, be (i) copied, photocopied or duplicated in any form, by any means, or (ii) distributed to any person
that is not an employee, officer, director, or authorized agent of the recipient. This material is not an offer or solicitation with respect to the purchase or sale of any security in any jurisdiction in which
such offer or solicitation is not authorized or to any person to whom it would be unlawful to make such offer or solicitation. We have have no obligation to provide any updates or changes to this
material.
26You can also read