Industry in Romania: state of the play. SWOT analysis - Europe
←
→
Page content transcription
If your browser does not render page correctly, please read the page content below
Industry in Romania: State of the Play

Dr. Vassil Kirov

Industry in Romania: state of the play.
SWOT analysis
Project “Strengthening the industrial trade unions’ role in South East Europe in shaping the
industrial policy agenda in the light of the objectives of Europe 2020”, VS/2015/0238

Revised Version
March 2017

                                                                                                   1
Industry in Romania: State of the Play

Table of Contents

  Table of Contents ................................................................................................................................ 2
  Background ......................................................................................................................................... 3
  1. Introduction: economic and political developments setting the context ......................................... 3
  2. Industry in Romania: trends of development .................................................................................. 6
  3. Human resources and skills ........................................................................................................... 18
  4. Industrial policy in Romania ......................................................................................................... 24
  5. SWOT - Overall Industry .............................................................................................................. 30
  References ......................................................................................................................................... 33
  Annexes ............................................................................................................................................. 35

                                                                                                                                                        2
Industry in Romania: State of the Play

Background
The present analysis is carried out in the framework of the project “Strengthening the
industrial trade unions’ role in South East Europe in shaping the industrial policy agenda in
the light of the objectives of Europe 2020” (VS/2015/0238). The report follows a
methodological approach, discussed and approved by the project coordinator. The information
gathered is based on desk research of national and European policy and research documents
(the sources are presented in the references list1) and interviews and group discussions 2 (list
of respondents is included in the Annexe)3 carried out in 2016 with representatives from the
industrial trade union federations in Romania. This version of the report is revised on the
basis of the comments formulated by the participants of the Workshop in Bucharest, held on
the 19 – 20 of January 2017 4. This SWOT analysis for Romania will serve as a basis for the
industrial policy recommendations and the trade union action plans, envisaged in the project.
The structure of the report is the following: after a short presentation of the economic and
political context in the country the industrial development is analysed. The third section
focuses on human resources, working conditions and social dialogue. The fourth section
discusses industrial policy and main tools mobilised. On the basis of the analysis is compiled
a SWOT analysis5 in the fifth section.

1. Introduction: economic and political developments setting the context
Romania entered the European Union (EU) on 1st of January 2007, together with Bulgaria, but
it is still among the poorest members of the union. However, the EU membership has ensured
the access to a large market and has sent a positive signal to foreign investors. In this
perspective EU membership is considered as an opportunity for the country’s industry.
The economy of the Romania, as all the economies in South-Eastern Europe, experienced
significant changes during the post 1989 period. The decade of the 1990s was characterised
by the political instability (changes of governments and orientation), economic and social
difficulties (deindustrialization, high unemployment, poverty). After the initial transformation
recession, the country experienced a periods of continuous robust growth (especially between
the end of the 1990s and the beginning of the financial and economic crisis that started in
2008-2009, reaching more than 8% GDP growth for some years – e.g. 2006 (fig. 1 and

1
  The existing documents are analysed critically and trade union perspectives are underlined. The results of some
of the cited indexes should be examined with a caution; however they could provide useful indications, e.g. in
terms of innovation, etc.
2
  I would like to thank all the respondents for the time dedicated and their valuable feedback. Special thanks to
Gabriel Stanescu, SN Petrom Energie and his trade union for their precious help for the organization of
interviews and group discussion in Romania.
3
  The interviews were carried out, according to a common guideline, sent in advance to respondents.
4
  I would like to thank Corrina Zierold, Anne-Marie Mureau and all the Bulgarian participants for their helpful
comments and suggestions.
5
  SWOT analysis is an analytical method which is used to identify and categorise significant internal (Strengths
and Weaknesses) and external (Opportunities and Threats) factors faced either in a particular arena, such as an
organisation, or a territory, such as a region, nation, or city.

                                                                                                                3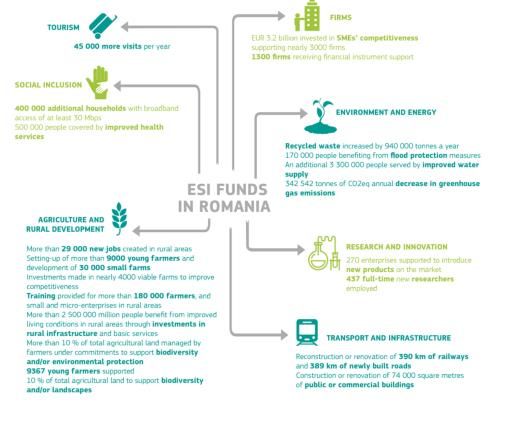
Industry in Romania: State of the Play

evolution of the main economic indicators in Annexe). After the considerable crisis recession,
Romania returned to growth since 2012 performing well compared the EU countries (3.8%
growth in 2015).
The transition years in Romania have been characterized politically with stable periods and
with number of instability moments. Since the entry in the EU, several governments were in
power. In 2015 social democrat prime-minister Victor Ponta resigns, the country is governed
by expert government. Since the beginning of 2017 social-democrats are back to power, but in
February enormous manifestations protest against government attempts to soften anti-
corruption legislation.

The macroeconomic stability (see data in table 1 in Annexe) and the relatively predictable
fiscal policy with low tax levels6 during the last 15 years are among the strengths for the
development of the Romanian industry.

Figure 1 Romania GDP Annual growth rate

Source: http://www.tradingeconomics.com/romania/gdp-growth-annual

In general, the economic policy of the country since the end of the 1990s was impacted by
neo-liberal oriented agenda. Austerity measures have been applied since the beginning of the
2008-2009 crisis. In this context the government intervention in areas relevant for the
industrial development such as R&D, vocational education and training, etc. was limited and
the social dialogue has been under attack (see more in section 4).

6
  While in the 1990s corporate and taxes were relatively high, many countries in the region introduced flat
taxation, including Romania with 16% flat tax rate (introduced in 2005).

                                                                                                               4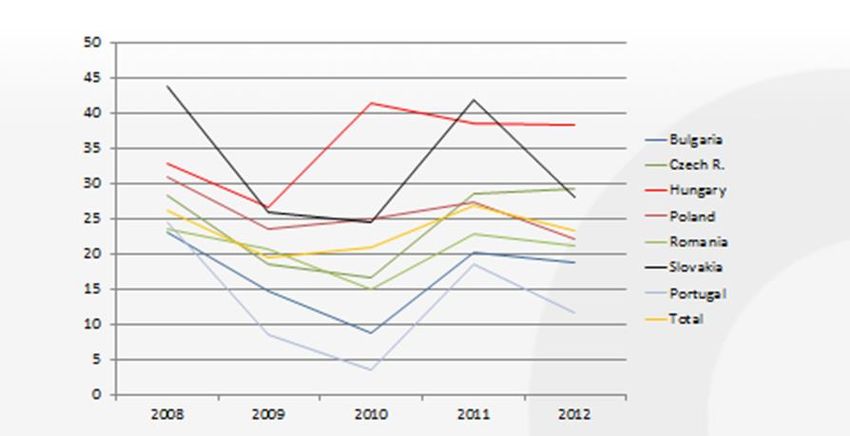
Industry in Romania: State of the Play

Despite that Romania had shown substantial convergence between in the period 2000-2007,
just prior to its EU accession, coinciding with the period of pre-crisis economic boom7, the
country has still has the second lowest GDP/capita in the EU (see fig. 2). During the 1990s,
actually a ‘de-convergence’ had taken place and although convergence towards EU average
continued from 2007, its pace had lost its momentum. However, according to the last
available data (see fig. 2), Romania GDP growth per capita for the decade 2006 – 2015 was
significant and comparable to the performance of Poland and Slovakia.

Figure 2 GDP per capita at current market prices, 2005 and 2015 (EU-28 = 100; based on PPS
per inhabitant)

Source: Eurostat, 20168
Part of the explanations for the controversial economic performance of Romania are related to
the overall institutional environment weaknesses, the perception for widely spread corruption
practices (for example the country ranks 46 from 168 countries, according to the 2015
Corruption Perceptions Index9 (even if serious anti-corruption combat was carried on during

7
  See Drahokoupil and and Galgoczi, 2014.
8
  http://ec.europa.eu/eurostat/statistics-
explained/index.php/File:GDP_per_capita_at_current_market_prices,_2005_and_2015_(EU-
28_%3D_100;_based_on_PPS_per_inhabitant)_YB16.png#file
9
  http://www.transparency.org/cpi2015#results-table

                                                                                                       5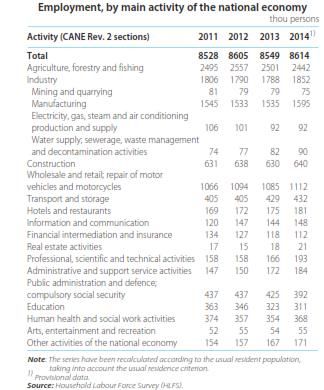
Industry in Romania: State of the Play

the last years), the persisting informal economy10, estimated to almost one third of the GDP
(30,2%), and so on. These phenomena are weaknesses for the industrial development.

2. Industry in Romania: trends of development
The Romanian industry was established mainly in the period 1945 – 1989, even if some
branches such as the oil sector have much longer history. During the socialist years, the
country focused on the development of heavy industries (metal, steel, chemical industry and
so on), developing in parallel the light industry (food, clothing and so on). Romania has
developed its industrial sector in line with the COMECON.

Box 1- Deindustrialization
In the course of the transition to a market economy, Romania underwent a dramatic process of
deindustrialization. Number of major industries in Romania disappeared or drastically shrunk:
including high-tech sectors like nuclear industry, computers, electronics, electrical
engineering, optics, chemical, pharmaceutical, military industry. The decline was also
observable in consumer goods sectors such as textile or yet the food industry (from net
exporter of food products, Romania turned to a net importer of raw and processed food).
Employment halved in industry and tripled in services (trade, hospitality tourism,
maintenance and repair services for the general population, etc.). The outcome was twofold:
on one hand, productivity dropped countrywide below the level of the 1980s; on the other the
workforce skills degraded, with the number of unskilled and low-skilled workers exceeding
that of medium or highly skilled ones. Monoindustrial regions were the most affected, facing
high levels of unemployment and migration, mainly as a result of the collapse or the
privatization of major industrial facilities. Investments declined, exports decreased sharply,
unemployment rose to unprecedented levels and all these factors impacted the industrial
sector, which is considered the basic source of economic competitiveness.
Source: Analysis provided by S.N. PETROM ENERGIE ROMANIA and U.F.S. ATLAS
ROMANIA Petrom for the purposes of the project

The bulk of the privatisation in Romania, as in Bulgaria, started later than in Central Europe
and the process was characterised as long and painful. The changes of political preferences
lead to the prevalence of various privatization mechanisms (first prioritising local investors
through mass privatization and management and employees’ buy-outs - MEBOs, then since
the end of the 1990s - foreign direct investment, see more in box 2). As in Bulgaria, the
variety of privatization methods lead to the involvement of multiple actors (such as foreign

10
  http://www.eurofound.europa.eu/observatories/eurwork/industrial-relations-dictionary/undeclared-work;
http://eprints.whiterose.ac.uk/89108/7/Williams%20-%20Out%20of%20the%20shadows.pdf

                                                                                                            6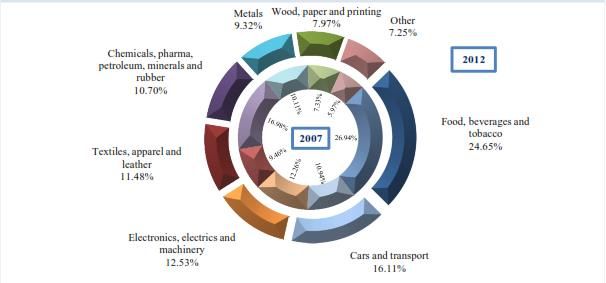
Industry in Romania: State of the Play

investors, local investors, mass privatisation funds, MEBOs) in the post-privatisation
restructuring11. The post-privatisation restructuring has been more or less completed since
several years for most of the economic activities examined in this report. However some
further restructuring is envisaged in energy production among others, according to interviews,
carried out. The fact that privatisation and post-privatisation restructuring are completed is
one of the strength of the Romanian industry, according to interviewed trade union
representatives.

Structural changes and industrial production
The structure of the industry in Romania experienced significant structural changes all along
the post 1989 period. In the early 1990s many industrial regions were already severely
affected by the large waves of restructuring. Closures of heavy industries were disastrous,
especially for mono-industrial regions dominated by one large enterprise. During the last 26 -
27 years all economic sectors have been subject to drastic changes.

Box 2 Chronology of the restructuring process

1990-1992 – collapse of production and partial disintegration of the structures of the planned
economy; first elements of transformation (foreign trade and price liberalisation, dissolution
of agricultural cooperatives), upset by a severe fall of GDP (1992 = 71 per cent of 1989),
inflation (210 per cent in 1992) and unemployment (8.4 per cent in 1992);
1993-1996 – partial recovery in the framework of a mix of cautious, gradual reforms with
some revival of centralised economic structures; limited foreign investments; privatisation
that favoured domestic investors (mass or voucher privatisation, MEBO, etc.), and avoidance
of major restructuring; subsidies to various enterprises through credits from state-owned
banks;
1997-1999 – a second big recession, due to the political decisions to further liberalise the
economy, restructure large parts of it, and close down deficit-creating companies; a severe fall
of output (industrial output declined by more than 20 per cent), which, combined with
unfavourable influences of the Asian and Russian financial crisis of 1997-1998, aggravated
this recession; privatisation of several large enterprises with strategic FDIs.
Source: Daianu and Mugrescu12

11
  Each method having its advantages and disadvantages, see the World Bank, 2006.
12
  Daniel Daianu and Bogdan Murgescu, “Which Way Goes Romanian Capitalism?” --Making a Case for
Reforms, Inclusive Institutions and a Better Functioning European Union. http://library.fes.de/pdf-files/id-
moe/10068.pdf

                                                                                                               7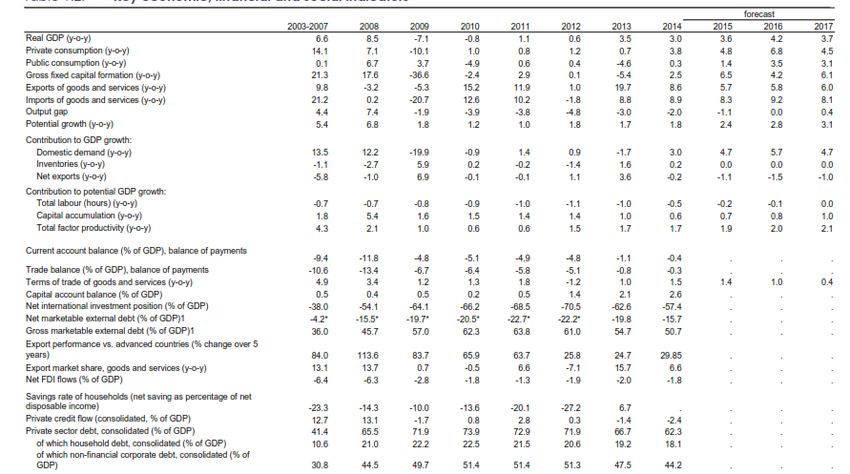
Industry in Romania: State of the Play

The recent Eurostat data (see table 4 in Annexe) suggests that industry in Romania has a
relatively stable role in the gross value added (GVA) for the period 2006 – 2015 (respectively
28,2% and 26,4%) which is larger than the EU 28 average (20,1% and 19,2%) and
comparable to some well performing Central European economies - e.g. Czech Republic
(31,0% and 32,1%). The fig. 3 (below) points out also that Romania is among the top EU
countries terms of the industry contribution to value added and employment within EU.

Figure 3 Relative importance of manufacturing (NACE Section C), 2013 (¹) (% share of value
added and employment in the non-financial business economy total)

Source: Eurostat, 201613

The largest branches of the industry in terms of their contribution to the Gross Value Added
(GVA) in 2012 (see fig. 4) are food, beverages and tobacco; car and transport; textile, apparel
and clothing, etc. (additional data for the industrial branches is available in Annexe 3).

13
  http://ec.europa.eu/eurostat/statistics-
explained/index.php/File:Figure_2_Relative_importance_of_manufacturing_(NACE_Section_C),_2013_(%C2%
9)_(%25_share_of_value_added_and_employment_in_the_non-financial_business_economy_total).png

                                                                                                     8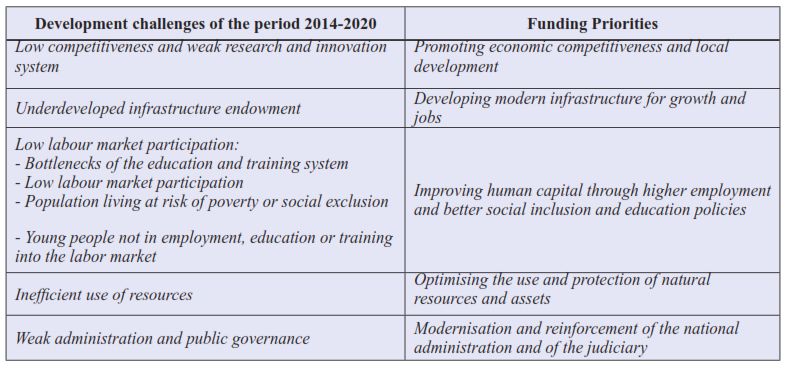
Industry in Romania: State of the Play

Figure 4 Manufacturing sectors (GVA at basic prices) - Romania

Source: Eurostat14

In Romania the industrial employment fell significantly in the post-communist period. The
overall, industry experienced a trend of relative decline in employment, with 11% of jobs lost
from 2000 to 2010. Around 230,000 jobs were lost in industry, with the most severe shrinking
in the extractive industry (-48%) and in manufacturing (-11.8%). Data comparing 2010 and
2008 shows that the greatest decline was reported in the water and electricity supply industry
(-38%), followed by the manufacturing industry (-13%) and the extractive industry (-10%).
Within the industry, the situation has been really dynamic in terms of changes. Romania,
together with Bulgaria, has experienced the largest changes in the structure of the industry
during transition (compared to the other ex-socialist economies), but differences with the
average structure of the EU remain high. Poor performance by industries means that the share
of the lower segments of the production chain is much higher. In addition, the Romanian
share of labour and resource intensive products in the exports are significantly higher, while
its exports share of technology and skills intensive products are lower than the EU average.
Nevertheless, Romania, together with Bulgaria, are the two countries managed to increase at
greater labour productivity in recent years. There is significant increase in the medium-sized
technology production and increase in the high technology level industry (table 9). This
suggests that the process of structural change in the manufacturing industry towards
increasing the participation of sectors with higher efficiency can be achieved only if the
increase in the comparative advantages of these subsectors - using development model that
allows growth export competitiveness in these sectors.

14
     In http://ec.europa.eu/DocsRoom/documents/6752/attachments/1/translations

                                                                                                             9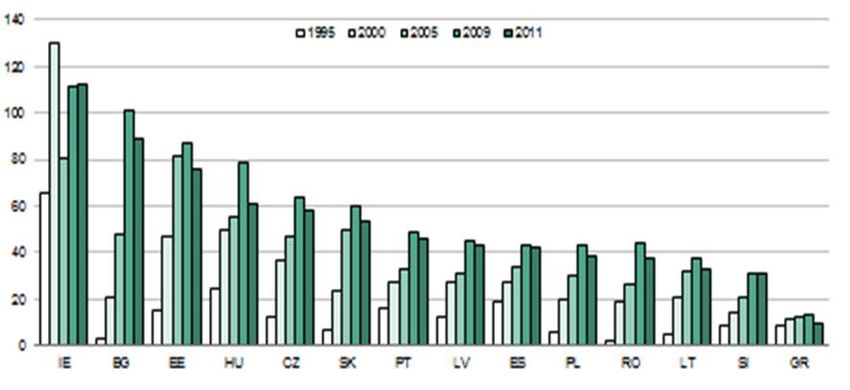
Industry in Romania: State of the Play

According to the interviews and the analysis of Romanian trade unions15, after the crisis (from
the end of 2012 on), Romania resumed economic growth, partly due to the expansion of
industrial output and partly due to the rise in the domestic demand following the relief
measures implemented by the governments since 2012. The analysis of individual industry
sectors shows that not all of them had the same response to the affecting factors triggered by
the crisis (contraction in demand, shrinking exports, dropping foreign investments, etc.).
Three major groups of industrial sectors can be identified based on their response to
recession:
     •   industrial activities experiencing general problems that cannot be exclusively assigned
         to recession - light industry, clothing, crude oil and natural gas extraction;
     •   industrial activities affected by the crisis – metallurgy, automotive;
     •   industrial activities not affected by the crisis – food, beverage and tobacco.
The difficulties that the sectors from the first group experienced in 2008 and early 2009 were
related only partially to the crisis. Even before the crisis, these sectors had been facing
problems, mainly caused by the lengthy restructuring process. For example the crude oil and
natural gas extraction has experienced successive output contractions after 2001 (4-5% per
year on average).
Most of the Romanian industry sectors, belonging to the second group, have been particularly
affected by the recession (collapse or contraction of international markets, limitation of
crediting by commercial banks as a result of the prudential regulations imposed by the
National Bank of Romania; decline of construction business, triggering a collapse of related
industrial branches; propagation of negative effects to the horizontally-connected sectors - e.g.
the contraction of the automotive industry impacted the value chain of rubber processing,
electrical machinery and equipment, metallurgy, etc. Among the most affected sectors were
metallurgy (an output contraction by 49.9% compared to the first five months of 2008), other
products obtained from non-metallic minerals (construction materials), with a production
level 31.4% lower than in the first 5 months of 2008, and the automotive industry, which
dropped by 12.7% from the first 5 months of 2008 (the rubber and plastics industry, which is
horizontally connected to the automotive industry, also dropped by 16.6% from the same
reference period).
However, other industries were not affected by the crisis and even expanded. The food
industry, for instance, had a 9% year-on-year growth at the end of 2009. A similar situation
had the beverage and tobacco industry.

15
  Analysis provided by S.N. PETROM ENERGIE ROMANIA and U.F.S. ATLAS ROMANIA Petrom for the
purposes of the project

                                                                                                   10
Industry in Romania: State of the Play
Internationalization, entry in the GVC and exports
During the post-communist transition Romania economic development has been heavily
dependent of foreign markets and foreign investment.
Foreign direct investments (FDIs) are considered a powerful tool for the modernization of the
industry for South-Eastern Europe. Foreign investment in Romania started to increase
massively since the end of the 1990s. Although FDI stock is not very high (compared to other
CEEC – see fig. 5), FDI play significant reindustrializing role, similar to the one, observed in
the Visegrad group16.
Figure 5 Inward foreign direct investment stock in selected countries 1995-2011, in % of GDP
Source: UNCTAD, 201217
The evolution of foreign direct investments in the Romanian economy had major fluctuations
during the post-communism:
• 2003-2006 - an increase in the flow of foreign investments as a result of privatization
and restructuring in industry (oil and petrochemical industry, machine building,
metallurgy); they expanded almost five times, from EUR 1.94 billion in 2003 to EUR
9.05 billion in 2006;
• 2007-2008 - foreign investments continued to grow, reaching EUR 9.49 billion;
• After 2009 - as a consequence of the economic crisis, foreign investments declined
dramatically to EUR 2.22 billion.
16
Including Poland, Hungary, Czech Republic and Slovakia.
17
Drahokoupil and and Galgoczi, 2014
11Industry in Romania: State of the Play
Among the largest foreign investors in Romania are Renault Group (EUR 2,3 billion and
17 000 employees), Continental (EUR 2 billion and 16 000 employees), Procter & Gamble,
Daimler AG and Microsoft 18.
Figure 6 Inward FDI flows by activity
Source: National Bank of Romania in European Commission19
Greenfield investments into manufacturing are a key indicator for new investments that
contribute to a re-industrialisation process and may create a potential for future growth and
export performance. Romania has medium level share of manufacturing in terms of greenfield
investments in CEE (lower than Central Europe, but better than Bulgaria), as figure 7 shows.
During the last few years greenfield investment was important in branches of manufacturing,
e.g. automotive components. According to the state agency InvestRomania, the strategic
sectors for the foreign investment are: ICT, automotive, aerospace, agriculture, bio industries
and creative industries20.
In summary, high foreign direct investment (FDI) is clearly one of the strengths of the
Romanian industry, with FDI composition supporting a modernisation and reindustrialisation
process.
18
http://investromania.gov.ro/web/business-in-romania/success-stories/
19
European Commission (2016) Country Report Romania 2016 Including an In-Depth Review on the prevention
and correction of macroeconomic imbalances,
http://ec.europa.eu/europe2020/pdf/csr2016/cr2016_romania_en.pdf
20
http://investromania.gov.ro/web/about-us/
12Industry in Romania: State of the Play
Figure 7 Share of manufacturing in greenfield projects
Source: wiiw, 201321
The exports of Romania increased 22 and total EUR 52,5 and 54,5 billion respectively for
2014 and 2015 (4% yearly increase). Almost three fourth of the Romanian exports are
designated for the EU countries23. The leading exports of the country in 2014 are transport
equipment and vehicles, followed by other manufacturing products (Fig. 8). More concretely,
the main non-agricultural export products in 2015 are: parts for motor vehicles – USD 4 951
million, insulated electric conductors – USD 3 648 million, motor cars for transport of
persons USD 3 233 million, petroleum oils, other than crude – USD 2 022 million and seats
and parts thereof – USD 1 524 million (WTO24).
21
Op. cit.
22
http://ec.europa.eu/eurostat/statistics-
explained/images/b/b2/International_trade%2C_2014%E2%80%9315_YB16.png
23
http://ec.europa.eu/eurostat/statistics-explained/images/8/8d/Intra_and_extra_EU-
28_trade%2C_2015_%28imports_plus_exports%2C_%25_share_of_total_trade%29_YB16.png
24
http://stat.wto.org/CountryProfile/WSDBCountryPFView.aspx?Language=S&Country=RO
13Industry in Romania: State of the Play
Figure 8 Structure of Romanian exports (January 2014)
Source: INSSE25
As it could be seen from fig. 9, sectors such as clothing have been one of the largest
contributors to exports by the end of the 1990s and the beginning of 2000s, but during the last
years their share has decreased to about 5% of all exports.
Figure 9 clothing exports in the total Romanian exports (in %)
25
PRESS RELEASE No. 63 of March 12, 2014, The international trade of goods in January 2014 – estimated
data
14Industry in Romania: State of the Play
Source: INSSE in Tripa, Oana and Cuc26
In summary, the increasing exports of the country are certainly one of the strength of
Romanian industry; however the structure of exports suggests weaknesses in terms of the still
important share of raw materials and low value added products.
Innovation
Innovation is identified as one of the key challenges for the Romanian industry and more
largely economy. The insufficient degree of innovativeness of Romanian companies is
underlined in the “Romania: National Strategy for Competitivness 2014 - 2020” as the key
challenge named “low competitiveness and weak research and innovation system”.
Different sources indicate the innovation related challenges of the country. According to the
Global Competitiveness Report, in 2015-2016 Romania is ranked 5427 (from 140 countries) in
terms of the Global Competitiveness Index, but 84th in terms of innovation and sophistication.
According the Innovation Union Scoreboard, Romania has one of the lowest levels in the
EU2728. In the lastly published European Innovation Scoreboard 2016, Romania and Bulgaria
are the two countries in the group of ‘modest innovators’ and in general their results over the
last few years are mixed (see fig. 10) and not converging with EU average.
Figure 10. Modest Innovators – Bulgaria and Romania
26
Industria Textila, ISSN 1222–5347, 5/2016
27
http://reports.weforum.org/global-competitiveness-report-2015-2016/competitiveness-rankings/
28
European Commission, 2013-b
15Industry in Romania: State of the Play
Source: European Innovation Scoreboard 2016
R&D investment is considered to be crucial for the innovativeness of the country. According
to the Europe 2020, the national target for Romania is that 2.0 % of GDP to be invested in
R&D (while the European target is 3 % of GDP to be invested in R&D)29. The last available
data shows that the country is still far from the achieving that target (0,38% in 2014 compared
to 0,45% in 2010).
Energy efficiency
Romania has the fourth most energy-intensive economy in the EU (with an energy intensity of
more than twice the EU average) (see fig 11). This is mainly due to the size of the
manufacturing industry relative to the economy as a whole and to the high proportion of
energy-intensive industries. Effective action is therefore needed in these industries in
particular.
Figure 11 Energy intensity of the economy, 2004 and 2014 (kg of oil equivalent per 1 000
EUR of GDP)
29
http://ec.europa.eu/europe2020/europe-2020-in-your-country/romania/progress-towards-2020-
targets/index_en.htm
16Industry in Romania: State of the Play
Source: Eurostat30
Romania made significant efforts to reach the EU 2020 targets in terms of renewables (with
national target of 24 % of total energy consumption from renewable sources by 2020, higher
than the European one and already reached)31.
***
In summary to this section, Romania has number of advantages, but still its performance in
the field of industry is poor and the country is placed among the group ‘modest but improving
competitiveness’ group, with most of the Central European and Southern European countries
in the 2014 “Member States’ Competitiveness Report: Reindustrialising Europe” 32.
30
http://ec.europa.eu/eurostat/statistics-
explained/index.php/File:Energy_intensity_of_the_economy,_2004_and_2014_(kg_of_oil_equivalent_per_1_00
0_EUR_of_GDP)_YB16.png
31
http://ec.europa.eu/europe2020/europe-2020-in-your-country/romania/progress-towards-2020-
targets/index_en.htm
32
http://ec.europa.eu/growth/industry/competitiveness/reports/ms-competitiveness-report_en
17Industry in Romania: State of the Play
3. Human resources and skills
The human resources development and skills acquisition in the industry are crucial for its
development and particularly relevant from a trade union perspective33. The sections below
examine the situation in Romania in terms of demographic development, skills supply, wages
and working conditions and social dialogue.
Demographic change
Romania seriously hit by the demographic challenge34. As a result of emigration and negative
growth, Romanian population has decreased during the transition years, including working
age population, and there are important demographic imbalances by age groups. Different
recent demographic forecasts 35 provide rather pessimistic scenarios about the demographic
developments in Romania: the Eurostat projections for the period 2010-2060 state that the
population will decrease by nearly 19% (one of the sharpest decline) and the share of the
population over 65 will reach 35%.
Thus, the demographic crisis is part of the weaknesses of the Romanian industry in terms of
labour force and skills supply. This negative trend is particularly visible in some regions of
the country. In addition, the ageing population is a pressure for the social security system.
Skills supply
Traditionally, Romanian industry and economy have well trained and qualified human
resources. Most of the indicators confirm this conclusion. Secondary school (secondary
education) and college/university (tertiary education) attainment of Romanians rose in the last
decade (Eurostat). The Europe 2020 Strategy focuses on the skills. Among the national targets
for Romania it is set that at least 26.7% of 30-34–year-olds should complete third level
education (ISCED levels 5 and 6) in 2020 (the European target is 40%). In 2015 with 25,6%
Romania is not far from reaching the target.
Figure 12 Population aged 30–34 with tertiary educational attainment (ISCED 5–8), by
country, 2015
33
Including ETUC, IndustriAll
34
See Vasile, V. http://www.ier.hit-u.ac.jp/pie/stage1/Japanese/seminar/workshop040220/Vasile.pdf
35
Eurostat, News Release, 80/2011 - 8 June 2011, Population projections 2010-2060
18Industry in Romania: State of the Play
Source: Eurostat36
But if general skills levels are high, there are indications for the existence of specific skills
gap. The Industrial Performance Scoreboard of the European Commission suggests that that
in 2011 Romania had a low share of employees with high qualifications in manufacturing
than the EU27 average of 20%. This fact is also visible from multiple studies and analyses
concluding that several sectors in the country lack qualified labour force37. Although some
attempts to address the situation have been done - the recent introduction of the dual
vocational education system and concrete initiatives of social partners - the situation is still
problematic. 38. The recent report of the Council (2016, p. 5) concludes that: “the tertiary
attainment rate is increasing, but the quality and labour market relevance of higher education
is limited. Participation in adult education is very low”39.
In summary, the educational attainment of the labour force is increasing (opportunity), but
still number of sectors and professions suffer the deficit of qualified labour and this is a
weakness and potential threat for the Romanian industry (for example investors that could
change their decisions because of the lack of qualified people).
36
http://ec.europa.eu/eurostat/statistics-
explained/images/8/82/Population_aged_30%E2%80%9334_with_tertiary_educational_attainment_%28ISCED
_5%E2%80%938%29%2C_by_country%2C_2015_%28%C2%B9%29%2C_%25.png
37
http://skillspanorama.cedefop.europa.eu/en/analytical_highligths/romania-mismatch-priority-occupations
38
https://search.oecd.org/countries/romania/ASkillsBeyondSchoolCommentaryOnRomania.pdf
39
http://ec.europa.eu/europe2020/pdf/csr2016/csr2016_romania_en.pdf
19Industry in Romania: State of the Play
Wages and working conditions
Romania has the second lowest labour costs in the EU (figure 12). Compensation of
employees (that includes gross wages and social security contributions paid by employers) in
Romania is much lower than the EU average.
Figure 13 Yearly compensation per employee in the EU27, Croatia and Norway, 2010 (Euro,
thousands)
Source: Ameco database40
The cost competitiveness in terms of wages could be strength of the economy in the short
term. However in the medium and long term wages are expected to increase (and have
increased during the recent years). The low wage levels (in comparative and real terms)
represent a significant challenge for the Romanian trade unions. As it could be seen from
table 1, wages in the industry are similar to the average wages for the country. However
inside industrial activities there are significant differences and wages in part of the light
industries (such as clothing) are very low.
Table 1 Monthly average net nominal earnings by activity of the national economy
40
In Drahokoupil and and Galgoczi, 2014
20Industry in Romania: State of the Play
Source: INSSE41
Finally, Romania has been pointed out as one of the countries with larger wage inequalities
between enterprises and between in individuals (see fig. 14 - ILO, 2016)
41
http://www.insse.ro/cms/files/publicatii/Romania_in_figures_2015.pdf
21Industry in Romania: State of the Play
Figure 14 - Wage inequality between individuals and between enterprises comparing
P90/P10 and P100/P10, selected European countries, 2010
Source: ILO42
Working conditions in Romania have certainly improved during the last years, but still the
situation in number of sectors is risky. The general public perception is that working
conditions deteriorate: 64% of Romanians say their working conditions are bad and 55% say
they deteriorated in the past five years, according to a recent Eurobarometer survey43. The
number of accidents, according to the national statistics is decreasing44.
The findings from the 5th wave of the EWCS from 201045 confirm that countries in Eastern
Europe are mainly dominated by poor balanced and low quality jobs (ref. Eurofound 2010, p.
51). Hence, jobs in these countries are mainly lower quality jobs while the percentage of good
jobs is very limited46. Examples from different quality of work elements illustrate this trend.
Still the job discretion level is the lowest for the transitional countries. In terms of cognitive
demands (defined as category of dob demand that impinge primarily on the brain processes
involved in information processing - e.g. the difficulty of the work) they manage better only
compared to the South-European (SE) model. The environmental risks are higher in the
42
ILO (2016) Global Wage Report 2016/17
Wage inequality in the workplace, http://www.ilo.org/wcmsp5/groups/public/---dgreports/---dcomm/---
publ/documents/publication/wcms_537846.pdf
43
http://ec.europa.eu/public_opinion/flash/fl_398_fact_ro_en.pdf
44
http://www.mmuncii.ro/pub/imagemanager/images/file/Statistica/Buletin%20statistic/2011/conditii%20de%20m
unca%20%20anul%20%202011.pdf
45
The 6th EWCS wave results, carried out in 2015, will be available soon
46
See also: Convergence and Divergence of Job Quality in Europe from 1995 to 2010. A report based on the
European Working Conditions Survey, EUROFOUND,
http://www.eurofound.europa.eu/sites/default/files/ef_publication/field_ef_document/ef1521en.pdf)Convergence
/Divergence Report
22Industry in Romania: State of the Play
CEEC, the physical demands (category of job demand primarily associated with the
musculoskeletal system) are also very high, after the countries from South-Eastern Europe.
Only in few areas the situation is better, compared to other regions in Europe, namely in terms
of work intensification – it is the lowest within the transition countries among all models.
With few exceptions, wages in the Romanian industry are low, compared to all the other EU
countries and working conditions are still problematic. The recent 2015 EWCS results
confirm this trend for Romania, where 52% of all jobs are qualified of ‘poor quality’47.
Social dialogue
According to Eurofound, Social Dialogue Law 62/2011 abolished collective bargaining at
national level in Romania. In addition, this law modified the union density required to
negotiate a collective agreement: now 50%+1 in the bargaining unit, compared to 1/3
previously. Labour legislation was amended under pressure from the International Monetary
Fund and the business community, and the new Law was adopted by emergency procedure.
As a result of these changes, in plants where there is no union representation, negotiations are
carried out by so-called employee representatives who have no or little bargaining experience.
The new law has weakened union power a great deal and has made it very difficult for unions
to influence and contribute to shaping the industrial policy agenda48. The new legislation
replaced the branch collective bargaining with sectoral collective bargaining and decentralised
collective bargaining by increasing the importance of the collective agreements at company
level. In 2011--–2013, the only collective bargaining was at company level, but it is not
mandatory to reach a collective agreement as a result of the bargaining. Under new conditions
interviewed trade union leaders underline their difficulties. There are different estimates of
bargaining coverage (around 30 – 35%49).
Box 3 – Trade unions in the Romanian industry
After the fall of the communist regime, UGSR (the Union of all trade unions in Romania)
broke into several sectoral federations. Competing organizations were set up in most fields
and even in most of the major companies. The main consequence was the weakening of trade
union organizations. Rivalries were often pushed by governments and/or employers.
Privatization led to the dissolution and to the loss of relevance and negotiation power of trade
unions in companies, as well as at federation and confederation level. The employers, both
local and foreign, have been hostile to trade unions and sapped their role and influence as
47
Eurofound (2016), Sixth European Working Conditions Survey – Overview report, Publications Office of the
European Union, Luxembourg, p. 131.
(https://www.eurofound.europa.eu/sites/default/files/ef_publication/field_ef_document/ef1634en.pdf)
48
See more in Chivu L, Ciutacu C, Dimitriu R and Ticlea T (2013) The Impact of Legislative Reforms on
Industrial Relations in Romania. Report for ILO. Budapest.
49
http://www.worker-participation.eu/National-Industrial-Relations/Countries/Romania/Trade-Unions
23Industry in Romania: State of the Play
much as possible, down to dissolution. At the same time, employers’ organisations
strengthened their position. The most influential of them is the Council of Foreign Investors,
an association of employers/managers in the industry privatized with foreign (primarily
European) capital.
The trade union organizations and federations remained present - although not strong - in the
public sector and in companies in which the state still holds interests (including as a minority
shareholder). Industrial activities in which trade unions continue to play a significant role: (i)
extractive industry (oil, gas, coal, iron and non-ferrous ore mining); (ii) energy: power
generation, gas transportation; (iii) transportation: (public) railways, air transport; (iv)
metallurgy; (v) automotive industry - mainly at Renault Dacia Pitesti, due to tradition and to
the privatization contract; there are actually few trade unions in the industry manufacturing
automotive components (Dräxelmaier plant in Pitesti; Euro APS/Faurecia in Mioveni; Leoni
plants in Bistritta and Pitesti; Michelin plant in Zalau; Valeo plant in Pitesti.).
Trade union confederations representative at national level:
Blocul Naţional Sindical
CNS „Cartel Alfa”
CNSLR Frăţia
Confederaţia Sindicală Naţională Meridian
Confederaţia Sindicatelor Democratice din România
Source: Petrom analysis
4. Industrial policy in Romania
Stakeholders, including the government, businesses, and research institutions need to find
effective mechanisms to agree on priorities, coordinate the required policies, and take action
on education, on supporting innovation, and on research priorities to steer the economy
towards activities with higher value added. 50
After the end of the plan, in early 1990s, in Romania, as in the other countries in South-
Eastern Europe there was a widely shared belief that the invisible hand of the market is
sufficient to regulate all the problems. For a couple of years the industry was considered by
many policy makers as a burden for the economy51. In this period stakeholders were focused
on privatization, as if the property change would automatically bring economic and social
development.
50
http://ec.europa.eu/DocsRoom/documents/6723/attachments/1/translations
51
This period was characterised as one with ‘deficit of strategic perspective’ (Zhelev, 2014).
24Industry in Romania: State of the Play
The European integration of the country stimulated the interest in programming, including in
the domain of the industry. In parallel with the different national development strategies, the
operational programmes for the EU structural funds have been adopted. The most relevant for
the industrial development are certainly those concerning competitiveness.
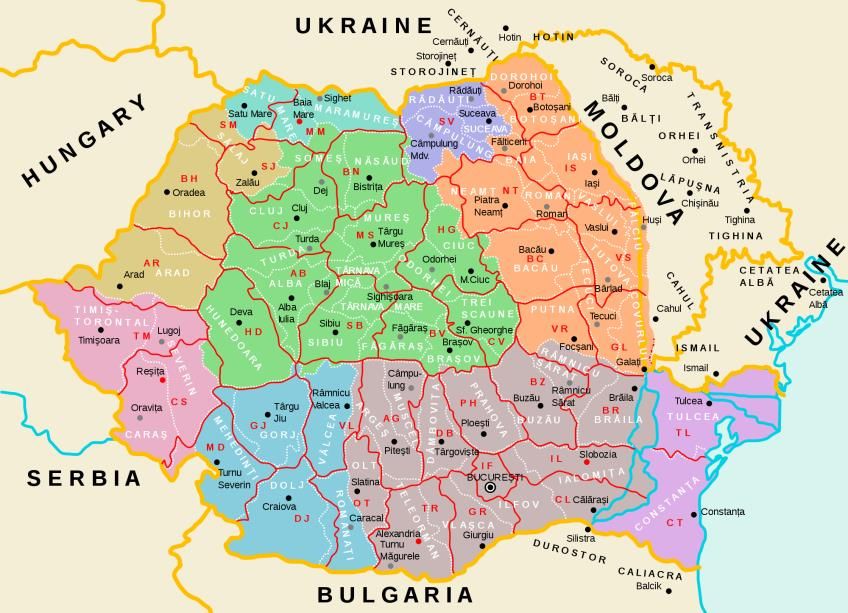
Figure 15. Regions in Romania, according to their level of development
Source: European Commission52
As it could be seen from the fig. 15, all the regions of the country, except the capital
Bucharest are part of the less developed regions, with GDP of less than 75% of the EU
average.
The main targets for the EU funds are presented in the fig. 16 below.
While EU structural funds measures in the concrete operational programmes are certainly
beneficial for the development of the sectors, covered by the IndustriAll and EFFAT affiliates
in Romania, it should be acknowledged that their resources are limited. And while the funds
use is an opportunity, the delay in their absorption could be a serious threat53.
Figure 16 Targets of the EU funds in Romania
52
http://ec.europa.eu/regional_policy/sources/policy/what/investment-policy/esif-country-
factsheet/esi_funds_country_factsheet_ro_en.pdf
53
http://www.romania-insider.com/romania-zero-eu-fund-absorption-2014-2020-allocation/
25Industry in Romania: State of the Play
Source: European Commission54
During the recent years there has been also a gradual change in the understanding of the role
of the industry and the need of re-industrialization/ renaissance of the industry. Several
strategic national documents have been adopted (but some delayed)55.
The Romania National Strategy for competitiveness 2014- 2020 identifies several strategic
challenges (table 2):
Table 2 Development challenges and funding priorities for Romania - 2014-2020
54
http://ec.europa.eu/regional_policy/sources/policy/what/investment-policy/esif-country-
factsheet/esi_funds_country_factsheet_ro_en.pdf
55
According to the European Commission, although manufacturing represents a higher proportion of total value
added in Romania than in any other Member State, the country has been lacking a strategy for industry since
2009. In 2013, the government started work on an industrial policy document and a strategy for competitiveness.
These efforts were delayed, however, partly due to the lack of political continuity and resources
26Industry in Romania: State of the Play
Source: Romania National Strategy for competitiveness 2014- 2020
The strategy clearly sets several objectives relevant to the industry: e.g. Industrial
revitalization through smart specialization and transformation of knowledge into a source of
competitive upgrading; re-defining industrial policies through the orientation towards
innovation and strengthening the functioning of the market mechanism; Integration of
network industries in the industrial value chain, etc. Different tools are envisaged for the
consultation of stakeholders but employees’ representatives are not explicitly mentioned.
The Romanian Smart Specialization Strategy56 there are several areas of strategic interest (see
box 4 below). The clear objective for value chain and technological upgrade could certainly
takes inspiration from the classification of the Romanian industrial branches as high, medium
(see fig. 10) or low, according to their technological level. Even if during the last years there
is a positive increase of the high and medium high technology industrial production, the
catch-up rate is lower than in many CEEC (table 9 in Annexe).
56
http://s3platform.jrc.ec.europa.eu/documents/20182/89935/Web_DUBLIN_Romania_background_19June2014.p
df/e98a3f94-327f-4ee4-b1b7-61f5183ed7ed
27Industry in Romania: State of the Play
Box4 – Smart specialization areas57
Smart specialization areas are areas of expected greater interest in R & D and Innovation
investment from industry:
Biochemistry,
Information and communication technology, space and security,
Energy, environment, climate change,
Eco-nano-technologies and advanced materials.
Public priority areas are those of the general competence of the state and require substantial
support from it:
Health
Heritage and cultural identity,
New and emerging technologies.
The role of Romanian social partners in the industrial policy formulation has long traditions,
but also faces multiple challenges. According to a recent Eurofound study, “Industrial policy
initiatives are often undertaken unilaterally by the government but other forms may include
social partners in different constellations, including: bipartite initiative (a common approach
by the social partners); tripartite initiative (the social partners in tandem with the public
authorities); tripartite+ initiative (the three stakeholders in combination sometimes with other
civil society players such as NGOs, research centres or qualified figures); public-private
partnership initiatives (one social partner and the public authorities); and unilateral initiatives
by a single social partner”.
The table 3 below suggests that the role and involvement of social partners is limited in most
of the tools related to industrial policy at the different governance levels. This is confirmed by
the interviewed respondents.
57
http://gov.ro/en/government/cabinet-meeting/the-national-research-development-and-innovation-plan-iii-for-
2015-2020-approved-by-the-government
28Industry in Romania: State of the Play
Table 3 Social partners’ involvement in industrial policy instruments/interventions at different
government levels (3 = high degree of involvement, 2 = involvement to some extent, 1 = low
degree of involvement, 0 = no involvement.)
National Regional Local
Policy instruments:
level level level
Public investment programmes:
infrastructure 1 3 3
construction 0 2 3
building renovation 0 0 3
Innovation programmes 3 2 2
Support for R&D 3 2 2
Cluster promotion 0 0 0
Export promotion 3 3 0
Internationalisation of SMEs 0 0 0
Improvement of access to finance:
loan 3 0 0
loan guarantee programmes 3 0 0
venture capital funding 3 0 0
Public procurement policies 3 3 3
Tax and duty policies 3 3 3
Adapting the skills base 0 0 0
Subsidies for restructuring/ bail-out of companies in
3 0 0
crisis
Social plans in case of restructuring. Training/re-
3 3 3
training
Investment incentives 3 0 0
Energy efficiency/ energy shift 3 3 3
Energy supply security 3 3 3
Access to raw materials 3 2 2
Prices of energy and raw materials 3 3 3
Source: Eurofund58
58
http://www.eurofound.europa.eu/observatories/eurwork/comparative-information/national-
contributions/romania/romania-role-of-social-dialogue-in-industrial-policies
29Industry in Romania: State of the Play
But while the involvement of social partners in general is relatively high, according to the
authors of the report, interviewed trade union officials express less optimistic attitude, namely
if they are consulted government and the administration does not take their opinion into
account. However there are number of positive practices in particular branches (metal,
metallurgy – see examples in Annexe 3)
5. SWOT - Overall Industry
This section summarizes the strengths, weaknesses, opportunities and threats for the
Romanian.
Strengths Weaknesses
Macroeconomic stability Corruption practices and ineffective judicial
system
Relatively predictable and favourable fiscal
policy Demographic crisis and ageing population
Privatisation and restructuring completed for The share of exports in Bulgaria is lower
most of the industrial sectors (with few than the CEE average
exceptions as the energy sector)
In terms of the share of complex sectors in
Existing heavy and light industry exports, Romania has still low values among
CEECs.
High foreign direct investment penetration
(FDI) in several key industrial sectors, FDI Highest energy intensity of its GDP in the
supports the modernisation and EU
reindustrialisation process
Manufacturing is hampered by low
Manufacturing growth productivity and a lack of competitiveness.
Manufacturing as the main driver of exports Productivity per worker is among the lowest
(accounting for 75 % of total exports) in the EU
High Degree of population with higher of Romania score in terms of innovation
secondary education among the lowest in the EU
30Industry in Romania: State of the Play
Available climate and natural resources for Outdated technologies in many industrial
agriculture and tourism companies
Cost Competitiveness (among the lowest
labour costs in the EU) - in the short run Educational and skills mismatches
Increasing share of high and medium-high Unbalanced energy production policy
technology industrial production
Low anticipation capacity for tackling
Development of clusters restructuring in most of the branches
Development of traditional energy sources Underdeveloped infrastructure
and renewables
Large share of informal economy
Solid social partnership in several sectors of
the industry
Lack of national and sectoral level collective
agreements.
Limited absorption of EU funds.
High energy use of the economy
Modernisation of limited number of
companies, mainly multinationals and
vulnerability of the economy.
Exports of benefits by MNC.
Emigration attitudes of young Romanians.
Opportunities Threats
31Industry in Romania: State of the Play
EU membership provides access to the Global/European economic crisis and slow
Single Market and also an important down
signalling effect to investors regarding
essential legal guarantees.
Challenges for public finances because of
ageing (social security)
Absorption of EU funds.
Shortages of well qualified specialists
Infrastructure improvement
Growing global competition
FDI, especially in high-value added sectors
Non-compliance with environmental
ICT development requirements
Tourism as a driver Political Instability
Bio-agriculture Non reformed judicial system
Natural resources (including oil) Lack of feed-back from the labour market to
the (vocational) education and training
Business environment is improving slowly
32Industry in Romania: State of the Play
References
CEDEFOP (2016) Skills Panorama. Romania: Mismatch priority occupations.
http://skillspanorama.cedefop.europa.eu/en/analytical_highligths/romania-mismatch-priority-
occupations (last accessed on the 2 December 2016)
Chivu L, Ciutacu C, Dimitriu R and Ticlea T (2013) The Impact of Legislative Reforms on
Industrial Relations in Romania. Report for ILO. Budapest.
Daianu, D. and Murgescu, B. (2013T)“Which Way Goes Romanian Capitalism?” --Making a
Case for Reforms, Inclusive Institutions and a Better Functioning European Union.
http://library.fes.de/pdf-files/id-moe/10068.pdf (last accessed on the 30 November 2016)
Drahokoupil, J. and Galgoczi, B. (2014) Renaissance of the industry in Bulgaria. ETUI
Report.
European Commission (2016), Council Recommendation on the 2016 national reform
programme of Romania and delivering a Council opinion on the 2016 convergence
programme of Romania on Romania,
http://ec.europa.eu/europe2020/pdf/csr2016/csr2016_romania_en.pdf (last accessed on the 2
December 2016)
European Commission (2014) Communication from the Commission to the European
Parliament, the Council, the European Economic and Social Committee and the Committee of
the Regions: For a European industrial renaissance. Brussels: European Commission.
European Commission (2014) European Innovation Scoreboard,
http://ec.europa.eu/growth/industry/innovation/facts-figures/scoreboards_fr (last accessed on
the 30 November 2016)
European Commission (2014) Member States Competitiveness Report 2014 Romania
http://ec.europa.eu/DocsRoom/documents/6752/attachments/1/translations (last accessed on
the 30 November 2016)
European Commission (2014) Flash Eurobarometer.
http://ec.europa.eu/public_opinion/flash/fl_398_fact_ro_en.pdf (last accessed on the 30
November 2016)
European Commission (2016) Progress towards 2020 targets
http://ec.europa.eu/europe2020/europe-2020-in-your-country/romania/progress-towards-
2020-targets/index_en.htm (last accessed on the 30 November 2016)
Eurofound (2015), Convergence and divergence of job quality in Europe 1995–2010,
Publications Office of the European Union, Luxembourg
http://www.eurofound.europa.eu/sites/default/files/ef_publication/field_ef_document/ef1521e
n.pdf (last accessed on the 30 November 2016)
33Industry in Romania: State of the Play
Eurofound (2015) Romania: Working life country profile
https://www.eurofound.europa.eu/observatories/eurwork/comparative-information/national-
contributions/romania/romania-working-life-country-profile (last accessed on the 30 November
2016)
Eurofound (2014) Romania: Role of social dialogue in industrial policies
https://www.eurofound.europa.eu/observatories/eurwork/comparative-information/national-
contributions/romania/romania-role-of-social-dialogue-in-industrial-policies (last accessed on the
30 November 2016)
Eurofound (2016), Sixth European Working Conditions Survey – Overview report,
Publications Office of the European Union, Luxembourg.
Eurostat, various publications (see footnotes)
ILO (2016) Global Wage Report 2016/17 Wage inequality in the workplace,
http://www.ilo.org/wcmsp5/groups/public/---dgreports/---dcomm/---
publ/documents/publication/wcms_537846.pdf (last accessed on the 30 November 2016)
INSSE (2014) PRESS RELEASE No. 63 of March 12, 2014, The international trade of goods
in January 2014 – estimated data, Bucharest
Musset, P. OECD (2014) Reviews of Vocational Education and Training A SKILLS
BEYOND SCHOOL COMMENTARY ON ROMANIA. OECD,
https://search.oecd.org/countries/romania/ASkillsBeyondSchoolCommentaryOnRomania.pdf
(last accessed on the 30 November 2016)
Romania National Strategy for competitiveness 2014- 2020
Transparency International (2016) Corruption Perceptions Index 2015,
http://www.transparency.org/cpi2015#results-table (last accessed on the 30 November 2016)
UNCTAD (2012)Trade Development Report, 2012,
http://unctad.org/en/PublicationsLibrary/tdr2012_en.pdf (last accessed on the 30 November
2016)
Vasile, V. (2004) Demographic Changes and Labour Market in Romania, Report
http://www.ier.hit-u.ac.jp/pie/stage1/Japanese/seminar/workshop040220/Vasile.pdf (last
accessed on the 30 November 2016)
Williams, C.C. (2013). Out of the shadows: a classification of economies by the size and
character of their informal sector. Work, Employment & Society, 28 (5), 735–753.
World Economic Forum (2016) Global Competitiveness Index (GCI)
http://reports.weforum.org/global-competitiveness-report-2015-2016/competitiveness-
rankings/ (last accessed on the 30 November 2016)
34You can also read