Disclaimer - Benchmark Holdings plc
←
→
Page content transcription
If your browser does not render page correctly, please read the page content below
Disclaimer

This Presentation is confidential and is being supplied to you solely for your information and may not be reproduced, further distributed to any other person or published, in whole or in part,
for any purpose. Subject to certain exceptions, this Presentation is not for distribution in the United States, Australia, Canada or Japan or any other jurisdiction where its distribution may
constitute a violation of the laws of such jurisdiction.

The information contained in this document (“Presentation”) has been prepared by Benchmark Holdings plc (the “Company”) and neither this Presentation, nor the information contained in it
should be considered a recommendation by the Company or any of its shareholders, directors, officers, agents, employees or advisers in relation to any purchase of the Company’s
securities, including any purchase of or subscription for any shares (or securities convertible into shares) in the capital of the Company. This Presentation has not been fully verified and is
subject to material updating, revision and further amendment. Any person who receives this Presentation should not rely or act upon it. This Presentation should not be re-distributed, re-
published, reproduced or disclosed by recipients, in whole or in part.

While the information contained herein has been prepared in good faith, neither the Company nor any of its shareholders, directors, officers, agents, employees or advisers give, have given
or have authority to give, any representations or warranties (express or implied) as to, or in relation to, the accuracy, reliability or completeness of the information in this Presentation, or any
revision thereof, or of any other written or oral information made or to be made available to any interested party or its advisers (all such information being referred to as “Information”) and
liability therefor is expressly disclaimed. Accordingly, neither the Company nor any of its shareholders, directors, officers, agents, employees or advisers take any responsibility for, or will
accept any liability whether direct or indirect, express or implied, contractual, tortious, statutory or otherwise, in respect of, the accuracy or completeness of the Information or for any of the
opinions contained herein or for any errors, omissions or misstatements or for any loss, howsoever arising, from the use of this Presentation.

This Presentation may contain forward-looking statements that involve substantial risks and uncertainties, and actual results and developments may differ materially from those expressed or
implied by these statements and past performance is no guarantee of future performance. These forward-looking statements are statements regarding the Company's intentions, beliefs or
current expectations concerning, among other things, the Company's results of operations, financial condition, prospects, revenue generation, growth, strategies and the industry in which the
Company operates. By their nature, forward-looking statements involve risks and uncertainties because they relate to events and depend on circumstances that may or may not occur in the
future. These forward-looking statements speak only as of the date of this Presentation and the Company does not undertake any obligation to publicly release any revisions to these
forward-looking statements to reflect events or circumstances after the date of this Presentation.

This Presentation has not been approved by an authorised person in accordance with Section 21 of the Financial Services and Markets Act 2000.

In no circumstances will the Company be responsible for any costs, losses or expenses incurred in connection with any appraisal or investigation of the Company. In furnishing this
Presentation, the Company does not undertake or agree to any obligation to provide the recipient with access to any additional information or to update this Presentation or to correct any
inaccuracies in, or omissions from, this Presentation which may become apparent. This Presentation does not constitute an offer or invitation to subscribe for or purchase any securities and
neither this Presentation nor anything contained herein shall form the basis of any contract or commitment whatsoever. In particular, this Presentation is for information purposes and does
not constitute an offer or invitation to subscribe for or purchase any securities in the United States. The securities of the Company have not been and will not be registered under the US
Securities Act of 1933, as amended (the “US Securities Act”) or the securities laws of any state or other jurisdiction of the United States and may not be offered, sold, resold, pledged,
delivered, distributed or transferred, directly or indirectly, into or in the United States except pursuant to an exemption from, or in a transaction not subject to, the registration requirements of
the US Securities Act and in accordance with any applicable state securities laws. There will be no public offering of the securities of the Company in the United States.

By participating in and/or accepting delivery of this Presentation you agree to be bound by the foregoing restrictions and the other terms of this disclaimer.
                                                                                                                                                                                                         1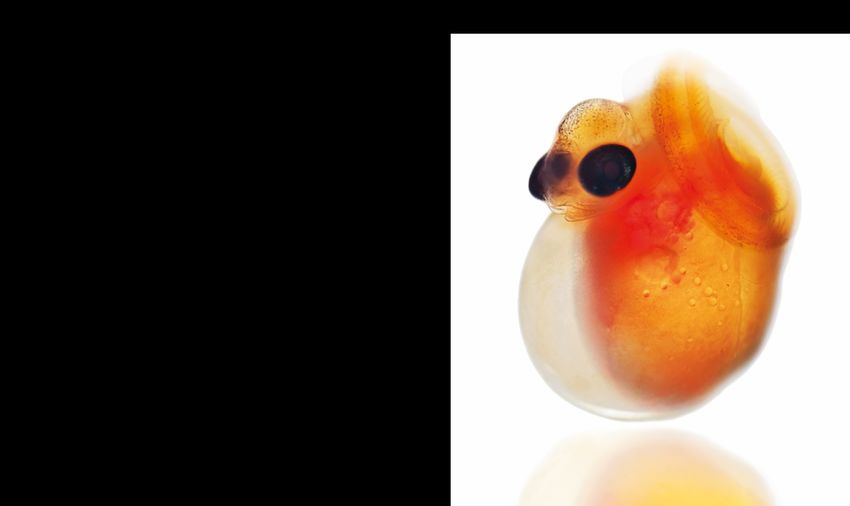
Capital
Markets Day
2 7 th M A R C H 2 0 1 8
MALCOLM PYE, CEO

                           2
BMK team
     Plc Board                                                     Operations Board

     Malcolm Pye     Mark Plampin   Alex Hambro     Susan Searle   Philippe Léger   Jan-Emil                John Marshall     James
     CEO             CFO            Chairman        Senior         Head of          Johannessen             Head of           Banfield
                                                    Independent    Advanced         Head of                 Animal Health     Head of
                                                    Director       Nutrition        Genetics                                  Knowledge
                                                                                                                              Services

                    Yngve Myhre     Hugo Wahnish                                     Ivonne Cantu            Anna Winton
    Kevin Quinn                                      Athene        Roland Bonney     Director of Investor
                    Non-Executive   Non-Executive                                                            Head of People
    Non-Executive                                    Blakeman      Group Lead,       Relations &
                    Director        Director
    Director                                         Group Legal   Key Account       Corporate
                                                     Counsel and   Management        Development
                                                     Company
                                                     Secretary

3
Benchmark’s vision

    To be the leading global player
    in aquaculture health, genetics
    and advanced nutrition
    • We address some of the main challenges
      facing the aquaculture industry
    • We focus on improving yield, quality and
      profitability for our customers
    • We bring together technology and biology
      to deliver innovative products that support
      producers throughout the growth cycle

4
Benchmark at a glance
    Global platform to serve the major aquaculture markets
                                                              Leading         Innovative
                                                              market         technology
                                                             positions

                                                             Unique          Established
                                                             product         track record
                                                             offering

                                                                Customers
    R&D facilities and farms
                                                    Group
                                                   Revenue       1435                950
    Diagnostic laboratories
                                                                   in 70           employees
    Commercial services                           £140m          countries
    Manufacturing/production

5
Agenda

    3.05 – 3.20   Macro Environment, Gorjan Nikolik, Rabobank
    3.20 – 3.45   Advanced Nutrition, Philippe Léger
    3.45 – 4.10   Animal Health, John Marshall
    4.10 – 4.35   Genetics, Jan-Emil Johannessen
    4:35 – 4.50   Financial Outlook, Mark Plampin
    4.50– 5.15    Group wide opportunities – panel discussion

6
Benchmark Capital Markets Day
            Key market dynamics

                 Gorjan Nikolik,
                 Rabobank Research: Food and Agribusiness
                 March 2018
Long term dynamics

                     8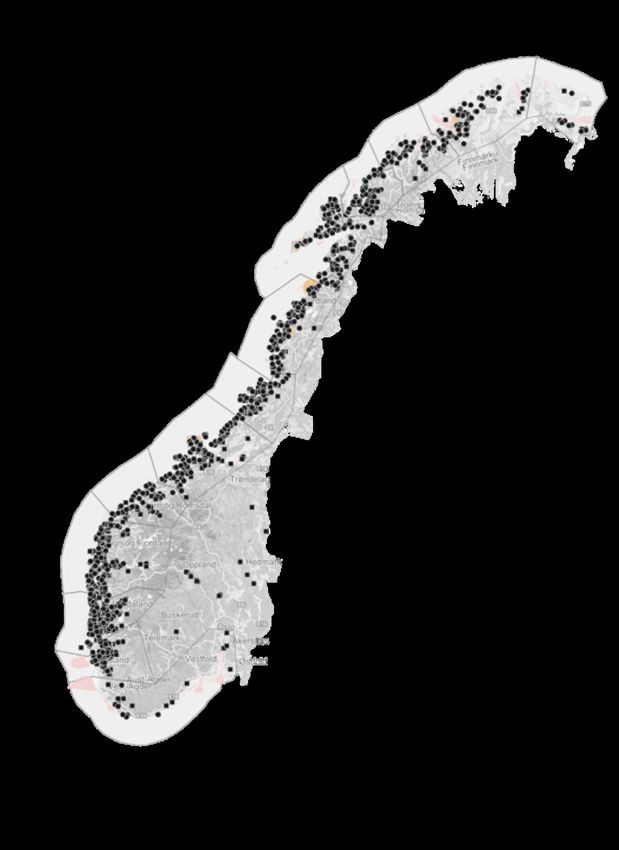
Seafood demand growth is all about Asia, especially China
OECD outlook on the Fish consumption per region worldwide (in MT)
                        Million tonnes
                        80
                                                                          China = 6x North
                                                                                                                         2006
                                                                              America                                    2007
                        70                                                                                               2008
                                                                          And will be 7x by
                                                                               2025                                      2009
                                                                                                                         2010
                        60
                                                                                                                         2011
                                                                                                                         2012
                        50                                                                                               2013
                                                                                                                         2014
                                                                                                                         2015
                        40
                                                                                                                         2016
                                                                                                                         2017
                        30                                                                                               2018
                                                                                                                         2019
                                                                                                                         2020
                        20
                                                                                                                         2021
                                                                                                                         2022
                        10                                                                                               2023
                                                                                                                         2024
                                                                                                                         2025
                          0
                               North America   Europe   Africa      Latin America &           China   Asia excl. China
                                                                       Caribbean

Source: OECD, Rabobank 2018                                                                                                     9
However, Chinese seafood demand growth will be satisfied, in a
large part, with imports… from virtually every part of the world
                              Domestic supply dynamics

                                                                                       Chinese-produced seafood is
                                                                                       becoming less competitive
Production cost drivers                     Environmental regulations                  vs. seafood from other
1. Higher cost of labour/lower labour       1. Decommissioning of inland and coastal
   availability                                fleets                                  regions, both in the Chinese
2. Disease/pollution pressure in            2. Limiting aquaculture close to urban     domestic market and in key
   aquaculture                                 areas
                                                                                       export markets
                               Import demand dynamics
                                                                                       A simultaneous reduction in
                                                                                       exports and an increase in
                                                                                       imports are likely to erode
                                                                                       the current positive net
                                                                                       trade position

Import demand drivers                       Import enablers
1. Income growth and strong currency        1. Online shopping
2. Distrust of locally-produced seafood     2. Improving logistical
   (due to pollution and scandals)             infrastructure/urbanisation

                                                                                                                      10
New feed ingredients will change the feed formula, cost
and sustainability of farming and fish marketing
Salmon feed formula evolution
16% 11% 10%
1990's 19%
69% 12% 19%
31% 10%
today 12% 1990s 31% Today 53% Future? 16%
69%
future? 10% 69% 10% 11%
53%
69%
0% 10% 20% 30% 40% 50% 60% 70% 80% 90% 100%
Marine Ingredi ent s (fish meal and fish oil ) Plant Ingredi ent s Novel Ingredients other (binders and micro ingredi ent s)
What offers a similar mix of amino acids and is available at the same scale and price?
• Expensive?
• Krill?
• Lack minerals, amino
• Marine worms?
acid profile
• Algae?
• Yeast based ingredients?
• Insect-based feeds? • Lack minerals,
amino acid profile
• Single cell proteins?
• Farmed fish? Vegetable meal • Anti-nutritional
concentrates factors
• Synthetic amino acids?
• GM canola? Future Vegetable and
alternatives nut meals
• Lower protein
• Key alternative content
Trimmings
source so far PAP & Animal • Anti-nutritional
and fish
• Logistical by-products factors
by-products
challenges • Will not work for
Fish meal
all species
11New solutions to biosecurity are changing farm design and
aquaculture business models globally
Continuous evolution of farm level technology in salmon
1 Land based farming Closed containment Open ocean and Subsea
2 3
technology farming
On-shore Off-shore
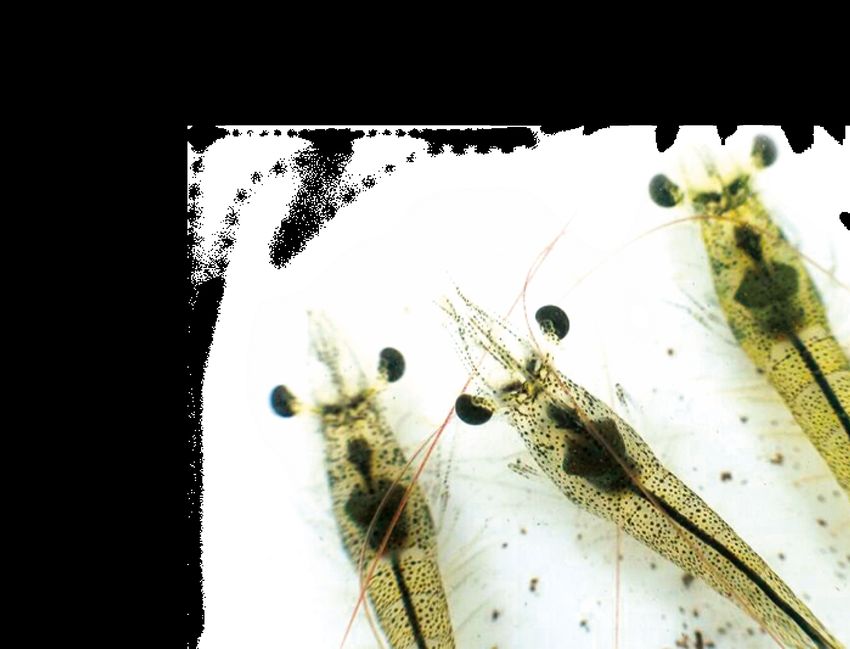
Complete solution to tackle health issues in juvenile shrimp
Benchmark Holdings product portfolio after acquisition of INVE Aqua
Shrimp life stages
Brood-stock Larvae Nursery Grow-out
Genetics
0-2 days 2-30 days 25-35 days 114-125 days
Health Veterinary health services; diagnostics
Biocides Biocides
Genetics Genetics programme
Hatchery diets & Algal first feed Probiotics
novel additives Artemia
Complete solutions for the early shrimp life stages
Sources: Company website, Rabobank Research, 2018 12High profitability cycle in
salmon farming to
persist
13After a record contraction in 2016, the supply recovery period continues but will
be limited by legislation in the medium term
YOY change in global Atlantic Salmon supply and forecast (%)
25%
22%
20%
Lice and Algae
ISA
Bloom
outbreak
15%
13%
12%
10%
10% 9%
8%
7% 7% 7%
5% 5%
5%
5% 4% 4% 4%
2%
2%
0%
-1% -1%
-5%
-7%
-10%
2001 2002 2003 2004 2005 2006 2007 2008 2009 2010 2011 2012 2013 2014 2015E 2016 2017 2018E 2019E 2020E
Source: Rabobank, Kontali, Subsecretaría de Pesca, 2018 14This comes at a time of strong global salmon demand, in both traditional and new
makers
Potential growth of salmon markets
‘000 tonnes CAGR '08-'17 CAGR '18-'28
4,000
EU 3.6% 3.6%
3,500
4.4%
US 4.7% 4.6%
3,000
Russia 0.1% 1.7%
2,500
4.9% Brazil 8.0% 5.5%
2,000
1,500 China
/HK/ 16.1% 9.4%
Vietnam
1,000
500 Others 6.4% 4.4%
0 Total 4.9% 4.4%
08
09
10
11
12
13
14
15
16
17
E
E
E
E
E
E
E
E
E
E
E
18
19
20
21
22
23
24
25
26
27
28
20
20
20
20
20
20
20
20
20
20
20
20
20
20
20
20
20
20
20
20
20
EU US Russia Brazil China/HK/Vietnam Others
Source: Rabobank, Kontali, 2018 15Consequently prices are expected to remain high for the foreseeable future,
supporting good profitability
USD/lb NOK/Kg
9 90
80
8
70
7
60
6 50
5 40
30
4
20
3
10
2 0
W1
W4
W7
W3
W6
W9
W2
W5
W8
W1
W4
W7
W10
W13
W16
W19
W22
W25
W28
W31
W34
W37
W40
W43
W46
W49
W52
W12
W15
W18
W21
W24
W27
W30
W33
W36
W39
W42
W45
W48
W51
W11
W14
W17
W20
W23
W26
W29
W32
W35
W38
W41
W44
W47
W50
W10
2015 2016 2017 2018
UB Salmon, Fil, Chile Atl, D-Trim, FOB Miami, 2-3 lbs
UB Salmon, Farmed, Fillet, Fresh, NE Europe, D-Trim, Atlantic, 3-4 lbs
Norwegian Atlantic Salmon Spot Price (Fishpool)
Source: Urner Barry, Fish Pool, Rabobank 2018 16Back to supply growth
for shrimp farming
(probably)
17Shrimp: Due to EMS, supply from China and Thailand has been
replaced with supply from Ecuador and India
Since approximately 2010 to 2017
India +400k MT China marine shrimp -500k to 400k MT
Ecuador +250k MT Thailand -200k MT
Total +650k MT Total: -700k to -600MT
Source: Rabobank, 2018 18Second half of 2017 may have been the start of a new growth phase for the
global shrimp farming sector
Global Shrimp aquaculture (marine species) 2008 – 2017E
000’ tonnes
4,000
3,500
3,000
2,500
2,000
1,500
1,000
500
0
2008 2009 2010 2011 2012 2013 2014 2015 2016 2017 2018E
China Indonesia Vietnam Thailand India
Ecuador Mexico Bangladesh Malaysia Brazil
Central America Peru Colombia/Venezuela Phillipines Others
Source: Rabobank, FAO 2018
*Chinese production includes freshwater Vannamei farming . M. Rosenbergii is not included. After 2011 we make significant corrections to FAO data based on industry sources 19Despite considerable shifts in supply, the market has remained balanced and
shrimp prices relatively stable
Shrimp prices, white and black shrimp index in the US (left axis), Thai shrimp price (right axis)
USD/lb (Baht/kg)(CNY/kg)
12 300
10 250
8 200
6 150
4 100
2 50
0 0
Jan-09 Jan-10 Jan-11 Jan-12 Jan-13 Jan-14 Jan-15 Jan-16 Jan-17 Jan-18
Urner Barry HLSO Black Tiger Shrimp Index
Urner Barry HLSO Farm - Raised White Shrimp Index
Monthly Thai White Shrimp (Vannamei), Wholesale Prices, sized 60 pieces / kg in THB
Shrimp price at Shandong Weihai Aquatic Producct Wholesale Market (CNY/kg)
Source: Urner Barry, Thai Union Frozen Foods, Rabobank 2018 20Contact Us
Rabobank
Gorjan Nikolik
Senior Analyst – Seafood
Telephone +31 30 712 3825
Mobile +31 6 1243 2463
E-mail gorjan.nikolik@rabobank.com
This document is meant exclusively for you and does not carry any right of publication or disclosure other than to Coöperatieve Rabobank U.A. (“Rabobank”), registered in Amsterdam. Neither this
document nor any of its contents may be distributed, reproduced, or used for any other purpose without the prior written consent of Rabobank. The information in this document reflects prevailing
market conditions and our judgement as of this date, all of which may be subject to change. This document is based on public information. The information and opinions contained in this document
have been compiled or derived from sources believed to be reliable; however, Rabobank does not guarantee the correctness or completeness of this document, and does not accept any liability in
this respect. The information and opinions contained in this document are indicative and for discussion purposes only. No rights may be derived from any potential offers, transactions, commercial
ideas, et cetera contained in this document. This document does not constitute an offer, invitation, or recommendation. This document shall not form the basis of, or cannot be relied upon in
connection with, any contract or commitment whatsoever. The information in this document is not intended, and may not be understood, as an advice (including, without limitation, an advice
within the meaning of article 1:1 and article 4:23 of the Dutch Financial Supervision Act). This document is governed by Dutch law. The competent court in Amsterdam, the Netherlands has
exclusive jurisdiction to settle any dispute which may arise out of, or in connection with, this document and/or any discussions or negotiations based on it. This report has been published in line
with Rabobank’s long-term commitment to international food and agribusiness. It is one of a series of publications undertaken by the global department of RaboResearch Food & Agribusiness.
©2018 - All Rights Reserved.
21Caring for growth requires
optimal nutrition
PHILIPPE LÉGER,
H E A D O F A D VA N C E D N U T R I T I O N
22What does advanced
nutrition mean for
aquaculture
Drives performance and
consistency of production
How?
By understanding and inducing biological
processes that unlock and promote
survivability, development and growth
23History
35
years of Our scientific background leads back to the
University of Ghent in the 1980s.
innovation We put 35 years of innovation at the disposal of
our customers.
1983 1991 1995 2001 2009 2012 2016 2018
Artemia
Artemia Systems NV,
started as a Spin-Off
Acquisition
Acquisition of Artemia
Systems NV by INVE
Investment
Further investment in
in diversification of
Investment in Launch
Intensified development
of an innovative animal
of
Release of the
revolutionary Sep-Art
Launch
Launch of ourofBest
Balance program,
Integration
Integration of INVE
Aquaculture into
35 th
Celebration of
our 35th anniversary
Systems nv.
from University Ghent, by INVE
and investment in production
Artemia resources,& innovative
health product portfolio SepArt a.o
technology and Best Balance
introducing a vision into BMK
Benchmark Holdings Anniversary
was the first company international expansion next to own sourcing several advanced on progressive live
Spin-off U-
to develop and market Investment in
with a complete larval Artemia
at the Great Salt Lake health PRO animal health solutions feed replacement
Ghent
certified Artemia cysts
market
nutrition portfolio
sources
since 1991
and CAE to the market
PPF presence
24 developmentManagement Team with depth of experience and track record
174 years
Phillipe Léger
Head of Advanced Nutrition
of professional experience • 39 years’ experience
• PhD Bioscience Engineering
134 years •
•
With INVE since foundation
Strong local relationships with
of experience in aquaculture major producers
Patrick Lavens Stelios Leontios Wim Martens Emiel de Becker Pierre Hugo Marc De Feyter
Innovations Director Commercial Director Operations Director Strategy Director Finance Director HR Director
• With INVE since 1999 • Joined INVE in 1993 • Joined INVE in 2000 • Joined INVE in 1995 • Joined INVE from • Joined INVE in 2002
Pfizer in 2012
• PhD in Applied • Master in Bioscience • Over 15 years • Masters in Finance • Degree in
Biological Sciences Engineering experience in • Over 19 years’ mathematics &
• Responsible for
aquaculture experience economics
• 39 years experience in • 22 years experience in strategy execution
aquaculture aquaculture • Master in Bioscience • Master degrees in • Responsible for
Engineering Finance, Taxation, People
Risk and Insurance
Management
25Sales Channels:
Strategic footprint built around core markets Direct & Distributors
% Sales per
600+ customers in 70 countries customer segment
Tianjin, China
• Probiotics
• Artemia % revenue
processing 11%
No. of
49% distributors
Europe 51% customers
10% Asia end users
80% 89%
Americas
10%
Salt Lake City
• Artemia harvesting
& processing (COOP)
• Processing for Hatchery segment Farm segment
LATAM markets Pichit, Thailand (grow-out)
• Main production
• Artemia • Probiotics
Sales & Service • Enrichment diets • Water treatments
Production • Compound micro diets • Nursery feeds and farm
Market potential feed additives
• Probiotics
• Robustness boosters
26$500m $1bn
Market Overview - Hatchery Market Overview — Farm
• Advanced nutrition plays critical role • High-end Farm feed estimated at
in hatchery $11Bn (incl. shrimp, marine fish and
• Core markets in hatchery is estimated at tilapia; FAOSTAT)
over $500m with attractive growth • Niche of Farm health and feed
• Shrimp —$360m additives market (excl. antibiotics,
vaccines) estimated at c. $1Bn
• Marine fish —$150m
• Top end only = $300m • Minor share:
• Dominant share in top end: • Just c. 1% of additive and health
• 40%+ in most markets except China market
• 33% including China • Pioneering top end segment of
innovative probiotics and water
treatment products for disease
prevention
27Pillars of growth
• Maintain technological leadership through continued innovation
Maintain leadership
• Maintain sufficient market presence and high service levels
in hatchery
• Progressing “One Benchmark” key account approach in Asia
• Enhance market penetration for probiotics & introduce novel products and
Increase market share nursery diets
in farm • Focus on integrated producers and partnerships with leading feed
companies
Develop salmon • Develop feed probiotics and booster feeds for salmon
and tilapia • Develop health products for Tilapia: feed & water treatment
“One Benchmark”
28R&D priorities
• Strengthen hatchery portfolio 2012 Best Balance
FRiPPAK Fresh #2
• Upgrades, next generation products 2013
O.Range
• Production efficiencies Sanolife GWS
2014
Sanocare SURE
Sanolife NutriLake
• Artemia 2015
Lansy Breed Performance
• Replacement diets Track record of innovation
Secure range Tilapia,
2017 D-Fense Artemia, Thalapure
Natura, EDS, FIT
• Expand into new markets
• Nursery/farm
• Disease risk, environment optimisation
• Salmon, tilapia
29Pipeline Overview
Development stage Peak projected sales
Field Market Start of
Species Development DEV VER MKT SLS
Verification preparation sales
Shrimp (SDO3) 22.8
Marine fish (FD05) 7.0
Shrimp (ART01) (ART02) 3.9
Marine fish (ART02) 0.4
Shrimp (SL18) (SL20) (SL16) 2.1 3.2
Marine fish (SL19) (SL20) (FD06) 0.4 3.0
Shrimp (SL22) (SG28) 0.1 8.5
Marine fish (SL23) 0.2
Tilapia (SC12) (SC11) (SL20) 6.1
Shrimp (SG25) (SC15) (SD29) 7.0 1.0 1.4
Marine fish (SG26) (FD07) 1.5 0.4
47.0 8.5 5.3 8.2
30A closer look Historical data on Artemia (Kg) &
Shrimp (1000 Kg) production
at top opportunities Artemia availability per ton Shrimp (Kg/Ton)
9,000 3.00
1. Artemia Replacement 8,000
2.50
Kg Artemia — 1000 kg Shrimp
7,000
• Artemia supply fully tapped:
Kg Artemia / ton Shrimp
avg. 2900 MT/a 6,000 2.00
5,000
• Shrimp is biggest 1.50
consumer >80% 4,000
• Shrimp production expected 3,000 1.00
to double by 2030 2,000
0.50
• Artemia availability per shrimp 1,000
to halve by 2030 - -
1985
1990
1995
2000
2005
2010
2015
2020
2025
2030
• Deficit gradually filled
Year
with best replacement product
Artemia Ton Shrimp Kton
kg Artemia/ton Shrimp Poly. (Artemia Ton)
Poly. (Shrimp Kton) Poly. (kg Artemia/ton Shrimp)
311. Artemia Replacement
Best Balance Sales x 1000
USD
• Current replacement diets do not meet artemia 16000
14000
nutritional value — fry quality degrading
12000
10000
• BMK has current best offering 8000
(Best Balance: sales tripled in 6 years) 6000
4000
• 100% replacement shall equal artemia 2000
BB diets x3
nutritional value 0
AC
AC
AC
AC
AC
AC
AC
11
12
13
14
15
16
17
• More high quality fry will be produced with less artemia
20
20
20
20
20
20
20
• Farmers expected to use a mix of artemia and its
replacement
BMK has long term access to
• Sophisticated hatcheries will use less artemia Great Salt Lake Artemia.
and more replacement
GSL Artemia is currently the best
• Most sophisticated hatcheries may use no artemia and most sustainable source in
• Significant demand for artemia will continue the world.
from less sophisticated hatcheries and emerging
species (crab, grouper)
32 • Do not expect cannibalisation but complementationA closer look at top opportunities
Nutrition + Health Performance Claims
Completing AAN Unique Value Proposition
Advanced Biosecurity Resilience
Nutrition reducing contamination to increase immunity and
stress resistance
Producing quality fry
• Maturation diets • D-Fense Artemia: • Sanoguard S.Pak:
pathogen free Improve immunity
• Started diets Natura
• Disinfectants • Sanolife GUT: gut health
• Enrichment diets EDS
• Sanocare FIT: Vibrio • Sanolife PRO2: Stress
• Nursery Diets control resistance
• Nutraceutical boosters
33
Protocol for enhancing Performance and Consistency in productionStrong market drivers and BMK’s success factors
1 2 3
Market drivers Mitigating Risks Success factors
• Growing demand for • #1 = Disease • Top performing products —
seafood vs stagnating science based & market
• Climatological impacts
fisheries driven
• Artemia as a limited
• Move to intensive farming • Local presence in key
resource
markets
• Professionalisation for • Industry in development:
vertical integration and • Long term commitment
fragmentation, lack of
consolidation professionalism and long • Strong customer
• Drive need for consistent term thinking relationships & service
performance and quality • Operational excellence:
• Urgent need to combat reliable quality and
disease — prevention compliant supply
• BMK unique solutions
platform when combining
AAN with other divisions
34Disease prevention drives productivity JOHN MARSHALL, H E A D O F A N I M A L H E A LT H
What does health
     mean for aquaculture
     Despite progress made using
     conventional technologies
     disease and parasites remain
     the largest restriction on the
     growth of aquaculture

     Benchmark is developing solutions for
     some of the most costly diseases

36
Experienced team John Marshall
Head of Animal Health
across disciplines • 20 years’ experience in
pharma
to commercialise • Significant experience taking
BMK pipeline •
new products to market
Ex Novartis
R&D Manufacturing Regulatory Diagnostics
Robin Wardle Bob Long Dr. Lindsey Toon Dr. Hamish Rodger
• 30+ years in aquaculture • 35+ years experience in • 20 years experience in pharma • 30+ years experience as
product development and animal and human health an aquatic veterinarian (Phd &
• Ex Merck
commercial operations Msc)
• Ex Novartis
• Ex Merck • Founding member of EU
College of Aquatic Animal
Health
37 • Specialist consultant to global
salmon farmingWe have the capabilities to succeed in aquaculture health
R&D Regulatory
• Dedicated team of 25 scientists • Experienced team with large pharma
• In-house facilities add speed and flexibility background
• Innovative platform technologies • Established relationships with regulators
and local authorities
• Partnerships with universities,
research institutes and pharma • Leveraging Group experience across
multiple jurisdictions
Manufacturing Commercialisation
• State of the art GMP facilities • Established market routes in salmon
• Scale to launch and manufacture BMK’s • Synergy with Advanced Nutrition for marine fish
broad pipeline of products • Key accounts programme
• Flexibility to utilise excess capacity • Technical sales and support — FishVet
for toll manufacturing
38In-house R&D
Speeding development
of pipeline products
Cold water trials: Scotland
• Species: Salmon and lumpfish
• Successfully delivered trials for
Ectosan & CleanTreat
• Home office licensed
Warm water trials: Thailand and Italy
• Species: Shrimp, tilapia and marine
finfish
• Experimental scale shrimp hatchery
• Commercial scale testing
39Manufacturing capacity to deliver pipeline
• State of the art GMP with flexibility for
conventional and new technologies
• Operating at 50% capacity from a
combination of own products, toll
manufacturing and product development
• Utilisation will increase as pipeline products
are delivered
Why in-house manufacturing?
• Vaccines differ from pharma - IP in manufacturing
• Greater reliability, flexibility and margins
• Easier to introduce new technologies
• Outsourcing requires large stable volumes
In-house strategy supports faster
implementation of innovation
40• Growing interest from big pharma validates
Competitive opportunity
landscape • Large multinational players but opportunity to
compete with differentiated offering
• Major unmet needs across multiple markets
How do we compete?
Our Competitors
Strong player with track record in
1. Long term commitment to conventional vaccines in salmon and
aquaculture producers marine fish
2. Use innovative technologies Long-term player, particularly in salmon
3. Address unmet needs (most and tilapia
economically important parasite
and virus diseases) Focused on salmon globally
4. Long history of high quality
aqua vaccine manufacture
Generics supplier in Chile
5. Holistic platform – health part
of total solution
41Investment
Focused R&D strategy Market insight decision points
R&D Proposal
d
1. Pipeline centred around large market
spen
opportunities and unmet needs Idea generation/
discovery
2. Develop platform technologies
R&D
New project
• VLP’s, recombinants, live development
f
sity o
attenuated, DNA plasmids Proof of concept proposal
• New adjuvant technology
Inten
• Unique cell lines Detailed
financials
• Oral delivery
Development
• CleanTreat trials
3. Prioritise projects based on return
Roll out plan
potential and strategic importance
4. Manage pipeline dynamically Regulatory
• Accelerate, pause or abort
based on technical success and Confirm launch
evolution of market opportunity budget
5. Holistic approach to disease, Commercial
leveraging Group capabilities launch
42 42Animal Health pipeline overview
Peak projected sales
Regulatory process Species
(£), date of first sales Discovery Passed proof of concept Development Trials
begins Field total(£m)
(incl. field trials)
Trials
VAQ002 PAQ009 VAQ007 VAQ011 VAQ008
VAQ016 (1m)
Sea bass/bream (3m) (20m) (12m) (10m) (1m) 47
2016
2019 2020 2019 2018 2018
PAQ024 VAQ017 VAQ032 VAQ006 PAQ017 VAQ029 VAQ015 VAQ010 VAQ019 VAQ021 VAQ020 VAQ028 PAQ014 PAQ008
(6m) (25m) (10m) (15m) (3m) (9m) (6m) (1m) (1m) (2m) (1m) (19m) (1m) (45m)
2021 2021 2019 2019 2022 2020 2020 2018 2019 2019 2019 2019 2018 2018
Salmonids 194
VAQ022
PAQ004 PAQ022 VAQ031 PAQ018 PAQ007 VAQ009
(6m)
(3m) (10m) (6m) (10m) (13m) (2m)
2019
2022 2021 2021 2021 2021 2020
VAQ034 VAQ036 VAQ025 VAQ024 VAQ004
Tilapia (3m) (1m) (1m) (1m) (1m) 7
2022 2021 2021 2018 2018
EAQ002
Shrimp (10m) 10
2019
VAQ033
Cleaner fish (1m) 1
2018
VAQ003
Catfish (3m) 3
2019
PA016 PAQ021
Other aquaculture (6m) (6m) 12
2022 2022
VC002 VTS009 VC001 PAQ023
Non aquaculture (55m) (50m) (165m) (3m) 273
2021 2021 2021 2019
Peak sales 13 products 11 products 10 products 7 products
Est. Prob £93m £155m £237m £62m
success 10% 30% 50% 80%Top core opportunities
Peak projected sales Risk Weighted
1 Next generation sea lice treatment £45m £36m
2 Salmon vaccines portfolio £99m £26m
3 Sea bass/sea bream portfolio £46m £24m
44Salmon opportunities Sea lice estimated annual
cost to industry1
Incidence and impact of major diseases
$500m+
100.00%
90.00% PD impact in Norway2
$250m
80.00%
70.00%
60.00%
50.00% SRS estimated annual
40.00%
cost to industry3
30.00%
20.00%
$300m
10.00%
HSMI4
0.00%
Norway
PD
UK
ISA
Ireland US/Canada
HSMI
Chile
CMS
Up to 20%
Moritella T mar * SRS sea lice
Mortality
*Tenacibaculcum maritimum
Source: 1Rabobank, 2 Norwegian Fish Health Report
45 Source: Company estimates 3 Rozas & Enriques (2014) 4 Fish Vet Group1 Salmon lice: Next generation sea
lice treatment + CleanTreat
• 100% efficacy including in populations resistant
to other medicines
• Safe for most sensitive marine species
• Superior safety profile even at high exposure level
• Excellent fish welfare
Overview of current sea lice treatments
Efficacy Welfare Environment
Next generation
100% None
sea lice treatment
Pyretheroids Low Long
Azamethiphos Moderate Short
Avamectin Low Long
H202 Moderate ✘✘ Short
Fresh water Declining ✘ None
Mechanical Moderate ✘✘✘ None
46 Source: Company analysisNext generation sea lice treatment +
CleanTreat
Large opportunity initially in Norway
with significant return potential
• Estimated annual peak revenue: £45m based
on conservative assumptions:
• Treatment market size: 1.1mtons
• Market penetration: 25%
• Treatments/year/farm: one
• Premium price vs treatments in the market
• Years to reach peak sales (from MA): 2yrs
• Target IRR: 50% Salmon farms
in Norway
47Next generation sea lice
treatment roll-out plan
2018 Top salmon producing countries 20163 (tonnes GWE*)
• Field trials in Norway
• Great interest from producers to
participate in trial extension
• Obtaining approvals to conduct field
trials in other markets.
• Exploring CleanTreat opportunities
2019
• Field trials:
• UK, Ireland and Faroe Islands
• Canada
• Chile
2020
• MA in place
48 Source: Salmon Farming Handbook2 Salmon vaccine portfolio strategy
• Apply new technologies to solve existing and unmet needs
Unmet Need • High value added for farmers
• Focus diseases: sea lice, PD, SRS and skin lesions caused by
Tenacibaculcum maritimum (Tmar)
• Follow with standard core antigens e.g. Vibrios to deliver full
differentiated protocol
Core Antigens • Regional strategies for Chile, Norway, UK and Canada
• BMK holds core antigens (from Zoetis aquaculture asset acquisition)
• Patented technology and know-how
• Platform technologies for oral delivery, injection and immersion
Full solution • Peak projected sales: £99m (risk weighted £26m)
49Marine fish opportunities
% incidence of major diseases by region
100%
Nodavirus1
up to 100%
90%
80%
mortality
70%
60%
50%
40% Pasteurella
30% (in juvenile fish)
20%
10%
up to 90%
0%
Greece Turkey Italy Spain France Cyprus Croatia mortality
Vibrio Pasteurella Noda Virus T mar
Source: 1 Doan et al 2016, 2 Andreoni & Magnani, 2014
503 Warm Water Marine Fish Portfolio e.g. Sea Bass & Sea Bream
• BMK strategy is to build a flexible mix and
match portfolio to deliver tailored, cost
effective vaccination programmes
• Opportunity to leverage INVE’s established
position and long term relationships with key
producers
• Scope to extend technology to other species
51Summary
Key growth drivers Capabilities Main opportunities
Disease is aquaculture’s • Group track record of Salmon
greatest limiting factor commercialising • Sea lice treatment:
• Unmet disease solutions • New technologies allows Commercial trials in
in salmon first mover advantage Norway, Faroe Islands, UK
• Sea lice greatest • State of the art & Canada
restriction on salmon manufacturing capacity • Exploit CleanTreat for
industry growth • Programmes showing current bath medicines
• Virus and bacterial superior performance & ‘own’ future medicines
diseases cost to • Holistic solutions with • Novel Salmon Vaccine
industry over $1bn BMK synergies portfolio launch —
• Unmet disease solutions oral vaccines, SRS, PD
in marine fish Marine Fish
• Nodavirus and • Mediterranean Vaccine
Photobacterium portfolio launch
• Parasites • Strengthen commercial
structure globally
52 • Global vaccines (VAQ028)Breeding for the future
with genomic precision
JAN-EMIL JOHANNESSEN,
HEAD OF GENETICS
53What does genetic selection
mean for aquaculture?
Delivering the best
genetic starting point for
production efficiencies
and health resilience
Revenues Adj. EBITDA
£30.5m £5.8m
2016: £20.7m 2016: £1.4m
54Jan-Emil Johannessen
Over 135 years Head of Benchmark Genetics
experience in • 30+ years’ experience in the
salmon industry
aquaculture • Deep-rooted market insight into
genetics food production
• Ex Lerøy and Rieber & Søn
Dr. Morten Rye Dr. Jónas Jónasson Oscar Hennig • Hernan Pizarro
Director of Genetics and R&D Operations Director, Salmon Operations Director, Shrimp Operations Director, Tilapia
• 30+ years’ experience • 30+ years’ experience in • 25+ years’ experience in • 20 years’ experience in
• Established aquaculture genetics shrimp industry aquaculture in the Americas
renowned genetic • PhD in Animal Breeding • Expert in disease • Sales and marketing,
programme for aquaculture • Experience with numerous management, farming technical services and
industries globally species technology and genetics business development
• Ex Nofima • Ex scientist in genetics at the • Ex Shrimp Improvement • Ex Pfizer
Freshwater Institute, Systems & Kona Bay
Iceland
55
55Built through acquisition of top players
Integration complete – synergies emerging 2014 Salmon
SalmoBreed
& StofnFiskur Shrimp
Tilapia
2015
Akvaforsk
Genetics
& Spring >300
Genetics customers in
30 countries
2016 Top 5: 29%
Genetica
Spring
Tilapia, Mexico Shrimp, Colombia Tilapia, Miami Tilapia, Brazil (2018) Salmon, Norway Salmon, Iceland
56 561. Salmon — leading position in concentrated market
• Four key players and high entry barriers
• Market share gains from agreements with How do we compete?
Lerøy and SalMar
1. Leading genetic traits
• Future gains from innovation, biosecure
2. Biosecurity
year-round facilities, and partnerships
3. Year-round availability
BMK Mkt size BMK
Products
Revenue (ova m) share 4. Technical support
Norway 400 35%
Market size
Ova/ 5. Customer
Broodstock/ £27m Scotland 62 37% c. £90m Partnerships
Lumpfish Faroe 32 89%
Iceland 25 100% Projected market
Chile 305 2.3% growth (2018-’20)1
N. America 58 6.9%
5-7%
Services £2.3m
Source: Company estimate, 1Kontali
572. Shrimp: opportunity to expand
in large, underpenetrated market
Market
Strategy
• Genetic underpenetration c.30% v 90%+ in salmon
1. Continue to develop high
• Current market (broodstock) estimated at US$100m performing strains from 20
• will grow with increase in sophisticated genetics year breeding programme
and continued industrialisation
2. Leverage commercial
• PL’s and nauplii represent much bigger opportunity experience in salmon and
– require local multiplication capabilities presence in shrimp hatcheries
through advanced nutrition
Competition 3. Challenge “one size fits all”
approach adapting lines and
• Some competition but underdevelopment and genetics to local markets
growth create large opportunity
4. Continue to develop SPR
shrimp for Asia and determine
market entry routes
583. Tilapia — early entry, first mover advantage Genetic trend
Resistance to streptococcus
70%
Market
• Less industrialised than shrimp 60%
Survival
• Very low penetration of sophisticated genetics
50%
• Highly dispersed — small local/FAO programmes
• Emerging privatisation; interest from large players 40%
0 1 2 3 4 5
(Aquagen) Generation
Strategy
• Continue to develop 30 year breeding programme Survival increase from
51% to 63%
• Selection for growth, survival, strep resistance
in 2 generations = 2 years
• Invest in genomic tools
• Commercialise as market matures
• Build from current base in Latam (Mexico, Brasil) 15%
Growth gain per
generation
59Commercialisation: flexible model maximises value for Benchmark
Products Traditional sales
Atlantic salmon ova
ROUTES TO MARKET
License/royalty
Atlantic salmon Europe
fry/smolts/broodstock
North
Sales of broodstock
Tilapia eggs, fry/juveniles America
Shrimp postlarvae (PL)
JV or franchises Asia
Breeders, nauplii
South
Genetic services - multi species America
Own multipliers and/or
Lumpfish fingerling production
Range of products and routes to market address all customer segments
60 60Slaughter weight increase over 4 generations
R&D strategy 3.0
2.5 2.3 2.2
1. Long term breeding + latest genetic tools 2.0 1.7
1.9 1.9
• Breeding delivers long term continuous improvement 1.5
1.4
1
• Growth, survival, maturation, feed conversion, 1.0 0.8 0.8
0.5 0.4
quality 0.5
0 0.1
• Genomic tools add precision 0.0
-0.1-0.1
-0.5
• New traits focused on disease resistance using latest
01
02
03
04
05
06
07
08
09
10
11
12
13
14
15
genetic techniques
20
20
20
20
20
20
20
20
20
20
20
20
20
20
20
Year class
• ISA, PD, AGD, CMS
Source: Company data
Note: 2015 year class harvested in 2017 and 2018
2. Leverage R&D and expertise across species
R&D spend (2017: £3m)
• Investment and experience with genomic tools can be Continuous
New traits
used across species 20%
improvement
existing traits
80%
Tilapia
3. Develop holistic solutions with BMK Group (4%)
• i.e. sea lice strategy Shrimp
(5%)
Salmon
(91%)
61Evolution of genetic trait development
Salmon
New trait/
New technology
Base
product
Growth
Maturation
General survival
Yield
Quality
New traits command price premium
….and become standard over time
62We aim to be a leader in the understanding and
responsible adoption of new genetic tools
Participating in Case Study - QTL
funded research
for ISA resistance 85% reduction in IPN with introduction of QTL
(Incidence of IPN in farmed salmonids 2009–2017)
The future
Gene editing? 250
223
198
200
PD 154
150
Genomic
15
119
20
Selection 100
gy
56
46
olo
50 30 27 23
hn
PD 0
10
ec
2009 2010 2011 2012 2013 2014 2015 2016 2017
QTL
20
dt
Source: Veterinary Institute Norway
an
on
PD
i
cis
08
Family breeding
20
Pre
63Rich pipeline of new traits
• New traits focused on resistance to diseases and parasites that
result in major losses
• Commercial strategy moving from single traits to bundled products
• Simplified offering
• Opportunity for increased margins
Revenue
Potential
• Local adaptation of shrimp and tilapia strains
• Environmental factors and differences in farming systems £115m
require tailored genetics
Pre-Project Project phase Test development Launch
Genomics
PF011 DH021 DH022 QF001 DS011 Genomics
GS-Quality Genomics Genomics
Salmon (5.4m) (3.5m) (3.5m) (0.2m) (2.1m)
(0.3m) ISA (5.4m) SRS (1.9m)
AGD
20203 2020 2020 2019 2021 (2.7m)
2018
Lumpfish
Lumpfish Scotland
(4m)
DT004 DT002 DT001
DT003 (6m) DT006 DT005
Tilapia 2021 (3m) 2020 (3m) 2020
(4.5m) (4.5m) (4.5m)
2020 2018 2018
DP002 DP001
Shrimp (28m) 2019 (32m) 2019
64 64Outlook
Growth drivers Risk Mitigation Main opportunities
Salmon Diversification of geographies Salmon
• Production efficiency and species mitigate risks • Increased in-house
• Year round delivery and • disease capacity (Salten)
biosecurity
• border closures • Disease resistance traits
5-7% projected growth (2018-2020)1
• environmental effects => margin growth
Shrimp Shrimp
• Develop SPR shrimp for
• Disease control
Asian countries
• Increased industrialisation
Tilapia
5% projected growth (2015-2019) 2
• Develop superior strain as
Tilapia catalyst for industrialisation
• Industrialisation and
investment
c.5% projected growth per annum1
65 Source: 1Kontali, 2GOAL (2017)Financial Outlook
MARK PLAMPIN, CFO
66Divisional Outlook
Nutrition Health Genetics
• Growth driven by replacement • Top line growth from product • Strong growth drivers with new
diets and health products launches traits drive higher prices and
• High margin products market gains
• Margin improvements from
focus on direct sales in key • Investment capex and R&D short • Increased capacity supports
markets term needs funded by Group growth and operational leverage
• Working capital in line with sales cashflow and facilities • Working capital - increase in
growth • Longer term operating cash will breeding stock as volumes grow
• Investment capex and R&D fund ongoing capex / R&D and will • Investment capex and R&D
funded by operational cashflow support returns to shareholders funded by increasing operating
cashflow
• Current 21% Adjusted • Current Adjusted EBITDA1
EBITDA1 % margin negative • Current 19% Adjusted EBITDA1
• Long term Adjusted EBITDA1 % % margin
• Mid to long term mid-twenties
Adjusted EBITDA1 % margin margin develops through • Long term (3-5 years) mid-
breakeven to mid-twenties twenties Adjusted EBITDA1 %
margin
1 Adjusted EBITDA is earnings before interest, tax, depreciation, amortisation, exceptional items and acquisition related expenditure
67Financial Discipline
Leverage and Headroom Capital Allocation
• Net debt increasing in the short-term • Capital allocation based on business case
• Covenant Leverage1 peaks around 2.5x including strategic, commercial,
financial:
• Liquidity headroom minimum £10m
• DCF3, IRR3 and ROIC3
• Applying cost and capital
• Base threshold of WACC4
discipline to manage headroom
• Risk weighted hurdle rate specific
• Long term positive Free Cashflow2 to each project
applied to pay down debt
• Typical hurdle rates 14% to 20%
• Steady state Covenant
Leverage1 targets 1.5x to 2.0x • Use of JV’s to share financial and execution
risk
1 Covenant Leverage is net debt (excluding ringfenced JV’s) to Adjusted EBITDA (earnings before tax, depreciation, amortisation, exceptional items and
acquisition related expenditure)
2 Free Cashflow is operating cashflow less capex (including capitalised development costs)
3DCF = discounted cashflow analysis, IRR = Internal rate of return, ROIC = typically year 4 or 5 return on cumulative invested capital
68 4WACC = company weighted average cost of capitalSummary and Outlook
• Diversified Group with leading market positions in high growth markets
• Two profitable, stable, cash generating core divisions:
• Animal Health on path to earnings generation in the medium term
• Short term capex and R&D requirements funded from Group cash generation and
facilities in place:
• Review of non-core activities underway
• Cost and capital discipline
• Peak capex expected over next 12 months
• Production capacity to grow and drive operational leverage
• Long term cash generation to deliver returns to shareholders whilst continuing to invest
for organic growth
69You can also read