America's Intelligent EV Fast Charging Network - Analyst Day | March 26, 2021
←
→
Page content transcription
If your browser does not render page correctly, please read the page content below
America’s Intelligent EV Fast Charging Network
           Analyst Day | March 26, 2021
Disclaimer
The information in this Presentation is for informational purposes only and does not constitute an offer to sell, a solicitation of an offer to buy, or a recommendation to purchase any equity, debt or other financial instruments of Climate Change Crisis Real Impact I
Acquisition Corporation (“CRIS”) or EVgo Services LLC (“EVgo”). This Presentation has been prepared to assist interested parties in making their own evaluation with respect to the proposed business combination of CRIS and EVgo and for no other purpose. The
information herein does not purport to be all-inclusive. Please refer to the business combination agreement and other related transaction documents for the full terms of the transaction. Please also refer to the “Important Information About the Business Combination
and Where to Find It” paragraph below. Neither EVgo, CRIS, nor any of their respective affiliates have any obligation to update this Presentation. Although all information and opinions expressed in this Presentation were obtained from sources believed to be reliable
and in good faith, no representation or warranty, express or implied, is made as to its accuracy or completeness. This Presentation contains preliminary information only, is subject to change at any time and is not, and should not be assumed to be, complete or to
constitute all the information necessary to adequately make an informed decision regarding the proposed business combination of EVgo and CRIS. Recipients of this presentation should each make their own evaluation of EVgo, CRIS and the potential transaction
and of the relevance and adequacy of the information and should make such other investigations as they deem necessary.
Industry Data
Information contained in this Presentation concerning EVgo’s industry and the markets in which it operates, including EVgo’s general expectations and market position, market opportunity and market size, is based on information from EVgo management’s estimates
and research, as well as from industry and general publications and research, surveys and studies conducted by third parties. In some cases, we may not expressly refer to the sources from which this information is derived. Management estimates are derived from
industry and general publications and research, surveys and studies conducted by third parties and EVgo’s knowledge of its industry and assumptions based on such information and knowledge, which we believe to be reasonable. In addition, assumptions and
estimates of EVgo’s and its industry’s future performance are necessarily subject to a high degree of uncertainty and risk due to a variety of factors. These and other factors could cause EVgo’s future performance and actual market growth, opportunity and size and
the like to differ materially from our assumptions and estimates.
Trademarks and Trade Names
CRIS and EVgo own or have rights to various trademarks, service marks and trade names that they use in connection with the operation of their respective businesses. This Presentation also contains trademarks, service marks and trade names of third parties,
which are the property of their respective owners. The use or display of third parties’ trademarks, service marks, trade names or products in this Presentation is not intended to, and does not imply, a relationship with CRIS or EVgo, or an endorsement or sponsorship
by or of CRIS or EVgo. Solely for convenience, the trademarks, service marks and trade names referred to in this Presentation may appear without the ®, TM or SM symbols, but such references are not intended to indicate, in any way, that CRIS or EVgo will not
assert, to the fullest extent under applicable law, their rights or the right of the applicable licensor to these trademarks, service marks and trade names.
Use of Projected Financial Information
This Presentation contains projected financial information with respect to EVgo, namely gigawatt-hour throughput, revenue, free cash flow, adjusted EBITDA, adjusted EBITDA margin, capital expenditures and operating costs for 2020-2027. Such projected financial
information constitutes forward-looking information, and is for illustrative purposes only and should not be relied upon as necessarily being indicative of future results. The assumptions and estimates underlying such projected financial information are inherently
uncertain and are subject to a wide variety of significant business, economic, competitive and other risks and uncertainties that could cause actual results to differ materially from those contained in the prospective financial information. See “forward-looking
statements” paragraph below. Actual results may differ materially from the results contemplated by the projected financial information contained in this Presentation, and the inclusion of such information in this Presentation should not be regarded as a representation
by any person that the results reflected in such projections will be achieved. Neither the independent auditors of CRIS nor the independent registered public accounting firm of EVgo, audited, reviewed, compiled or performed any procedures with respect to the
projections for the purpose of their inclusion in this Presentation, and accordingly, neither of them expressed an opinion or provided any other form of assurance with respect thereto for the purpose of this Presentation.
Use of Non-GAAP Financial Measures
The financial information and data contained in this Presentation is unaudited and does not conform to Regulation S-X promulgated under the Securities Act of 1933, as amended (the “Act”). Accordingly, such information and data may not be included in, may be
adjusted in or may be presented differently in, any proxy statement to be filed by CRIS with the Securities and Exchange Commission (the “SEC”). Some of the financial information and data contained in this Presentation, such as EBITDA, adjusted EBITDA margin
and free cash flow, have not been prepared in accordance with United States generally accepted accounting principles (“GAAP”). CRIS and EVgo believe these non-GAAP measures of financial results provide useful information to management and investors
regarding certain financial and business trends relating to EVgo’s financial condition and results of operations. CRIS and EVgo believe that the use of these non-GAAP financial measures provides an additional tool for investors to use in evaluating projected
operating results and trends in and in comparing EVgo’s financial measures with other similar companies, many of which present similar non-GAAP financial measures to investors. Management does not consider these non-GAAP measures in isolation or as an
alternative to financial measures determined in accordance with GAAP. The principal limitation of these non-GAAP financial measures is that they exclude significant expenses and income that are required by GAAP to be recorded in EVgo’s financial statements. In
addition, they are subject to inherent limitations as they reflect the exercise of judgments by management about which expenses and income are excluded or included in determining these non-GAAP financial measures. In order to compensate for these limitations,
management presents non-GAAP financial measures in connection with GAAP results.
Important Information About the Business Combination and Where to Find It
In connection with the proposed business combination, CRIS has filed or intends to file preliminary and definitive proxy statements with the SEC. The definitive proxy statement and other relevant documents will be sent or given to the stockholders of CRIS as of the
record date established for voting on the proposed business combination and will contain important information about the proposed business combination and related matters. Stockholders of CRIS and other interested persons are advised to read the preliminary
proxy statement and any amendments thereto and, once available, the definitive proxy statement, in connection with CRIS’s solicitation of proxies for the meeting of stockholders to be held to approve, among other things, the proposed business combination because
the proxy statement will contain important information about CRIS, EVgo and the proposed business combination. When available, the definitive proxy statement will be mailed to CRIS’s stockholders as of a record date to be established for voting on the proposed
business combination. Stockholders will also be able to obtain copies of the proxy statement, without charge, once available, at the SEC’s website at www.sec.gov or by directing a request to: Climate Change Crisis Real Impact I Acquisition Corporation, 300
Carnegie Center, Suite 150 Princeton, NJ 08540, Attention: Secretary, telephone: (212) 847-0360.
Participants in the Solicitation
CRIS, EVgo and their respective directors and executive officers may be deemed participants in the solicitation of proxies from CRIS’s stockholders in connection with the business combination. CRIS’s stockholders and other interested persons may obtain, without
charge, more detailed information regarding the directors and officers of CRIS in the preliminary proxy statement filed by CRIS with the SEC on February 12, 2021. Information regarding the persons who may, under SEC rules, be deemed participants in the
solicitation of proxies to CRIS’s stockholders in connection with the proposed business combination will be set forth in the proxy statement for the proposed business combination when available. Additional information regarding the interests of participants in the
solicitation of proxies in connection with the proposed business combination will be included in the definitive proxy statement that CRIS intends to file with the SEC.
Forward-Looking Statements
This Presentation includes certain statements that are not historical facts but are forward-looking statements for purposes of the safe harbor provisions under the United States Private Securities Litigation Reform Act of 1995. Forward-looking statements generally
are accompanied by words such as “believe,” “may,” “will,” “estimate,” “continue,” “anticipate,” “intend,” “expect,” “should,” “would,” “plan,” “predict,” “potential,” “seem,” “seek,” “future,” “outlook,” and similar expressions that predict or indicate future events or trends
or that are not statements of historical matters. All statements, other than statements of present or historical fact included in this Press Release, regarding CRIS’s proposed business combination with EVgo, CRIS’s ability to consummate the transaction, the benefits
of the transaction and the combined company’s future financial performance, as well as the combined company’s strategy, future operations, estimated financial position, estimated revenues and losses, projected costs, prospects, plans and objectives of
management are forward-looking statements. These statements are based on various assumptions, whether or not identified in this Presentation, and on the current expectations of the respective managements of CRIS and EVgo and are not predictions of actual
performance. These forward-looking statements are provided for illustrative purposes only and are not intended to serve as, and must not be relied on as, a guarantee, an assurance, a prediction or a definitive statement of fact or probability. Actual events and
circumstances are difficult or impossible to predict and will differ from assumptions. Many actual events and circumstances are beyond the control of CRIS or EVgo. Potential risks and uncertainties that could cause the actual results to differ materially from those
expressed or implied by forward-looking statements include, but are not limited to, changes in domestic and foreign business, market, financial, political and legal conditions; the inability of the parties to successfully or timely consummate the business combination,
including the risk that any regulatory approvals are not obtained, are delayed or are subject to unanticipated conditions that could adversely affect the combined company or the expected benefits of the business combination or that the approval of the stockholders of
CRIS or EVgo is not obtained; failure to realize the anticipated benefits of business combination; risk relating to the uncertainty of the projected financial information with respect to EVgo; the amount of redemption requests made by CRIS’s stockholders; the overall
level of consumer demand for EVgo’s products; general economic conditions and other factors affecting consumer confidence, preferences, and behavior; disruption and volatility in the global currency, capital, and credit markets; the financial strength of EVgo’s
customers; EVgo’s ability to implement its business strategy; changes in governmental regulation, EVgo’s exposure to litigation claims and other loss contingencies; disruptions and other impacts to EVgo’s business, as a result of the COVID-19 pandemic and
government actions and restrictive measures implemented in response; stability of EVgo’s suppliers, as well as consumer demand for its products, in light of disease epidemics and health-related concerns such as the COVID-19 pandemic; the impact that global
climate change trends may have on EVgo and its suppliers and customers; EVgo’s ability to protect patents, trademarks and other intellectual property rights; any breaches of, or interruptions in, CRIS’s information systems; fluctuations in the price, availability and
quality of electricity and other raw materials and contracted products as well as foreign currency fluctuations; changes in tax laws and liabilities, tariffs, legal, regulatory, political and economic risks. More information on potential factors that could affect CRIS’s or
EVgo’s financial results is included from time to time in CRIS’s public reports filed with the SEC, as well as the preliminary and the definitive proxy statements that CRIS intends to file with the SEC in connection with CRIS’s solicitation of proxies for the meeting of
stockholders to be held to approve, among other things, the proposed business combination. If any of these risks materialize or CRIS’s or EVgo’s assumptions prove incorrect, actual results could differ materially from the results implied by these forward-looking
statements. There may be additional risks that neither CRIS nor EVgo presently know, or that CRIS and EVgo currently believe are immaterial, that could also cause actual results to differ from those contained in the forward-looking statements. In addition, forward-
looking statements reflect CRIS’s and EVgo’s expectations, plans or forecasts of future events and views as of the date of this Presentation. CRIS and EVgo anticipate that subsequent events and developments will cause their assessments to change. However,
while CRIS and EVgo may elect to update these forward-looking statements at some point in the future, CRIS and EVgo specifically disclaim any obligation to do so, except as required by law. These forward-looking statements should not be relied upon as
representing CRIS’s or EVgo’s assessments as of any date subsequent to the date of this Presentation. Accordingly, undue reliance should not be placed upon the forward-looking statements.

                                                                                                                                                                                                                                                                                 2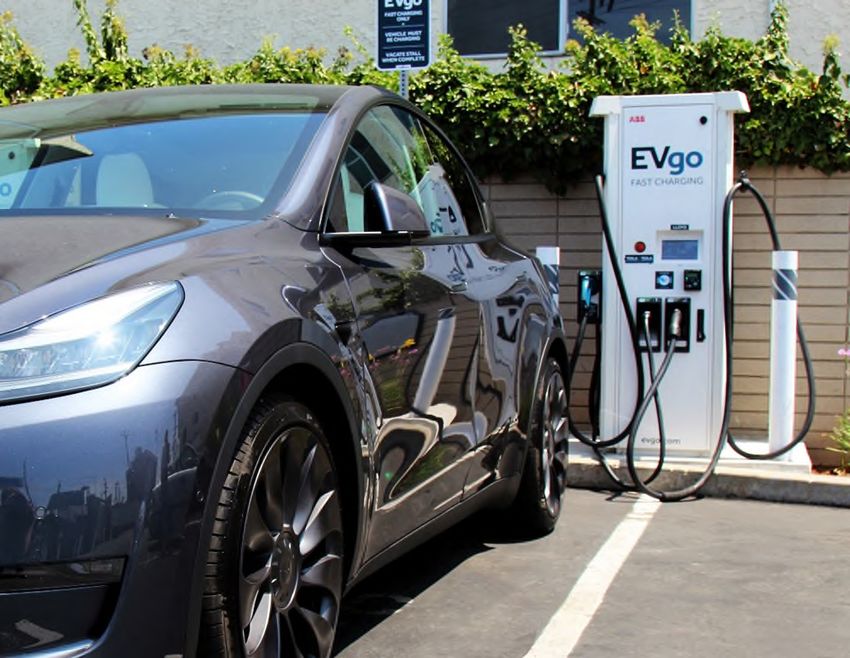
Introductions & Presenters

Cathy Zoi                           Olga
CEO                                 Shevorenkova
                                    CFO

Ivo Steklac                         Jonathan Levy
COO / CTO                           CCO

David Nanus                         David Crane
Co-Head, Private Equity, LS Power   CEO - CRIS
Chairman, EVgo

                                                    3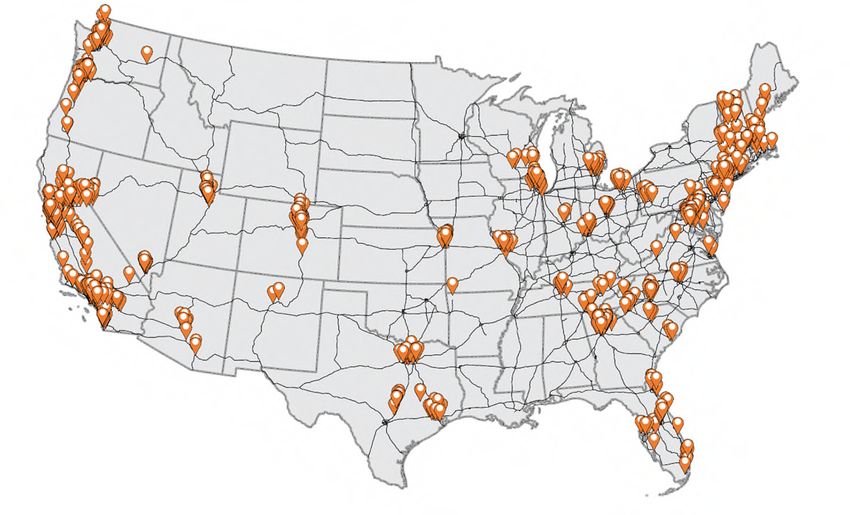
Transaction Overview

                                  • EVgo is an industry leading builder, owner and operator of EV fast charging in the U.S.
         The
                                  • Pure-play investment in essential 21st century infrastructure
       Business
                                  • Difficult-to-replicate consumer-facing network effect

                                  • Climate change is a foundational issue and society is shifting towards decarbonization
       Vision &
                                  • Transportation currently generates the largest share of U.S. carbon emissions
       Mandate
                                  • EVgo is an essential leader in the transition to clean mobility

        Offering                  • Climate Change Crisis Real Impact I (“CRIS”) has $230mm of cash in trust
         Size                     • Proposed PIPE size of $400mm

                                  • Pro forma enterprise value of $2.1bn
       Valuation                  • Attractively valued entry multiple relative to peers

                                  • Existing EVgo shareholders will be rolling 100% of their equity
        Capital                   • ~$575mm of net proceeds(1) to fully fund business until projected cash flow positive in
       Structure                    2026E
                                  • Strong balance sheet – EVgo has no debt

(1)   Net proceeds assume no redemptions by CRIS stockholders.

                                                                                                                              4
Two World Class Teams that have Generated Enormous
Shareholder Value
Vision, innovation and track record of success in disruptive energy infrastructure
Founded in 1990, LS Power is a leading developer, investor and
operator across the electric power and energy infrastructure space
Raised $46bn in dedicated capital to support its investment and
development activities, including $10bn in private equity funds and
other partnerships
Early mover in the space focused on opportunities that make
David Crane John Cavalier Beth Comstock Anne Frank- energy delivery and the grid more efficient
CEO CFO CCO Shapiro
COO Built several of the largest independent energy platforms in the U.S.
(e.g. transmission, generation, and energy storage)
Visionary
Leadership in Leading
Renewables, Energy
Distributed Investor
Generation and & Developer
Retail
Investment Thesis
EVgo is uniquely
EVgo is an industry leader
Exceptional market growth positioned to create
in the EV space × with wide and growing
competitive moat
= disproportionate
shareholder value
5
All Roads to Electrification Run Through EVgo

               $300bn of OEM                                Government                  12mm EVs in fleet                 Shifting Consumer
                commitments                                Commitments to             commitments by 2040                    Preferences
                                                                                                  Shared
                                                           Zero-Emissions             Rideshare   Mobility   Logistics

                                                                 CA + 14 other U.S.
                                                                                                                          100x expansion of
                                                                       states
                                                                                                                          EVs on the road by
                                                                                                                                2040

              DCFC needs                                EVgo owns largest              EVgo Partnerships                       OEM Agnostic:
          increase from 5% to                           U.S. public DC Fast            with OEMs, Fleets,                  EVgo can charge
                 40%+                                   Charging Network                   Rideshare                           any EV

        2019           2027           2040

                                                                                                                         CCS     CHAdeMO   Tesla

                                                    All EV adoption accrues to the benefit of EVgo

Source: Reuters, Bloomberg New Energy Finance, and Company materials.

                                                                                                                                                   6
EVgo: Current Snapshot of a Pure Play Market Leader

                                                                             EVgo’s Market Leading Position

                                                                         800+                                                       ~1,400+
                                                                         #1 in DC Fast                                              Current DC Fast
                                                                         Charging Sites                                             Chargers

         2,750
         DC Fast Chargers to                                                                                                                                                                          220,000+
         be added under GM                                                                                                                                                                           Active Customers
         contract(3)

Only charge partner                                                                                                                                                                                  34 states
Engaged by multiple OEMs                                                                                                                                                                            68 major
to build out DCFC network                                                                                                                                                                           metropolitan areas

         100%                                                                                                                                                                                       83%
                                                                                                                                                                                                    Californians within
         Renewable energy
                                                                                                                                                                                                    10 Miles of EVgo
         powered
                                                                                                                                                                                                    charger

          48%                                                                                                                                                                                       41%
                                                      EVgo DC Fast Charger Site                                                                                                                     Americans within 10
          Direct Margin YTD                                                                                                                                                                         Miles of EVgo
          2020                                                                                                                                                                                      charger
                                                                         45%                                                           50%
                                                                         Y-o-Y Retail
                                                                                                                           Retail DC market share(1)
                                                                         throughput growth(2)

  Source: Company estimates, PlugShare.
  1)   Based on company estimates of 2020E kWh market share, excluding Tesla. EVgo has 34% market share of urban DC Fast Chargers based on Plugshare public DC Fast Chargers with capacity
       greater than or equal to 44 kW, including non-networked chargers and excluding Tesla Superchargers captive to Tesla EVs, as of 9/30/20. “Urban” includes ATL, BAL, BOS, CHI, DC, DEN, DFW,
       HOU, LA, MIA, NYC, PHIL, PORT, SAN, SD, SEA, SFBA.
  2)   Jan 2020 vs Jan 2019 – last pre-COVID month for comparison.
  3)    By 2027, EVgo expects to have built over 16,000 DC fast chargers, inclusive of GM build out.                                                                                                                      7
EVgo: A History Rooted in Firsts
EVgo has been a pioneer and innovator in the fast charging business model since 2010, creating unique
industry experience, expertise and first mover advantages
  2010
  2010 2012
        2012                 2014
                             2014           2016
                                            2016 2017
                                                  2017                       2018
                                                                             2018                  2019
                                                                                                   2019                                  2020+
                                                                                                                                         2020+

                                                                                                                                            First to partner
                                                                                                                                               with Avis
                                                                                                                                                Budget
                                                                                                                  First multi-city
                                                                            First 350 kW                         partner with Lyft
                                                                               charger               First
                                                                                                 to go 100%
                                                                                                  renewable
                                                                                                                                            First
                                            First to 500                                                                                nationwide
                                             locations                     First to win                                                infra buildout
                                                                                                                     First to
                           First in OEM                                  Appendix D grant
                                                              First
                                                                            statewide                              partner with
Founded by                 partnerships
             First urban                                     150kW                                                    Uber
NRG Energy
                 fast                                      charger in
                                                            the U.S.      First dedicated                                                   First to partner
              charging
                                                                             rideshare                                                     with autonomous
                                                                                                 First to 800                                     fleet
                                                                          charging depots
                                          Won ESNA award for                                      locations
                                            storage project
                                                                                                                     First to
                                                                                                                   implement
                                                                                                                                    Tesla Connector
                                                                                                                    bilateral
                                                                                                                                 First charging network
                                                                        First to offer modular                  interoperability
                                                                                                                                  with integrated Tesla
                                                                            mobile DCFC                                                connectors

                 A decade-long track record of success catalyzed by enduring partnerships

                                                                                                                                                               8
Business Model Flywheel
Sustains and Increases EVgo’s Competitive Moat

     Focus on maximizing
                                                             Fully integrated
      project level cash
                                                             business model
           returns

  Margin stacking       Expand                           Maximize    Charger availability and
opportunity for each
                       Customer                           Uptime      network redundancy
  customer type
                       Offerings
                                   Driven by customer
                                       value prop

    Lower customer acquisition                          Unique selling points for each customer:
     costs and increase brand                           Retail, OEM, Fleet, Utility and Government
              loyalty

                                                                                                9
EVgo’s Purpose Driven Model Directly Leveraged to EV
Adoption
Accumulating Benefits From All Electric Strategic Advantages of Build, Own and
Miles Operate
OEM Agnostic: monetizes all EV types and models, Ownership of network design, price and location drives
installed base, VIO and VMT increase enhanced user experience, retention and brand loyalty
Flywheel effect from expanding customer base and
usage Provides compelling value proposition to all
stakeholders
Built in “same store sales” growth; driver-based
recurring revenue model
Does not require customers to pay high upfront capex
Gross margin leverage through increased utilization and ongoing O&M
and yield management
Steady Cash Flow Generation ESG is in EVgo’s DNA
High returns and a-cyclical cash flows; critical EVgo has powered 263 million zero-emission miles,
infrastructure supported by defensible moats reducing 102,000 MT of CO2
Offers significant runway for capital deployment at EVgo is the only 100% renewable powered EV
charging network in the U.S.
attractive returns
EVgo COVID-care pricing for essential frontline
Equipment and design specifier creates competition workers serving communities during the pandemic
among vendors and declining hardware costs Multi-faceted employee-led action plan on Diversity
and Inclusion
Source: Company materials, Environmental Protection Agency GHG Equivalencies Calculator.
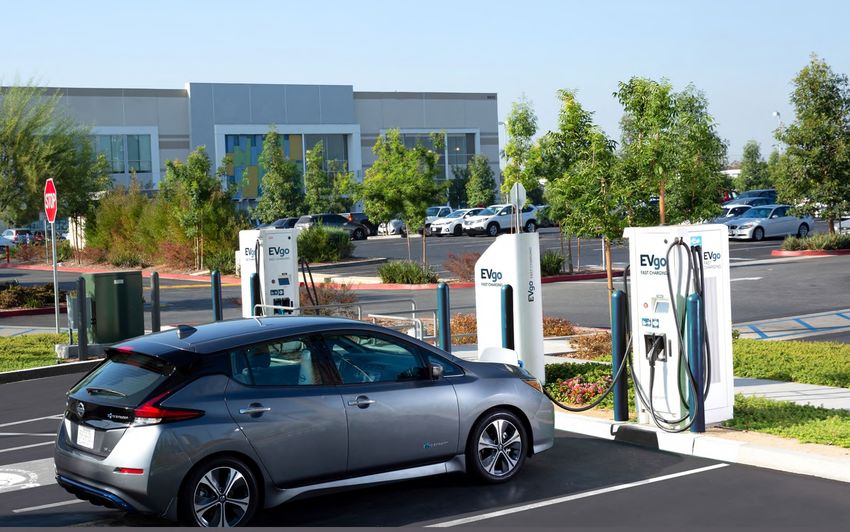
10EV Market is Poised for Tremendous Long Term Growth
• Unprecedented EV VIO growth with 24% U.S. Electric Vehicles In Operation (“VIO”)
(EV unit sales in millions) (Total EVs in millions)
CAGR, or almost 100x, expected between 50
76
2019 and 2040, opens a massive 75
8
addressable market 40
2019 – 27 CAGR 2027-40 CAGR 2019-40 CAGR
30% Retail 15% Retail 20% Retail
6 81% Fleet 19% Fleet 40% Fleet
30
158% MHD 15% MHD 57% MHD
• Growth driven by increase in EV models 32% Total ( 9x) 20% Total (11x) 24% Total (97x)
4
available and purchase price parity 20
14
between EV and ICE vehicles
2 7 10
4 5
2 3
1 1 1 1
• Electric vehicle electricity consumption 0 0
2019 2020E 2021E 2022E 2023E 2024E 2025E 2026E 2027E 2030E 2040E
expected to realize 28% CAGR, or 176x
TAM growth, between 2019 and 2040 Retail Fleet MHD EV Sales
EV Total Addressable Market (“TAM”)
(TWh) 390
• By 2040, ~28% of all U.S. vehicles are
expected to be battery electric, implying 2019 – 27 CAGR 2027-40 CAGR 2019-40 CAGR
significant additional growth thereafter(1) 32% Retail 19% Retail 24% Retail
86% Fleet 25% Fleet 45% Fleet
152% MHD 17% MHD 57% MHD 67
41% Total ( 16x) 21% Total (11x) 28% Total (176x)
34
25
18
8 13
2 2 3 5
2019 2020E 2021E 2022E 2023E 2024E 2025E 2026E 2027E 2030E 2040E
Retail Fleet MHD
Source: Company estimates, U.S. Department of Transportation, BNEF and Wall Street research.
Note: 2019 through 2027 based on company estimates, 2030 and 2040 based on BNEF.
(1) Based on 273mm registered vehicles in the U.S.
11Sizing up the Market
VIO VIO = Beginning VIO + Sales - Retired
Vehicles in Operation How many electric vehicles
Proprietary estimates of EV adoption cross-referenced against
reputable market research
TAM TAM = VIO x VMT x Efficiency
Total Addressable Market How much electricity is needed to power those vehicles
VMT: Vehicle Miles Traveled
Efficiency: Measured in kWh per mile, based on EV mix
SAM SAM = TAM x % DC Fast Charging
Serviceable Addressable How much of that power comes from DC Fast Charging
Market Retail estimates of % DC Fast Charging range 5% - 12%
Fleet estimates approach 60% by 2027
BNEF forecasts 30% DCFC usage for LDV by 2030
SOM SOM = EVgo kWh / SAM
Share of Market Technology-focused platform improves user experience resulting in
increased captured SOM
2027E VIO TAM SAM SOM
7.25mm BEVs 34,347 GWh 11,739 GWh 2,478 GWh
Source: BNEF Long Term Electric Vehicle Outlook 2020, May 2020, BNEF Share of Global EV Charging and Company estimates.
12Charging Landscape 101: A Movement Toward DC Fast
Crossovers, Sedans: 3 – 4 miles/kWh
Level 1 100 Mile Charge Time
4 mi/kWh 2 mi/kWh
Passenger
1.44 kW
Fleet
17 hours
SUVs: 2 – 3.5 miles/kWh
35 hours
Pickups: 2 – 3 miles/kWh
Level 2
Light Duty / Delivery
7.68 kW
3.3 hours
Delivery Vans: < 1 mile/kWh
6½ hours
Medium Duty /
Shipping
Trucks DC Fast Charging
30 minutes
50 kW
30 min
60 minutes
Semis
Heavy Duty /
Transport
5 minutes
350 kW
4.3 min
9 minutes
Increasing charge rates, usage per mile, and battery sizes necessitate DCFC infrastructure
Source: Company estimates.
13EV Charging Growing Rapidly; DCFC Growing Faster
Growth driven by Fast Charging need from Fleets, MHD & Retail
Serviceable Addressable Market (“SAM”)
(TWh) (EVgo % market share)
2019 – 27 CAGR 2027-40 CAGR 2019-40 CAGR
162
50% Retail 19% Retail 30% Retail
109% Fleet 25% Fleet 52% Fleet
143% MHD 20% MHD 57% MHD
79% Total (105x) 22%Total (14x) 41%Total (1,454x)
20% 21% 21% 21% 21%
17%
14%
9% 10% 22
8 12
2 3 6
0.1 0.1 0.3 1
2019 2020E 2021E 2022E 2023E 2024E 2025E 2026E 2027E 2030E 2040E
(1)
Retail Fleet MHD EVgo Market Share
2019 TAM 2027 TAM 2040 TAM
42%
34% 39,038
3,706
3 100,747
389,814
2,214 GWh 5% 16
34,347 GWh 5,605
93 GWh(2)
2,428
22,155
Retail Fleet MHD Fast Charging
Source: Company estimates and BNEF.
Note: 2019 through 2027 based on company estimates, 2030 and 2040 based on BNEF.
(1) Represents estimated EVgo market share of Retail and Fleet only; market share includes Tesla. Assumes market share held constant post 2027.
(2) BNEF Long Term Electric Vehicle Outlook 2020.
14EVgo is the Only Pure Play DCFC Owner and Operator
with Fully Integrated Network
Current public DCFC infrastructure(1)
(# of DCFC charging sites – PlugShare data)
EVgo 818
Non-networked
Non-networked 560
Company A
ChargePoint 550
Company B
Electrify America 467
Company C
Greenlots 206
CompanyBlink
D 69 EVgo charger network has superior
utilization given key locations in
Company E
Webasto 63
higher density urban areas
Company F
EV Connect 40
During 1H20, EVgo CA network
Company G OpConnect 10 utilization was ~5x its nearest
competitor(2)
Company H
Recargo Network 4
Company I
Irvine Company 3
Company J
EVolve NY 2
CompanyVolta
K 1
Generally does not own and operate DCFC
Source: Company data and PlugShare as of 9/30/20.
Note: PlugShare DC Fast Chargers represents public chargers with capacity greater than or equal to 44 kW as of 9/30/20.
(1) Excludes Tesla; EVgo total based on EVgo database as of 9/30/20.
(2) Sourced from 1H20 California Air Resources Board data.
15EVgo Network Build-Out Defined by Customer Needs
Premium Site
Locations OEMs
• Develop sites in geographies with • Collaborate to build in high priority
high EV penetration markets and drive adoption
• Co-locate with retail partners • Engage with OEMs to optimize
site and station design
Utilities Fleets
• Partner on rate reform, interconnection, and • Build to service rideshare, delivery,
program design municipal, autonomous, and other fleet
segments
• Provide clean path to load and rate base
growth Diverse market segments • Support fleets with development expertise
• $2.6bn of available capex incentives and • Provides access to existing public network
grants(2)
Government MHD Depots
• Work directly with regulatory agencies • Build, own and operate dedicated
and government officials charging for a wide range of
applications
• Engage at federal, state and local
levels: ~$750mm of state funding • Manage development, energy and
initiatives available(1) O&M
1) Estimates $250mm of funding based on states electing to use the maximum 15% of their App D for EVSE; total App D funding of $2.7bn for 2.0 liter and $235mm for 3.0 liter.
Estimated ~$500mm non-App D state funding.
2) Approved as of August 2020.
16EVgo’s Commercial Relationships with OEMs, Fleets, Site
Hosts, and Governments
OEMs Hosts
Active customers CO
or engagements
VA
NY
MA IL NJ
MD
NC
CA
WA
(1)
Fleets Government & Utilities
(1) Active dedicated charging arrangement with major autonomous vehicle player.
17EVgo’s Relationships with Key OEMs
EVgo is routinely the first call for major OEMs, further strengthening its position as the
DC Fast Charging leader; EVgo OEM partners represent 90% of U.S. BEV sales(1)
• 770 Connectors to be installed on EVgo chargers • Active contract with GM for the development of • Initially collaborated with Nissan North America in
enabling Tesla charging across EVgo network 2,750 EVgo chargers 2014 for pilot “No Charge to Charge” program
• New stations will be available to customers • Provided promotional charging for Nissan EVs
• Chargers with Tesla Connectors are embedded
starting early 2021 (e.g. LEAF)
in Tesla’s in-dash navigation system; only non-
Tesla DCFC • Established Retail beachhead for EVgo
• Will be located in highly visible areas • Entered “Nissan 2.0” contract in 2019 to continue
• Charging Tesla is highly accretive to EVgo • Most will be able to charge at least four vehicles profitably expanding charging services, customer
network simultaneously base, and network size
• Drives significantly higher average charge • In 2.0 contract, EVgo is the preferred provider of
• Stations will feature charging technology with 100- charging services and $250 in charging credit to
acceptance rate: Model 3 on a 50kW DCFC has 350-kilowatt capabilities configured to meet the
~45% higher throughput than non-Tesla(2) customers
needs of new EVs coming to market
(1) Experian.
(2) When charging from 50% to 85% SOC. Model 3 is best-selling EV with a dominant market share: Tesla represents 78% of all EVs sold in the US in 2019 and 84% in 9M2020.
18Fast Charging is Essential for Fleet Drivers
Fast Charging is Essential for Rideshare Business Model Lyft Case Study
• Rideshare drivers typically travel > 200 miles / day(1)
• 85% of rideshare drivers have NO access to home
charging(1)
EVgo supported the roll out of Lyft EV fleet vehicles in
• Annual VMT ranges from ~25,000 to 60,000+ Atlanta, Denver and Seattle; pilot programs began in 2019
• Lyft’s commitment to sustainability and clean
• Rideshare drivers are evangelists for EVs
transportation driving investment in electrification
• Over 100 Lyft fleet vehicles have doubled utilization at
One Rideshare Driver
EVgo’s Denver charger locations
40,000 Miles / year average VMT
Denver Monthly Figures
Crossover & Sedans
Average EV Efficiency Pre-Lyft(2) Post-Lyft(3) Current(4)
3.5 miles/kWh
DC Fast Charging Utilization 5.87% 11.28% 12.91%
75% of total rideshare usage is DCFC
kWh 25,453 61,449 87,182
Each Driver Adds 2-3% Utilization to an EVgo
Charger
Up to 8,500 kWh Annually Minutes 60,898 127,189 161,305
Sessions 2,215 3,540 4,122
(1) Proprietary EVgo Data.
(2) November 2019.
(3) February 2020.
(4) October 2020; Company expects further utilization expansion after effects of COVID-19 reside.
19EVgo’s Reputation Drives Customer Acquisition
and Retention
Operational excellence has led to 98% uptime, resulting in EVgo’s inbound roaming is ~2x outbound roaming
superior customer satisfaction and PlugShare scores(1) driven by superior customer experience & locations(2)
Annual Customer Accounts – Growing Faster Than Market
(000s)
8.5 224
8.0 41% customer CAGR vs. 202
7.6
7.0
11% non-Tesla VIO growth
6.5 115
80
EVgo Electrify ChargePoint Blink Greenlots 2017YE 2018YE 2019YE Sept. 2020
America
Focus on retail channel marketing...
Average NPS Social media Website visits App downloads
58,047 552,156 29,078
2018 2018 2018
41 75,050 889,749 86,242
October 2020 2020 YTD 2020 YTD 2020 YTD
1.3x 1.6x 3x
Strong digital marketing & social Perks, pricing, discounts and
media presence sales
Customer outreach, trade shows Market research
...creating leading brand equity in key retail segment,
driving customer satisfaction
Source: PlugShare and company estimates.
1) Represents average scores in California only and includes chargers of at least 25kW (max). California represents ~44% of U.S. EV market with greatest DCFC footprint and
consumer charging choice. EVgo score of ZEV states is 8.4 compared to 8.4. 7.8, 7.7 and 7.7 for Electrify America, Greenlots, ChargePoint and Blink, respectively. Scores as of
October 2020.
2) Account holders enjoy the flexibility of roaming access by using EVgo app at partner charging networks; measured on a revenue basis. 20EVgo’s Proprietary Advantages in Developing and
Operating DCFC
From Greenfield Site to DC Fast Charging: EVgo applies its IP at every step
1 2 3
Network Site Station
Planning Development Configuration
AmeriGo(1) MSAs (1)(2) Station Design IP (1)
6 5 4
Project Economics
Commissioning Construction
Analysis
In house customization of
Checkers(1) SiteTracker and Bertie, Grant Capture (1)
Salesforce(1)
7 8
Network
Station Revenue Management /
O&M
Customer applications(1) Data Analytics (1)
Inventory of over 1,800 near term developable locations
Over 27,000 prospect sites, 95% subject to MSAs(2)
(1) Denotes EVgo’s proprietary enhancements to development & operations.
(2) Master Site Agreements (“MSA”s) give EVgo optionality and flexibility in deploying capital across host properties.
21Future Proofed Fast Charging
EVgo is focused on optimizing EVSE architectures and station designs to drive returns
Next generation power sharing architecture EVgo’s customer-centric site design philosophy
modularizes EVSE and increases asset utilization considers use case, future EV capabilities, and
upgradeability
• Designed for power delivery in excess of capabilities of next
generation EVs
• Sites often include additional trenching, conduit equipment,
• Architecture allows EVgo to augment power, add connectors pads and larger switchgear to size for more chargers or
and optimize capacity increased power
• Modularization commoditizes hardware and centralizes • Infrastructure sized using probabilistic modeling of future
management logic, accelerating equipment cost declines over behavior and charge rates to ensure proper capacity
time
• Design and underlying control reduces COGS and optimizes • Station layouts incorporate OEM input to ensure all future EVs
throughput, increasing returns are able to charge
Illustrative Power Sharing Architecture Site Design for Best Customer Experience
Grid
M M
AC AC
DC DC
Station-level Energy Management
DC-Bus Battery
Integrated Charger
DC
DC DC DC
DC
Power
DC DC DC Cabinets
DC Power Routing
+ Sharing
Charging
Dispensers
CCS
Power
Tesla
Cooling
Blocks
CCS
CHAdeMO
CCS
CCS
Tesla
CCS
Cooling Cooling Cooling
22EVgo’s Innovation Drives Superior Customer Experience and
Enhances Product Offerings, Widening the Competitive Moat
EVgo’s development of next generation …complements its pioneering software
hardware… applications
EVgo Access
50kW – 350kW chargers
Smart access to chargers
EVgo’s primary asset base of DCFC within parking lots/garages within app
provides foundation of fast charging
infrastructure Underway
Next Generation Chargers EVgo Advantage
Power sharing station architecture Receive coupons
“future proofs” the station, ensures while charging
ability to meet kW demand increases Pilot underway; Launch Q1’21
Tesla Connector Reservations
EVgo is the only DC Fast Charging Charger available upon arrival
company capable of charging all Evs
Pilot Q4’20; Launch Q2’21
with its proprietary Tesla Connectors
FastStart Rewards
EVgo is the only DC Fast Charging Earn and redeem
company capable of modular points while charging
charging infrastructure ideal for Pilot underway; Launch early 2021
temporary applications
23Business Model Underpinned by Strong Unit Economics
California Project Non-California Project
• 2 100kW and 4 175kW chargers equipped with 2 Tesla • 2 100kW and 2 350kW chargers equipped with 2
Connectors in LA Tesla Connectors in Washington
• Assumes both program funding and partner funding at • Assumes only program funding at beginning of
beginning of project project, as well as a lease bonus to the host
($ and kWh in thousands) ($ and kWh in thousands)
(1)
Year 0 Year 1 Year 7 Year 0 Year 1 Year 7(1)
kWh Dispensed 155 705 kWh Dispensed 145 545
Utilization 8.9% 22.9% Utilization 11.1% 23.7%
Revenue $265 $470 Revenue $70 $245
(–) Operating Expenses (180) (290) (–) Operating Expenses ($10) (50) (95)
EBITDA $85 $180 EBITDA ($10) $20 $150
Net capex (260) Net capex (165)
Annual Cash Flow ($260) $85 $180 Annual Cash Flow ($175) $20 $150
Payback period 2.5 yrs. Payback period 3.5 yrs.
7 Year Unlevered IRR: 35.0%+(1) • Robust underwriting standards underpin disciplined capital allocation 7 Year Unlevered IRR: 30.0%+(1)
Payback period: ~2.5 years • Multi-faceted analysis for each charging underwriting Payback period: ~3.5 years
Average cash yield: ~50%(1) • Proprietary utilization data and sophisticated forecasting tools Average cash yield: ~50%(1)
Year 0 Year 1 Year 2 Year 3 Year 4 Year 5 Year 6 Year 7 Year 0 Year 1 Year 2 Year 3 Year 4 Year 5 Year 6 Year 7
Source: EVgo Bertie analysis toolkit.
(1) EVgo believes charging assets have 10+ year useful life. Underwriting evaluation period limited to 7 years to de-risk projections.
24DCFC Infrastructure is Necessary for the Growth of EVs
EVgo levered to EV adoption with embedded growth and even faster growing DCFC market as drivers
increasingly require access to fast, convenient charging infrastructure
DCFC infrastructure tracks EV adoption... …but outpaces overall charging demand
7
TAM TWh CAGR: 41%
5 SAM TWh CAGR: 79%
EVgo GWh CAGR: 78%
4 34
TAM (TWh)25
3 11.7
18
16,212
2 13
8
EV VIO 1 3 5
1 12,613 2 2 8.4
(millions) SAM (TWh)
1 1
2,47
5.6 8
9,434
3.4 1,731
7,178
1.7
1,117
5,088 0.7 EVgo (GWh)
0.1 0.1 0.3
EVgo DCFC 3,302 578
Chargers
2,211 245
1,278 1,440 25 15 24 69
EV VIO CAGR: 33%
EVgo DCFC CAGR:
41%
2019A 2020E 2021E 2022E 2023E 2024E 2025E 2026E 2027E 2019A 2020E 2021E 2022E 2023E 2024E 2025E 2026E 2027E
EVgo DCFC Chargers EV VIO (millions) EVgo (GWh) SAM (TWh) TAM (TWh)
Source: Company estimates.
25Strong Financial Profile Driven by Market Growth and
Operating Leverage
Network Throughput Revenue(1)
(GWh sold) ($ in millions)
2,478 $1,289
1,731 $905
1,117 $596
578 $326
COVID-19 COVID-19
245 $166
25 15 24 69 $18 $14 $20 $54
2019A 2020E 2021E 2022E 2023E 2024E 2025E 2026E 2027E 2019A 2020E 2021E 2022E 2023E 2024E 2025E 2026E 2027E
Retail Fleet Retail Fleet MHD Other
Adj. EBITDA and Operating Costs(1)(2) Free Cash Flow
($ in millions; costs as % of sales) ($ in millions)
Total 12,61 16,21
332% EVgo 2,211 3,302 5,088 7,178 9,434
3 2
Chargers
260% $507 $440
$278
$331
138% $185
$155
57% $193
$43 $48
37%
25% 21% 19%
$60 ($3) ($4)
($42) ($44)
$5 ($112) ($107)
($126) ($129)
($15)($29) ($58) ($43)
2019A 2020E 2021E 2022E 2023E 2024E 2025E 2026E 2027E 2021E 2022E 2023E 2024E 2025E 2026E 2027E
Adj. EBITDA(1) Operating Costs(2)
Note: Engineering & Construction salaries and third-party tech costs are fully expensed; GAAP generally capitalizes a portion of these costs and would otherwise result in an increase to earnings.
1) Certain contractual OEM payments to be received from 2021-2025 have been excluded from Revenue and Adjusted EBITDA in these projections pending determination of appropriate
accounting treatment of those payments. To the extent that these payments are excluded from revenue for accounting purposes in those years, those revenues will be deferred and
recognized in full in future years. Adj. EBITDA shown excludes D&A included in cost of sales. 2019 actuals include related party revenue.
2) Operating costs include SG&A, total network non-energy costs, and contractual cost reimbursements. 26Summary Financial Forecast
($ in millions) 2020E 2021E 2022E 2023E 2024E 2025E 2026E 2027E
Total EVgo GWh Throughput 15 24 69 245 578 1,117 1,731 2,478
LCFS Market GWh Throughput (1) 11 15 38 122 289 551 869 1,278
(2)
Revenue $14 $20 $54 $166 $326 $596 $905 $1,289
Growth (%) 49% 164% 207% 97% 83% 52% 42%
(2)
Adj. EBITDA ($29) ($58) ($43) $5 $60 $193 $331 $507
Adj. EBITDA Margin (%) NM NM NM 3% 19% 32% 37% 39%
Contractual OEM Payments – 20 24 31 9 5 – –
Net Growth CapEx (12) (70) (82) (126) (151) (160) (230) (255)
Free Cash Flow ($36) ($112) ($126) ($129) ($107) ($4) $48 $185
Note: Engineering & Construction salaries and third-party tech costs are fully expensed; GAAP generally capitalizes a portion of these costs and would otherwise result in an increase to earnings.
1) Represents throughput in California.
2) Certain contractual OEM payments to be received from 2021-2025 have been excluded from Revenue and Adjusted EBITDA in these projections pending determination of appropriate accounting
treatment of those payments. To the extent that these payments are excluded from revenue for accounting purposes in those years, those revenues will be deferred and recognized in full I future
years. Adj. EBITDA shown excludes D&A included in cost of sales. 27Transaction Overview and Pro Forma Equity Ownership
Transaction Structure Pro Forma Valuation(1)(3)
• CRIS and EVgo anticipate entering into a business combination agreement by ($ in millions)
January 22, 2021 Share price $10.00
• The transaction would thereafter be expected to close in Q2 2021 Pro forma shares outstanding (mm) 263.1
• Post-closing, the combined company will be listed on the Nasdaq and retain the
name, “EVgo” Equity value $2,631
• Transaction will utilize Up-C structure and include a tax receivable agreement Plus: debt –
Valuation Less: cash to balance sheet (575)
• Transaction reflects a ~$2.6bn post-money equity valuation for EVgo, representing Enterprise value $2,056
a highly attractive opportunity to invest in a leader in the EV charging space
• Proceeds from transaction will be used to capitalize the balance sheet with
$575mm, and will be primarily used to fund the buildout of its charging
infrastructure network(1)
Capital Structure
Pro Forma Post Money
• The transaction will be funded by a combination of $230mm cash held in trust Ownership(1)(3)
and $400mm in PIPE proceeds(1)
PIPE
• All-primary transaction; existing EVgo shareholders, including management, are Existing EVgo Investors
rolling their equity and are expected to collectively own ~74% of the pro forma Shareholders 15.2%
company at closing 74.4%
CRIS
Sources & Uses(1) Shareholders
($ in millions) 8.7%
Sources Uses
(2)
$230 Rollover equity $1,958 CRIS Sponsor
CRIS Trust
Shares
Rollover equity 1,958 Cash to balance sheet 575 1.6%
PIPE 400 Fees & other transaction expenses 55
Founder shares 43 Founder shares 43
Total sources $2,631 Total uses $2,631
1) Assumes no redemptions from the public shareholders of CRIS.
2) Cash in Trust value as of 9/30/20.
3) Values shown assuming $10 per CRIS shares for illustrative purposes; does not include impact of 1.4 million shares of sponsor earn-out, 11.5mm public out-of-the-money warrants
or 6.6mm Sponsor out-of-the-money warrants.
28Public Comparable Universe for EVgo
Accessing same broad market mega trends on charging buildout
and EV adoption
EV charging “Pure play” and will be reflexive comparable for investors
Various business models (owner and operator, hardware sales,
CHaaS, free charging, etc.)
Tesla is a recognized leader in EV production and sales
EV DCFC is small part of overall business (and valuation)
ecosystem Different level of scale and brand recognition
Similar business model (own and operate)
Plays to similar ESG trends in sustainability
Clean
Different point of adoption / investment cycle
infrastructure Different structures and dividend payout make reference valuation
metrics less comparable
Plays to sustainable trends in the markets
Clean tech Varying degrees of capital intensity and technology risk
Different, unrelated products
Similar distributed business model long-term (build, own and
operate)
High-growth High secular growth, capital intensive sectors driven by location
infrastructure and siting
Different locational drivers
29EV Charging is 21st Century Infrastructure
• EV charging bears striking similarities with Market Cap of Cell Towers
other 21st century infrastructure classes, like 5 Years Ago: $87bn Today: $206bn
cell towers and data centers
• These similarities include:
$31bn
• Rapid growth underpinned by a huge
TAM CAGR:
$87bn 19%
$103bn
• Attractive unit level return on invested
capital $73bn
• Recurring revenue streams
• Importance of site selection Market Cap of Data Centers
• Use of data & technology 5 Years Ago: $31bn Today: $127bn
• Corporate & commercial clients $5bn $4bn
$6bn
• A reflection of investor demand for these
assets is evidenced by the market $8bn
capitalization of the cell tower and data
center sectors: ~$330bn
CAGR:
$31bn
32% $60bn
$41bn
EV Charging is 21st Century Infrastructure and
is Poised to Grow Rapidly with the Broader EV
market
Source: FactSet as of 3/24/21.
30EVgo‘s Business Model Compares Favorably to Peers
Revenue Growth
151.8%
87.1%
Peer Median:
21.8% 27.5% 23.8%
9.6% 6.7%
EVgo26 EV Tesla Inc Clean Clean High-Growth
charging Infrastructure Tech Infrastructure
2021–2024E CAGR 2021–2024E CAGR(1) 2021–2024E CAGR 2021–2024E CAGR 2021–2023E CAGR 2021–2024E CAGR
EBITDA Growth(2)
134.1%
120.1%
44.5% Peer Median:
26.8% 26.8%
10.9% 7.5%
EVgo26 EV Tesla Inc Clean Clean High-Growth
charging Infrastructure Tech Infrastructure
2024–2026E CAGR 2023–2026E CAGR(1)(2) 2021–2024E CAGR 2021–2024E CAGR 2021–2023E CAGR 2021–2024E CAGR
EBITDA Margin
56.1% Peer Median:
36.6% 34.2% 34.0% 33.5%
18.2% 22.0%
EVgo26 EV Tesla Inc Clean Clean High-Growth
charging Infrastructure Tech Infrastructure
(2026E) (2024–2026E)(1)(3) (2021E) (2021E) (2021E) (2021E)
Source: Company materials, filings, and FactSet as of 3/24/21.
Note: EV charging: BLNK, CHPT, FAST-NL, TPGY and SNPR; Clean Infrastructure: BEP and AMRC; Clean tech: ENPH, SEDG, NOVA and BE; High-growth infrastructure: AMT, CCI, EQIX and DLR.
(1) TPGY 2024E revenue growth and EBITDA margin based on “Subsequent Growth Phase” assumptions in December 2020 investor presentation.
(2) Range represents average EBITDA CAGR composed of 2024–2025E for BLNK, 2024–2026E for CHPT, 2023–2024E for FAST-NL and 2024–2025E for SNPR. TPGY excluded from analysis due to unavailability
of long-dated forward projections .
(3) Range represents average EBITDA margin composed of longest-dated EBITDA available (2025E for BLNK, 2026E for CHPT, 2024E for TPGY, 2024E for FAST-NL and 2025E for SNPR). 31EVgo – An Attractive Valuation Paradigm for Investors
Median EV / 2021E EBITDA Median EV / 2021E EBITDA /
multiples growth
Peer median: 24.0x(1) Peer median: 1.4x(1)
2026E
$331mm
EBITDA
EV charging
(2)
21.3x EV charging 0.2x
(2023–2026E CAGR)(4)
Illustrative
Tesla 76.3x Tesla 2.8x
Comparable 21.5x – (2021–2024E CAGR)
Reference 26.5x(3)
Range
Clean Clean
22.5x infrastructure
2.2x
infrastructure
(2021–2024E CAGR)
Illustrative
Future $7.1bn – Clean tech 1.4x
Clean tech 56.9x
Enterprise $8.8bn (2021–2023E CAGR)
Value
High-growth
High-growth
infrastructure 3.5x
infrastructure 23.5x
(2021–2024E CAGR)
Current
$2.4bn
Value EVgo 7.3x
EVgo 0.2x
(2026E) (2026–2030E CAGR)(4)
Source: Company materials, filings, and FactSet as of 3/24/21.
(1) Peer median of 24.0x for EV/EBITDA multiples and 1.4x for EV/EBITDA/growth reflects median of 15 peer constituency (excludes TPGY from analysis due to unavailability of long-dated forward
projections).
(2) Represents median EBITDA multiples for longest-dated forward projections (2025E for BLNK, 2026E for CHPT , 2024E for FAST-NL and 2025E for SNPR).
(3) Reference range based on approximate ±2.5x multiple of peer median.
(4) EV charging CAGR of 120.1%. EVgo CAGR of 36.5%. 32Recent Updates Since Announcing our Business
Combination
Tesla EVgo further extends nation’s largest fast
Expansion charging network to Tesla drivers
New Jersey Awarded grants by State of New Jersey to
Grant support development of 30 new fast chargers
Pennsylvania Awarded grant by State of Pennsylvania to
Grant support 14 new fast chargers
Fleet Published – How to Succeed with Fleet
Guide Electrification
Nissan Nissan Energy Perks Program achieves 6,000
Enrollment driver enrollment milestone
Federal Published – Principles for Federal Investment in
Policy Brief Transportation Electrification
Meijer Partnership with Meijer to install EV charging
Partnership stations at grocery store locations
33EVgo Competitive Moats Continue to Grow Wider and
Deeper
Large and
Electrification unlocks a massive addressable market
Growing Market
Total TWh demand expected to grow 30x by 2030 and 100x by 2040(1)
Proprietary Proprietary analytics and technology platform informs optimal
Technology location / network design and performance
Enhances best-in-class customer experience and retention
Build, own and operate model that achieves profitable growth
Compelling Unit
Economics Disciplined data-driven underwriting drives capital allocation with
minimum return thresholds
Uniquely positioned
to capture and Robust long-term cash flow generated by each site
create value in the
EV charging space Industry Tailored value proposition across diverse ecosystem of top-tier partners
Leading Leading partnerships with GM, Nissan, Whole Foods, Kroger and others
Partners Drives flywheel effect, lowering customer acquisition costs, accelerating
growth, and enhancing EVgo’s competitive moat
Superior
Locations and Largest portfolio of sites (#1 in the country by # of locations)(2)
Site Positions Charger locations (MSAs with 3 out of 5 top U.S. retailers, urban focus)
(1) 2019 through 2027 based on company estimates, 2030 and 2040 based on BNEF.
(2) Based on company data and PlugShare as of 9/30/20.
34Appendix
Detailed Financial Forecast

($ in millions)                                                                            2020E                2021E               2022E               2023E                2024E               2025E          2026E     2027E
Total EVgo GWh Throughput                                                                        15                   24                  69                245                 578              1,117          1,731     2,478
                                                    (1)
LCFS Market GWh Throughput                                                                       11                  15                  38                122                  289                 551          869     1,278

             (2)
Revenue                                                                                        $14                 $20                  $54               $166                $326                $596          $905     $1,289
Growth (%)                                                                                                       49%               164%                 207%                  97%                  83%          52%       42%

Gross Profit                                                                                     $7                $10                  $31               $100                $182                $345          $522      $745
Gross Profit (%)                                                                             52%                 50%                  58%                 60%                 56%                  58%          58%       58%
                          (3)
Operating Costs                                                                                 (36)                (68)                 (74)                (95)              (122)               (152)         (191)     (239)
                   (2)
Adj. EBITDA                                                                                   ($29)               ($58)               ($43)                   $5                $60               $193          $331      $507
Adj. EBITDA Margin (%)                                                                         NM                  NM                   NM                  3%                19%                  32%          37%       39%

Contractual OEM Payments                                                                            –                 20                  24                  31                     9                      5       –         –

Change in NWC                                                                                       5                   1                  (1)                 (8)                  (6)                 (5)        (6)       (7)

Regulatory Credit Timing Impact                                                                     –                  (0)                 (5)               (16)                (12)                 (32)        (39)      (51)

Maintenance and Upgrade CapEx                                                                     (1)                  (5)               (19)                (16)                   (9)                 (6)        (9)       (9)

Free Cash Flow (pre- Net Growth CapEx)                                                        ($24)               ($42)               ($44)                  ($3)               $43               $155          $278      $440

Net Growth CapEx                                                                                (12)                (70)                 (82)              (126)               (151)               (160)         (230)     (255)

Free Cash Flow (incl. Net Growth Capex)                                                       ($36)             ($112)              ($126)              ($129)               ($107)                   ($4)       $48      $185

Note:   Engineering & Construction salaries and third-party tech costs are fully expensed; GAAP generally capitalizes a portion of these costs and would otherwise result in an increase to earnings.
(1)     Represents throughput in California.
(2)     Certain contractual OEM payments to be received from 2021-2025 have been excluded from Revenue and Adjusted EBITDA in these projections pending determination of appropriate accounting
        treatment of those payments. To the extent that these payments are excluded from revenue for accounting purposes in those years, those revenues will be deferred and recognized in full in future
        years. Adj. EBITDA shown excludes D&A included in cost of sales.
(3)     Operating costs include SG&A and total network non-energy costs.                                                                                                                                                         36
Glossary
BEV Battery Electric Vehicle
BI Business Intelligence
BNEF Bloomberg New Energy Finance
BTF Behind the Fence
CCS Combined Charging System
DCFC Direct Current Fast Charger
EV Electric Vehicle
EVI Electric Vehicle Infrastructure
EVSE Electric Vehicle Supply Equipment
EO Executive Order
FCI Fast Charging Infrastructure
GWh Gigawatt Hour
ICE Internal Combustion Engine
kWh Kilowatt Hour
LCFS Low Carbon Fuel Standard
MDPP Market Development and Public Policy
MHD Medium & Heavy Duty
MSA Master Site Agreement
MWh Megawatt Hour
NPS Net Promoter Score
OEM Original Equipment Manufacturer
O&M Operating & Maintenance Expense
RFID Radio Frequency Identification
RFS Renewable Fuel Standard
SAM Service Addressable Market
SOM Share of Market
TAM Total Addressable Market
TWh Terawatt Hour
VIO Vehicles in Operation
VMT Vehicle Miles Traveled
ZEV Zero Emission Vehicle
37You can also read