A Leading North American Transportation and Supply Chain Company - INVESTOR PRESENTATION MAY 2019 - CN Rail
←
→
Page content transcription
If your browser does not render page correctly, please read the page content below
A Leading North American
  Transportation and Supply Chain
  Company

  INVESTOR PRESENTATION
  MAY 2019

TSX: CNR   NYSE: CNI
Forward-looking statements
Certain statements included in this presentation constitute “forward-looking statements” within the meaning of the United States Private Securities
Litigation Reform Act of 1995 and under Canadian securities laws. By their nature, forward-looking statements involve risks, uncertainties and
assumptions. The Company cautions that its assumptions may not materialize and that current economic conditions render such assumptions,
although reasonable at the time they were made, subject to greater uncertainty. Forward-looking statements may be identified by the use of
terminology such as “believes,” “expects,” “anticipates,” “assumes,” “outlook,” “plans,” “targets,” or other similar words.

2019 key assumptions
CN has made a number of economic and market assumptions in preparing its 2019 outlook. The Company assumes that North American industrial
production for the year will increase by approximately two per cent, and now assumes U.S. housing starts of approximately 1.25 million units
(compared to its January 29, 2019 assumption of approximately 1.28 million units) and U.S. motor vehicle sales of approximately 17 million units. For
the 2018/2019 crop year, the grain crops in both Canada and the United States were in line with their respective three-year averages. The Company
assumes that the 2019/2020 grain crops in both Canada and the United States will be in line with their respective three-year averages. CN assumes
total RTMs in 2019 will increase in the high single digits versus 2018. CN assumes continued pricing above rail inflation. CN assumes that in 2019, the
value of the Canadian dollar in U.S. currency will be approximately $0.75, and now assumes that in 2019 the average price of crude oil (West Texas
Intermediate) will be in the range of US$60 to US$65 per barrel (compared to its January 29, 2019 assumption in the range of US$50 to US$55 per
barrel). In 2019, CN plans to invest approximately $3.9 billion in its capital program, of which $1.6 billion is targeted toward track and railway
infrastructure maintenance.

Forward-looking statements are not guarantees of future performance and involve risks, uncertainties and other factors which may cause the actual
results or performance of the Company to be materially different from the outlook or any future results or performance implied by such statements.
Accordingly, readers are advised not to place undue reliance on forward-looking statements. Important risk factors that could affect the forward-
looking statements include, but are not limited to, the effects of general economic and business conditions; industry competition; inflation, currency
and interest rate fluctuations; changes in fuel prices; legislative and/or regulatory developments; compliance with environmental laws and regulations;
actions by regulators; increases in maintenance and operating costs; security threats; reliance on technology and related cybersecurity risk; trade
restrictions or other changes to international trade arrangements; transportation of hazardous materials; various events which could disrupt
operations, including natural events such as severe weather, droughts, fires, floods and earthquakes; climate change; labor negotiations and
disruptions; environmental claims; uncertainties of investigations, proceedings or other types of claims and litigation; risks and liabilities arising from
derailments; timing and completion of capital programs; and other risks detailed from time to time in reports filed by CN with securities regulators in
Canada and the United States. Reference should be made to Management’s Discussion and Analysis in CN’s annual and interim reports, Annual
Information Form and Form 40-F, filed with Canadian and U.S. securities regulators and available on CN’s website, for a description of major risk
factors.

Forward-looking statements reflect information as of the date on which they are made. CN assumes no obligation to update or revise forward-looking
statements to reflect future events, changes in circumstances, or changes in beliefs, unless required by applicable securities laws. In the event CN does
update any forward-looking statement, no inference should be made that CN will make additional updates with respect to that statement, related
matters, or any other forward-looking statement.
                                                                                                                                                         2
Non-GAAP Measures
CN reports its financial results in accordance with United States generally accepted accounting principles (GAAP). CN also uses non-GAAP measures in
this presentation that do not have any standardized meaning prescribed by GAAP, including adjusted performance measures, free cash flow, adjusted
debt-to-adjusted EBITDA multiple, adjusted dividend payout ratio, return on invested capital (ROIC) and adjusted ROIC. These non-GAAP measures may
not be comparable to similar measures presented by other companies. For an explanation of adjusted dividend payout ratio, ROIC and adjusted ROIC,
refer to the Appendix to this presentation. For further details of the other non-GAAP measures, including a reconciliation to the most directly
comparable GAAP financial measures, refer to the supplementary schedules entitled Non-GAAP Measures for the 2019 First Quarter Results and for the
years 2013 to 2018, as well as the Company’s 2012 Q4 Financial Statements, available at www.cn.ca/financial-results.

CN's full-year adjusted earnings per share (EPS) outlook excludes the expected impact of certain income and expense items. However, management
cannot individually quantify on a forward-looking basis the impact of these items on its EPS because these items, which could be significant, are
difficult to predict and may be highly variable. As a result, CN does not provide a corresponding GAAP measure for, or reconciliation to, its adjusted EPS
outlook.

All amounts in this presentation are expressed in Canadian dollars, unless otherwise noted.

                                                                                                                                                        3
Investment Highlights: Long-term profitable growth

Leveraging network advantages to support our
operational and service excellence

Delivering 15%+ adjusted ROIC year after year since 2012

Solid pipeline of growth opportunities (organic and inorganic)

                                                                 4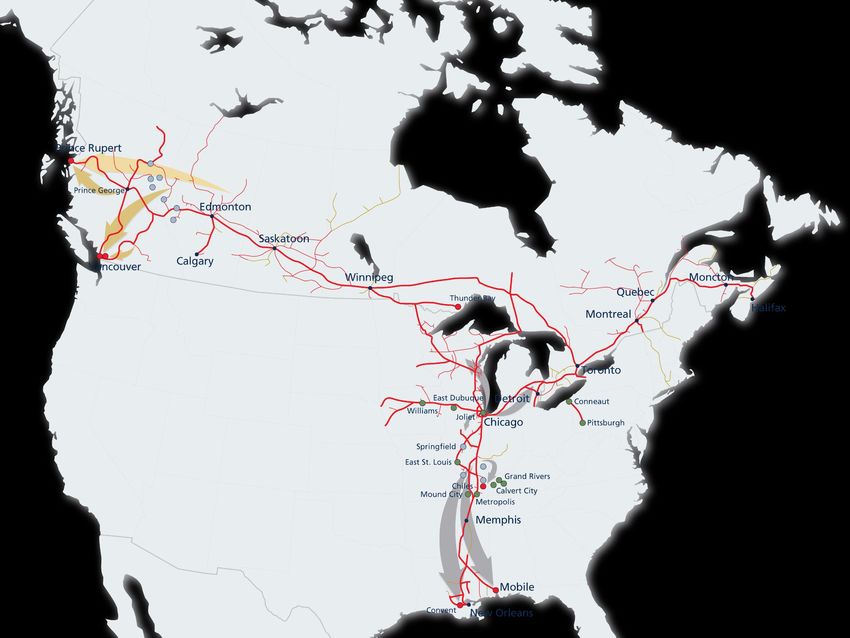
Content

                                      Balancing

1   Company
    Highlights   2   Our Key
                     Strengths    3   Operational
                                      and Service
                                      Experience

                     Innovating       Creating
4   Markets      5   Everywhere
                     Every Day
                                  6   Value for
                                      Shareholders

                                                     5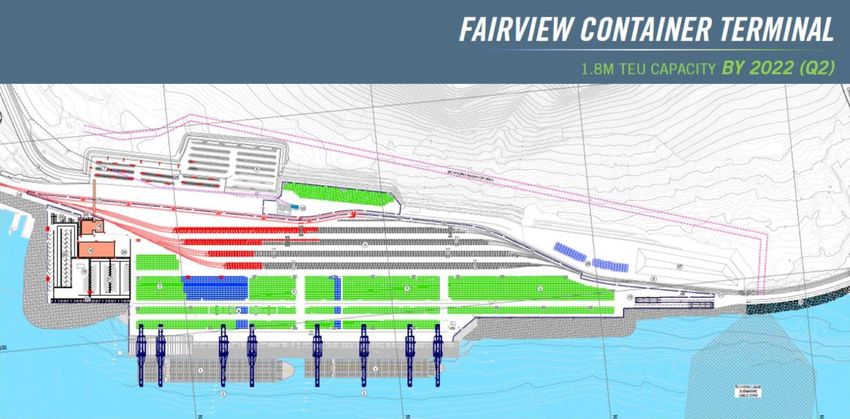
Company Highlights
Summary

• Market capitalization of ~$90B
• True backbone of the North American
  economy
• Uniquely connecting 3 coasts
• Strong profitable growth over the
  years
• Solid track record in creating value for
  customers and shareholders
A true backbone of the North American economy

                                                          19,500                      6.0M
• Only Class I network spanning Canada
                                                             Route miles                Carloads
  and mid-America, connecting North
  America to global markets on 3
  coasts, providing geographic,
  customer and product diversity                         $250B+                     $3.5B
• Co-production agreements, routing                     Value of goods handled     Capital investments
  protocols, marketing alliances and
  interline agreements providing
  additional connections to consumers
  across North America                                   $41.2B                    25,720
                                                               Assets            Employees (end of period)

Note: As at or for the year ending December 31, 2018.                                                        7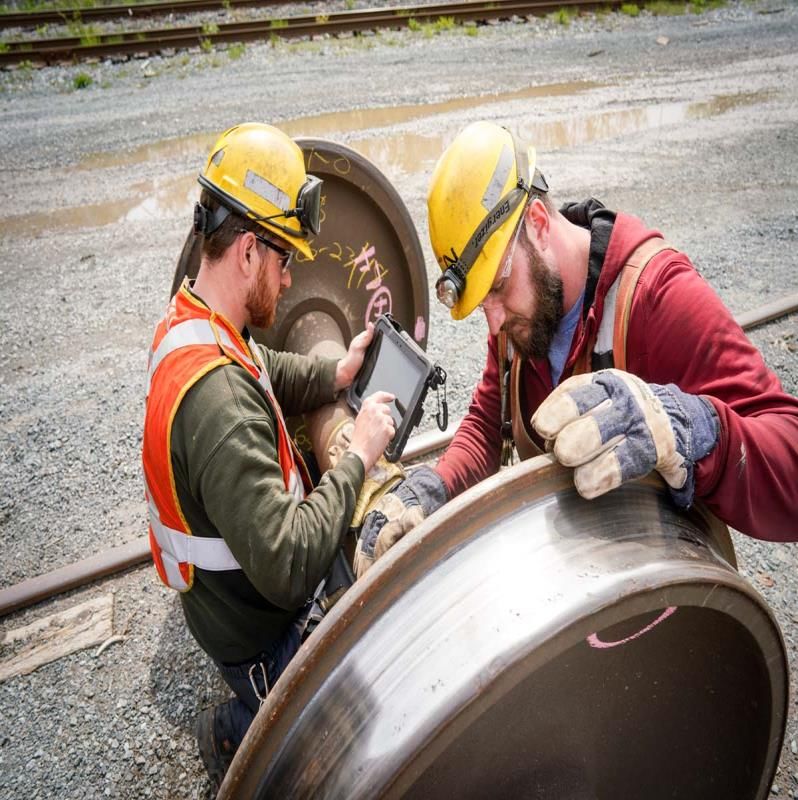
Financial highlights
Consistently delivering 15%+ ROIC since 2012
                                                                                                                                                                    Change
                                                                                                                                                          Q1       Favorable
                                                                             2012       2013      2014       2015      2016       2017    2018 CAGR     2019 (Unfavorable) (1)

 Total revenues ($M)                                                         9,920 10,575 12,134 12,611 12,037 13,041 14,321                      6%    3,544           11%)

 Operating income ($M)                                                       3,552      3,819     4,498      5,155     5,032      5,243   5,493   8%    1,080             5%)

 Diluted earnings per share ($)                                                3.06      3.09       3.85      4.39         4.67    7.24    5.87   11%    1.08             8%)

 Adjusted diluted earnings per share ($) (2)                                   2.81      3.06       3.76      4.44         4.59    4.99    5.50   12%    1.17           17%)

 Free cash flow ($M) (2)                                                     1,661      1,623     2,220      2,373     2,520      2,778   2,514   7%     286            (11%)

 Operating ratio (%)                                                           64.2      63.9       62.9      59.1         58.2    59.8    61.6          69.5       (170 bps)

 Adjusted operating ratio (2)                                                  64.2      63.9       62.9      59.1         58.2    59.8    61.5          67.2         60 bps

 Share repurchases ($M)                                                      1,400      1,400     1,505      1,750     2,000      2,000   2,000   6%     432

 Dividends per share ($)                                                       0.75      0.86       1.00      1.25         1.50    1.65    1.82   16% 0.5375             18%

 Adjusted debt-to-adjusted EBITDA multiple (times) (2)                         1.71      1.74       1.63      1.77         1.85    1.75    1.94          2.01

 Return on Invested Capital (ROIC) (%) (3)                                     17.3      15.4       16.6      16.8         16.0    22.4    16.7

 Adjusted ROIC (%) (3)                                                         16.0      15.2      16.2       17.0         15.8   15.9    15.7

(1)   Q1 2019 vs Q1 2018.
(2)   Please see website, Financial Results, www.cn.ca/financial-results, for an explanation of these non-GAAP measures.
(3)   Please see the Appendix for an explanation of these non-GAAP measures.

                                                                                                                                                                             8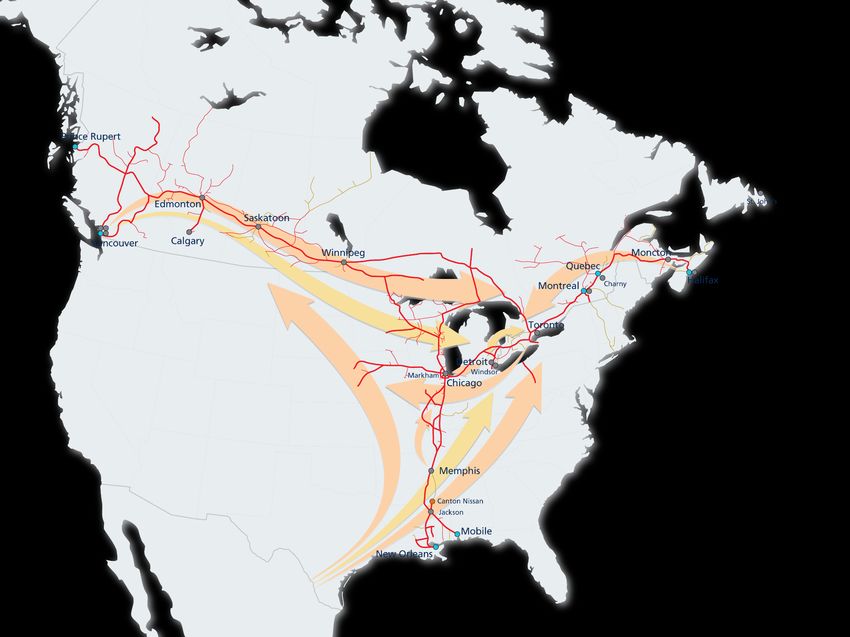
Managing a balanced set of key metrics
to create shareholder value year after year
                                                                                                                                   Return to
      In 2018                                  Adjusted OR (1)                                   Free Cash Flow (1)
                                                                                                                                 Shareholders

                                             61.5%                                                 $2.5B                       $3.3B
                                        Amongst industry leaders                                   Steady generation       Solid distributions balanced
                                             in efficiency                                         ensuring financial        between dividends and
                                                                                                       flexibility              share repurchases

      From                                        RTM CAGR                                        Adjusted ROIC (2)           Diluted EPS CAGR
      2012 to
      2018
                                                3.5%                                           15-17%                             11%
                                             Outpacing peers                                   Consistent track record     Creating shareholder value
                                          with faster RTM growth                                based on disciplined             year after year
                                                                                                 capital deployment

(1)   Please see website, Financial Results, www.cn.ca/financial-results, for an explanation of these non-GAAP measures.
(2)   Please see the Appendix for an explanation of this non-GAAP measure.

                                                                                                                                                          9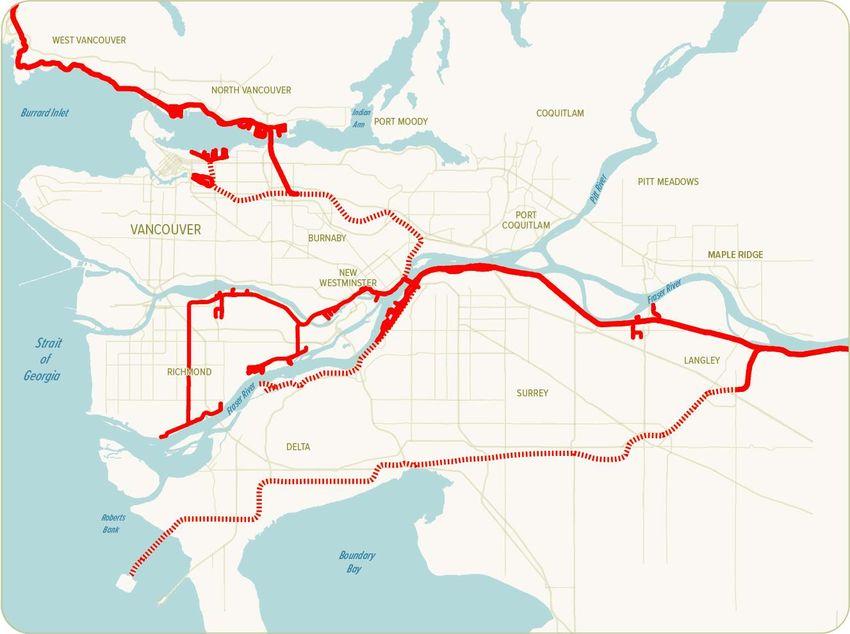
Driving long-term profitable growth

Scheduled Railroading was pioneered by CN more than 15 years ago and remains the
foundation of our operating model. Along with our established supply chain focus, we are now
advancing on our strategic agenda, leveraging our strong pool of talent and digitizing
operations to reduce cost, all while maintaining safety as our core value.

    Scheduled Railroading Expanding rail business
     The foundation                             Organic growth
     Safety                                     Inorganic growth
     Technology deployment                      People talent
     People talent
     Supply chain service that wins

                           Disciplined capital allocation
                              Balancing OR and ROIC

                                                                                          10
CN delivers strong profitable growth over the years
Amongst industry leaders in margins
Industry Operating Ratios (%)
(Expenses / Revenues)
90% RTM
CAGR (1)
85%
80% 3.5%
75%
70% 2.2%
65% 1.8%
60% 1.7%
55%
50%
-1.5%
45%
-1.6%
40%
2012 2013 2014 2015 2016 2017 2018
NSC KSU UP CP CSX CN
(1) RTM CAGR is calculated from 2012 to 2018.
11Content
Balancing
1 Company
Highlights 2 Our Key
Strengths 3 Operational
and Service
Experience
Innovating Creating
4 Markets 5 Everywhere
Every Day
6 Value for
Shareholders
12Our Key Strengths Summary • Highly experienced leadership team • Expansive network footprint with diversified product and customer base • Structural network advantage around Chicago • Exclusive access to Prince Rupert’s deep-sea port • Customer-centric structure • Deploying key technology projects
Highly experienced leadership team
JJ Ruest                                                      Mike Cory                             Ghislain Houle
President &                                                   Executive VP &                        Executive VP &
Chief Executive                                               Chief Operating                       Chief Financial
Officer                                                       Officer                               Officer

 • 22 years with CN                                            • 37 years with CN                   • 21 years with CN
 • Served as CMO for 8 years                                   • Led all 3 operating regions        • Qualified conductor and engineer

Sean Finn                                                     Keith Reardon                         James Cairns
Executive VP                                                  Senior VP                             Senior VP
Corporate Services &                                          Consumer Product                      Rail Centric Supply
Chief Legal Officer                                           Supply Chain                          Chain

 • 25 years with CN                                            • 19 years with CN                   • 31 years with CN
 • 10 years in current role                                    • 6 years leading Intermodal at CN   • Over 20 years in carload markets
                                                                                                    • Operational experience

Michael Foster                                                Kim Madigan                           Paul Butcher
Senior VP &                                                   Senior VP Human                       VP Investor Relations
Chief Information                                             Resources
and Technology
Officer

 • 23 years of experience in IT & logistics                    • 19 years with CN                   • 25 years with CN
 • Joined CN in 2018 from Fedex                                • 10 years in current role           • 2.5 years in current role

     For more information on CN’s company officers, please visit www.cn.ca/company-officers                                              14
Promotion of internal seasoned Scheduled
Railroaders
Derek Taylor James Thompson Doug
VP Southern Region VP Western Region MacDonald
VP Eastern Region
• Deep operational capability • Deep operational capability • Bringing commercial depth to operations
• Quickly converts plans into actions • Focused driver of results • Focused on getting things done
Doug Janet Drysdale Michael
Ryhorchuk VP Financial Planning Farkouh
VP Network VP Railroad and
Operations Network Technology
Deployment
• Deep operational knowledge of network • Versatile and adaptable executive • Deep operational knowledge
• 36 years with CN • Experienced across multiple functions • Next generation of industry-leading
scheduled railroading technology
Buck Rogers Allen Foster Kelly Levis
VP Petroleum and VP Bulk VP Industrial
Chemicals
Products
• Solid operator • Solid operator • North American market experience
• Experience in petroleum and chemical • Solid commercial experience in grain, • Solid know-how in forest and industrial
markets coal and fertilizer markets markets
For more information on CN’s company officers, please visit www.cn.ca/company-officers 15Advancing our agenda with injection of external
talent with diversified expertise in the last 2 years
Raj Gupta Jim Sokol Paul Harridine
VP System VP Mechanical VP Procurement
Engineering & Supply
Management
• Trinity Rail Products • Southwest Airlines • DS Smith plc
• Rail, Automotive, Aerospace, Industrial • Analytics based reliability strategy • Supply management, procurement and
experience supply chain expert
Mitch Beekman Martin Guimond Mike Jones
VP Safety & VP Multimodal President (TransX)
Environment Operations
• British Petroleum • British American Tobacco • TransX
• Environment, health & safety expert • Strong multimodal know-how • Solid experience in intermodal
Mohit Bhat Nayan Bharadwa
Assistant VP Enterprise Assistant VP Operational
Architect Technology
• Mphasis • Wind River (Intel Sub)
• Digital expert • Proficiency with optimized, scalable
technology
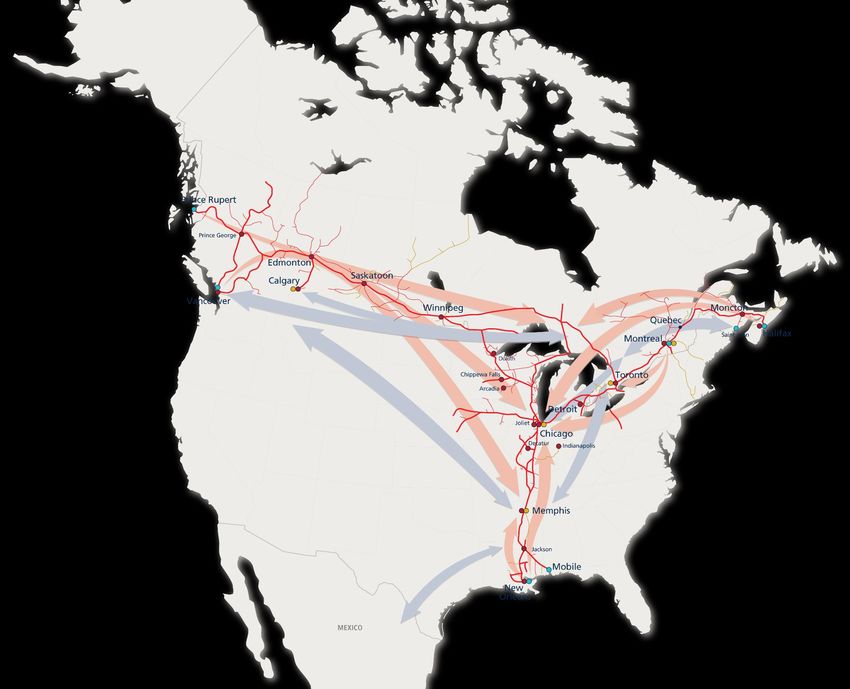
For more information on CN’s company officers, please visit www.cn.ca/company-officers 16Expansive network footprint
enabling a well-diversified portfolio
Global West 25%
• Only Class I railroad
reaching 3 coasts
Domestic Canada 16%
with its network
• Originating carrier for
over 85% of traffic Global East 5%
Transborder 35%
moving on CN’s Southbound 24%
network Northbound 11%
• Over 65% of traffic Well-diversified portfolio
originating and
Domestic U.S. 16% Intermodal 24%
terminating on CN’s
Petroleum and Chemicals 21%
network
Grain and Fertilizers 16%
• Diversified product Forest Products 13%
and customer base Metals and Minerals 12%
limiting exposure to Automotive 6%
economic cycles Global South 3% Coal 4%
Other Revenues 4%
Based on Q1 2019 revenues
The map refers to traffic density based on annualized rates of Q1 2019 gross ton mile (GTM) production (million GTMs per route mile).
For more information on CN’s network, please visit www.cn.ca/en/our-services/maps-and-network 17Structural network advantage around Chicago
providing speed and service advantages
Chicago is one of North America’s largest To / From Vancouver
and Prince Rupert
freight hubs
• More than 25% of U.S. rail traffic touches
Chicago at some point on its route (1)
• 500 freight trains and 800 passenger trains
pass through Chicago on a daily basis (2)
• Freight volumes shipped from Illinois expected
to rise 30% and shipments passing through
Illinois expected to grow 25% over the next 30
years (3)
CN acquired the EJ&E in 2009 to secure an
exclusive outerbelt around Chicago’s highly
congested downtown area
• 2x speed advantage through Chicago
vs other Class I railroads To / From Montreal
and Halifax
• More efficient interchange points
with other carriers
• More reliable service To / From New Orleans
and Mobile
(1) Kristine Owram, November 18, 2015, http://business.financialpost.com/welcome-to-chokepoint-usa
(2) Chicago Region Environmental And Transportation Efficiency (CREATE) Program, www.createprogram.org
(3) Illinois Section American Society of Civil Engineers, Rail – 2018 Report Card for Illinois’ Infrastructure,
https://www.infrastructurereportcard.org/wp-content/uploads/2016/10/FINAL-REPORT-CARD-FOR-2018-IL-Infrastucture.pdf
18Exclusive access to Prince Rupert, North America’s
fastest growing deep-sea port
• Closest North American deep-sea port to Asia
• Deepest natural harbour in North America
(35 meters channel depth)
• Lowest rail grades of all West Coast railroads across the
Rockies, giving CN a natural cost advantage to and from the
center of the continent
Opportunities to increase natural resources exports from Prince Rupert
19Customer-centric structure providing focus and
accountability to SERVE and GROW different segments
Rail-Centric Consumer Product
Activities + Activities
Segments served Bulk and Merchandise Intermodal and
Automotive
Organizational scope Sales, marketing and Sales, marketing and
non-rail operations terminal first / last mile
operations
Dedicated facilities • 31 transload facilities • 23 container terminals
• 4 Great Lakes • 19 Autoport locations
bulk docks • More than 1,100 CNTL
local delivery truck fleet
Growth levers Organic growth + Relevant bolt-on acquisitions
20Leveraging advanced technology to improve safety,
efficiency and productivity
Smart Network
Mobile device
for conductors
Mobile device for carmen
Robotic Process
Air repeater car Automation
Automation of track
Automation of train inspection inspection
21Content
Balancing
1 Company
Highlights 2 Our Key
Strengths 3 Operational
and Service
Experience
Innovating Creating
4 Markets 5 Everywhere
Every Day
6 Value for
Shareholders
22Balancing Operational and Service Experience Summary • Commitment to operational and service excellence • History of long siding investments to maximize train length • Priority on re-investing in the business to accommodate solid pipeline of growth opportunities • Long-term commitment to running a sustainable railroad
Improving operating and service metrics

  Port Dwell                                                Grain Spotting                                         Order Fulfillment
  Days                                                      Cars per week                                          % of orders receiving cars

            Prince Rupert          Delta Port                       2017/18             2018/19                               2018                                 2019
8.0                                                                                                              120%
                                                          6,000
6.0                                                                                                              100%
                                                          5,000                                         ~5,160                                                      95%
4.0                                                                                                               80%
                                                          4,000

2.0                                                       3,000                                                   60%
                                                ~2 days
0.0                                                       2,000                                                   40%   Week Week Week Week Week Week Week Week Week Week Week Week Week Week Week Week Week Week Week Week Week Week Week Week Week Week
                                                                                                                         01   03   05   07   09   11   13   15   17   19   21   23   25   27   29   31   33   35   37   39   41   43   45   47   49   51

                                                                    11
                                                                    13
                                                                    17
                                                                    21
                                                                    25
                                                                    27
                                                                    29
                                                                    31
                                                                    33
                                                                    35
                                                                    37
                                                                    39
                                                                   May
                                                                    43
                                                                    47
                                                                    51
                                                                     3
                                                                     5
                                                                     7
                                                                     9

                                                                   Nov

                                                                   Jan
                                                                   Aug

                                                                   Dec

                                                                   Jun
                                                                    Jul
  Apr 18 Jun 18 Aug 18 Oct 18 Dec 18 Feb 19 Apr 19                 Aug     Oct    Dec       Feb    Apr     Jun          Jan                    Mar                  May                    Jul                  Sep                   Nov

  Car Velocity                                              Through Network Train Speed                            Through Dwell
  Car miles per day                                         mph                                                    hours

              2018          2019                                         2018            2019                                          2018                                         2019
250                                                                                                              13.0

225                   225                                 21.0
                                                                                                                 11.0
200                                                                              19.7
                                                          19.0
175                                                                                                               9.0

150
                                                          17.0                                                    7.0                                             7.0
125

100                                                       15.0                                                    5.0
      Jan      Mar    May    Jul       Sep      Nov               Jan     Mar    May      Jul     Sep    Nov            Jan                    Mar                  May                    Jul                  Sep                   Nov

                                                                                                                                                                                                                                                        24
Investing in long sidings to enable longer trains
and capacity
~200 long siding and double track
investments since 2000
New long siding, long siding extension
or double track investment since 2000
Pre-2000 long siding, long siding
extension or double track investment
miles of track
~ 600 installed in each
of last few years
ties
~ 2M installed in each
of last few years
252019 network infrastructure and high horsepower
locomotive additions
Legend New long siding / track Double track
Taverna – Prince Rupert
Prince Rupert 3 miles double track
1 new siding
New locomotive delivery:
Winnipeg – Edmonton
Edmonton
Q1 063 (delivered) Taverna 49 miles double track
Q2 052
Vancouver Winnipeg
Regina
Q3 020 Edmonton – Vancouver
18 miles double track
Q4 005 Chicago – Winnipeg
8 miles double track
1 new siding
Total 140 (~$500M) Detroit
Chicago
Capacity Equipment Deploying key technology projects Meeting PTC milestones
Supporting our solid pipeline of growth opportunities in diverse markets
26CN Railroaders: Strong pool of human assets
to leverage
Talent to win • Put best 2% talent into most critical value roles
• Invest into those critical roles of the future
• Recruit and acquire missing value roles – to attain strategic agenda
• De-layer, reduce management structure – reduce bureaucracy / labour cost, be more agile
Position Number of employees (1) Expiration
Labour stability Conductors and yard coordinators 3,630 July 22, 2019
Canadian Track forces 2,772 December 31, 2023
Shopcraft 2,043 December 31, 2022
unionized
Locomotive engineers 2,094 December 31, 2022
workforce Clerical and Intermodal 1,789 March 31, 2019 (pending ratification)
Signals and communications 733 December 31, 2021
(1) As at December 31, 2018. Excludes rail traffic controllers, special agents and other.
27Delivering safely and responsibly
Building safety into all we do Reducing carbon emissions
FRA Train Accident Ratio (1) Fuel Efficiency
(accidents per million train miles) (GTMs per US gallon )
2.73 1,061 1,063
1,060
2.06 2.02
1.83 1,040
1.42
1,019
2014 2015 2016 2017 2018 2014 2015 2016 2017 2018
Moving freight by rail instead of heavy truck
CN continues to invest in our infrastructure, reduces greenhouse gas emissions by 75% (2)
technology, processes and people to improve
safety and enhance our safety culture CN is ~15% more fuel efficient than the rail
industry average (3)
(2) Association of American Railroads
(1) U.S. Federal Railroad Administration
(3) Based on 2017 data.
28Leading in Sustainability
CN’s commitment to sustainability
Environment People
is a long-term strategic priority,
Conduct our operations with Provide a safe, supportive and
extending to all aspects of the minimal environmental impact, diverse work environment
business, from the field to the while providing cleaner, more where our employees can
sustainable transportation grow to their full potential and
boardroom, to customer services to our customers. be recognized for their
interactions. contribution to our success.
Our vision guides how we conduct Safety Community
our business every day and Be the safest railroad in North Build safer, stronger
defines our contribution to building America by establishing an communities by investing in
uncompromising safety community development,
a more sustainable future. Five key culture and implementing a creating positive socio-
areas of focus anchor our management system designed economic benefits and
to minimize risk and drive ensuring open lines of
sustainability commitment: continuous improvement. communication.
Governance
Continuously improve our
culture of integrity and ethical
business, building trust and
confidence with all our
stakeholders.
For more information on CN’s sustainability strategy, please visit www.cn.ca/delivering-responsibly
29Content
Balancing
1 Company
Highlights 2 Our Key
Strengths 3 Operational
and Service
Experience
Innovating Creating
4 Markets 5 Everywhere
Every Day
6 Value for
Shareholders
30Markets Summary • Growth opportunities remain solid across our diverse book of business • Intermodal remains a key growth driver • Coal business has potential to reach record levels • Canadian grain is a positive story for CN • Short-term crude by rail opportunities remain strong
Market outlook remains solid
   Rail Centric                                • Short-term softness in crude by rail related to mandated production curtailment and
                                                 crude spread below US$15
   Supply Chain                                   • Mid-term outlook remains positive as new pipeline capacity continues to be pushed back
   Growth                                      • New resource export business starting in May
                                                  • Vista coal mine in Alberta shipping thermal coal to Asia
                                                  • New Alberta propane export via Prince Rupert to Asia
                                               • U.S. thermal coal exports neutral on high stockpiles in Europe
                                               • Securing frac sand volumes (Northeast U.S. and Western Canada) through strong
                                                 partnerships
                                               • Lumber orders remain solid
                                               • Continue to move record amounts of Canadian grain

   Consumer                                    • International intermodal traffic remains steady
                                                  • Zim Integrated Shipping Services now calling Port of Prince Rupert
   Product Supply                                 • Strong international reefer volumes
                                                  • New auto parts import business into North America starting mid-Q2
   Chain Growth
                                               • Strengthening our position in the domestic consumer economy
                                                  • Cross-pollination has begun between CN and TransX
                                                  • 500 new interline Equipment Management Pool (EMP) containers expected to be fully in service mid-Q2
                                                  • Growth in CargoCool® ̶ working closely with wholesale partners
                                               • North American motor vehicle sales remain soft
                                                  • Original Equipment Manufacturer (OEM) production backlog expected to support solid Q2
                                                  • Renewed contract with Ford on vehicles and parts

                Continue to expect high single-digit RTM growth in 2019, with pricing above rail
                inflation
Rail Centric Supply Chain Growth is comprised of the following: Petroleum and Chemicals, Metals and Minerals, Forest Products, Coal, and Grain and Fertilizers.
Consumer Product Supply Chain Growth is comprised of the following: Intermodal and Automotive.
Please see Forward-Looking Statements at the beginning of this presentation.

      For more information on the different markets CN serves, please visit www.cn.ca/en/your-industry                                                            32
International intermodal: Volumes driven by unrivaled
access to the 3 coasts through 14 different port terminals
PORT OF HALIFAX
(2 terminals)
• CN-exclusive
PORT OF PRINCE RUPERT • Capacity: 1,400k TEUs
(1 terminal) • Closest port to Europe
• CN-exclusive • Volume growth of 16% in 2017
• Closest port to Asia TOTAL ADDRESSABLE PORT OF MONTREAL
• Capacity: 1,350k TEUs MARKET (TAM) (4 terminals)
• 1,600k TEUs by 2021 10-12 M TEUs* • Capacity: 1,850k TEUs (+250k TEUs to come)
• 1,800k TEUs by 2022 • New terminal in Contrecœur adding 1,150k
TEUs by 2023
PORT OF VANCOUVER
(4 terminals)
• Capacity: 3,600k TEUs
• DeltaPort expanded by 600k TEUs in late 2018
• Centerm expansion of 600K by 2022
• Vanterm expansion of 250K by 2022
PORT OF QUEBEC (Beauport)
• Potential capacity of 500K TEUs
by 2020
CN Network
23 intermodal terminals across N.A. advantage
in Chicago PORT OF MOBILE
(1 terminal)
• 11 in Canada, serving all major cities • Near-dock rail service and
• New Regina terminal opening in 2019 vessel calls from Asia
• Capacity: 475k TEUs
• 12 U.S. terminals covering key markets • Expansion of 175k TEUs to be
completed by end of 2019
PORT OF NEW ORLEANS
(2 terminals)
* TEU: Twenty-foot equivalent unit (intermodal shipping container) • On-dock rail service
• Capacity: 900k TEUs
Please see Forward-Looking Statements at the beginning of the presentation. 33International Intermodal: Prince Rupert continues to add
capacity
2019-2021 Looking ahead to 2020-2022
Prince Rupert • June 2018 announcement of next expansion
at Prince Rupert
1,350k TEUs of rail capacity in place • + 250,000 TEUs by 2021
• 100% CN share
• + 200,000 TEUs by 2022
• Logistics park in Prince Rupert (dry & cold
supply chain, free trade zone logistics)
$300–325M • New inland destination terminals
Est. incremental revenues over 2019-2021
Please see Forward-Looking Statements at the beginning of the presentation. 34International Intermodal: CN investing in rail capacity in
the Vancouver area to support growth
2019-2021
North
Vancouver
Deltaport
Lynn Creek Yard 600,000 TEUs of new rail capacity in
Centerm Vanterm
late 2018
• At 70% CN share, the CN historical rail
capacity
Vancouver Yard • Aiming to be near 80% capacity 3 years
from start-up
$250–275M
Est. incremental revenues over
2019-2021
Lulu Island Yard
South Shore Capacity Projects:
Vancouver
Double track to the expanding
South Shore Centerm & Thornton Yard
Vanterm terminals Vancouver
• $85M jointly funded by CN, Fraser Surrey Intermodal
PMV, Federal Docks Terminal
• Q3 2017 – expression of
interest filed with
Government of Canada
• February 2019 – agreement
signed
• Q3 2021 – expected North Shore Capacity Projects:
completion of project Staging track and tunnel
improvements to increase capacity
for expanding North Shore terminals
• $214M jointly funded by CN, PMV, CN
Federal
• Q3 2017 – expression of interest CN Trackage Rights
filed with Government of Canada
• April 2019 – agreement signed Container terminals
• End of 2020 – expected CN Yard
completion of project
Deltaport
Please see Forward-Looking Statements at the beginning of the presentation. 35Domestic Intermodal: $250-375M opportunity
of potential incremental revenues over 2019-2021
Gaining market share through strong
Expect 4-6% Wholesale partnerships with the industry’s best
CAGR Full membership in EMP program
Acquisition of TransX
Retail Gaining market share through
door-to-door
Strong growth
with Cargo Cool
Significant investments in intermodal terminals and equipment
Please see Forward-Looking Statements at the beginning of the presentation. 36Coal: CN’s franchise is well-positioned to take
advantage of coal export opportunities
Q1 2019 CN Coal Revenue Breakdown
Thermal Metallurgical Total
Canadian coal
Export 41%
U.S. coal
Export 33% - 33% 59% U.S.
Domestic 26% - 26%
41% Canada
Coal 80%
Pet coke 20%
37Coal: Up to $350M of potential incremental revenues
over 2019-2021
Canadian Export Coal U.S. Export Coal
Metallurgical coal Thermal coal
• Brule mine opened in Q4 2016 • Export market from Illinois Coal Basin
• 3M tons annual capacity
• Wolverine mine opened in Q1 continues to expand to feed emerging
2017 markets such as India, North Africa, Turkey,
• 1.7M tons annual capacity in addition to Western Europe
• Willow Creek mine opened
• Sugar Camp mine: 13.5M tons capacity
in Q3 2018
• 1.7M tons annual capacity • Williamson mine: 7.5M tons capacity
• CN provides the only direct access unit train
• Opened in Q3 2018 from the Illinois Basin to major export
• 2M tons annual capacity with the
potential to go up to 4M tons
terminals on the Gulf Coast
• Convent Marine Terminal (LA)
• Mobile Port (AL)
Thermal coal
• These modern terminals are equipped with
• Vista mine opening in May 2019
• 6M tons annual capacity, with the loop tracks to unload coal for stock pile or
potential to go up to 12M tons directly into vessels
Please see Forward-Looking Statements at the beginning of the presentation.
38Grain: CN investing in its network and equipment
to better serve its customers
Canada United States
Canadian Grain Production (1)
(millions of metric tonnes) 68% U.S. Corn and Soybean Production
CN Draw Territory (IL, IA, MI, WI) 32%
(billions of bushels)
of CN grain 7.3 of CN grain
73.0
70.5 70.3
(2)
revenues 7.1
(3) revenues
originate from 7.0 originate from
65.0 6.8
63.0 Canada (4) the U.S. (4)
6.6
Regulated grain: Domestic U.S.
78% of Canadian grain: 54% of U.S.
grain revenues (4) grain revenues (4)
14/15 15/16 16/17 17/18 18/19 E 14/15 15/16 16/17 17/18 18/19 E
• Leveraging our investments in longer sidings and new high-horsepower locomotives
to accommodate longer trains
• Working closely with grain customers
• 1,000 new generation hopper cars (up to 10% more capacity per car)
• Close to 400 delivered in Q1 2019
• Increased customer participation in CN’s Western Canada fleet integration program
• Increased number of private unit trains in CN’s Western Canadian grain service
(1) Six major grains (wheat, barley, canola, oats, flax, rye) + lentils and peas.
(2) Statistics Canada, September 2018.
(3) USDA WASDE Estimates, September 2018.
(4) Based on Q1 2019 revenues.
Please see Forward-Looking Statements at the beginning of the presentation.
39Grain: CN operating the majority of new grain
elevators built in Canada since 2015
Est. incremental revenue range Annual crop tonnage CN export grain share
2019-2021 growth est. growth
$100 – 150M 2 – 2.5% CAGR 50% (2018) / 55%+ (by 2022)
21 new grain elevators built on CN lines:
Waterfront export facilities
Ray-Mont Logistics Announced
In operation 14
20 CN Viterra
Completed
exclusive
Announced 6
G3
GrainsConnect, Viterra
P&H G3
Shared 1 Grains Grains
GrainsConnect
Connect Connect ILTA
G3 P&H Viterra
G3
Viterra P&H
Other 4 Fraser Grain Terminal, G3
G3, Fibreco P&H
G3
G3
Viterra
Please see Forward-Looking Statements at the beginning of the presentation.
40Lumber and Panels: Steady
growth in U.S. housing market
CN Lumber / Panel Volumes to the U.S.
(thousands of carloads)
Panels Lumber U.S Housing Starts (000s)
200,000
187 2,000
1,801 170 168 164
160
180,000 1,800
150 149
141
160,000 1,600
140,000 1,400
1,327
1,211 1,262 1,250
1,174 *
1,200
1,139
120,000
1,112
100,000
1,003 1,000
925
80,000
781 800
60,000 600
40,000
38 37 400
20,000
CAGR 3% 200
- -
2006 2012 2013 2014 2015 2016 2017 2018 2019* Q1 18 Q1 19
• Largest carrier of forest products among
Class I railroads
• Opportunities available in our Western Canadian lumber
and panel franchise
• Over 10% of CN revenues tied to housing
• U.S. remains an important market for Canadian
lumber producers
• Acquiring 850 new centerbeam cars in 2018-2019
CN volumes include Canadian and U.S. origins.
*Please see Forward-Looking Statements at the beginning of this presentation.
41Wood Pellets: Growth driven by Asian market
Total Short Tons Shipped Pinnacle Renewable Energy Pacific Bioenergy
(millions) Legend
2.2 Canfor Energy North Premium Pellet
2.1 2.1
1.7 1.7 1.7
1.6
Fort St. John
Chetwynd
2012 2013 2014 2015 2016 2017 2018
Prince Rupert
• Exports to Asia represent ~20% of CN Houston
shipments (Japan, South Korea) Burns Lake
Prince George
• Further upside from new renewable energy Vanderhoof
targets in Japan, requiring a shift away from
coal Colebank Entwistle, AB
• Expansion projects at Smithers, BC Williams Lake
and Entwistle, AB
• Production efficiency project at
Watson, BC
2019-
2020 • Agreement to purchase all wood
Outlook pellets produced at Skeena’s new
state-of-the-art pellet plant at Terrace, Armstrong
BC
Vancouver
• Long term supply agreement with Japanese Lavington
power producers
42Automotive: CN network providing direct access to 15
major metropolitan dealer markets across North America
Access to 13 assembly plants in Ontario,
Michigan and Mississippi
• CN has a 70% rail share of
motor vehicles sold in Canada
• Rail-direct service from West
Coast to Detroit to handle
imported vehicle parts in
containers
43Automotive: Higher demand for SUVs and light trucks
SUVs and light trucks still gaining SUVs produce 50% more carloads
share in North America than sedans
North American SUV and light truck sales • 10 SUVs in a 2-level carload
(M units)
25 70%
20 60%
50%
15
40%
10 30%
5
20%
• 15 sedans in a 3-level carload
10%
0 0%
2012 2013 2014 2015 2016 2017 2018
Car Truck % Truck
Source IHS: January 2019
44Crude oil: Growth expected when Western Canada
Select spread widens to US$15
Crude oil shipments: carloads
Significant ramp-up in
crude volumes in H2 2018, Volumes in Q1 2019
with December as peak declined from
mandated production
curtailments
~127,000
~98,000 ~36,000 ~13,000
~82,000 ~10,000
~52,000 ~61,000 ~20,000 ~20,000 ~6,000 ~7,600
~4,000
~11,000 ~15,000
2014 2015 2016 2017 2018 Q1-18 Q2-18 Q3-18 Q4-18 Q1-19 Dec-18 Jan-19 Feb-19 Mar-19 Apr-19
Annual carloads Quarterly carloads Monthly carloads
Crude oil shipments: barrels per day (bpd)
~251,000
~232,000
~209,000 ~187,000
~162,000 ~129,000 ~131,000 ~145,000
~133,000 ~101,000 ~116,000
~85,000 ~99,000 ~69,000 ~86,000
2014 2015 2016 2017 2018 Q1-18 Q2-18 Q3-18 Q4-18 Q1-19 Dec-18 Jan-19 Feb-19 Mar-19 Apr-19
Annual bpd Quarterly bpd Monthly bpd
Please see Forward-Looking Statements at the beginning of the presentation.
45Petrochemical: $200-250M opportunity
of potential incremental revenues over 2019-2021
Alberta Industrial Heartland
Prince Rupert
• Nauticol
• Inter pipeline Ontario
Unit trains will feed Prince
Rupert’s propane export • Pembina
terminals by 2019-2020 • NOVA (Sarnia, ON)
• Greenergy terminal
• Altagas/Vopak RIPET (Johnstown, ON) (2020)
terminal
• Pembina (Watson Island)
U.S. Gulf
• Westlake (Geismar, LA)
• Exxon (Baton Rouge, LA)
• Wanhua (Convent, LA)
2019-2023 4 new petrochemical plants announced 3 new petrochemical major
expansions announced
outlook Inter pipeline (2021)
Westlake Chemical
(2019)
Wanhua (2021)
NOVA Chemicals
Nauticol (2021) (2022)
Pembina/PIC ExxonMobil (2021)
Heartland (2023)
46Content
Balancing
1 Company
Highlights 2 Our Key
Strengths 3 Operational
and Service
Experience
Innovating Creating
4 Markets 5 Everywhere
Every Day
6 Value for
Shareholders
47Innovating Everywhere Every Day Summary • Focus on select number of technology projects that can be implemented and drive value in the short-term • Digitizing rail operations improves costs • Rolling out pilot projects in 2019 • Leveraging technology for a safer and more efficient network
Track Evaluation System (TEST) cars
Leveraging technology to improve inspection productivity

• Utilize multiple technologies to automate
  Engineering track inspections
• Improve quality and reliability by
  providing consistent, reliable and
  objective inspection results
• Reduce track inspection labour costs
  while maintaining and improving network
  integrity and safety
• Decrease track time requirements and
  reduce safety risks associated with
  performing visual inspections
• Provide richer and more frequent data
  sets to generate stronger predictive
  analytical models

       Plan to add 5 TEST cars in 2019
                                                           49
Automated Inspection Portals (AIP)
Deploying the next generation of inspection technologies
First AIP installed in Winnipeg Next Steps
• Improve asset reliability and availability • Network-scale rollout (Toronto, Memphis
• Shift toward predictive maintenance (versus and Fulton)
reactive) • Assessing broad spectrum of relevant use
• Better workforce utilization cases for visual recognition across CN’s
• Reduce disruptions operations
• Enhance network safety and security • Prioritizing applications that improve safety,
effective capacity, and operational
• Create effective capacity
efficiency
• Improve overall customer experience
In 2019, 7 portals expected to be operational in Winnipeg (4), Toronto (1),
Memphis (1) and Fulton (1)
50Mobile applications
A new breed of connectivity targeting Operations productivity
Mobile device for carmen
• Streamline the process for Car Mechanics to report their work directly on
device
• Improve supervisors’ visibility of work progression and efficiency with
remote communication of instructions
• Increase data accuracy and scope of work billed
• Serve as a platform for future mobile mechanical information exchange
• Rollout started in Q1 2018 (500 devices)
Mobile device for conductors
• Increase operational visibility, productivity and fluidity as conductors receive
their work instructions directly on a mobile device
• Speed up information flow to customers and increase accuracy in reporting
• Enable dynamic planning and work assignment, staying current on progress
• Pilot rollout scheduled for Q3 2019 (9,500 devices)
Documentation on mobile device
• Improve safety and productivity with easier navigation and access to rules,
customization of content and more robust update process
• Improve ergonomic experience for crews and reduce environmental footprint
• Rollout scheduled for Q3 2019
51Seamless border crossing
Live-Lift at Ranier and Port Huron
Robotic Process Automation
Border Crossings
Live-Lift for single container inspection minimizes train Robotic Process Automation (RPA) is used to automatically
delays - speeding up border crossings for our customers and proactively monitor shipments crossing the border for
completeness of customs information, in an effort to speed
CN efficiently facilitates the handling of containers and train
up the traffic through the border, minimize stops and
loading plans for inspection releases. Live-Lift has
reduce overall clerical effort
eliminated the majority of U.S.-rejected containers -
reducing transit times and delays Designed to automate low value, high volume manual
clerical activities, allowing greater focus of human capital
In March 2018, CN completed a major expansion project
on more value-added tasks
and nearly doubled our Ranier border crossing facility.
Implemented Live-Lift at Port Huron, MI border crossing in Since spring 2018, a total of 12 out of 13 borders are now
Q4 2018 monitored via RPA, resulting in a 70% reduction of related
border stops. Expect to implement RPA at Rainer border
CN’s Ranier facility now provides a full range of inspection
crossing in Q4 2018
services similar to those found at U.S. major ports of entry
52Procurement & Supply Management transformation $70M
savings achieved after one year with potential $130M
cumulative savings upon completion
People Process Technology
• Strengthening the team and • Implementing category • Moving spend through
upgrading skills through management, structuring preferred channels to
training, development and portfolios of spend that increase spend visibility,
external recruitment
mirror the supply market strengthen compliance
• Leveraging cross-functional to ensure CN leverages its and help identify
category teams to identify total spend opportunities through
and deliver on performance data analytics
improvements across quality, • Procurement strategy
cost, reliability and innovation driven by a total cost of • Implementing leading
KPIs ownership approach contract management and
eProcurement systems
• Driving a continuous
improvement culture focused
on value creation, teamwork
and problem-solving
Currently ahead of target on expected cost savings from investment of $25M to
transform our Procurement & Supply Management function over 3 years
53Content
Balancing
1 Company
Highlights 2 Our Key
Strengths 3 Operational
and Service
Experience
Innovating Creating
4 Markets 5 Everywhere
Every Day
6 Value for
Shareholders
54Creating Value
for Shareholders
Summary
• Delivering solid results over the years
• Solid free cash flow generation
• Strong focus on re-investing in the
business while generating 15%+
adjusted ROIC (1)
• Rewarding shareholders through
dividends and share buybacks
• Consistently increasing dividends per
share every year since IPO in 1995
(16% CAGR)
(1) Please see the Appendix for an explanation of this non-GAAP measure.Delivering solid results over the years
Revenues ▲11% Net Income ▲6%
Q1 19 vs Q1 18 Q1 19 vs Q1 18
$M $M
14,321 5,484
13,041
12,134 12,611 12,037
9,920 10,575
4,328
3,538 3,640
3,167
2,680 2,612
3,194 3,544
CAGR 6% CAGR 8% 741 786
2012 2013 2014 2015 2016 2017 2018 Q1 18 Q1 19 2012 2013 2014 2015 2016 2017 2018 Q1 18 Q1 19
Diluted EPS ▲8% Adjusted Diluted EPS (1) ▲17%
Q1 19 vs Q1 18 Q1 19 vs Q1 18
$ per share $ per share
7.24
5.87 5.50
4.67 4.59 4.99
4.39 4.44
3.85 3.76
3.06 3.09 2.81 3.06
CAGR 11% 1.00 1.08 CAGR 12% 1.00 1.17
2012 2013 2014 2015 2016 2017 2018 Q1 18 Q1 19 2012 2013 2014 2015 2016 2017 2018 Q1 18 Q1 19
(1) Please see website, Financial Results, www.cn.ca/financial-results, for an explanation of this non-GAAP measure.
For more financial information, please visit www.cn.ca/en/investors
56Free Cash Flow
Steady cash flow generation
Free Cash Flow (1)
$M
2,778
2,520 2,514
2,373
2,220
1,661 1,623
322 286
2012 2013 2014 2015 2016 2017 2018 Q1 18 Q1 19
(1) Please see website, Financial Results, www.cn.ca/financial-results, for an explanation
of this non-GAAP measure.
57Disciplined capital investments
Investing to support our business and committed to investing
for the long-term
Capital Investments and Adjusted ROIC (1)
in $M & % respectively
4,500 30.0%
4,000
3,900 28.0%
3,500
3,531 PTC (2)
26.0%
• Strong capital
Equipment program driving
2,752
safety, fluidity and
3,000 24.0%
2,706 2,703
2,297
productivity
2,500 22.0%
2,017
2,000
1,825 20.0%
17.0% Infrastructure • Adjusted ROIC (1)
maintenance
1,500 18.0%
16.2%
1,000
16.0%
15.2%
15.8% 15.9% 15.7%
16.0%
used to measure
efficiency of CN’s
long-term capital
500 14.0%
Capacity /
Growth
investments
- 12.0%
2012 2013 2014 2015 2016 2017 2018 2019F
Capital Investment Ratio (3)
18% 19% 19% 21% 23% 21% 25%
Over $22B capital investments over the last 10 years
(1) Please see the Appendix for an explanation of this non-GAAP measure.
(2) Positive Train Control.
(3) Capital investments as a percentage of revenues.
58Maintaining a strong balance sheet
Prudent financial management Investment Grade Credit Ratings
Moody’s Investors
Adjusted debt-to-adjusted EBITDA multiple (1)
Service A2
times
Dominion Bond Rating
Service A
1.97 2.01
1.94
1.85
1.71 1.74
1.63
1.77 1.75 Standard & Poor’s A
2012 2013 2014 2015 2016 2017 2018 LTM LTM Je pourrais metre une
ended ended
Mar 18 Mar 19
photo en backgroud
(1) Please see website, Financial Results, www.cn.ca/financial-results, for an explanation
of this non-GAAP measure
59Rewarding shareholders
~82% of adjusted net income (1) returned to shareholders in 2018
Total shareholder distribution Dividends
$M
• Dividends increased every year
Share repurchases since 1995 IPO
Dividends 3,333
3,159 3,239
Total • CAGR of 16% over 23 years
2,746
• Targeting a 35% adjusted dividend
2,323 1,159 1,239 1,333
2,052 2,124 payout ratio (2) (3)
996
818
652 724
967
2,000 2,000 2,000 821
1,400 1,400 1,505
1,750 336
389
Share repurchases
631 432
• Normal course issuer bid (NCIB) of
2012 2013 2014 2015 2016 2017 2018 Q1 18 Q1 19
up to 22 million common shares
Dividend Payout Ratio (2) from February 1, 2019 to January
24% 28% 26% 28% 32% 23% 31%
31, 2020
• Over $21B of share repurchases
Adjusted Dividend Payout Ratio (2)
since 2000
27% 28% 26% 28% 32% 33% 33%
(1) Please see website, Financial Results, www.cn.ca/financial-results, for an explanation of this non-GAAP measure.
(2) Please see the Appendix for an explanation of these measures.
(3) Please see Forward-Looking Statements at the beginning of the presentation.
60Solid Track Record
Market cap ~$90B
CNR, CNI vs TSX, S&P 500
350
CNR
300
250 CNI
200 S&P 500
150
TSX
100
CAD/US $
50
0
2012 2013 2014 2015 2016 2017 2018 2019
Jan 2012 = 100
Up to April 30, 2019
For more stock information, please visit www.cn.ca/en/investors/stock-information 61Reaffirming 2019 financial
outlook
• Expect to deliver adjusted diluted EPS growth
in the low double-digits range versus 2018
adjusted diluted EPS of $5.50 based on (1) (2):
• Volume growth expected to be in the high
single-digit range in terms of RTMs
• Overall pricing above rail inflation
• Canadian to U.S. dollar exchange rate of
approximately 75 cents
• Capital envelope at approximately $3.9B
for 2019 to support a solid pipeline of growth
opportunities (2)
• Balanced shareholder distribution
• Dividend increase of 18% ̶ Targeting an adjusted
dividend payout ratio of 35% (3)
• 12-month NCIB from February 1, 2019 to January
31, 2020 to repurchase up to 22 million common
shares
(1) Please see website, First Quarter Results, www.cn.ca/financial-results, for an explanation of this
non-GAAP measure.
(2) Please see Forward-Looking Statements at the beginning of the presentation for a summary of
key assumptions and important risk factors and underlying CN’s 2019 financial outlook.
(1)
(3) Adjusted dividend payout ratio is defined as dividends as a percentage of adjusted net income .
Please see Forward-Looking Statements at the beginning of the presentation. 62Appendix: Non-GAAP measures
This presentation makes reference to non-GAAP measures that do not have any standardized meaning prescribed by GAAP,
including adjusted dividend payout ratio, ROIC and adjusted ROIC. These non-GAAP measures may not be comparable to
similar measures presented by other companies. These non-GAAP measures should not be considered in isolation or as a
substitute for financial measures prepared in accordance with GAAP.
Adjusted Dividend Payout Ratio
Management believes that the adjusted dividend payout ratio is a useful measure of the Company’s financial strength as it
demonstrates the sustainability of the Company’s dividend payments. The Company calculates the dividend payout ratio as
dividends divided by net income. The Company calculates the adjusted dividend payout ratio as dividends divided by adjusted
net income.
In $M, unless otherwise indicated 2012 2013 2014 2015 2016 2017 2018
Dividends 652 724 818 996 1,159 1,239 1,333
Net income 2,680 2,612 3,167 3,538 3,640 5,484 4,328
Dividend payout ratio (%) 24.3 27.7 25.8 28.2 31.8 22.6 30.8
Dividends 652 724 818 996 1,159 1,239 1,333
Adjusted net income (1) 2,456 2,582 3,095 3,580 3,581 3,778 4,056
Adjusted dividend payout ratio (%) 26.5 28.0 26.4 27.8 32.4 32.8 32.9
(1) Please see website, Financial Results, www.cn.ca/financial-results, for an explanation of this non-GAAP measure
63Appendix: Non-GAAP measures (continued)
ROIC and Adjusted ROIC
Management believes that ROIC and adjusted ROIC are useful measures of the efficiency in the use of capital funds. The
Company calculates ROIC as return divided by average invested capital. Return is defined as net income plus interest expense
after tax, calculated using the Company’s effective tax rate. Average invested capital is defined as the sum of total
shareholders’ equity, long-term debt and current portion of long-term debt less cash and cash equivalents, and restricted cash
and cash equivalents, averaged between the beginning and ending balance over a twelve-month period. The Company
calculates adjusted ROIC as adjusted return divided by average invested capital. Adjusted return is defined as adjusted net
income plus interest expense after tax, calculated using the Company’s effective tax rate, excluding the tax effect of
adjustments used to determine adjusted net income.
In $M, unless otherwise indicated 2012 2013 2014 2015 2016 2017 2018
Net income 2,680 2,612 3,167 3,538 3,640 5,484 4,328
Interest expense 342 357 371 439 480 481 489
(1)
Tax on interest expense (91) (97) (102) (120) (125) (124) (116)
Return 2,931 2,872 3,436 3,857 3,995 5,841 4,701
Average invested capital 16,913 18,650 20,711 23,014 24,905 26,019 28,192
ROIC (%) 17.3 15.4 16.6 16.8 16.0 22.4 16.7
Adjusted net income (2) 2,456 2,582 3,095 3,580 3,581 3,778 4,056
Interest expense 342 357 371 439 480 481 489
(3)
Adjusted tax on interest expense (93) (95) (103) (116) (126) (124) (120)
Adjusted return 2,705 2,844 3,363 3,903 3,935 4,135 4,425
Average invested capital 16,913 18,650 20,711 23,014 24,905 26,019 28,192
Adjusted ROIC (%) 16.0 15.2 16.2 17.0 15.8 15.9 15.7
(1) The effective tax rates from 2012 to 2018 used to calculate the tax on interest expense are 26.7%, 27.2%, 27.4%, 27.4%, 26.1%, 25.8% and 23.8%, respectively. Due
to the negative effective tax rate reported by the Company in 2017, tax on interest expense for 2017 periods was calculated using an adjusted effective tax rate.
(2) Please see website, Financial Results, www.cn.ca/financial-results, for an explanation of this non-GAAP measure.
(3) The adjusted effective tax rates from 2012 to 2018 used to calculate the adjusted tax on interest expense are 27.3%, 26.6%, 27.7%, 26.5%, 26.2%, 25.8% and
24.5%, respectively. 64Investor Relations Contacts
Paul Butcher
Vice President, Investor Relations
Paul.Butcher@cn.ca
514-399-0052
Michaël Archambault
Senior Manager, Investor Relations
Michael.Archambault@cn.ca
514-399-4654
For more information, please visit www.cn.ca/en/investors/investor-contacts
TSX: CNR NYSE: CNI 65You can also read