OFFERING MEMORANDUM 1250 LITTLE BAY AVE - 1250 Little Bay Ave Norfolk, VA 23503 - LoopNet
←
→
Page content transcription
If your browser does not render page correctly, please read the page content below
OFFERING MEMORANDUM

     1250 LITTLE BAY AVE
  1250 Little Bay Ave • Norfolk, VA 23503

                                            1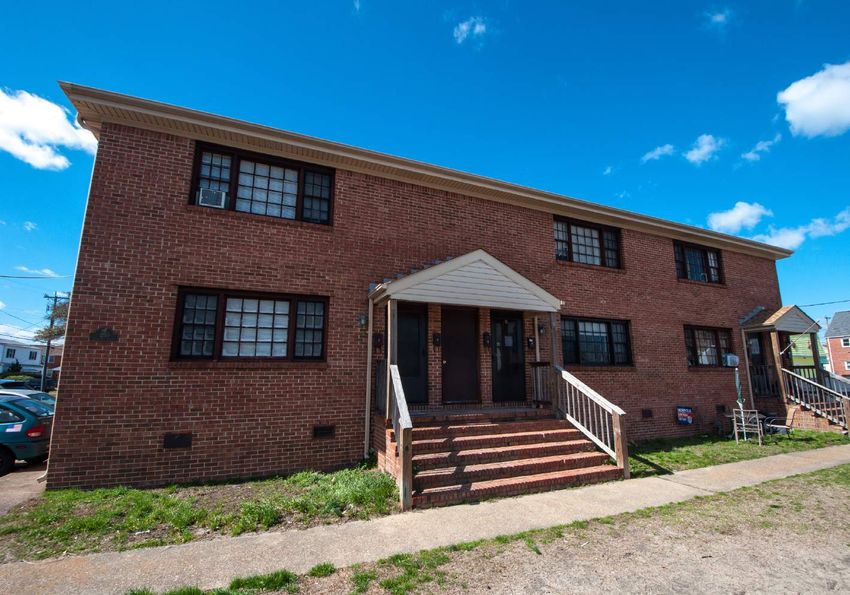
NON-ENDORSEMENT AND DISCLAIMER NOTICE

Confidentiality and Disclaimer
The information contained in the following Marketing Brochure is proprietary and strictly confidential. It is intended to be reviewed only by the party receiving it from Marcus & Millichap and
should not be made available to any other person or entity without the written consent of Marcus & Millichap. This Marketing Brochure has been prepared to provide summary, unverified
information to prospective purchasers, and to establish only a preliminary level of interest in the subject property. The information contained herein is not a substitute for a thorough due
diligence investigation. Marcus & Millichap has not made any investigation, and makes no warranty or representation, with respect to the income or expenses for the subject property, the
future projected financial performance of the property, the size and square footage of the property and improvements, the presence or absence of contaminating substances, PCB's or
asbestos, the compliance with State and Federal regulations, the physical condition of the improvements thereon, or the financial condition or business prospects of any tenant, or any
tenant's plans or intentions to continue its occupancy of the subject property. The information contained in this Marketing Brochure has been obtained from sources we believe to be reliable;
however, Marcus & Millichap has not verified, and will not verify, any of the information contained herein, nor has Marcus & Millichap conducted any investigation regarding these matters
and makes no warranty or representation whatsoever regarding the accuracy or completeness of the information provided. All potential buyers must take appropriate measures to verify all of
the information set forth herein. Marcus & Millichap is a service mark of Marcus & Millichap Real Estate Investment Services, Inc. © 2018 Marcus & Millichap. All rights reserved.

Non-Endorsement Notice
Marcus & Millichap is not affiliated with, sponsored by, or endorsed by any commercial tenant or lessee identified in this marketing package. The presence of any corporation's logo or name
is not intended to indicate or imply affiliation with, or sponsorship or endorsement by, said corporation of Marcus & Millichap, its affiliates or subsidiaries, or any agent, product, service, or
commercial listing of Marcus & Millichap, and is solely included for the purpose of providing tenant lessee information about this listing to prospective customers.

ALL PROPERTY SHOWINGS ARE BY APPOINTMENT ONLY.
PLEASE CONSULT YOUR MARCUS & MILLICHAP AGENT FOR MORE DETAILS.

1250 LITTLE BAY AVE
Norfolk, VA
ACT ID Y0600101

                                                                                                                                                                                                  2
1250 LITTLE BAY AVE

                                     TABLE OF CONTENTS

                           SECTION

INVESTMENT OVERVIEW            01
 Offering Summary
 Regional Map
 Local Map
 Aerial Photo

FINANCIAL ANALYSIS             02
 Rent Roll Summary
 Rent Roll Detail
 Operating Statement
 Notes
 Pricing Detail
 Acquisition Financing
 Growth Rate Projections
 Cash Flow

MARKET COMPARABLES             03
 Sales Comparables

 Rent Comparables

MARKET OVERVIEW                04
 Market Analysis
 Demographic Analysis

                                                    3
1250 LITTLE BAY AVE

    INVESTMENT
    OVERVIEW

                      4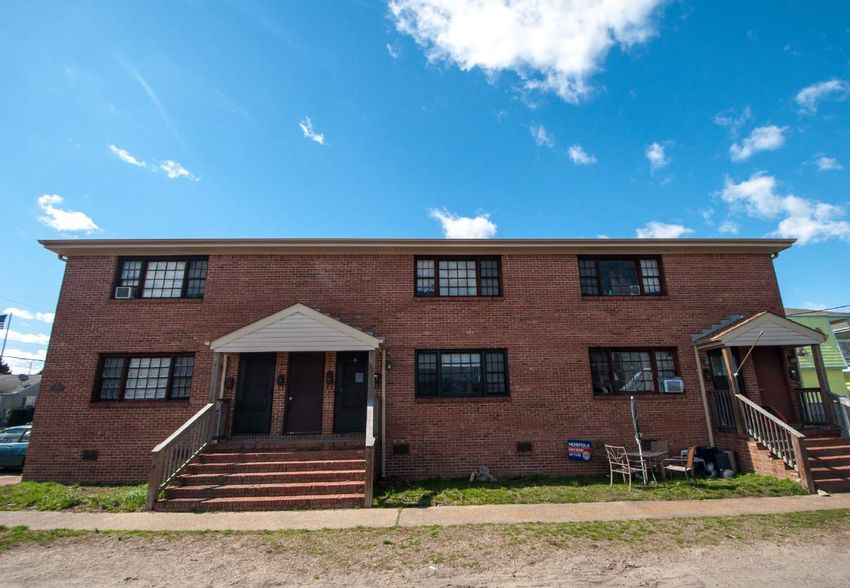
THE MACARTHUR APARTMENTS PORTFOLIO

                                                             LOCATION SUMMARY

                                                            Chesapeake Bay
                                                                Beaches
                                          1250 Little Bay
                         Naval              Apartments
                        Station
                        Norfolk

                                        Norview
                                     Shopping Center

                                                                                5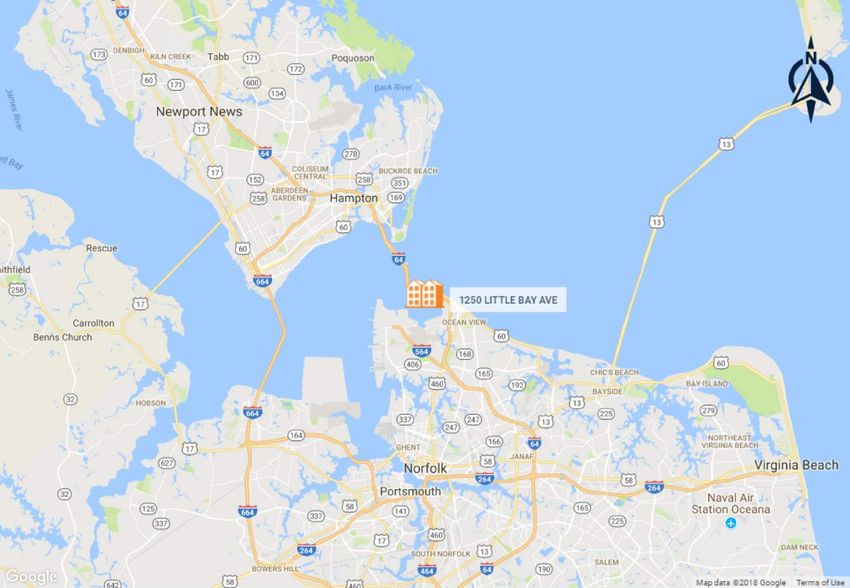
THE MACARTHUR APARTMENTS PORTFOLIO

                                                                           LOCATION SUMMARY

                                      Tidewater
                                        Drive
                                                                                       Naval
                                                               c                      Station
                                                                                      Norfolk

                                                  I-64

                   Thomas
                 Willoughby
                 Elementary

                                      Captain’s          1250 Little Bay
                                      Quarters             Apartments
                                     Recreation

                                                                             Banger
                                                                              Pier

                                                                                                66
1250 LITTLE BAY AVE

                                                                                                                                                    OFFERING SUMMARY
EXECUTIVE SUMMARY
                                                        VITAL DATA
 Price                                     $320,000                                    CURRENT            YEAR 1
 Down Payment                         25% / $80,000       CAP Rate                       8.10%              9.43%
                                                                                                                     MAJOR EMPLOYERS
 Loan Amount                               $240,000       GRM                              6.31               5.87
                                                          Net Operating
     Loan Type                        Proposed New                                      $25,913           $30,166    EMPLOYER                                 # OF EMPLOYEES
                                                          Income
                                                          Net Cash Flow                                              United States Dept of Navy                           4,435
     Interest Rate / Amortization   4.50% / 30 Years                           18.89% / $15,113   24.21% / $19,366
                                                          After Debt Service
 Price/Unit                                 $53,333       Total Return         18.89% / $15,113   29.05% / $23,238   USS Wasp Lhd 1                                       1,500
 Price/SF                                    $84.66                                                                  Naval Aviation Engrg Svcs                            1,100
 Number of Units                                   6                                                                 Veterans Affairs Medical Ctr                         1,060
 Rentable Square Feet                         3,780
                                                                                                                     Hampton University                                   1,025
 Number of Buildings                               1
                                                                                                                     Commander Atlantic Division                          1,000
 Number of Stories                                 2
                                                                                                                     Swells Point Branch Med Clinic                        924
 Year Built                                    1970
 Lot Size                               0.12 acre(s)                                                                 US Atlantic Fleet                                     700
                                                                                                                     US Army Future Center                                 628
                                                           UNIT MIX                                                  US Navy Fleet Training Center                         609
 NUMBER                                                                        APPROX.                               Helicpter Mine Countermeasures                        600
                                           UNIT TYPE
 OF UNITS                                                                      SQUARE FEET
                                                                                                                     Navy Exchange                                         600
 6                                         One Bedroom, One Bathroom           630

                                                                                                                     DEMOGRAPHICS
 6                                         Total                               3,780

                                                                                                                                                  1-Miles     3-Miles   5-Miles
                                                                                                                       2017 Estimate Pop              2,991    27,908    98,201
                                                                                                                       2017 Census Pop                3,008    27,650    96,827
                                                                                                                       2017 Estimate HH               1,480    10,631    38,885
                                                                                                                       2017 Census HH                 1,496    10,583    38,586
                                                                                                                       Median HH Income             $44,569   $46,727   $48,742
                                                                                                                       Per Capita Income            $31,063   $24,084   $27,454
                                                                                                                       Average HH Income            $59,587   $59,197   $66,835

                                                                                                                                                                                  #7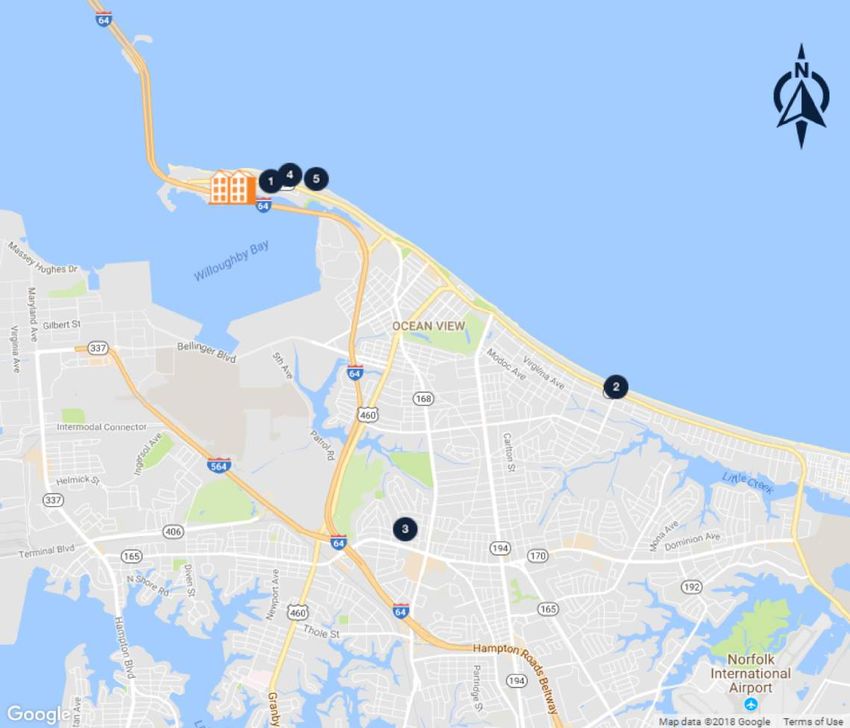
1250 LITTLE BAY AVE

                                                                                                                                               OFFERING SUMMARY
INVESTMENT OVERVIEW
1250 Little Bay offers potential buyers the opportunity to purchase a well-maintained asset with tremendous upside potential. As is, the property offers potential investors a
18.89 percent cash on cash return and an equally lucrative IRR. By maintaining current operating efficiency's, building on the rents, and implementing a property lease up
structure a purchaser can acquire a stable coupon with long term upside in appreciation.

The portfolio is serviced by I-64, known as Hampton Roads Beltway and accessible in just under a mile of the property, provides tenants access to Norfolk's major
commercial corridors and top employment drivers including the US Department of Defense, Sentara Healthcare Centers, Old Dominion University, BAE systems, Norfolk
State University and more. Tenants with school-age children have access to public schools a mile away. The Norfolk International Airport, which serves the entire Hampton
Roads, is located only 9 miles from the property.

The Hampton Roads economy is heavily anchored to the US Department of Defense, a major employer for the area, housing eight military installations and the second-
largest concentration of military personnel in the U.S. Naval Station Norfolk, the worlds largest naval base employs upwards of 67,000 people and yields 6,200 acres of the
Hampton Roads commercial acquisition. With the inauguration of republican leadership, military funding and employee benefits are expected to grow in salary increases,
branch wide budget expansion, and more.

Investors are moving out of major metro areas into secondary and tertiary markets, such as the Hampton Roads/ Tidewater area, in search of higher rates of return.
Although a few distressed assets are still available at cap rates above eight percent, more investors are targeting stabilized properties with higher cash ows. Apartments
near large employers, military bases and institutions of higher learning, such as Old Dominion University, provide a steady renter base with cap rates for Class A/B assets
typically in the seven percent area.

        INVESTMENT HIGHLIGHTS

         § Turn-Key Asset with Value Add Potential
         § Close Proximity to Interstate 64 and Tidewater Drive
         § Annual Return Increase by +5%
         § 10 Yr. Levered IRR of 28.42%

                                                                                                                                                                           8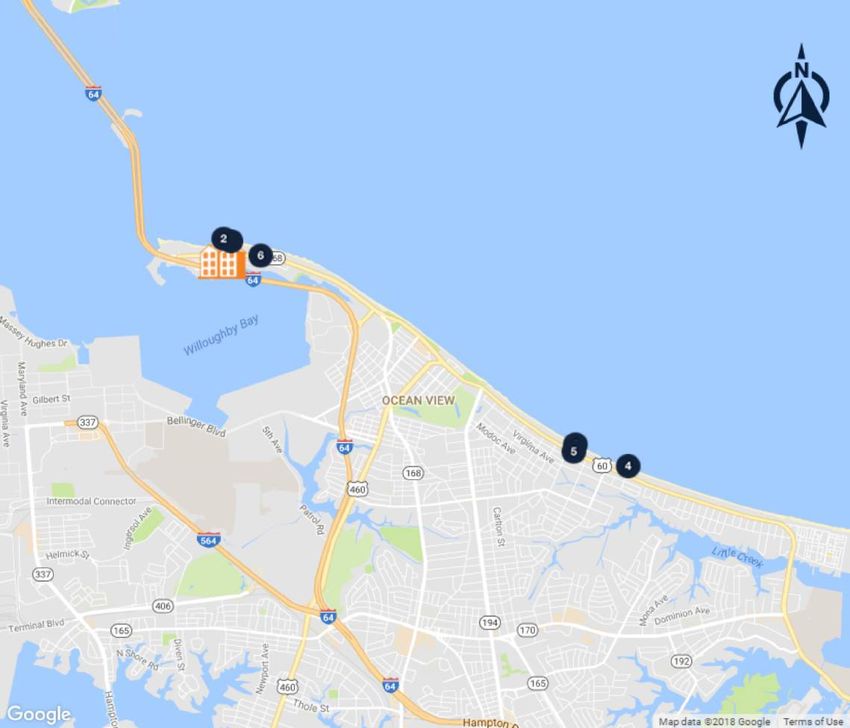
1250 LITTLE BAY AVE
OFFERING SUMMARY
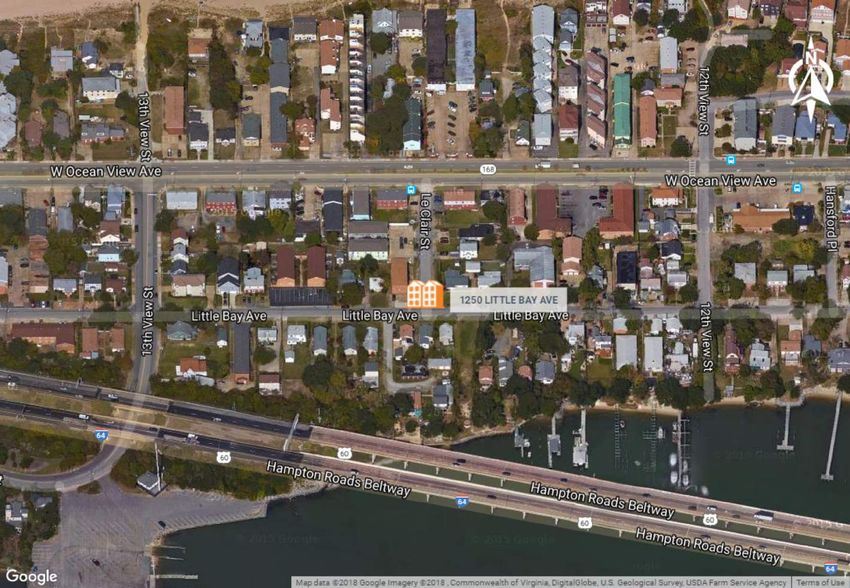
PROPERTY OVERVIEW
Marcus & Millichap is pleased to present the Offering Memorandum for 1250 Little Bay Avenue, located in Norfolk, Virginia. The
property consists of 6 apartment units in a single 2-story building. The building was built in 1970 and are situated on .12 acres.
Located on Willoughby Split, the subject property is nested between Chesapeake Bay and Willoughby Bay, which provide the
property with ample maritime activities, outdoor attractions, and a charming water-front community. The subject property
neighbors Tidewater Drive and Interstate 64; primary traffic arteries through the South Hampton Roads region, and dominant
routes through The City of Norfolk.
The property consists of 6 one bedroom, one bathroom units. Due to the concentrated unit-mix and location in a quaint
neighborhood, this property offers a unique living experience at the core of the Hampton Roads area. The property is serviced
by U.S. and State Routes 64 and 168 providing intra-city access to the primary commercial and employment drivers of the area
including the US Department of Defense, Sentara Healthcare Centers, Old Dominion University, BAE systems, Norfolk State
University and more. Tenants with school-age children have access to public schools less than a mile away.
Norfolk's oceanfront, a huge tenant driver to the area, recently completed, The Nourishment Plan which expanded and
Common Area Amenities
heightened the beach along Willoughby Spit. Downtown Norfolk recently renovated both the Waterside District ($50 Million) and
the Hilton "Main" Hotel ($150 Million) which brings jobs, restaurants, and nightlife to the area. One of Norfolk's largest and most
recent completions, The Icon at City Walk ($90 Million), provides downtown with 720 new apartments and a shift towards a § Walking Distance from HRT Bus Route
luxurious lifestyle the city was lacking. ADP, Automatic Data Processing, ($32.5 Million) is expected to bring an estimated 2,000 § .5 Miles from I-64
jobs to the area and is anticipated to produce annual regional earnings of about $158 million as the overall economic impact § 6 Miles from Naval Station Norfolk
climbs to almost $465 million, alone. This commercial focus continues its progress into 2018 with multiple projects underway § 10 Miles from Hampton Road’s First Ikea
such as the construction of Ikea Furniture Store aimed to extend commercial acquisition. Internationally owned brand, Ikea,
Furniture Store
broke ground for construction late last year with completion expected to conclude in mid-2019. This $75 million investment will
provide the area with 500 additional mid-to-low level jobs and authenticate Virginia as a successful commercial corridor for
further international companies to come. Unit Amenities
§ HVAC In All Units
§ Ample Off-Street Parking
#9
1250 LITTLE BAY AVE

                                                                                                            OFFERING SUMMARY
PROPERTY SUMMARY
                            THE OFFERING                                                            PROPOSED FINANCING
 Property                                                 1250 Little Bay Ave    First Trust Deed
 Price                                                              $320,000     Loan Amount                                 $240,000
 Property Address                             1250 Little Bay Ave, Norfolk, VA   Loan Type                               Proposed New
 Assessors Parcel Number                                           22288532      Interest Rate                                 4.50%
                           SITE DESCRIPTION                                      Amortization                                30 Years
 Number of Units                                                            6    Loan Term                                   10 Years
 Number of Buildings                                                        1    Loan to Value                                   75%
 Number of Stories                                                          2    Debt Coverage Ratio                              2.4
 Year Built/Renovated                                                    1970
 Rentable Square Feet                                                   3,780
 Lot Size                                                         0.12 acre(s)
 Type of Ownership                                                Fee Simple
 Parking                                                            Off-Street
 Parking Ratio                                                            1:1
 Landscaping                                                              Flat
                              UTILITIES
 Water                                                           Owner Paid
 Electric                                                        Tenant Paid
                            CONSTRUCTION
 Foundation                                                    Concrete Slab
 Framing                                                                Wood
 Exterior                                                                Brick
 Parking Surface                                                      Asphalt
 Roof                                                                     Flat
                             MECHANICAL
 HVAC                                                           Window Units
 Fire Protection                                                    City Code

                                                                                                                                 10
1250 LITTLE BAY AVE
PROPERTY PHOTO
111250 LITTLE BAY AVE
PROPERTY PHOTO
121250 LITTLE BAY AVE
PROPERTY PHOTO
131250 LITTLE BAY AVE
PROPERTY PHOTO
141250 LITTLE BAY AVE
REGIONAL MAP
151250 LITTLE BAY AVE
LOCAL MAP
161250 LITTLE BAY AVE
AERIAL PHOTO
171250 LITTLE BAY AVE
MARKET
COMPARABLES
181250 LITTLE BAY AVE
SALES COMPARABLES MAP
1250 LITTLE BAY AVE
(SUBJECT)
1 Casa Playa
2 1900 Kingston Avenue
3 Ashlawn Portfolio
4 963 West Ocean View
810 West Ocean View
5
Avenue
SALES COMPARABLES
19PROPERTY
1250 LITTLENAME
BAY AVE
SALES COMPARABLES SALES COMPS AVG SALES COMPARABLES
Average Price Per Unit
$200,000
$180,000
$160,000
$140,000
$120,000
$100,000
$80,000
Avg. $69,703
$60,000
$40,000
$20,000
$0
1250 Little Casa Playa 1900 Ashlawn 963 West 810 West
Bay Ave Kingston Portfolio Ocean View Ocean View
Avenue Avenue
20PROPERTY
1250 LITTLENAME
BAY AVE
SALES COMPARABLES
MARKETING TEAM
SALES COMPARABLES
CASA PLAYA 1900 KINGSTON AVENUE
1250 LITTLE BAY AVE 1033 Little Bay Ave, Norfolk, VA, 23503 1900 Kingston Ave, Norfolk, VA, 23503
1250 Little Bay Ave, Norfolk, VA, 23503
1 2
rentpropertyname1 rentpropertyname1
Units Unit Type Units Unit Type Units Unit Type
Offering Price: $320,000 6 One Bdr, One Bath Close Of Escrow: 7/14/2017 4 1 Bdr 1 Bath Close Of Escrow: 5/31/2017 6 2 Bdr 1 Bath
Price/Unit: $53,333 Sales Price: $545,000 1 2 Bdr 2 Bath Sales Price: $445,000 2 1 Bdr 1 Bath
Price/SF: $84.66 Price/Unit: $109,000 Price/Unit: $55,625
CAP Rate: 8.10% Price/SF: $121.11 Price/SF: $74.17
GRM: 6.31 CAP Rate: 6.81% CAP Rate: 8.43%
Total No. of Units: 6 GRM: 8.44 GRM: 6.56
Year Built: 1970 Total No. of Units: 5 Total No. of Units: 8
Year Built: 1969 Year Built: 1972
rentpropertyaddress1 rentpropertyaddress1 rentpropertyaddress1
Underwriting Criteria
Income $46,644 Expenses $20,731
NOI $25,913 Vacancy ($4,056)
NOTES
Terms: The Uzun Group of Marcus & Millichap sold 1033 Little Bay Avenue NOTES
on 07/14/2017 for $545,000 ($121.11/SF; $109,000/Unit). Terms: The Uzun Group of Marcus & Millichap sold 1900 Kingston Avenue
on 05/31/2017 for $445,000 ($74.17/SF; $55,625/Unit).
21PROPERTY
1250 LITTLENAME
BAY AVE
SALES COMPARABLES
MARKETING TEAM
SALES COMPARABLES
ASHLAWN PORTFOLIO 963 WEST OCEAN VIEW 810 WEST OCEAN VIEW AVENUE
504, 508, 519 Ashlawn Drive, Norfolk, VA, 23505 963 W Ocean View Ave, Norfolk, VA, 23503 810 W Ocean View Ave, Norfolk, VA, 23503
3 4 5
rentpropertyname1 rentpropertyname1 rentpropertyname1
Units Unit Type Units Unit Type Units Unit Type
Close Of Escrow: 2/23/2018 18 2 Bdr 1 Bath Close Of Escrow: 12/29/2017 6 2 Bdr 1 Bath Close Of Escrow: 11/3/2017 12 2 Bdr 1 Bath
Sales Price: $880,000 Sales Price: $360,000 Sales Price: $1,050,000 2 2 Bdr 1 Bath
Price/Unit: $48,889 Price/Unit: $60,000 Price/Unit: $75,000
Price/SF: $65.19 Price/SF: $68.57 Price/SF: $95.63
CAP Rate: 8.67% CAP Rate: 4.30% CAP Rate: 6.63%
Total No. of Units: 18 Total No. of Units: 6 Total No. of Units: 14
Year Built: 1973 Year Built: 1970 Year Built: 1980
rentpropertyaddress1 rentpropertyaddress1 rentpropertyaddress1
NOTES NOTES NOTES
Terms: The Uzun Group of Marcus & Millichap sold Ashlawn Portfolio on Terms: The Uzun Group of Marcus & Millichap sold 963 West Ocean View Terms: The Uzun Group of Marcus & Millichap sold 810 West Ocean View
2/23/2018 for $880,000 ($65.19/SF; $48,889/Unit). Avenue on 12/29/2017 for $360,000 ($69/SF; $60,000/Unit). Avenue on 11/03/2017 for $1,050,000 ($95.63/SF; $75,000/Unit).
221250 LITTLE BAY AVE
8 RENT COMPARABLES MAP
1250 LITTLE BAY AVE
(SUBJECT)
1 Beach House
2 Surf Rider
3 Havana Beach
4 Castaways
5 1701 Kingston Avenue
6 Casa Playa
7
8
9
10
11
12
13
14
15
16
17
18
20
23PROPERTY
1250 LITTLENAME
BAY AVE
RENT COMPARABLES
AVERAGE RENT - MULTIFAMILY
1 Bedroom
$900
$810 Avg. $771
$720
$630
$540
$450
$360
$270
$180
$90
$0
1250 Little Beach House Surf Rider Havana Castaways 1701 Casa Playa
Bay Ave Beach Kingston
Avenue
24PROPERTY
1250 LITTLENAME
BAY AVE
RENT COMPARABLES
MARKETING TEAM
BEACH HOUSE SURF RIDER
1250 LITTLE BAY AVE
rentpropertyname1 1212 W Ocean View Ave, Norfolk, VA, 23503 1240-1242 W Ocean View Ave, Norfolk, VA, 23503
1250 Little Bay Ave, Norfolk, VA, 23503
rentpropertyaddress1
1 2
rentpropertyname1 rentpropertyname1
Unit Type Units SF Rent Rent/SF Unit Type Units SF Rent Rent/SF Unit Type Units SF Rent Rent/SF
One Bdr, One Studio 1 $750 $775-
6 630 $704 $1.12 1 Bdr 1 Bath 16 850 $0.93
Bath $800
$775- $875-
Total/Avg. 6 630 $704 $1.12 1 Bdr 1 Bath 16 800 $1.05 2 Bdr 1 Bath 16 1,000 $0.94
$900 $1,000
Total/Avg. 17 800 $832 $1.05 Total/Avg. 32 925 $863 $0.93
YEAR BUILT: 1970 YEAR BUILT: 1971 YEAR BUILT: 1981
rentpropertyaddress1 rentpropertyaddress1 rentpropertyaddress1
25PROPERTY
1250 LITTLENAME
BAY AVE
RENT COMPARABLES
MARKETING TEAM
HAVANA BEACH CASTAWAYS 1701 KINGSTON AVENUE
1721 E Ocean View Ave, Norfolk, VA, 23503 2007 E Ocean View Ave, Norfolk, VA, 23503 1701 Kingston Ave, Norfolk, VA, 23503
3 4 5
rentpropertyname1 rentpropertyname1 rentpropertyname1
Unit Type Units SF Rent Rent/SF Unit Type Units SF Rent Rent/SF Unit Type Units SF Rent Rent/SF
1 Bdr 1 Bath 12 800 $850 $1.06 $750- $550-
1 Bdr 1 Bath 6 800 $1.00 1 Bdr 1 Bath 4 750 $0.80
$850 $650
Total/Avg. 12 800 $850 $1.06 Total/Avg. 6 800 $800 $1.00 $625-
2 Bdr 1 Bath 4 850 $0.81
$750
Total/Avg. 8 800 $644 $0.80
OCCUPANCY: 92% | YEAR BUILT: 1965 OCCUPANCY: 95% | YEAR BUILT: 1961 OCCUPANCY: 100% | YEAR BUILT: 1963
rentpropertyaddress1 rentpropertyaddress1 rentpropertyaddress1
26PROPERTY
1250 LITTLENAME
BAY AVE
RENT COMPARABLES
MARKETING TEAM
CASA PLAYA
1033 Little Bay Ave, Norfolk, VA, 23503
6
rentpropertyname1 rentpropertyname1 rentpropertyname1
Unit Type Units SF Rent Rent/SF
1 Bdr 1 Bath 4 700 $750 $1.07
4 Bdr 2 Bath 1 1,800 $1,500 $0.83
Total/Avg. 5 920 $900 $0.98
YEAR BUILT: 1969
rentpropertyaddress1 rentpropertyaddress1 rentpropertyaddress1
271250 LITTLE BAY AVE
FINANCIAL
ANALYSIS
281250 LITTLE BAY AVE
FINANCIAL ANALYSIS
RENT ROLL SUMMARY
291250 LITTLE BAY AVE
FINANCIAL ANALYSIS
OPERATING STATEMENT
301250 LITTLE BAY AVE
FINANCIAL ANALYSIS
NOTES
311250 LITTLE BAY AVE
FINANCIAL ANALYSIS
PRICING DETAIL
321250 LITTLE BAY AVE
ACQUISITION FINANCING
MARCUS & MILLICHAP CAPITAL CORPORATION WHY MMCC?
CAPABILITIES Optimum financing solutions to
enhance value
MMCC—our fully integrated, dedicated financing arm—is committed to
providing superior capital market expertise, precisely managed execution, and
unparalleled access to capital sources providing the most competitive rates and Our ability to enhance buyer
terms. pool by expanding finance
options
We leverage our prominent capital market relationships with commercial banks,
life insurance companies, CMBS, private and public debt/equity funds, Fannie
Mae, Freddie Mac and HUD to provide our clients with the greatest range of Our ability to enhance
financing options. seller control
• Through buyer
Our dedicated, knowledgeable experts understand the challenges of financing
qualification support
and work tirelessly to resolve all potential issues to the benefit of our clients.
• Our ability to manage buyers
finance expectations
• Ability to monitor and
manage buyer/lender progress,
insuring timely,
predictable closings
• By relying on a world class
Closed 1,651 National platform $5.1 billion total Access to more
set of debt/equity sources
debt and equity operating national capital sources
financings within the firm’s volume in 2016 than any other and presenting a tightly
in 2016 brokerage offices firm in the underwritten credit file
industry
331250 LITTLE BAY AVE
FINANCIAL ANALYSIS
GROWTH RATE PROJECTIONS
341250 LITTLE BAY AVE
FINANCIAL ANALYSIS
CASH FLOW
351250 LITTLE BAY AVE
MARKET
OVERVIEW
361250 LITTLE BAY AVE
MARKET OVERVIEW
Hampton Roads
OVERVIEW
Hampton Roads, also known as the Virginia Beach-Norfolk-Newport
News metropolitan area, is recognized for its miles of waterfronts and
beaches, stable and growing economy, military presence, harbors,
shipyards and coal piers. The metro is composed of James,
Gloucester, Mathews, York and Isle of Wright counties in Virginia, and
Gates and Currituck counties in North Carolina, as well as the cities of
Virginia Beach, Williamsburg, Chesapeake, Norfolk, Newport News,
Hampton, Poquoson, Portsmouth and Suffolk. Approximately 1.7 million
people reside in the metro, roughly 460,000 of whom are in Virginia
Beach, the market’s most populous city.
METRO HIGHLIGHTS
Low Unemployment
It has the second-largest concentration of military
personnel in the U.S. with eight military installations
in the market providing a large portion of jobs.
HOSPITALITY AND TOURISM
Visitors are drawn to Williamsburg and the multiple
beaches and resorts in the area that have activities for
everyone.
SKILLED LABOR POOL
Technical knowledge learned in the military helps to
provide a highly educated and skilled labor force.
3711250 LITTLE BAY AVE
MARKET OVERVIEW
ECONOMY
§ The local economy is best known for tourism and defense, but advanced manufacturing,
maritime and logistics, cybersecurity and biomedical technology are growing sectors.
§ Fortune 500 headquarters include Norfolk Southern, Dollar Tree and Huntington Ingalls
Industries. Other companies headquartered locally include Gold Key PHR, Amerigroup, Anthem
and Stihl.
§ The large military presence includes Naval Station Norfolk, Joint Expeditionary Base Little
Creek-Fort Story, Naval Air Station Oceana Dam Neck Annex, Joint Base Langley-Eustis Naval
Shipyard and Coast Guard Base-Portsmouth.
MAJOR AREA EMPLOYERS
Huntington Ingalls Industries Inc.
Sentara Healthcare
Naval Medical Center Portsmouth
Norfolk Naval Shipyard
Riverside Health System
The Colonial Williamsburg Foundation
Joint Expeditionary Base Little Creek-Ft. Story
GEICO General Insurance Co.
Naval Air Station Oceana-Dam Neck
* Forecast
Nasa Langley Research University
SHARE OF 2016 TOTAL EMPLOYMENT
7%
MANUFACTURING
14%
PROFESSIONAL AND
20%
GOVERNMENT
12%
LEISURE AND HOSPITALITY
5%
FINANCIAL ACTIVITIES
BUSINESS SERVICES
17%
TRADE, TRANSPORTATION
5%
CONSTRUCTION
+ 15%
EDUCATION AND
1%
INFORMATION
4%
OTHER SERVICES
AND UTILITIES HEALTH SERVICES
381250 LITTLE BAY AVE
MARKET OVERVIEW
DEMOGRAPHICS
§ The metro is projected to expand by 50,000 people through 2021, resulting in the
formation of 20,000 households during this period. SPORTS
§ Median home prices that are above the U.S. level contribute to a homeownership rate
of 62 percent, which is slightly below the national rate of 64 percent.
§ Nearly 29 percent of residents age 25 and older hold a bachelor’s degree; of those
residents, 11 percent also have earned a graduate or professional degree.
2016 Population by Age
6% 19% 9% 27% 25% 13%
0-4 YEARS 5-19 YEARS 20-24 YEARS 25-44 YEARS 45-64 YEARS 65+ YEARS
EDUCATION
2016 2016 2016 2016 MEDIAN
POPULATION: HOUSEHOLDS: MEDIAN AGE: HOUSEHOLD INCOME:
1.7M 654K 35.3 $58,900
Growth Growth U.S. Median: U.S. Median:
2016-2021*: 2016-2021*:
2.9% 3.6% 37.7 $57,200
QUALITY OF LIFE
Known for its beaches and water recreation, the region has much to offer by way of outdoor
activities and entertainment. Busch Gardens Williamsburg, Colonial Williamsburg, the USS
Wisconsin and the Virginia Aquarium are prominent attractions that draw tourist and locals ARTS & ENTERTAINMENT
alike. Cultural activities are available at the Virginia Museum of Contemporary Art, Virginia
Aquarium & Marine Science Center and Virginia Beach Amphitheater. Sports teams play at
the Virginia Beach Sportsplex, Harbor Park and Scope Arena, while the Kingsmille
Championship is held here as a part of the LPGA Tour. Universities include the College of
William & Mary, Old Dominion University, Virginia Wesleyan College, Hampton University
and Norfolk State University.
* Forecast
Sources: Marcus & Millichap Research Services; BLS; Bureau of Economic Analysis; Experian; Fortune; Moody’s
Analytics; U.S. Census Bureau
391250 LITTLE BAY AVE
MARKET OVERVIEW
2018 PRICING & VALUATION TRENDS
Yield Range Offers Compelling Options for Investors; Most Metros Demonstrate Strong Appreciation Rates
* 2007-2017 Average annualized appreciations in price per unit
Sources: Marcus & Millichap Research Services; CoStar Group, Inc.; Real Capital Analytics
401250 LITTLE BAY AVE
MARKET OVERVIEW
AVERAGE PRICE PER UNIT RANGE**
(Alphabetical order within each segment)
** Price per unit for apartment properties $1 million and greater
Sources: Marcus & Millichap Research Services; CoStar Group, Inc.; Real Capital Analytics
411250 LITTLE BAY AVE
MARKET OVERVIEW
2018 NATIONAL MULTIFAMILY INDEX
U.S. Multifamily Index
Coastal Markets Top National Multifamily Index;
Several Unique Markets Climb Ranks
Trading places. Seattle-Tacoma leads this year’s Index after moving up one notch, driven by robust
employment in the tech sector and soaring home prices that keep rental demand ahead of elevated deliveries.
The metro outperforms last year’s leader, Los Angeles (#2), which slid one spot. Midwest metro Minneapolis-
St. Paul (#3) rose one notch as its diverse economy generates steady job growth and robust rental demand,
maintaining one of the lowest vacancy rates among larger U.S. markets. San Diego (#4) jumped five spots as
deliveries slump while household formation proliferates, resulting in sizable rent growth. Portland (#5) inches up
a slot to round out the top five markets. East Coast markets fill the next two positions: Boston (#6) moves down
three slots as rent growth slows while vacancy ticks up, and New York City (#7) rises three places as stout
renter demand holds vacancy tight.
Index reshuffles with big moves. Sacramento (#8) posted the largest increase in the Index, vaulting 12
positions to lead a string of California markets that fill the next five slots. Robust rent growth and low vacancy
pushed the market up in the ranking. Other double-digit movers were Orlando (#17) and Detroit (#28), which
each leaped 10 places. Employment gains and in-migration are generating the need for apartments in Orlando,
maintaining ample rent advancement. In Detroit, steady employment and a slow construction pipeline keep
demand above supply, allowing rents to flourish. The most significant declines were registered in Austin,
Nashville and Baltimore. Austin (#31) tumbled nine spaces as elevated deliveries overwhelm demand slowing
rent growth. Nashville (#35) and Baltimore (#45) each moved down six steps as demand has yet to absorb
multiple years of elevated inventory gains. Although Kansas City (#46) retains the bottom slot, there is greater
change in the lower half of the NMI as more Midwest markets rise.
421250 LITTLE BAY AVE
MARKET OVERVIEW
U.S. ECONOMY
Growth Cycle Invigorated by Confidence;
Tax Laws Could Transform Housing
Tight labor market restrains hiring as confidence surges. The steady economic tailwind benefiting
apartment performance is poised to carry through 2018 as a range of positive factors align to support growth.
Consumer confidence recently reached its highest point since 2000 while small-business sentiment attained a
31-year record level, both reinforcing indications that consumption and hiring will be strong. The total number of
job openings has hovered in the low-6 million range through much of 2017, illustrating that companies have
considerable staffing needs, but with unemployment entrenched near 4 percent, companies will continue to face
challenges in filling available positions. These tight labor conditions should place additional upward pressure on
wages, potentially boosting inflationary pressure in the coming year. The strong employment market, rising
wages and elevated confidence levels could unlock accelerated household formation, particularly by young
adults. Last year, the number of young adults living with their parents ticked lower for the first time since the
recession, signaling that these late bloomers may finally be considering a more independent lifestyle.
Housing preferences may change under new tax laws. The new tax laws could play a significant role in
shaping both the economy and housing demand in 2018. Reduced taxes will be a windfall for corporations,
potentially sparking invigorated investment into infrastructure. The rise in CEO confidence over the last year
already boosted companies’ investment by more than 6 percent, accelerating economic growth. However, the
tax incentive-based stimulus will likely offer only a modest bump to GDP in 2018 because corporate investment
comprises just 12 percent of economic output. One factor that could weigh on economic expansion under the
new tax laws is the housing sector, which added just 3 percent to the economy last year, about two-thirds of
normal levels. The increased standard deduction and restrictions on housing-related deductions will reduce
some of the economic incentive to purchase a home, further sapping the strength of the housing sector.
Nonetheless, the increased standard deduction could benefit apartment investors, encouraging renters to stay
in apartments longer and reducing the loss of tenants to homeownership.
* Forecast
** Through 3Q
431250 LITTLE BAY AVE
MARKET OVERVIEW
U.S. ECONOMY
2018 National Economic Outlook
§ Labor force shortage weighs on job creation. The economy has added jobs every month for more than
seven years, the longest continuous period of job creation on record. The trend will continue in 2018, but the
pace of job additions will moderate, falling below 2 million for the year as the low unemployment rate
restricts the pool of prospective employees.
§ Wage growth poised to accelerate. Average wage growth has been creeping higher in the post-recession
era, with compensation gains in construction, professional services and the hospitality sectors outpacing the
broader trend. The tight labor market will continue to pressure wage growth, potentially sparking inflation in
the process.
§ Tax laws could invigorate apartment demand. Since 2011 household formations have outpaced total
housing construction, a key ingredient in the tightening of apartment vacancies. The new tax laws could
cause homebuilders to reduce construction while shifting a portion of the housing demand from
homeownership to rentals, and a rental housing shortage could ensue. If this behavior change occurs in
conjunction with additional young adults moving out of their own, apartment demand could dramatically
outpace completions.
* Forecast
** Through 3Q
441250 LITTLE BAY AVE
MARKET OVERVIEW
U.S. APARTMENT OVERVIEW
Demand Outlook Sturdy as Pace
Of Construction Begins to Retreat
Investors wary of apartment construction. The wave of apartment completions entering the market in recent
years has permeated the investor psyche, raising concerns of overdevelopment and escalating vacancy rates,
but numerous demand drivers have held this risk in check. Steady job creation, positive demographics, above-
trend household formation and elevated single-family home prices have converged to counterbalance the
addition of 1.37 million apartments over the last five years, at least on a macro level. Though a small number of
markets have faced oversupply risk, the affected areas tend to be concentrated pockets, with upper-echelon
units facing the greatest competition. For traditional workforce housing, Class B and C apartments, the risks
stemming from overdevelopment have been nominal, and in most metros, even the Class A tranche has
demonstrated sturdy performance. In the coming year, rising development costs, tighter construction financing
and mounting caution levels will curb the pace of additions from the 380,000 units delivered in 2017 to
approximately 335,000 apartments. However, the list of markets facing risk from new completions will stretch
beyond the dozen metros that builders have concentrated on thus far. This will heighten competition, requiring
investors to maintain an increasingly tactical perspective integrating vigilant market scrutiny and strong property
management.
Competitive nuances increasingly granular. Although the pace of apartment completions will moderate in
2018, additions will still likely outpace absorption. This imbalance will most substantively affect areas where
development has been focused, such as the urban core where vacancy rates have risen above suburban rates
for the first time on record. Nationally, Class A vacancy rates have advanced to 6.3 percent in 2017 and will
continue their climb to the 6.8 percent range over the next year. Vacancy rates for Class B and C assets will
rise less significantly in 2018, pushing to 5.0 percent and 4.7 percent, respectively. Although vacancy levels are
rising, three-fourths of the major metros have rates below their 15-year average. Still, the magnitude of new
completions coming to market and the high asking rents these new units command will spark increased
competition for tenants, generating a more liberal use of concessions in 2018 as landlords attempt to entice
move-up tenants.
* Forecast
451250 LITTLE BAY AVE
MARKET OVERVIEW
U.S. APARTMENT OVERVIEW
2018 National Apartment Outlook
§ Rent growth tapers as concession use edges higher. Average rent growth will taper to 3.1 percent in
2018 as concessions become more prevalent, particularly in Class A properties. Rent gains in the Class C
space, which were particularly strong last year, will face greater challenges as affordability restrains
demand. Although job growth has been steady for seven years, wage growth has been relatively weak,
particularly for low-skilled labor.
§ Congress may nudge apartment demand. The new tax laws could reinforce apartment living as the larger
standard deduction reduces the economic incentive of homeownership. Previous tax rules encouraged
homeownership with itemized deductions for property taxes and mortgage interest that often surpassed the
standard deduction. These advantages have largely been eliminated, particularly for first-time buyers.
§ Are millennials finally moving out on their own? The 80 million-strong millennial age cohort, now
pushing into their late 20s, may finally be showing independence. Since the recession, the percentage of
young adults living with their parents increased dramatically, but last year that trend reversed. Should the
share of young adults living with family recede toward the long-term average, an additional 3 million young
adults would need housing.
** Estimate
461250 LITTLE BAY AVE
MARKET OVERVIEW
U.S. CAPITAL MARKETS
Fed Normalization Portends Rising Interest Rates;
Capital Availability for Apartments Elevated
Fed cautiously pursues tighter policies. Investors have largely adapted to the modestly higher interest rate
environment, and most anticipate additional increases in 2018 as the Federal Reserve normalizes both its
policies and its balance sheet. The Fed is widely expected to continue raising its overnight rate through 2018 as
it tries to restrain potential inflation risk and create some dry powder to combat future recessions. The Fed will,
however, be cautious about pushing short-term rates into the long-term rates, which would create an inverted
yield curve. The spread between the two-year Treasury rate and the 10-year Treasury rate has tightened
significantly, and if the Fed is too aggressive in its policies, the short-term interest rates could climb above long-
term rates. This inversion is a commonly watched leading indicator of an impending recession. The new
chairman of the Fed, Jerome Powell, will likely make few changes to the trajectory of Fed policies, and he is
widely expected to continue the reduction of the Fed balance sheet. Powell may consider accelerating the
balance sheet reduction to ensure long-term rates move higher. That said, Powell is widely perceived to be a
dovish leader who will advance rates cautiously.
Readily available debt backed by sound underwriting. Debt availability for apartment assets remains
abundant, with a wide range of lenders catering to the sector. Apartment construction financing has
experienced some tightening, a generally favorable trend for most investors. Fannie Mae and Freddie Mac will
continue to serve a significant portion of the multifamily financing, with local and regional banks targeting
smaller transactions and insurance companies handling larger deals with low-leverage needs. In general,
lenders have been loosening credit standards on commercial real estate lending, but underwriting standards
remain conservative with loan-to-value ratios for apartments in the relatively conservative 66 percent range. An
important consideration going forward, however, will be investors’ appetite for acquisitions as the yield spread
between interest rates and cap rates tightens.
* Through December 12
** Through December 6
471250 LITTLE BAY AVE
MARKET OVERVIEW
U.S. CAPITAL MARKETS
2018 Capital Markets Outlook
§ Yield spread tightens amid rising interest rates. Average apartment cap rates have remained relatively
stable in the low-5 percent range for the last 18 months, with a yield spread above the 10-year Treasury of
about 280 basis points. Many investors believe cap rates will rise in tandem with interest rates, but this has
not been the case historically. Given the strong performance of the apartment sector, it’s more likely the
yield spread will compress, reducing the positive leverage investors have enjoyed in the post-recession era.
§ Inflation restrained but could emerge. Inflation has been nominal throughout the current growth cycle, but
pressure could mount as the tight labor market spurs rising wages. Elevated wages and accelerating
household wealth could boost consumption, creating additional economic growth and inflation. The Fed has
become increasingly proactive in its efforts to head off inflationary pressure, but the stimulative effects of tax
cuts could overpower the Fed’s efforts.
§ Policies likely to strengthen dollar and could pose new risks. One wild card that could create an
economic disruption is the strengthening dollar. The economic stimulus created by tax cuts together with
tightening Fed monetary policy place upward pressure on the value of the dollar relative to foreign
currencies. This could restrain foreign investment in U.S. commercial real estate, but it could also weaken
exports and make it more difficult for other countries to pay their dollar-denominated debt, which in turn
weakens global economic growth.
* Through December 12
Estimate
481250 LITTLE BAY AVE
MARKET OVERVIEW
U.S. INVESTMENT OUTLOOK
Apartment Investors Recalibrate Strategies;
Broaden Criteria to Capture Upside Opportunities
Appreciation flattens as buyers recalibrate expectations. The maturing apartment investment climate has
continued its migration from aggressive growth to a more stable but still positive trend. Investors have reaped
strong returns in the post-recession era through significant gains in fundamentals and pricing, but the growth
trajectory has flattened as the market has normalized. The pace of apartment rental income growth has moved
back toward its mid-3 percent long-term average and investor caution has flattened cap rates, moderating
appreciation. With much of the gains created by the post-recession recovery absorbed and most of the value-
add opportunity already extracted, it has been increasingly difficult for investors to find opportunities with
substantive upside potential. At the same time, apartment construction has finally brought macro-level housing
supply and demand back toward equilibrium, restraining upside potential in markets with sizable deliveries.
These challenges have been compounded by a widened bid/ask gap, with many would-be apartment sellers
retaining a highly optimistic perception of their asset’s value. It will take time for investor expectations to realign,
but buyers and sellers are discovering a flattening appreciation trajectory. Still, a range of opportunities remain.
Investors broaden criteria as they search for yield upside. Investors are recalibrating strategies, broadening
their search and sharpening their efforts to find investment options with upside potential. They have expanded
criteria to include a variety of Class B and Class C assets, outer-ring suburban locations, and properties in
secondary or tertiary markets. The yield premium offered by these types of assets has drawn an increasing
amount of multifamily capital. In the last year, nearly half of the dollar volume invested in apartment properties
over $1 million went to secondary and tertiary markets, up from 42 percent of the capital in 2010. This influx of
activity has caused cap rates in tertiary markets to fall from the high-8 percent range in 2010 to their current
average near 6 percent. During the same period, national cap rates of Class B/C apartment properties have
fallen by 200 basis points to the mid-5 percent range. Considering the low cost of capital, these yields have
remained attractive to investors with longer-term hold plans.
* Through 3Q
** Trailing 12 months through 3Q
491250 LITTLE BAY AVE
MARKET OVERVIEW
U.S. INVESTMENT OUTLOOK
2018 Investment Outlook
§ New tax laws could shift investor behavior. Additional clarity on taxes should alleviate some of the
uncertainty that held back investor activity over the last year while helping to mitigate the expectation gap
between buyers and sellers. Reduced tax rates on pass-through entities could spark some repositioning
efforts, bringing additional assets to market and supporting market liquidity.
§ Tighter monetary policy could narrow yield spreads. Prospects of a rising interest rate environment
could weigh on buyer activity as the yield spread tightens. Cap rates have held relatively stable over the last
two years, and the sturdy outlook for apartment fundamentals is unlikely to change substantively in the
coming year. As a result, investors’ pursuit of yield will likely push activity toward assets and markets that
have traditionally offered higher cap rates.
§ Transaction activity retreats from peak levels. Apartment sales continued to migrate toward more normal
levels last year as investors’ search for upside and value-add opportunities delivered fewer candidates.
Markets with a limited construction pipeline but with respectable employment and household formation
growth will see accelerated activity, while markets facing an influx of development could see moderating
investor interest.
* Through 3Q
** Trailing 12 months through 3Q
501250 LITTLE BAY AVE
MARKET OVERVIEW
REVENUE TRENDS
Five-Year Apartment Income Growth by Metro FIVE-YEAR TREND:
Percent Change 2013-2018* Outperforming Through
Development Cycle
2013-2018*
§ U.S. creates 11.8 million jobs over five years
§ Developers add 1.5 million new apartments
§ Absorption totals 1.4 million apartments
§ U.S. vacancy rate to match 2013 at 5.0 percent
§ U.S. average rent rises 23.2 percent
* Forecast
511250 LITTLE BAY AVE
MARKET OVERVIEW
2018 NATIONAL INVENTORY TREND
Five-Year Development Wave Transforms Rental Landscape
Inventory Growth 2013-2018
Inventory Change by Market
2013 to 2018
Sources: Marcus & Millichap Research Services; MPF Research
521250 LITTLE BAY AVE
MARKET OVERVIEW
2018 NATIONAL INVENTORY TREND
Top 10 Markets by Inventory Change
Largest Growth Five-Year Inventory Change Five-Year Rent Growth
Austin 23.6% 22%
Charlotte 22.9% 30%
Nashville 21.7% 31%
Salt Lake City 20.9% 31%
Raleigh 19.5% 27%
San Antonio 18.7% 20%
Denver 17.9% 41%
Seattle-Tacoma 15.9% 41%
Orlando 15.3% 35%
Dallas/Fort Worth 15.3% 30%
U.S. 9.8% 23%
Smallest Growth Five-Year Inventory Change Five-Year Rent Growth
Cincinnati 6.6% 24%
Chicago 6.2% 21%
Oakland 5.8% 40%
Riverside-San Bernardino 5.6% 36%
St. Louis 5.5% 14%
Los Angeles 5.4% 31%
New York City 4.6% 15%
Cleveland 4.6% 15%
Sacramento 3.8% 48%
Detroit 2.9% 25%
Sources: Marcus & Millichap Research Services; MPF Research
53PROPERTY
1250 LITTLENAME
BAY AVE
DEMOGRAPHICS
MARKETING TEAM
Created on March 2018
POPULATION 1 Miles 3 Miles 5 Miles HOUSEHOLDS BY INCOME 1 Miles 3 Miles 5 Miles
§ 2022 Projection § 2017 Estimate
Total Population 2,818 27,844 97,323 $200,000 or More 0.96% 1.35% 3.01%
§ 2017 Estimate $150,000 - $199,000 4.32% 2.61% 3.32%
Total Population 2,991 27,908 98,201 $100,000 - $149,000 8.25% 8.20% 9.81%
§ 2010 Census $75,000 - $99,999 10.94% 11.78% 11.14%
Total Population 3,008 27,650 96,827 $50,000 - $74,999 21.79% 22.86% 21.36%
§ 2000 Census $35,000 - $49,999 21.04% 18.83% 16.29%
Total Population 4,563 42,390 111,125 $25,000 - $34,999 9.98% 12.82% 11.67%
§ Daytime Population $15,000 - $24,999 11.52% 11.04% 10.96%
2017 Estimate 3,727 61,519 122,537 Under $15,000 11.21% 10.52% 12.43%
HOUSEHOLDS 1 Miles 3 Miles 5 Miles Average Household Income $59,587 $59,197 $66,835
§ 2022 Projection Median Household Income $44,569 $46,727 $48,742
Total Households 1,386 10,672 38,817 Per Capita Income $31,063 $24,084 $27,454
§ 2017 Estimate POPULATION PROFILE 1 Miles 3 Miles 5 Miles
Total Households 1,480 10,631 38,885 § Population By Age
Average (Mean) Household Size 1.99 2.32 2.37 2017 Estimate Total Population 2,991 27,908 98,201
§ 2010 Census Under 20 18.09% 24.97% 25.15%
Total Households 1,496 10,583 38,586 20 to 34 Years 33.88% 38.76% 31.47%
§ 2000 Census 35 to 39 Years 6.39% 6.18% 6.11%
Total Households 1,959 11,049 38,305 40 to 49 Years 11.25% 9.15% 10.01%
Growth 2015-2020 -6.35% 0.39% -0.17% 50 to 64 Years 21.91% 14.32% 16.87%
HOUSING UNITS 1 Miles 3 Miles 5 Miles Age 65+ 8.48% 6.62% 10.39%
§ Occupied Units Median Age 33.76 27.75 30.75
2022 Projection 1,386 10,672 38,817 § Population 25+ by Education Level
2017 Estimate 1,876 11,882 42,817 2017 Estimate Population Age 25+ 2,132 16,152 61,193
Owner Occupied 364 3,449 16,477 Elementary (0-8) 0.99% 1.09% 1.83%
Renter Occupied 1,116 7,181 22,408 Some High School (9-11) 10.30% 6.73% 8.00%
Vacant 396 1,251 3,931 High School Graduate (12) 20.09% 30.21% 28.39%
§ Persons In Units Some College (13-15) 33.07% 29.61% 26.95%
2017 Estimate Total Occupied Units 1,480 10,631 38,885 Associate Degree Only 13.89% 10.33% 8.63%
1 Person Units 40.27% 32.75% 31.21% Bachelors Degree Only 12.09% 14.62% 15.87%
2 Person Units 35.81% 32.50% 32.72% Graduate Degree 9.44% 6.67% 9.37%
3 Person Units 13.85% 16.56% 16.77% § Population by Gender
4 Person Units 6.76% 11.10% 11.34% 2017 Estimate Total Population 2,991 27,908 98,201
5 Person Units 2.36% 4.68% 5.10% Male Population 55.16% 54.33% 50.51%
6+ Person Units 0.88% 2.42% 2.86% Female Population 44.84% 45.67% 49.49%
Source: © 2017 Experian
54PROPERTY
1250 LITTLENAME
BAY AVE
DEMOGRAPHICS
MARKETING TEAM
Population Race and Ethnicity
In 2017, the population in your selected geography is 2,991. The The current year racial makeup of your selected area is as follows:
population has changed by -34.45% since 2000. It is estimated that 71.21% White, 18.87% Black, 0.10% Native American and 2.01%
the population in your area will be 2,818.00 five years from now, which Asian/Pacific Islander. Compare these to US averages which are:
represents a change of -5.78% from the current year. The current 70.42% White, 12.85% Black, 0.19% Native American and 5.53%
population is 55.16% male and 44.84% female. The median age of the Asian/Pacific Islander. People of Hispanic origin are counted
population in your area is 33.76, compare this to the US average independently of race.
which is 37.83. The population density in your area is 951.26 people
per square mile. People of Hispanic origin make up 9.29% of the current year
population in your selected area. Compare this to the US average of
17.88%.
Households Housing
There are currently 1,480 households in your selected geography. The The median housing value in your area was $305,881 in 2017,
number of households has changed by -24.45% since 2000. It is compare this to the US average of $193,953. In 2000, there were 487
estimated that the number of households in your area will be 1,386 owner occupied housing units in your area and there were 1,472
five years from now, which represents a change of -6.35% from the renter occupied housing units in your area. The median rent at the
current year. The average household size in your area is 1.99 time was $411.
persons.
Income Employment
In 2017, the median household income for your selected geography is In 2017, there are 321 employees in your selected area, this is also
$44,569, compare this to the US average which is currently $56,286. known as the daytime population. The 2000 Census revealed that
The median household income for your area has changed by 35.39% 60.36% of employees are employed in white-collar occupations in this
since 2000. It is estimated that the median household income in your geography, and 40.19% are employed in blue-collar occupations. In
area will be $61,008 five years from now, which represents a change 2017, unemployment in this area is 3.40%. In 2000, the average time
of 36.88% from the current year. traveled to work was 24.00 minutes.
The current year per capita income in your area is $31,063, compare
this to the US average, which is $30,982. The current year average
household income in your area is $59,587, compare this to the US
average which is $81,217.
Source: © 2017 Experian
55You can also read