FINCANTIERI Investor Presentation
←
→
Page content transcription
If your browser does not render page correctly, please read the page content below
FINCANTIERI
Investor Presentation

                        Trieste, February 2017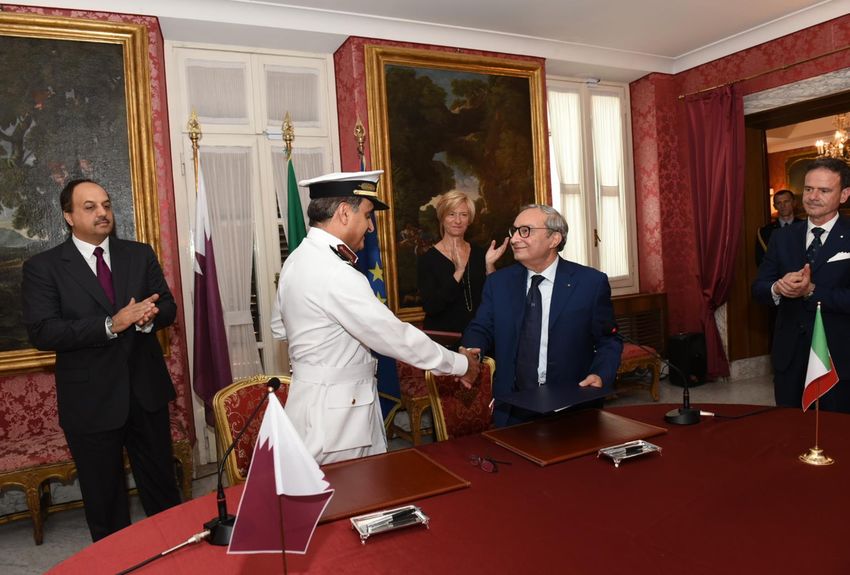
Safe Harbor Statement

This Presentation contains certain forward-looking statements. Forward-looking statements concern future circumstances and results and other
statements that are not historical facts, sometimes identified by the words "believes," "expects," "predicts," "intends," "projects," "plans," "estimates,"
"aims," "foresees," "anticipates," "targets," and similar expressions. The forward-looking statements contained in this Presentation, including
assumptions, opinions and views of the Company or cited from third party sources, are solely opinions and forecasts reflecting current views with
respect to future events and plans, estimates, projections and expectations which are uncertain and subject to risks. Market data used in this
Presentation not attributed to a specific source are estimates of the Company and have not been independently verified. These statements are based
on certain assumptions that, although reasonable at this time, may prove to be erroneous. By their nature, forward-looking statements involve a
number of risks, uncertainties and assumptions that could cause actual results or events to differ materially from those expressed or implied by the
forward-looking statements. If certain risks and uncertainties materialize, or if certain underlying assumptions prove incorrect, Fincantieri may not be
able to achieve its financial targets and strategic objectives. A multitude of factors which are in some cases beyond the Company’s control can cause
actual events to differ significantly from any anticipated development. Forward-looking statements contained in this Presentation regarding past trends
or activities should not be taken as a representation that such trends or activities will continue in the future. No one undertakes any obligation to
update or revise any forward-looking statements, whether as a result of new information, future events or otherwise. Market data used in this
Presentation not attributed to a specific source are estimates of the Company and have not been independently verified. Forward-looking statements
speak only as of the date of this Presentation and are subject to change without notice. No representations or warranties, express or implied, are
given as to the achievement or reasonableness of, and no reliance should be placed on, any forward-looking statements, including (but not limited to)
any projections, estimates, forecasts or targets contained herein.
Fincantieri does not undertake to provide any additional information or to remedy any omissions in or from this Presentation. Fincantieri does not
intend, and does not assume any obligation, to update industry information or forward-looking statements set forth in this Presentation. This
presentation does not constitute a recommendation regarding the securities of the Company.

Declaration of the Manager responsible for preparing financial reports
The executive in charge of preparing the corporate accounting documents at Fincantieri, Carlo Gainelli, declares that the accounting information
contained herein correspond to document results, books and accounting records.

                                                                                                                                                          2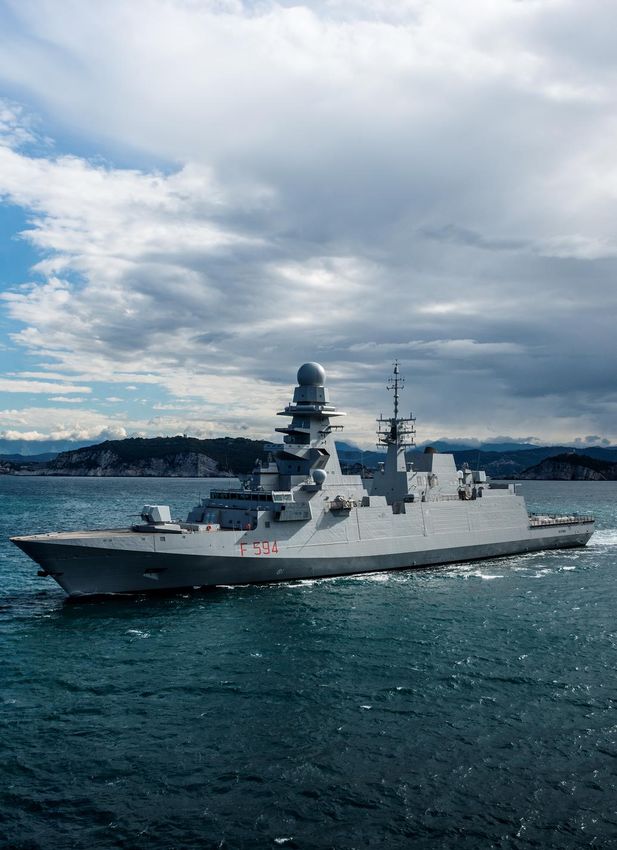
Table of Contents
Section 1   Fincantieri at a Glance

Section 2   Historical Financial Performance

Section 3   Business Overview and Market Dynamics

                                                                        Carnival Vista
                                                                Carnival Cruise Lines
                                                    “ECO Notation” by Lloyd‘s Register
                                                         for exceeding environmental
                                                                            standards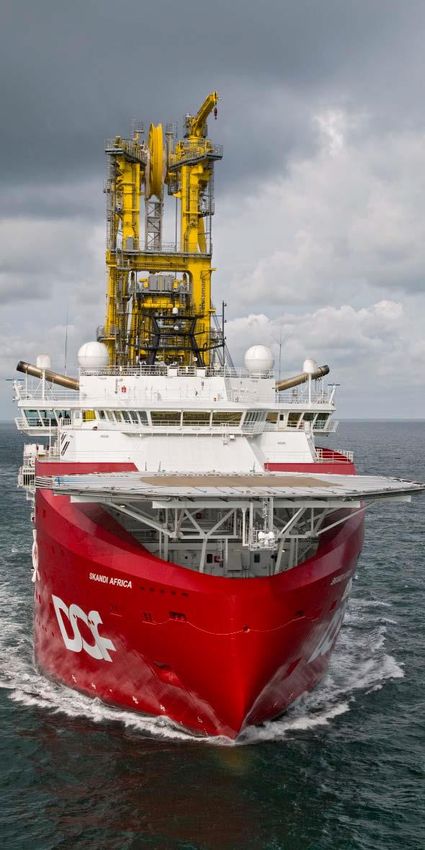
Section 1

Fincantieri at a Glance

                                            FREMM “Alpino”
                                                  Italian Navy
                          Best in class in terms of endurance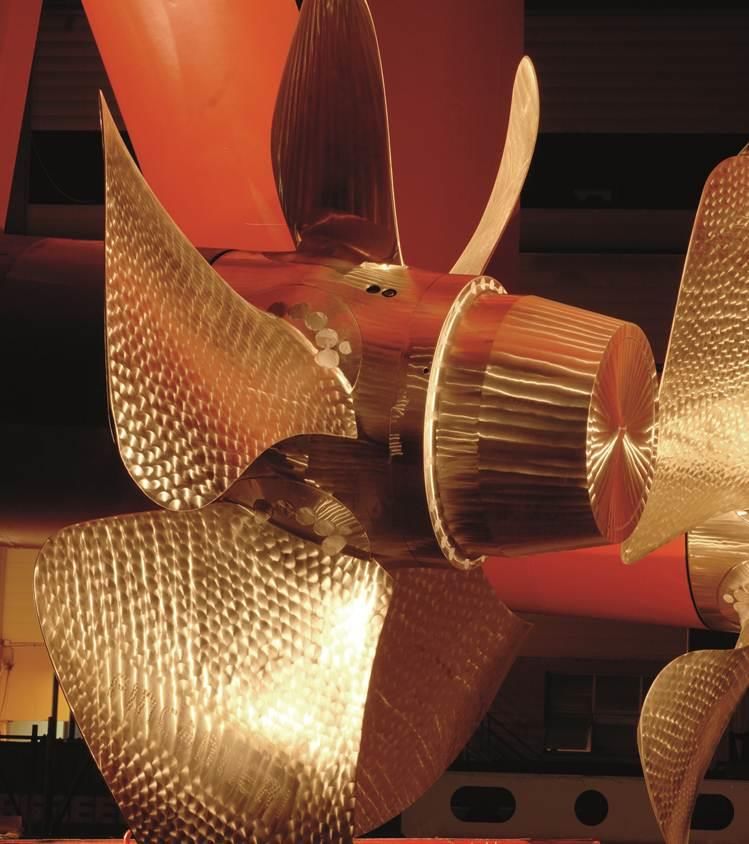
Fincantieri at a glance

                                                                                     #1 Western designer & shipbuilder(1)
                                                                                 with 230 years of history & >7,000 ships built

                                                                                                                                    Norway
                                                                                                                                     • 5 shipyards                                                           20 shipyards
     € 4,183 mln revenues
                                                                                                                                                                                                             4 continents
                                                                                                                                                         Romania
                                                                                                                                                             • 2 shipyards
    ~ € 21.8 bln total backlog(2,3)
                                                                                                                                                                                                             ~ 20,000 employees
       • € 19.0 bln backlog
                                                                                                                                                                                                             ~ 80,000 subcontractors
       • € 2.8 bln soft backlog                                                  USA
                                                                                 • 3 shipyards                                                                  UAE                           Vietnam
                                                                                                                                                                • 1 Joint Venture             • 1 shipyard
     Revenues by geography                                                                                                                                                                                   Employees by location
                                            Italy
                                            15%                                  Brazil
                                                                                                                                                                                                                                 Italy
                                                                                 • 1 shipyard                                                                         Italy                                                      39%
                            €4.2 bln                                                                                                                                                                                   ~20,000
                                                                                                                                                                      • 8 shipyards
                                                                                                                                                                                                                RoW
            RoW
                                                                                                                                                                                                                61%
            85%

Note: all figures reported at December 31, 2015, except for backlog and soft backlog which are referred to 9M 2016 (at September 30, 2016)                             Corporate/BU headquarters
(1) By revenues, excluding naval contractors in the captive military segment. Based on Fincantieri estimates of shipbuilders’ revenues in 2015
(2) At September 30, 2016                                                                                                                                              Shipyard      Joint Venture
(3) Sum of backlog and soft backlog; soft backlog represents the value of existing contract options and letters of intent as well as contracts in advanced             Operating subsidiary
    negotiation, none of which yet reflected in the order backlog                                                                                                      Representative / Sales office

                                                                                                                                                                                                                                         5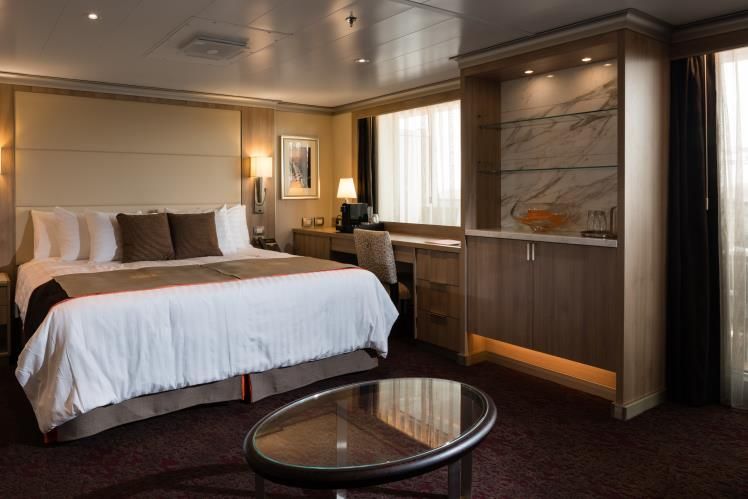
Key historical events
                                                                                                                                                                        New growth cycle
 Revenues                                                                                            Optimization of operations
 € bln                                                                                                    & globalization
                                                                                                                                                   IPO and
                                                                                                                                                   Business
      4.2                                     Creation of a solid                                                                                    Plan
                                              business platform                                                                                               Revenues & margins
                                                                                         Financial                                                            improvement and de-risking
   + 92%                                                                                   crisis                                                             of operations based on:
(2002-2015)
                                                                                                                                                              • All time-high backlog and
                        New                                                                                                                                     soft backlog
                     management                                                                Market
                        team                                                                   environment               Strategic actions                    • Synergies across the
      2.2                                                                                                                                                       group
                                    Market                                                      • Global                 • Organic:
                                                                                                  reduction of                                                • De-risking of backlog
                                    environment               Strategic actions                                            −Agreement with
              • Domestic                                                                          new orders                                                  • Price improvements in
                                    • Commodity               • Organic:                                                    Unions for
                                                                                                                                                                cruise
                                                                −Expansion of client base • Strong decline
                player with                                                                                                 optimization of
                1 main                prices increase
                                                                                            of market                       Italian capacity                  • Higher contribution of
                client per          • € / US$ rate              −3 new BUs (Mega-Yachts, prices
                                                                                                                                                                naval
                business              depreciation               Repair & Conversion,                                      −2 new BUs (Oil &
                (Carnival in                                                              • Shutdown/                                                         • Improved & more flexible
                                                                 Marine Systems)            reorganization                  Gas, After Sales)
                cruise &            • End of state aids       • M&A:                                                                                            cost base
                Italian Navy                                                                of several                   • M&A:
                in naval)           • Italian Navy              −Acquisition of Manitowoc   yards                                                             • Insourcing of high value
                                                                                            worldwide                      −Acquisition of VARD
                                      orders reduction           Marine in USA (naval)                                                                          added activities
                                                                                                                            (offshore vessels)
                                                                −JV in UAE
                                                                                                                           −JV in automation
              Before            2002                                                     2008 / 2009                                                  2014 / 2015                               2020
                  "Amerigo Vespucci” (1931)   “Crown Princess” (1990)    “U212” (2003)       “Emerald Princess” (2007)   “USS Fort Worth” (2010)      “Serene” (2011)        “Skandi Hugen” (2013)

 Source: Company information

                                                                                                                                                                                                     6
Business units, products and positioning
                                End markets                     Main products                                          Positioning                                                               Revenues 2015(4) Backlog(5)
                                   Cruise                         • All cruise ships                                     • #1 worldwide
                                                                    (from contemporary to luxury)                          (~50% market
                                                                                                                           share(1))                                                             € 1,649 mln
                                                                                                                                                                                                 (39% on total)

                                    Naval                        • All surface vessels (also stealth)                    • Leader:
                                                                 • Support & Special vessels                               − #1 in Italy(2)
                                                                                                                                                                       € 1,056 mln                                 € 17,054 mln
   Shipbuilding                                                  • Submarines                                              − Key supplier for US Navy & Coast
                                                                                                                             Guard  (3)                                (25% on total)                              (61 ships)
                                                                                                                           − Key supplier for Qatar Emiri Naval Forces

                                     Other                       • High tech ferries                                     • Leading player:
                                                                 • Large mega-yachts                                       − High tech ferries
                                                                                                                                                                                                 € 142 mln
                                                                 • Ship repair & conversion                                − Large mega-yachts
                                                                                                                                                                                                 (3% on total)
                                                                   services                                                − Repair & conversion

                                                                 • OSV                        • Offshore wind            • Leading player in
                                                                 • Drilling                   • OPV                        high-end OSVs
                                                                                                                                                                                                 € 1,199 mln       € 1,501 mln
       Offshore                                                    units                      • Expedition
                                                                 • Fisheries/                   cruise                                                                                           (28% on total)    (45 ships)
                                                                   aquaculture                • Special vessels

                                                                 • Marine systems, components &                          • Leading player worldwide
     Equipment                                                     turnkey solutions
                                                                 • After sales services                                                                                                          € 226 mln
     Systems &                                                                                                                                                                                                     € 908 mln
                                                                                                                                                                                                 (5% on total)
      Services

(1) By oceangoing cruise ships > 10,000 gross tons ordered in the 2004 – 2015 period. Source: Fincantieri analysis   (4) Breakdown calculated based on revenues gross of consolidation effects
    based on IHS Lloyd’s Fairplay – Shippax data (2015) and Company press releases                                   (5) At September 30, 2016
(2) For all the large ships and excluding minesweepers and small ships below 45 m in length (2015)
(3) For medium size ships, e.g. patrol vessels and corvettes

                                                                                                                                                                                                                                 7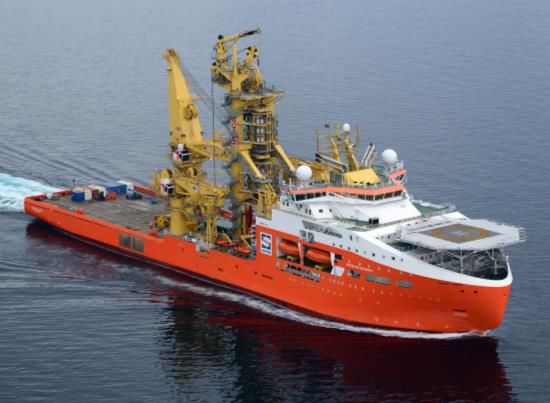
Track record, clients and technological leadership
Track record Clients Technological leadership
Cruise (3)
Ship deliveries • Carnival Vista: “ECO Notation” by Lloyd‘s
• Twofold Register for exceeding environmental standards
• 1990 – 2001 23 • Royal Princess: 1st cruise ship fully compliant
increase
• 2002 – 2015 47 with new regulations
in activity • Costa Luminosa & Costa Pacifica: Guinness
World Record for joint-christening of 2 ships
Shipbuilding
Naval Italian Navy United Arab
Ship deliveries Emirates • LCS Freedom: world’s fastest steel frigate
and Coast
• Steady, Navy
• 1990 – 2001 51(1) Guard • Aircraft Carrier Cavour: world’s most powerful
low risk Qatar Emiri non-nuclear propulsion system
US Navy
• 2002 – 2015 50(1) Naval Forces
• More than 20 prototypes developed over the
business
Algerian Indian last fifteen years
Navy Navy
Ship deliveries • Normand Maximus: largest offshore vessel
• Acquired ever built in Norway
• 1990 – 2001 72(2)
Offshore VARD in • Skandi Africa: “Ship of the Year 2015”(4)
• 2002 – 2015 279(2) • AMC Connector: world’s largest cable layer(5)
2013
• Far Samson: most powerful offshore vessel(6)
• Innovative and technologically advanced products
• Strong revenue Italian Navy United Arab in terms of performances, lifecycle cost
Equipment • Start-up and Coast Emirates
Guard Navy reduction and environmental safety
Systems & growth to € 226
in 2005 • Full product lifecycle management with unique
Services Qatar Emiri
mln in 2015 US Navy Naval Forces capacity to support vessels’ maintenance, repair
and overhaul all over the world
(1) Includes other products delivered by Naval business unit. Includes US subsidiaries pre Fincantieri acquisition, excluding (4) Award instituted by the major Nordic shipping magazine Skipsrevyen
174 RB-M delivered since 2002, of which 28 in 2014 and 3 in 2015 (5) In terms of loading capacity (2011)
(2) Includes other products delivered by Offshore business unit. Includes VARD and predecessor companies (6) In terms of bollard pull at the date of construction (423 tons)
(3) Parent company of several brands: Carnival Cruise Lines, Costa Crociere, Cunard, Holland America Line, P&O Cruises,
Princess Cruise Lines and Seabourn Cruise Lines
8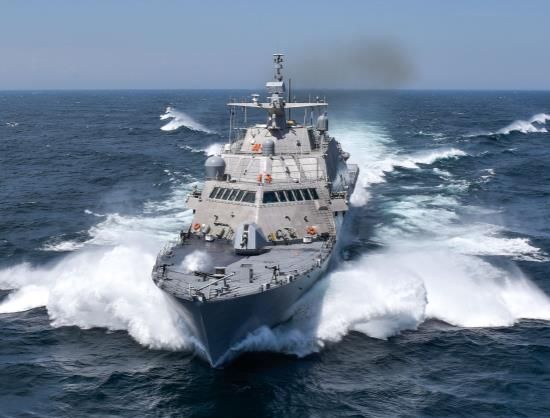
1
Recent commercial track record: substantial increase in order intake
starting from 2014
Order intake Backlog(1)
€ mln € mln
3.4x 3.4x 4.5x
1.0x 1.8x
2.1x 2.2x 3.8x
Soft
15,726 backlog
€ 3.0 bln(2)
843 15,721
1,533 5% 732
Soft
backlog 7% 1,143
Soft € 5.0 bln(2)
backlog
€ 5.0 bln(2)
8,255 9,814
3% 300
474 8,068
3% 22% 2,124
1,816 13,662 264 89% 14,067
31% 2,480
6,100 76% 7,465
66% 5,345
(135) (312) (21) (75) (221)
FY 2011 - 2013 FY 2014 - 2015 FY 2013 FY 2014 FY 2015
Shipbuilding Offshore Equipment, Systems & Services Shipbuilding Offshore Equipment, Systems & Services
Eliminations Book to Bill (Order Intake / Revenues) Eliminations Backlog / revenues Total backlog / revenues
• Total backlog(3) at December 31, 2015 represents 4.5 years of work in relation to revenue generated in 2015 – Group’s ability to finalize contracts
under negotiation, contract options and commercial opportunities and to transform them into backlog
(1) Breakdown calculated based on total backlog (after eliminations)
(2) Soft backlog represents the value of existing contract options and letters of intent as well as contracts in advanced negotiation, none of which yet reflected in the order backlog
(3) Sum of backlog and soft backlog
9
2      Retention & diversification of client base

                                                               Clients diversification                                                   Long standing relationships                                   New clients
                                                                                                                                      Vessels delivered since 1990
                            2002                                    Today(1)                                                          Vessels in order portfolio(1)

                                                                                                                                                                      • Over 25 years

   Cruise                                                                                                                                                                  61                 10 71

                                                                                              Italian                       US          Italian                       • Over 50 years
                                                                           Italian            Coast             US          Coast
                                                                           Navy               Guard             Navy        Guard       Navy
                                                                                                                                                                         32             17   49
                                    Italian                               Qatar Emiri        U.A.E.             Turkish    Algerian                                                                   Qatar Emiri
                                    Navy              US Navy                                                   Coast                                                                                               U.A.E.
                                                                          Naval              Navy                          Navy                                                                       Naval
                                                                                                                Guard                                                                                               Navy
                                                                          Forces
   Naval                            Italian                                                                                              US Navy                      • Over 30 years(2)
                                                                                                                                                                                                      Forces
                                                     US Coast                               Bangladesh                     Indian                                                                     Bangladesh    Kenya
                                    Coast                                  Iraqi                                Peruvian
                                                     Guard                                  Coast                          Navy                                                                       Coast         Navy
                                    Guard                                  Navy                                 Navy
                                                                                            Guard                                                                                                     Guard
                                                                                                                                         US Coast
                                                                                            Armed               Kenya                                                 • Over 20 years(2)
                                                                                            Forces of                                    Guard
                                                                                                                Navy
                                                                                            Malta

                                                                                                                                             (3)                      • Over 20 years(4)

                                                                                                                                                                              56             3 59

   Offshore                                                                                                                                                           • Over 20 years(4)

                                                                                                                                                                      • Over 10 years(4)

                                                                                                                                                                      • Over 10 years(4)

Source: Company information
(1) As of June 2016
(2) Through Manitowoc Marine Group (now Fincantieri Marine Group)
(3) DOF includes: DOF includes: DOF, DOF Subsea, Norskan Offshore, DOF Deepwater, Techdof Brasil and Dofcon Navegação
(4) Through VARD

                                                                                                                                                                                                                         10
3 Technological leadership: unique technological and operational excellence
A Global and flexible production network
• Global engineering and production network with 20
shipyards
• State-of-the-art facilities
• Flexible capacity
B High flexibility
• Highly customized products
• Flexible utilization of resources globally
• Tailored project set-up to meet client needs
C Superior system integrator capabilities
• Ability to coordinate a broad network of specialized
suppliers (more than 2,600 just in Italy)
• Integrated production model
• Proven track record of on-time deliveries
D Technological leadership
• Best-in-class know-how and leadership in high-end
vessels
• Strong commitment to R&D
• Innovation across full product offering
11A Global and flexible production network
Global presence to exploit local opportunities Flexible engineering / production network
1
Norway
Shipyards: 20(1)
• 5 shipyards
Romania
• 2 shipyards 1 3
2 Norway
Continents: 4
USA UAE
• 3 shipyards Vietnam
• 1 Joint Venture
• 1 shipyard
3
Brazil Italy
2
• 1 shipyard 1 2 3
• 8 shipyards Romania
Corporate/BU headquarters
Operating subsidiary
Shipyard
Joint Venture
Representative/Sales office
Employees by location(2) Supply chain
Hull assembly & Outfitting and
Project development
pre-outfitting sea trials
Italy
39%
Design Hull Production and
Outfitting
VARD
• ~20,000 employees Hull
1 Design 2 3 Outfitting
(whom more than production
7,800 in Italy)
Hull
1 Design 2 3 Outfitting
RoW production
61%
VARD
Hull Production and
Design Outfitting
Source: Company information
(1) Excluding one shipyard through the joint venture in UAE with Al Fattan Shipyard Industry Est and Melara Middle East FZCO
(2) As of December 2015
12B High flexibility
Owner’s concept DESIGN OF A CRUISE SHIP Shipyard dream
Coordination and shop
Owner inputs Basic design Functional design
drawings
Guidelines e.g.: • General arrangement plan • Keel design • Hull construction drawings
• # of cabins / passengers • Mid-ship section • Static / Dynamic • Installation plans
• Speed • Ship specification calculations •…
• Operative profile •… • Plants design
•… • Structure dimensioning
• Technical specifications for
supply
•…
• Due date defined since order
• Any delay would significantly penalize the shipbuilder (e.g. penalties, reputation)
Source: Fincantieri analysis
13C Superior system integrator capabilities
“Prime / General Example of a cruise ship
contractor” role with:
Contract First Cut Launch Delivery
3-4 months 10-12 months 10-17 months 8-12 months
• Direct development of
design & engineering
(starting from ship Project Management
Pre-contractual
configuration in close phase
cooperation with Design /
Hull assembly & Pre-outfitting Outfitting & Sea Trials
Project development
shipowner, ensuring high
flexibility also during
construction) Engineering: Hull: Outfitting:
responsible of overall project direct construction integration & coordination in Group shipyards
• Project management of in Group shipyards of a large number of suppliers with dynamic
management of any modification
whole construction (sole
interface & coordinator of
all parties involved
interacting with suppliers for
engineering and Owner’s
production) concept
• Hull construction +
integration of parts &
components provided by
suppliers (active
Platform Payload
management of make-or-
buy strategies) Air cond./ Catering Automation Furniture/ Pools/ Entertainment/
Shipyard Propulsion Restaurants SPA Theaters
• Responsibility of project dream
performance and results
Source: Company information
14D Technological leadership
Main achievements Example of innovative projects delivered / ongoing
• Carnival Vista: “ECO Notation” by Lloyd's Register for exceeding
environmental regulatory standards
Cruise • Royal Princess: 1st cruise ship fully compliant with new regulations
• Costa Luminosa & Costa Pacifica: Guinness World Record for joint-
• Strong technological christening of 2 cruise ships
know-how and design
skills: ~90 protoypes in • F.A. Gauthier: 1st dual fuel (LNG-gasoil) ferry in North America
just over 10 years Ferries
• R&D:
‒ >70 projects ongoing • LCS Freedom: world’s fastest steel frigate
‒ 2015 expenditure • Aircraft Carrier Cavour: world’s most powerful non-nuclear propulsion
Naval
€ 90 mln system
• More than 20 prototypes developed over the last fifteen years
‒ Best-in-class R&D
center (CETENA) in • Normand Maximus: largest offshore vessel ever built in Norway
charge of developing • Skandi Africa: "Ship of the Year 2015"(1)
Offshore
new marine • AMC Connector: world’s largest cable layer(2)
technologies across • Far Samson: most powerful offshore vessel(3)
business units and
for third parties
• Serene: winner of “World Superyacht Award 2012” (134 m length)
Mega-
Yachts
Source: Company information
(1) Award instituted by the major Nordic shipping magazine Skipsrevyen
(2) In terms of loading capacity (2011)
(3) In terms of bollard pull at the date of construction (423 tonnes) (2009)
15Section 2
Historical Financial
Performance
Skandi Africa
DOF
Ship of the Year 2015Fincantieri Group historical financial results: leaving behind the sector crisis
Headwinds in 2009-2015 Implications 2015 financial impact Countermeasures & recovery
• Global financial crisis • In order to preserve industrial • Operational issues • New Business Plan
heavily impacted cruise capabilities Fincantieri surfaced in 2015 and announced on March 31, 2016
ships orders in 2009- decided to take on complex were fully reflected (see Fincantieri Business Plan
2011 cruise ship prototype orders in FY 2015 results 2016-2020 presentation and
Shipbuilding at challenging prices during Vard FY 2015 Results &
2012-2013 Business Plan presentation)
• Such prototypes were built
• 2016 results highlight a strong
mainly in 2015 and delivered
recovery of Group operating
in 2016
and financial performance
marking a turning point (see
• Oil price slump starting • Significant order slowdown in • The full impact of the
Fincantieri Interim presentation
in Q3 2014 caused a Oil&Gas equipment industry crisis was felt in
and Vard Interim presentation)
scaling back of E&P starting in 2015 with 2015
investments plans and consequent reduction of • The strategy of preserving the
Offshore cost-cutting activities at some shipyards Group’s assets and
capabilities proved correct
• Critical Brazilian • Vard Brazilian operations
and allowed Fincantieri to get
economic e political were a drag
out of the crisis period
situation
strengthened
17Overview of financial performance indicators(1)
VARD
€ mln FY 2011 FY 2012 FY 2013(2) FY 2014 FY 2015
Order intake 1,863 1,394 4,998 5,639 10,087
Backlog 5,373 4,735 8,068 9,814 15,721
Soft backlog - - 5,000 5,000 3,000
Revenues 2,380 2,381 3,811 4,399 4,183
EBITDA 141 147 298 297 (26)
As a % of revenues 5.9% 6.2% 7.8% 6.8% -0.6%
EBIT 75 87 209 198 (137)
As a % of revenues 3.1% 3.7% 5.5% 4.5% -3.3%
Net result before extr. and non recurring items(3) 44 44 137 87 (252)
Attributable to owners of the parent 43 44 109 99 (141)
Net result for the period 9 15 85 55 (289)
Attributable to owners of the parent 8 15 57 67 (175)
Net fixed assets 566 595 1,432 1,417 1,453
Net working capital(4) 159 (97) (67) 69 251
Of which construction loans - - (563) (847) (1,103)
Equity 951 957 1,210 1,530 1,266
Net financial position Net cash/ (Net debt) 226 459 (155) 44 (438)
Employees 9,994 10,240 20,389 21,689 20,019
(1) With the aim to provide a meaningful index to measure the Group financial results, the Group adopts an EBITDA definition which normalizes the trend of results over time, and increases the level of comparability of the same
results by excluding the impact of non recurring and extraordinary operating items; for the same reason, the Group also monitors Net Income before non recurring and extraordinary items (both operating and financials)
(2) 2013 figures consolidate VARD starting from January 23, 2013
(3) Excluding extraordinary and Non Recurring Items net of tax effect
(4) Construction loans are accounted for in Net working capital, not Net financial position, as they are not general purpose loans and can be a source of financing only in connection with ship contracts
18Revenues(1) and EBITDA(1,2) by segment
VARD
€ mln FY 2011 FY 2012 FY 2013(3) FY 2014 FY 2015
Revenues 2,288 2,292 2,394 2,704 2,847
Cruise 1,244 1,062 1,075 1,439 1,649
Naval 894 1,052 1,126 1,059 1,056
Shipbuilding
Other 150 178 193 206 142
EBITDA 156 157 155 195 (23)
EBITDA margin 6.8% 6.8% 6.5% 7.2% -0.8%
Revenues - - 1,321 1,580 1,199
Offshore EBITDA - - 155(3) 108(3) (3)
EBITDA margin - - 11.8% 6.8% -0.2%
1
Revenues 131 166 163 192 226
Equipment,
Systems & EBITDA 10 15 14 21 31
Services
EBITDA margin 7.9% 9.3% 8.5% 11.1% 13.8%
Consolidations / Revenues (39) (76) (67) (77) (89)
other activities EBITDA (25) (25) (26) (27) (31)
Revenues 2,380 2,381 3,811 4,399 4,183
Total EBITDA 141 147 298 297 (26)
EBITDA margin 5.9% 6.2% 7.8% 6.8% -0.6%
(1) Breakdown calculated gross of consolidation effects (3) Including the release of orders risk fund referred to the provisions accrued at VARD business combination for expected losses on construction contracts in Brazil (€ 53 mln
(2) EBITDA is a Non-GAAP Financial Measure. The Company defines EBITDA as profit/(loss) for the period before (i) income taxes, (ii) share of released in 2013 and € 35 mln in 2014)
profit/(loss) from equity investments, (iii) income/expense from investments, (iv) finance costs, (v) finance income, (vi) depreciation and
amortisation, (vii) extraordinary wages guarantee fund – Cassa Integrazione Guadagni Straordinaria, (viii) accruals to provision for corporate
restructuring, (ix) accruals to provision for asbestos claims, (x) other non recurring items. EBITDA breakdown are referred only to operating
segments
19Capex
Capex evolution Capex by segment
€ mln € mln
3.3% 3.7% VARD 6.7% 3.7% 3.8%
255
255
4
4
37
111 162 161
162 161
12 13
38 39 5 5
47 31
89 218
78
3
4 137
124 122 112
86 98
74
(1)
FY 2011 FY 2012 FY 2013 FY 2014 FY 2015 FY 2013 FY 2014 FY 2015
Property, plant and equipment Intangible assets % of Revenues Shipbuilding Offshore
Equipment, Systems & Services Other activities
• 2014 and 2015 Capex mainly related to:
‒ Property, plant and equipment - aimed at supporting the development of production volumes and improving safety conditions and compliance with
environmental regulations within the production sites
‒ Intangible assets – mainly related to the development of new technologies for cruise business and IT systems
• 2013 Capex mainly related to completion of multi-year programs to increase production capacity of the shipyards in Brazil and the United States
(1) In addition, acquisition of VARD = €169 mln (reported net of cash acquired; total cost = €498 mln)
20Working capital dynamics
Indicative payment terms Main phases of the shipbuilding process(1) Impact on net working capital
Signing A First Cut B Launch C Delivery D
Design / Project Hull Assembly and Outfitting and
Development Pre-Outfitting Sea Trials
• Increases during construction
Cruise
Duration • Impact on net debt
(months) 10-12 10-17 8-12
• 20% during
construction
POC(2) 3%-5% 50%-55% 40%-45%
• 80% on delivery
• Neutral profile
Naval(3) Duration
6-15 23-30 6-10
(months)
• According to %
of completion POC(2) 3%-5% 65%-75% 20%-30%
• Increases during construction
Offshore(3) Duration
3-6 5-26 6-15 • VARD generally uses
(months)
• 20% during
construction loans (guaranteed
construction POC(2)
by the ship as collateral)
3%-5% 35%-40% 55%-60%
• 80% on delivery
(1) Phases and durations may be subject to changes depending on circumstances, regions and vessels specificity, production geographical area and type of construction
(2) Percentage of Completion
(3) Illustrative for frigates and support vessels
21Net working capital(1)
Breakdown by main components
€ mln
FY 2011 FY 2012 FY 2013 FY 2014 FY 2015
VARD
405
Inventories and advances
388
Work in progress net of 1,876
advances from customers 400
1,112
276 757
Trade receivables
149 273
318 268 344 610 560
Other current assets and liabilities 107 116 57 (18)
(56) (196)
(577) (597) (563)
Construction loans (847)
(114) (101) (1,103)
Trade payables (911)
(1,047)
(151)
Provisions for risks & charges
(129) (1,179)
(112)
Net working capital (97) (67) 69 251
(1) Construction loans are co mlnitted working capital financing facilities, treated as part of Net working capital, not in Net financial position, as they are not general purpose loans and can be a source
of financing only in connection with ship contracts
22Net financial position(1)
Breakdown by main components
€ mln – Net cash / (Net debt)
FY 2011 FY 2012 FY 2013 FY 2014 FY 2015
VARD
17
Non-current financial receivables 45 90
82
17
Current financial receivables 44 41
52
692 113
552 53
Cash & cash equivalents
432 385
260
(70) (80)
Short term financial liabilities (187) (149)
(263)
(80) (146)
Long term financial liabilities
(563) (600)
Inaugural bond (601)
issuance
€ 296 mln(2)
Net financial position 226 459 (155) 44 (438)
(1) Net financial position does not account for construction loans as they are not general purpose loans and can be a source of financing only in connection with ship contracts
(2) Issuer FINCANTIERI S.p.A., Value € 300 mln, Annual coupon 3.75%, due November 2018
23Profit & Loss and Cash flow statement
VARD
Profit & Loss statement (€ mln) FY 2011 FY 2012 FY 2013(1) FY 2014 FY 2015
Revenues 2,380 2,381 3,811 4,399 4,183
Materials, services and other costs (1,768) (1,727) (2,745) (3,234) (3,337)
Personnel costs (458) (507) (752) (843) (865)
Provisions (13) - (16) (25) (7)
EBITDA 141 147 298 297 (26)
Depreciation, amortization and impairment (66) (60) (89) (99) (111)
EBIT 75 87 209 198 (137)
(2)
Finance income / (expense) (1) (12) (55) (66) (135)
Income / (expense) from investments - 1 2 6 (3)
(3)
Income taxes (30) (32) (19) (51) 23
Net result before extraordinary and non recurring items 44 44 137 87 (252)
Attributable to owners of the parent 43 44 109 99 (141)
(4)
Extraordinary and non recurring items (51) (41) (80) (44) (50)
Tax effect on extraordinary and non recurring items 16 12 28 12 13
Net result for the year 9 15 85 55 (289)
Attributable to owners of the parent 8 15 57 67 (175)
Cash flow statement (€ mln) FY 2011 FY 2012 FY 2013 FY 2014 FY 2015
(5)
Beginning cash balance 329 387 692 385 552
Cash flow from operating activities 150 375 (95) 33 (287)
Cash flow from investing activities (68) (83) (424) (157) (172)
Free cash flow 82 292 (519) (124) (459)
Cash flow from financing activities (24) 13 255 303 167
Net cash flow for the period 58 305 (264) 179 (292)
Exchange rate differences on beginning cash balance - - (43) (12) -
(5)
Ending cash balance 387 692 385 552 260
(1) 2013 figures consolidate VARD starting from January 23, 2013
(2) Includes interest expense on VARD construction loans for € 24 mln in 2013, €26 mln in 2014 and € 36 mln in 2015
(3) Excluding tax effect on extraordinary and non recurring items
(4) Extraordinary and non recurring items gross of tax effect
(5) Excluding financial assets held for sale amounting to € 45 mln
24Net result before extraordinary and non recurring items(1)
VARD
€ mln FY 2011 FY 2012 FY 2013(2) FY 2014 FY 2015
A Net result before extraordinary and non recurring items(1) 44 44 137 87 (252)
Attributable to owners of the parent 43 44 109 99 (141)
B Extraordinary and non recurring items gross of tax effect (51) (41) (80) (44) (50)
̶ Of which extraordinary wages (20) (19) (15) (10) (3)
̶ Of which restructuring and other non-recurring personnel costs (20) (8) (11) (9) (17)
̶ Of which asbestos claims (4) (8) (24) (21) (30)
̶ Of which other non recurring items (10) (9)(3) (22)(3) (4)(5) -
̶ Of which non recurring financial (costs) / income 3 3 (8)(4) - -
C Tax effect on extraordinary and non recurring items 16 12 28 12 13
A + B + C Net result 9 15 85 55 (289)
Attributable to owners of the parent 8 15 57 67 (175)
• Extraordinary wages - costs related to CIGS (Cassa Integrazione Guadagni Straordinaria) for employees in temporary layoff
• Restructuring costs - extraordinary costs, such as severance, related to workforce reduction under the Reorganization Plan in Italy
• Asbestos claims - provisions or costs for asbestos related to claims by employees
• Other non recurring items - mainly write-downs; in 2013 VARD acquisition costs and in 2014 IPO related costs
• Non recurring financial costs - mainly financial expenses related in 2013 to VARD acquisition
(1) Extraordinary and non recurring items net of tax effect
(2) 2013 figures consolidate VARD starting from January 23, 2013
(3) Of which € 1 mln related to the acquisition of VARD in 2012 and € 13 mln in 2013
(4) Related to the acquisition of VARD
(5) Mainly IPO related costs
25Balance sheet
VARD
Balance sheet (€ mln) FY 2011 FY 2012 FY 2013(1) FY 2014 FY 2015
Intangible assets 110 104 539 508 518
Property, plant and equipment 555 585 897 959 974
Investments 16 17 70 60 62
Other non-current assets and liabilities (50) (40) (14) (48) (44)
Employee benefits (65) (71) (60) (62) (57)
Net fixed assets 566 595 1,432 1,417 1,453
Inventories and advances 276 273 400 388 405
Construction contracts and advances from customers 149 (56) 757 1,112 1,876
Construction loans - - (563) (847) (1,103)
Trade receivables 318 268 344 610 560
Trade payables (577) (597) (911) (1,047) (1,179)
Provisions for risks and charges (114) (101) (151) (129) (112)
Other current assets and liabilities 107 116 57 (18) (196)
Net working capital 159 (97) (67) 69 251
Net invested capital 725 498 1,365 1,486 1,704
Equity attributable to Group 934 940 968 1,310 1,137
Non-controlling interests in equity 17 17 242 220 129
Equity 951 957 1,210 1,530 1,266
Cash and cash equivalents (432)(1) (692) (385) (552) (260)
Current financial receivables (44) (45) (52) (82) (53)
Non-current financial receivables (17) (17) (41) (90) (113)
Short term financial liabilities 187 149 70 80 263
Long term financial liabilities 80 146 563 600 601
Net debt / (Net cash) (226) (459) 155 (44) 438
Sources of financing 725 498 1,365 1,486 1,704
(1) 2013 figures consolidate VARD starting from January 23, 2013
26Section 3
Business Overview and Market
Dynamics
Variable Pitch Propeller
Horizon class frigates
Italian NavyBusiness Overview and Market Dynamics
1 Shipbuilding
1.1 Cruise ships
1.2 Naval vessels
1.3 Other shipbuilding – Mega Yachts
1.4 Other shipbuilding – Ferries
1.5 Other shipbuilding – Repair & Conversion
2 Offshore
3 Equipment, Systems and Services
281.1 Shipbuilding – Cruise
Products Target Market / Positioning
Luxury / Niche(1) • Worldwide cruise ships market
• Cruise ships (10 – 60,000 Gross
• Global leader with presence in all cruise market segments
Tonnage and up to 750 passengers)
and niches
expressly designed for exclusive cruises
operated on less popular routes (e.g. high • Main supplier of “Carnival Corporation & plc”, leading ship
cultural / environmental value) owner in the cruise sector
• Well established technological and project management
capabilities
Upper Premium
• Cruise ships (40 – 90,000 Gross
Tonnage and 750 – 1,500 passengers) Client Portfolio
dedicated to destination-oriented cruises Luxury / Niche Premium
with upscale on board service on route /
destinations out of reach for premium /
contemporary ships
Premium
• Large cruise ships (90 – 150,000 Gross
Tonnage and 1,500 – 3,600 passengers)
dedicated to a wide range of cruise routes Upper premium Contemporary
with higher on board standards and
services than contemporary ships
Contemporary both Fincantieri and Vard client Vard client
• Largest cruise ships (over 130,000 Gross
Tonnage and over 3,600 passengers) for Shipyards
mainstream cruises with standard routes
and on board features representing the Italy: Romania:
destination itself • Monfalcone • Sestri Ponente • Tulcea
• Marghera • Ancona
(1) Terminology used in the cruise sector to indicate cruises with niche characteristics (e.g. arctic destinations, coastal routes, regional routes)
29Shipbuilding – Cruise: selected cruise operators overview
Fincantieri clients
New entrants
Multibrand Monobrand
Norwegian
Operators Royal Cruise Line Genting Viking Silversea Disney Virgin
Carnival Caribbean Holding Hong Kong MSC Cruises Cruises Ponant Cruise Line Voyages
Luxury / Niche
Upper Premium
Segment
(1)
Premium
(2)
(3)
Contemporary
Source: Annual reports, company information, GP Wild, specialized press, Fincantieri analysis
(1) TUI Cruises is a 50% joint venture between TUI AG and Royal Caribbean Cruises Ltd
(2) SkySea Cruise Line is a 35% joint venture between Royal Caribbean Cruises and Ctrip
(3) 49% RCL; 51% Springwater Capital
30Shipbuilding – Cruise: steady long-term passenger growth
Dynamics of cruise market Dynamics of global tourism and cruise passengers
• The cruise industry has proven to be mln CAGR
remarkably resilient, having continued to Total tourists ’08-’14 ’14-’20
1,800
grow throughout the 2008-2010 Cruise tourists 1,360
economic crisis +3.4% +3.0%
1,138
• Cruise tourists on total tourists at only
2% and growing 809
678
530
49.0
• Cruise penetration (cruise passengers 30.6
22.1 +6.6% +5.6%
on national population) is still very low: at 9.7 13.3
5.6
a mere 4.5%, Australia has the highest
penetration in the world '95 '96 '97 '98 '99 '00 '01 '02 '03 '04 '05 '06 '07 '08 '09 '10 '11 '12 '13 '14 '20 '30
% cruise
guests/ 1.1% 1.4% 1.6% 2.0% 2.3% 2.7%
tourists
• In view of the positive market outlook of
Key source market penetration rate development
the leisure industry and of the
increasing penetration of the cruise
sector, the latter is expected to High potential of
emerging markets (e.g.
significantly grow in the future, in China) with penetration
rate < 0.1%
particular thanks to the development
of some emerging markets: China and
Australia
USA Australia UK&Ireland Canada Germany Italy Scandinavia Spain Brazil China
2012 2013 2014 2015
Source:Total Tourists: World Tourism Organization, UNWTO – Tourism Highlights, 2015 Edition & Total cruise Tourist: Fincantieri estimates; China National Tourism Administration; CLIA Australia
31Shipbuilding – Cruise: China and Australia high potential markets
China Australia
• The Chinese Ministry of Transport estimates cruise passengers to CAGR +35%
• In 2014 overcame the target of 1
grow from 1 mln(1) in 2015 to 4.5 mln in 2020 mln(2) cruise passengers
• China is expected to become the world’s second largest cruise 4.5 previously foreseen for 2020 (4.2%
market after US with 8-10 mln cruise passengers in 2030 of the national population)
• First region to achieve more than 4%
• Fincantieri and China State Shipbuilding Corporation have signed an
market penetration
agreement for the constitution of a JV aimed at developing and 1.0
supporting the growth of the Chinese cruise industry • Expansion of product offering
(cruise lines establishing presence,
− First mover advantage in a high potential market
2015 2020 and introducing more itineraries and
− Intellectual property protection guarantee
ships)
− No execution risks • New target is for 2 mln passengers
− Growing stream of revenues in the future by 2020
(1) Source: CLIA - Asia Cruise Trends 2016
(2) Source: CLIA Australia
32Shipbuilding – Cruise: from buyer’s market to builder’s market
Cruise ships demand Cruise ship orders
• After a long period of high and constant level of # of ships 19
16 16
orders characterized by a substantial balance
between demand and production capacity of 12 12 10
11
8 8
9
European yards, in 2008 the economic crisis 6 6 7
8
6 3
caused a sudden and severe demand drop 8
3 5
8 1 5 4 8 9
6 6 6
• Due to the investment programs’ cuts and the 3
1
2 1 2 3 2
complete freeze of the credit market, in 2008- 2004 2005 2006 2007 2008 2009 2010 2011 2012 2013 2014 2015
2009 only 4 ships were ordered causing
Fincantieri Other shipbuilders
progressive workload reduction
2014 - today: from «Buyer’s Market» to «Builder’s Market»
• 2010-2013 was still a very challenging period
characterized by: • Recovery in demand for cruises and increase of cruise prices in the "traditional" market in
relation to the improvement of the US and European economic situation
- ship-owners reluctance to order which
caused shipbuilders to accept orders at • Opening of new cruise markets (e.g. China and Australia): major players decided to invest
heavily in these markets, to get first mover advantages
challenging prices
• Replacement of vessels built in the years 1990-2000, now obsolete and less attractive for the
- introduction of new safety regulations,
final customers
which make obsolete the previously
developed projects, forcing shipyards to offer • Entry of new cruise operators with strategic and innovative approaches, aiming to
several prototypes, with substantial differentiate from competitors, delivering a new type of cruise experience to specific target
technological breakthrough and operational customers
complexity • Production capacity already filled through 2020: no slots available before 2021/2022
• For the shipyards, balanced ratio of prototypes vs sister ships
33Shipbuilding – Cruise: market clustering trends
Description Market clustering trends
Size (GRT)
Trend by ship type
240000
• Clustering of ship sizes towards:
Main market focused on 130,000 -
– Large ships (~130 -180,000 GRT) for premium 210000 180,000 GRT ships demand
and contemporary segments, focused on
broadening of board entertainment
180000
– Medium-small size ships (Shipbuilding – Cruise: competitive positioning
Competitors overview Market share(1)
Number of ships, new orders Jan 2004 – June 2016
Tot. # ships = 145
MV
# of dedicated 4 2 newbuilding + Other
Flexible Werften &
shipyards 1 1 1 Lloyd W.
+1 operations 2 repair & outfit
Fincantieri
& VARD
STX
44%
France
Ships in 27(3) 12 5 12 4
orderbook(2)
Meyer
Turku
• Luxury / Niche • Premium • Premium • Premium • Contemporary
• Upper premium • Contemporary • Contemporary • Contemporary • Luxury / Niche
Product • Premium
offering Widest Meyer
• Contemporary product Werft
portfolio
Cruise shipbuilding segment is strongly dominated by European players with occasional presence of other shipbuilders (e.g. Mitsubishi
acquired orders for 2 cruise ships for Aida brand in 2010 and booked significant losses)
Fincantieri is the world leader with a solid track record of 74 delivered cruise ships since 1990 (at June 30, 2016)
Source: Shippax, company information, Fincantieri analysis
(1) Cruise ships over 10,000 of gross tonnage; New orders Jan 2004 – June 2016, including MOA, LOI, excluding options. Market share on a long period since this measure changes significantly year-on-year
subject to deliveries and new orders
(2) At June 30, 2016; including MOA and LOI, excluding options
(3) Includes 6 vessels in VARD orderbook 351.2 Shipbuilding – Naval
Products Target Market / Positioning
Aircraft carriers Corvettes • Sole supplier of the Italian Navy(2) and one of the major mid-
sized vessel suppliers of US Navy and US Coast
• Pursuing opportunities in foreign accessible markets
• Signed ~ € 4.0 bln program with Qatar Emiri Naval Forces
Client Portfolio
• Air operations, air power projection • Fast vessel for coastal defense, sea
and dual use operations for disaster patrol, search and rescue ITALIAN US
ITALIAN US
relief COAST COAST
NAVY NAVY
GUARD GUARD
Destroyers Patrol vessels
QATAR EMIRI UAE INDIAN
IRAQI
NAVAL NAVY NAVY
NAVY
FORCES
PERUVIAN TURKISH ALGERIA BANGLADESH
NAVY COAST COAST
• Other ships defense in multi threats • Littoral missions, sea patrol, search GUARD
NAVY
GUARD
environments and rescue, anti pollution and
fishery control ARMED
KENYA
FORCES OF
Frigates Submarines NAVY
MALTA
Shipyards
Italy USA
• Riva Trigoso - Muggiano • Marinette
• Multi-mission vessels with anti-surface • AIP(1) unit for surveillance and open • Green Bay
and anti-submarine warfare sea operations • Sturgeon Bay(3)
(1) Air independent propulsion
(2) For all the large ships and excluding minesweepers and small ships below 45 m in length
(3) Focused on the construction of offshore support and other specialized ships
36Shipbuilding – Naval: market opportunities
Description Estimated defense spending for naval vessels (foreign markets accessible to Fincantieri(1))
€ bln
Fincantieri’s accessible markets
• Countries with naval shipbuilding
capabilities where the Group already
10.4
operates 8.7
6.8
− Italy: Italian Navy’s fleet renewal 3.9
2.0
program and other programs (e.g.
FREMM) 2016 2017 2018 2019 2020
− US: LCS program Source: IHS Jane’s – October 2015, Fincantieri analysis
• Countries with no strong local
Spending by country (foreign markets accessible to Fincantieri)
shipbuilder or with no significant naval
Euro in %, period 2016-2020 India
technologies 14%
Saudi
− Cumulated spending programs amount Others Arabia
39% 11%
to € 31.8 bln over 2016-2020
− 60% of estimated 2016-2020 spending Brazil
for naval vessels is related to a group 7%
of 10 countries Australia
7%
Vietnam
2% Turkey
Philippines Qatar 5%
2% Algeria UAE 5%
4%
4%
Source: IHS Jane’s – October 2015, Fincantieri analysis
(1) Excluding submarines, minehunters and programs of self-sufficient / non accessible countries
37Shipbuilding – Naval: key programs of the Italian Navy
Fleet renewal program Other programs
• Multi-year program known as the "Defence Act“ that will employ a • FREMM program
total funding of € 5.4 bln – Program launched in 2005 sponsored jointly by the French and
Italian governments to design and build the European
• Orders for a total of 9 new generation multi-purpose vessels
Multipurpose Frigate
already placed with the consortium consisting of Fincantieri, agent,
and Finmeccanica, principal, for € 5.4 bln (Fincantieri share ~ € 3.6 – DCNS manufactures for the French government, while Fincantieri
bln) manufactures for the Italian government and the two companies
cooperate on the design
– 7 multi-purpose offshore patrol vessels (PPA - Pattugliatore
Polivalente d’Altura) with 3 more in option, scheduled for delivery – The program provides for the construction of ten vessels for
in 2021, 2022, 2023, 2024 (two units), 2025 and 2026 the Italian Navy and is completed with the acquisition in 2015 of
the orders for the last two vessels, to be delivered after 2020
– 1 Logistic Support Ship (LSS), scheduled for delivery in 2019
– 1 multi-purpose amphibious unit (LHD - Landing Helicopter Dock), • U212A submarines
scheduled for delivery in 2022 – Program launched in the nineties as part of an Italian-German
• In addition, Fincantieri will provide support over the lifecycle of the governmental cooperation that has led to the construction of
vessels, through the supply of logistic services during the construction four U212A submarines with similar features for the Italian Navy
and of ISS or In Service Support, during post-delivery operations, as (in two batches) and four for the German Navy
well as components and naval machinery – Fincantieri delivered in July 2016 the third submarine to the
Italian Navy, while the fourth one has been launched in July 2015
• The fleet renewal is the first significant shipbuilding program since
2006 and will have potential for export to other accessible markets
TO COME
Source: Company information
38Shipbuilding – Naval: key programs of the US Navy
Description LCS program(2)
• In 2009, Fincantieri together with Lockheed Martin Corporation (as Orders of "Freedom" class built by Fincantieri
minority investor) acquired for ~ USD 120 mln the marine business unit
of the Manitowoc Company, Inc. (renamed Fincantieri Marine Group) 2010 2011 2012 2013 2014 2015 2016
2017- From
2018 2019
– ~ USD 100 mln invested for the facility upgrade making the acquired
shipyard among the best ones in the USA for the construction of
mid-sized vessels
– Recognized contribution to the enhancement of local know how and
LCS5
authorization by DSS to operate the yard with company’s own staff LCS7 LCS9 LCS13 LCS17 LCS21 LCS25 LCS27 LCS/FF31
…
• In 2010 Fincantieri was awarded with the contract for the
construction of up to 10 units of Freedom class of the Littoral
LCS11 LCS15 LCS19 LCS23 LCS29 LCS/FF51
Combat Ship program(1)
– First multi-purposes vessels : vessels capable of serving three
missions with interchangeable modules within one day
– Highly technological and efficient vessels allowing substantial
operating costs reduction matching the declared effort of the US
Navy to increase efficiency of the fleet
• In 2015 Fincantieri was awarded an option for an additional unit
(LCS 25), subsequently financed in 2016
• The Navy maintains the requirement of 52 ships. The LCS program
foresees 4 units to be financed in 2017-2018 and then will evolve USS Freedom USS Forth Worth USS Milwaukee USS Detroit
towards an enhanced configuration, named Fast Frigate, to be procured (LCS 1) (LCS 3) (LCS 5) (LCS 7)
Delivered: 2008 Delivered: 2012 Delivered: 2015 Delivered: 2016
from 2019 to 2025 in order to complete the program
Source: AMI International, “Navy Force Structure and Shipbuilding Plans: Backgound and Issues for Congress” November 2013
(1) Program for a total of 52 ships entails the construction of equal number of units of the Independence class built by Austal USA
(2) LCS1, LCS3, LCS5 and LCS7 already delivered
39Shipbuilding – Naval: contract with Qatari Ministry of Defence
• In June 2016 Fincantieri and the Qatari Ministry of
Defence have signed a contract for the construction of
seven new generation units (surface vessels)
included in the national naval acquisition programme of
the Qatar Emiri Naval Forces:
− Four corvettes of over 100 meters in length
− One amphibious vessel (LPD - Landing Platform
Dock)
− Two patrol vessels (OPV - Offshore Patrol Vessel)
− Support services in Qatar for further 15 years after
the delivery of the vessels
• All the units will be entirely built in Fincantieri Italian
shipyards starting from 2018
• Value for Fincantieri close to € 4.0 bln
• This large program falls within the company’s strategy to expand into new naval markets, leveraging well-proven expertise with new
potential clients
• It is the largest order for a foreign Navy acquired by Fincantieri over the last 30 years
40Shipbuilding – Naval: competitive positioning
Competitors overview
Product Portfolio
FY 2015 overview Naval revenues/total revenues Surface Ships Auxiliary Ships Submarine
• Total revenues: € 4,183 mln 25%
– of which naval: € 1,056 mln
• Employees: 20,000
• n. naval shipyards: 3 (2 USA)
• Total revenues: € 24,659 mln 21%(5)
Including
– of which naval: € 5,228 mln nuclear
• Employees: 82,500 submarines
• n. naval shipyards: 4(1)
• Revenues: € 2,100 mln
30%
– of which naval: ~€ 600(2) mln
• Employees: 9,700
• n. naval shipyards: 2(3)
• Revenues: € 3,039 mln 60%(6) Including
– of which naval: € 1,800 mln nuclear
• Employees: 12,770 submarines
• n. naval shipyards: 4(4)
• Revenues: € 705 mln 90%(7)
– of which naval: ~€ 634 mln
• Employees: 5,530
• n. naval shipyards: 4
• Revenues: € 42,778 mln 4%
– of which naval: € 1,700 mln
• Employees: 154,900
• n. naval shipyards: 2
• Strong European national players bidding in the export market
Source: Annual reports, company information, Fincantieri analysis (4) Includes Brest and Toulon (fleet maintenance)
(1) Excluding US shipyards (ship repair) (5) Sales of BAE Platform & services UK Maritime business and BAE Sys. Platform & services USA Ship repair business
(2) Estimate: excluding nuclear production and fleet maintenance (6) Estimate
(3) Includes Damen Galati shipyard (Romania, construction of hulls) (7) Estimate
411.3 Other Shipbuilding – Mega-Yachts
Products Target Market / Positioning
Serene (134 m) Victory (140 m) • Worldwide mega yachts market
(> 80 m)
• One of the key(1) players in the construction of luxury vessels
of over 100 meters in length
• First Fincantieri mega yacht (Serene, 134 m) delivered in
2011 and awarded with “World Superyacht Award 2012”
• Large luxury customized mega yachts resulting from a special synergy of
advanced technical, design and construction capabilities of the Group
WORLD
SUPERYACHT • In December 2014 Fincantieri
Concept AWARD
2012
delivered “Victory” (140m), the largest
yacht ever built in Italy and one of the
Fortissimo (145 m) Mars (92 m) ten largest motor yacht in the world
Commercial strategy
• Clients: Ultra High Net Worth Individuals on worldwide basis
Xvintage (99 m) Ottantacinque (85 m)
• Minority stake in Camper & Nicholsons, the world leading
authority in all luxury yachting activities, notably brokerage
Shipyards
• Riva Trigoso - Muggiano
(1) Source: The Superyacht Report, ShowBoats International (2014)
421.4 Other Shipbuilding – Ferries
Products Target Market / Positioning
Dual Fuel Ferries • Large ferries (length > 150 m) dedicated to the European
• Mixed diesel and LNG (Liquefied market (Mediterranean Sea, Baltic Sea and North Sea)
Natural Gas) propulsion
• Innovative ferries adopting the most advanced solutions in
terms of energy saving and low environmental impact
Client Portfolio
Cruise Ferries
• Ferries with high comfort level for
the transportation of passengers
Ro-pax
• Vessels built for freight vehicle
transport along with passenger
accommodation
Shipyards
• Castellammare di Stabia
• Ancona
431.5 Other Shipbuilding – Repair & Conversion
Products Target Market / Positioning
• Repair and conversion of cruise ships, mega-yachts, offshore
units and other commercial vessels leveraging on presence in
strategic geographical areas (e.g. Mediterranean Sea and North
America)
• One of the key players in the Mediterranean Sea area and the
main operator for ship repairs and conversions in the Great
Lakes area of the US
Client Portfolio
• Ordinary repair services: ordinary maintenance and interventions required by
international classification registers (e.g. dry docking and special surveys)
• Extraordinary services: damage repair and upgrading of ship standards in Shipyards
order to adapt ships pursuant to new regulations Italy USA
• Conversion: structural changes of ships changing their final use (conversion), • Palermo • Sturgeon Bay
upgrading of ship machineries and technologies and increase in the ship • Trieste
payload • Riva Trigoso - Muggiano
(1) The Group also offers repair and conversion services through the subsidiaries Bacini di Palermo S.p.A. and Gestione Bacini La Spezia S.p.A.
44Other Shipbuilding – Repair & Conversion: examples of Fincantieri projects
Project Description
MSC Rinascimento (Cruise) • Fincantieri performed a large upgrading program of 4 Lirica class cruise ships for MSC
• The project consisted of the lengthening by 24 m of the mid section of 60,000 GRT vessels built in France in
2000/2002
• Passenger capacity increase by 25%
• 2 months intervention duration in dry dock per ship
• Design and development directly performed by Fincantieri
Al Said (Mega-Yachts) • Mega-yacht Al Said is the 4th largest private vessel with 155 m length
• Built in Germany in 2008
• The project consisted of 2 months extensive refitting and repair of machinery, propulsion system, power
generation and HVAC (i.e. heating, ventilation and air conditioning)
Scarabeo 8 (Offshore) • Scarabeo 8 is one of the largest semi-sub platforms owned by Saipem
• The project started from a completely bare deck supplied by Saipem. Fincantieri performed all phases, from
hull construction to outfitting. In particular:
‒ Upgrade of bare deck and hull construction
‒ Outfit with technical equipment (e.g. derricks, drilling system)
‒ Outfit with a large accommodation module with cabins and public areas
452 Offshore
Products Target Market / Positioning
OSV(1) Drilling units • Among global leaders in high-end OSVs, supplier of complex
AHTS Drillships Semi-subs vessels
• Heads of Agreement with Rosneft (Russia) for the formation of a
JV in focused on design and engineering of a new type of vessel
• Diversification in expedition cruise, aquaculture, offshore wind
• Anchoring and moving • Deep/ultra deep • Mid/deep water and offshore patrol vessels segments
drilling and offshore water drilling units drilling rigs
production units
Client Portfolio
Others
Aquaculture Offshore wind
PSV
• Fisheries and other • Wind Service
• Transporting vessels for Operation Vessels for
cargo/people to/from aquaculture sector offshore wind farms
offshore rigs and
platforms Special vessels OPV Expedition / luxury-niche cruise clients
OSCV Shipyards
Norway Brazil USA(2)
• Heavy lift, icebreakers, • Offshore Patrol • Aukra • Promar • Sturgeon Bay
research vessels, LPG Vessels • Brattvaag Romania Italy(2)
• Highly complex • Brevik • Braila • Palermo
Expedition cruise
vessels performing • Small sized • Langsten • Tulcea • Ancona
subsea operations expedition cruise • Søviknes Vietnam
and maintenance vessels • Vũng Tàu
also production of luxury-niche cruise vessels also production of cruise sections for Fincantieri
(1) AHTS = Anchor Handling Tug Supply, PSV = Platform Supply Vessels, OSCV = Offshore Subsea Construction Vessels
(2) For reasons connected with the organization of production and the proximity of market/customers the Group’s Italian (Palermo e Ancona) and US (Sturgeon Bay) yards offer offshore products
46You can also read