2020 3-YEAR ECONOMIC OUTLOOK REPORT - MCKINLEY CAPITAL ...
←
→
Page content transcription
If your browser does not render page correctly, please read the page content below
2020
3-YEAR ECONOMIC
OUTLOOK REPORT

                  Sponsors:
INTRODUCTION

In the 12 years AEDC has been preparing 3-year economic outlook reports,
there have never been greater challenges facing the Alaska economy or more
uncertainty about the path ahead. As this forecast is being presented, employment in Anchorage is 16,000
jobs below the same time last year, a loss of 10%. Unemployment stands at 12%, more than double the rate
one year ago. The leisure and hospitality sectors have been hardest-hit, along with transportation providers,
many retailers, and personal services providers, but nearly all segments of the local economy have suffered.

The COVID-19 pandemic has caused massive economic disruption in Alaska, the U.S., and around the
world. The U.S. is now several months into what promises to be a slow, multi-year recovery. Public health
and economic recovery will be closely intertwined, and how we balance health risk with “reopening” the
economy will be key. The Congressional Budget Office forecasts the U.S. economy will recover to pre-
pandemic levels by mid-2022. Other forecasts paint the same general picture of slow recovery of the U.S.
economy over the next two years.

How closely Alaska and Anchorage will parallel the U.S. recovery is uncertain. Anchorage entered 2020 still
in recession. December 2019 employment was 930 jobs below December 2018. About half of that loss
was in retail trade, a sector experiencing long-term decline for reasons mainly unrelated to the strength
of the Anchorage economy. In any case, the outlook for recovery would be stronger if there was pre-
pandemic economic momentum.

The flow of federal funds into Alaska has been critical in mitigating the economic damage inflicted by
COVID-19. CARES Act funds, the Payroll Protection Program, Economic Impact Payments, expanded
unemployment payments, and other federal programs have pushed half a billion dollars into the Anchorage
economy over the past few months. The pace of recovery will depend in part on how Congress chooses to
fund these and related programs going forward.

The sharp drop in oil prices adds another layer of concern. While prices have rebounded from historically
low levels in April, the current ANS price of about $40 is well below the price needed to sustain State
services at their current levels. Permanent Fund earnings are now an important part of the state
government funding picture, but the oil industry remains an essential source of revenue. Just the threat of
new taxes on the industry is depressing an already difficult investment environment.

The news is not all bad. Anchorage is fortunate to have the steadying and important source of economic
activity provided by the military. The volume of air cargo through the airport reached record levels in the
second quarter of 2020, as freight typically carried in the belly of trans-Pacific passenger jets was diverted
to air freighters.

This 3-year forecast articulates the uncertainty ahead and AEDC’s best assessment of the strength and
timing of economic recovery. It also begins the conversation about rebuilding a more resilient economy and
more fully leveraging our assets in a world that has been dramatically changed by recent events.

                                                        2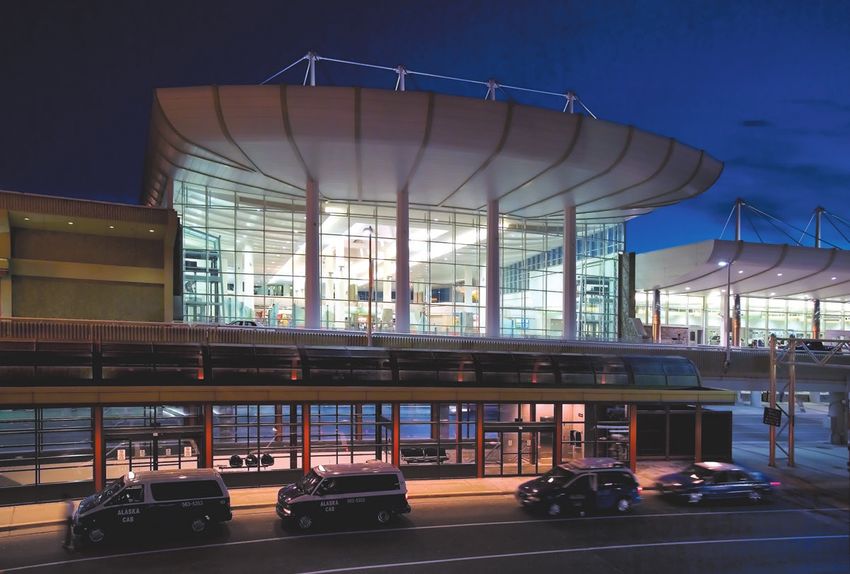
POPULATION
Anchorage’s population totaled 291,845 in 2019, down about 2,600 residents (0.9%) from the prior year. While there were
3,900 births and 1,800 deaths in 2019, the city experienced net migration loss of 4,800. An overall loss of approximately
9,200 residents since the peak population of 301,037 in 2013 has brought the Municipality back to 2010 levels. As the
statewide recession bottomed in 2019, continued population declines in Anchorage were likely related to reduced
employment opportunities in-state and historically low unemployment in the Lower 48.

Due to the pandemic, AEDC is revising its expectations of Anchorage population trends. AEDC expects some moderation
of population losses in 2020 as residents who may have otherwise left Anchorage pause these plans due to uncertainty.
Population losses are expected to trend higher in 2021 if the Alaska economy lags behind the recovery in the Lower
48 economy. Population trends through 2023 are anticipated to be impacted primarily by the pace of recovery in the
Anchorage economy, with room primarily on the downside.

Prior to the pandemic, AEDC had expected the trend of population loses to extend into 2020 before flattening through
2022. Several key factors were expected to shape population change in Anchorage over the short term:

•      A shrinking labor force prior to any pandemic impacts may have signaled continued population decline in 2020.
       Through March of this year, the size of the local labor force was down 1.4% from the same period in 2019 (about
       2,000 workers). Between 2014 and 2018, the total labor force decline of about 11,100 workers mirrored declines in
       the working age population of about 11,500 people.1

•      Alaska’s economy, and subsequently its population, has historically been counter-cyclical to the Lower 48. Alaska
       generally experiences population increase during periods of economic downturn in the Lower 48, such as
       population increases between 2007 and 2008 as the rest of the nation faced greater impacts from the Great
       Recession. Conversely, Alaska has lost population when the national economy is comparatively strong. Prior to
       the pandemic, national unemployment rates hit record monthly lows around 3.5% compared to an average 5.1%
       in Anchorage. In 2019, Anchorage’s net outmigration to the Lower 48 was about 2,200, which represented lower
       outmigration compared to the previous three years (2016-2018) but still reflected the relative strength of the job
       market outside Alaska.

•      Further State budget cuts in 2020 and 2021 are expected to result in population decline. The enacted FY2021 budget
       (July 1, 2020-June 30, 2021) shaved an additional $1.12 billion from the reduced FY2020 budget, which is expected to
       result in a reduction of 250 state government positions statewide. Additional jobs will likely be lost as the $25 million
       University system budget reduction is allocated across the state’s three main campuses. Continued instability in the
       State budget will likely create greater uncertainty for the Anchorage population. Additionally, initiatives to resolve the
       State’s budget deficit like broad-based taxes, increased oil taxes, or reductions in the PFD may impact Anchorage’s
       economy and subsequently its population.

•      Relocation between the Mat-Su Valley and Anchorage (in both directions) accounts for roughly a third of Alaska’s
       intrastate migration in any given year. Between 2015 and 2019, about 14,800 Anchorage residents moved to the
       Mat-Su Valley while 9,100 Mat-Su Valley residents moved to Anchorage. This movement continues a general trend of
       declining migration from Anchorage to the Mat-Su Valley and increased migration from the Mat-Su Valley to Anchorage.

•      The military presence at Joint Base Elmendorf-Richardson (JBER) is a continued source of stability for Anchorage’s
       economy and population. The population living in the JBER census area increased by more than 1,600 between 2015
       and 2019, a 15% rise.

1
    Working-age population is defined as the population age 16-64.

                                                                     3
•       While State budget-induced job losses in 2019 and 2020 were expected to result
        in further population decline, the economic consequences of the pandemic may
        have a more immediate impact on the short-term trajectory of Anchorage’s
        population.

Despite these trends, the pandemic has significantly increased uncertainty worldwide.
The following coronavirus-related factors may impact Anchorage’s population:

•       Alaska’s counter-cyclical pattern in relationship to the Lower 48 may or may not continue during the current national
        situation as residents weigh health care, cost of living, and employment factors in their decision to remain in Alaska or
        leave. Unemployment rates have climbed significantly throughout the country along with increased uncertainty in the
        national economy and Anchorage residents will likely not be enticed to leave by a strong labor market elsewhere.

•       Nationally, analysts have speculated about the pandemic’s impact on urban-to-rural migration. In a widely cited survey,
        the Harris Poll found 38% of urbanites polled said they were somewhat likely or very likely to move out of densely
        populated areas and toward rural areas once the pandemic ends.2 While this sentiment may be short-lived and change
        as coronavirus cases spike across multiple states, Anchorage has potential to capitalize on location-neutral workers’
        interest in relocating.

•       Housing costs and availability have likely been key factors driving Anchorage’s population loss to the Mat-Su.
        Regardless, the vast majority of Mat-Su residents not working in the borough are employed in Anchorage. It remains to
        be seen if the coronavirus pandemic will spur a paradigm shift in employees permanently working from home. If work
        from home is widely adopted, the economic distinction between Anchorage and the Mat-Su will be further blurred as
        Anchorage employment data is credited with jobs held by Mat-Su residents working from home. As some employers
        consider changes to remote working policies, the Mat-Su Valley may see a resurgence in migration from Anchorage as
        commuting times, a traditional barrier to living in the Mat-Su and working in Anchorage, are reexamined.

                                          Anchorage Population, 2008-2023
                                                    4      8     7     2
         71   ,2  30       ,826 95,594 98,147 301,03 300,00 98,63 98,96 97,739 4,488 1,845     ,000 89,500 7,800 6,200
    282,8 289          291     2      2                      2     2     2    29    29     291     2      28    28

     2008     2009      2010    2011    2012    2013     2014     2015       2016   2017    2018    2019     2020      2021   2022   2023

             Source: Alaska Department of Labor and Workforce Development (2007-2019); McDowell Group estimates (2020-2023).

2
    Based on Harris Poll COVID19 Tracker Wave 9 with results from the March 14, 2020 – April 27, 2020 survey period.

                                                                         4
EMPLOYMENT
For the 3-year forecast, AEDC’s analysis of employment typically entails a review of data released since the date of the January
jobs forecast, then making minor modifications (perhaps of a few hundred jobs) to bring the forecast current. This year is
different. The pandemic has fundamentally altered the employment landscape, and most of what we saw coming in the January
forecast is no longer relevant, at least in the near term. A complete reset of the employment forecast is required.

This forecast briefly examines conditions in the industries that are the largest sources of employment in Anchorage. For each
sector, three key elements of employment are considered. One is the condition of each key sector prior to the pandemic,
whether trending up, down, or stable. The second element is the intensity of damage done by the pandemic. Job loss has
occurred across the economy, but some sectors have been hit much harder than others. The third element, which is closely
related to the first two, is how well each sector is positioned to emerge from the deep pandemic-induced recession.

INDUSTRY BY INDUSTRY OVERVIEW
Retail employment in Anchorage averaged 16,512 jobs in 2019, down 461 jobs (2.7%) from the 2018 average of 16,973.
The sector shed jobs each year over the past four years, down nearly 1,600 jobs (8.6%) since 2015. The decline is
mainly related to down-sizing by national retailers and ever sharpening competition from on-line retailers, amplified by
recessionary conditions in Anchorage which began in 2015 and persisted through 2019.

The pandemic has had uneven impacts across the retail sector but overall the sector is suffering. The latest employment
estimates indicate the retail sector lost 1,600 jobs between February and April this year, but regained 700 jobs in May and
another 400 in June. June 2020 retail employment was 1,200 jobs below June 2019.

At one point earlier this year, consumer spending in Anchorage was down more than 40% relative to January spending.
While the latest data indicates spending is now down about 15% relative to January, the actual loss compared to last
year is far greater (though data is not yet available).3 As the pandemic has unfolded, online sales have hit record levels
(Amazon’s first quarter 2020 sales revenue jumped 26%). As many as 25,000 retail stores nationally are expected to close
permanently in 2020, due to reduced consumer spending and as the shift to online shopping accelerates.4

None of this points to robust recovery in the Anchorage retail sector. AEDC expects some improvement in retail
employment in the second half of 2020, but generally flat conditions through the 2021 to 2023 period. By 2023, retail
employment will likely still be about 700 jobs below the 2019 count.

Retail employment outlook: 2019: 16,512, 2020: 15,500, 2021-23: 15,800

Professional and business services employment averaged 17,364 jobs in 2019, up from 17,241 in 2018. The
slight increase in 2019 ended a 6-year stretch of consecutive annual losses. This sector, which includes accountants,
engineers, lawyers, and architects, among a wide range of other professional and business services, had lost 3,000 jobs
(15%) from the peak in 2013. While the uptick in 2019 is good news, the sector was again showing weakness at year-end,
with 370 fewer jobs in December compared to December 2018.

Regarding COVID-19, between February and April of 2020, this sector lost 1,200 jobs, but added back 800 jobs in May and
400 more in June, according to preliminary DOLWD data. Still, June employment was 1,100 jobs below the June 2019 level.
Recovery in this sector will depend in part on state and federal capital project budgets, and private sector investment as
well, especially oil and gas industry spending. In general, private sector spending is likely to remain constrained for several
years, in parallel with weak economic conditions overall.

3
    https://tracktherecovery.org/
4
    https://www.cnn.com/2020/06/27/business/stores-closing-coronavirus-june/index.html
Professional and business services employment outlook: 2019: 17,364, 2020: 16,600, 2021: 16,800,
2022: 17,000, 2023: 17,200

Health care employment in Anchorage averaged 20,893 jobs in 2019, down 50 from 2018. This sector has generated
sustained employment growth over the past 15 years, adding 4,600 jobs between 2010 and 2017. The decline in 2019 was
the first annual loss in more than 15 years. While outpatient care and hospital employment continued to grow through
2019, losses in nursing and residential care caused a net decline in the health care sector overall.

The health care sector initially lost 1,500 jobs (between March and April) due to the pandemic but regained about 500
jobs between April and June. Out-patient providers were hit hardest (especially dentist’s offices). Employment recovery will
depend on how quickly providers can return to normal patient loads. AEDC expects health employment to recover and
show some further growth over the forecast period. How COVID-19 might reshape the health care landscape over the
long-term is unclear. However, the pandemic has illustrated the need for more robust public health infrastructure. Meeting
that need could drive growth in health care sector employment. Other forces shaping health employment over the next
few years include population trends, State funding for Medicaid, IHS funding, and a range of other factors.

Health care employment outlook: 2019: 20,893, 2020: 20,000, 2021: 20,500, 2022: 20,800, 2023: 21,000

Construction employment averaged 7,653 jobs in 2019 (peaking at just over 8,900 jobs in August), 192 jobs above the
2018 average and 488 jobs above 2017. Growth was slowing by the end of 2019, with employment in December 200 jobs
lower than December 2018. That decline may reflect a tapering of repair-related construction activity connected with the
November 2018 earthquake.

Preliminary data indicates the construction sector did not experience any initial decline in employment because of the
pandemic. In fact, construction employment added 1,400 jobs between March and May 2020. However, the sector has not
seen its full seasonal surge in employment. The June estimate of 7,800 jobs is 900 jobs below June 2019.

The outlook for construction employment is uncertain. Federal funding for transportation infrastructure will continue to
support a foundation of construction activity. State capital project spending will remain weak, and residential construction
is likely to gradually slow in the absence of population growth. Demand for new commercial space is likely to be
substantially weakened by the pandemic. Demand for brick and mortar retail space is not expected to grow, nor will
demand for office space, as work-from-home becomes an ingrained part of many firms’ business models. AEDC expects
construction employment to recover somewhat but remain slightly below 2019 levels through the forecast period.

Construction employment outlook: 2019: 7,653, 2020: 7,000, 2021: 7,300, 2022: 7,500, 2023: 7,500

Leisure and hospitality employment increased for the second consecutive year in 2019, averaging 17,661 jobs, up
about 1.5% from the 2018 average of 17,394, and 2.3% from 17,261 jobs in 2017. Employment in food services and drinking
establishments accounts for two-thirds of the employment in this sector (11,712 jobs in 2019). Hotels and other lodging
places accounted for 3,546 jobs in 2019. Fitness centers, theaters, and a variety of other entertainment and recreational
sites account for the remainder of employment in this sector.

COVID-19 related shut-down of the economy hit this sector hardest. Between March and April, employment dropped
by 7,300 jobs, a decline of more than 40%. The loss included 1,900 jobs in lodging establishments and 4,100 jobs in eating
and drinking establishments. Approximately 1,200 jobs were added back in May, then another 1,400 jobs in June, however,
employment that month was still 5,900 jobs below the June 2019 level.

                                                              6
Employment in bars and restaurants will recover gradually, to the
extent COVID-19 concerns diminish, but a full return to pre-pandemic
employment levels is not anticipated within the forecast period. A fully
vaccinated population may be a requirement for restaurants to return to full seating capacity, and patrons to return in
pre-pandemic numbers. Meantime, many restaurants may not survive (several national chains and local restaurants have
already filed for bankruptcy protection).

Hotel employment will similarly be slow to fully recover, depending on how well the pandemic is managed. The strength of
the visitor industry is key, as is the convention/meeting market. It is unlikely all of Anchorage’s lodging establishments will
survive what is certain to be a prolonged period of constrained travel and tourism.

Leisure and hospitality employment outlook: 2019: 17,661, 2020: 12,500, 2021: 13,000, 2022: 14,000, 2023: 15,000

Transportation-related employment averaged 10,496 jobs in 2019, down slightly from 2018’s average of 10,531.
The largest components of this diverse sector of the economy include air transportation (3,293 jobs in 2019), truck
transportation (1,331 jobs), and “couriers and messengers” (mainly including UPS and FedEx) with 2,216 jobs. This sector
has been a stable source of employment in recent years, with modest growth through the recent recession.

This sector lost 600 jobs between March and April this year. Though specific data is not available, that loss was likely mainly
related to a sharp decline in air transportation as passenger traffic slowed to a trickle. There was some recovery in June,
when 400 jobs were added back, however the sector has not seen the usual seasonal increase in employment. June 2020
employment was 1,400 jobs below the June 2019 level.

The outlook for this sector is closely tied to the pace at which air travel returns to normal and recovery of the visitor
industry. Globally, damage done to the airline industry by the pandemic is unprecedented. Airlines are expected to
collectively lose $80 billion in 2020, the result of a 50% decrease in revenues. Revenues are forecast to rise next year, but
the industry is expected to lose another $16 billion in 2021.5 The well-being of Alaska Airlines is particularly important
to the state’s economy. First quarter 2020 passenger revenue was down $235 million from the same period in 2019 with
second quarter revenues expected to be even lower. Alaska Air Group received $992 million in CARES Act funding in April.

AEDC expects the transportation sector to gradually recover and return to pre-pandemic levels of employment by 2022.

Transportation employment outlook: 2019: 10,496, 2020: 10,000, 2021: 10,200, 2022: 10,500, 2023: 10,700

Government employment in Anchorage averaged 27,195 jobs in 2019, including 9,239 local government jobs, 9,695 state
government jobs, and 8,261 federal jobs (not including active duty military). Government employment was down a total of
275 jobs from 2018. The decline includes 143 state jobs, 123 local government jobs, and nine federal jobs. Anchorage has lost
a total of 3,300 government jobs since 2010. These have been relatively high-wage, mainly year-round jobs.

Longer-term trends include the loss of about 1,500 federal jobs over the past decade (a 16% drop). State government
employment hit a high point in 2014 and has since declined by 1,200 jobs (down 11%). Local government (including the
school district) is also down about 1,200 jobs (12%) from a 2014 high.

The military continues to have a stabilizing influence on the local economy, with more than 10,000 activity duty and 3,000
civilian personnel in Anchorage.

5
    International Air Transportation Association (IATA). https://www.iata.org/en/pressroom/pr/2020-06-09-01/
                                                                           7
The government sector has recorded relatively few job losses related to the pandemic. Federal employment has been
essentially flat through the first six months of 2020. State government dropped about 600 jobs between March and May, then
added back 100 in June. The data suggests that most or all that decline was at UAA. Local government employment started
trending down in March, and through May was down 700 jobs, with the school district accounting for much of those losses.

AEDC expects federal employment to hold steady through the forecast period. State government is more difficult to
predict, though on-going pressure to reduce state spending, built-in budget cuts at UAA, plus pandemic-related changes in
UAA enrollment and instructional delivery make employment growth unlikely. The outlook for local government will be
dependent on trends in school district funding and staffing. Overall, government employment should recover somewhat in
2020, but then hold steady after that.

Government employment outlook: 2019: 27,195, 2020: 26,000, 2021: 26,500, 2022: 26,500, 2023: 26,500

Oil and gas industry employment in Anchorage averaged 2,500 jobs in 2019, about equal to 2018. While the number
of workers directly employed by the oil and gas industry in Anchorage is lower than many other sectors of the economy,
its indirect impacts are substantial, particularly in professional and business services, construction, transportation, and
other sectors. Before stabilizing in 2019, oil and gas industry employment had been trending down, losing 1,000 jobs since
2015. Further decline was expected in 2020, mainly the result of BP’s departure from Alaska.

Preliminary 2020 data indicate oil and gas industry employment in Anchorage dropped by 500 jobs from March to June. A
combination of significantly reduced global demand for fuel and tensions between Russia and Saudi Arabia pushed oil prices
to historical lows in March. Though now back above $40 per barrel, prices remain well below pre-pandemic forecasts.

Looking ahead, oil price trends will be a key factor in the employment outlook. The outcome of Ballot Measure 1, the oil
tax initiative, will also influence oil industry spending and employment in Alaska.

AEDC expects an uptick in oil industry employment in 2021, then a leveling after that, at about the 2019 level of 2,500 jobs.

Oil and gas industry employment outlook: 2019: 2,500, 2020: 2,200, 2021: 2,500, 2022: 2,500, 2023: 2,500

All Other sectors in the Anchorage economy together accounted for about 29,700 jobs in 2019. This includes 7,675
jobs in financial activities, 4,880 jobs in wholesale trade, 3,184 jobs in information (mainly telecommunications), 2,070 in
manufacturing, and 5,438 jobs in other services. Among these sectors, manufacturing and wholesale trade have trended
higher, adding 165 jobs since 2015, including 147 new jobs between 2018 and 2019. Financial activities, information, and other
services have been trending down, together losing 1,600 jobs since 2015, with year-over-year losses continuing into 2019.

Pandemic-related losses in these sectors in 2020 have been modest. Manufacturing employment dipped by 300 jobs
between March and April before recovering fully and adding 200 more. Employment in the sector as of June was 300 jobs
below the same time in 2019. Employment in the information sector dipped by 400 jobs and remains about 400 jobs below
2019. Financial activity employment was down 200 jobs in April, regained that in June, but is still 300 jobs below 2019.
Wholesale trade lost 300 jobs this spring, added 200 back in June, and is currently about 200 jobs below 2019.

The pace and extent of recovery will vary from sector to sector, with some returning to growth trends and others
generally flat or resuming paths of gradual decline.

“Other sectors” employment outlook: 2019: 29,671, 2020: 29,000, 2021-2023: 29,500
                                                               8
SUMMARY
Anchorage entered 2020 with an expectation that the economy might finally begin adding jobs, after four consecutive
years of decline. An average of 149,945 jobs were recorded in 2019, representing a net decline from 2018 of only about
300 jobs (0.2%), the smallest annual decline since the recession began in 2015. Statewide, employment trends turned
positive in 2019 (showing an increase of 0.7%); hopes were high that Anchorage would follow suit in 2020.

The first pandemic-related employment cuts in Anchorage were in March, but the real damage was in April, when the local
economy shed about 16,000 jobs, the largest monthly decline in Anchorage’s history. Based on initial estimates from the
Alaska Department of Labor, the economy started adding jobs in May (up 2,900 jobs compared to the April job count) and
again in June (4,800 more jobs). The most recent available estimates are for June 2020, when (despite upticks in May and
June) Anchorage employment remained 16,000 jobs below the June 2019 level. Statewide, employment in June was down
37,700 jobs, compared to June 2019.

As detailed in the preceding sector-by-sector analysis, the pace and extent of recovery from the economic shock of
COVID-19 are uncertain. A range of public health, political, and economic factors will dictate how recovery unfolds. The
following table summarizes the sector level employment forecasts outlined above.

                        Anchorage Employment Forecast, 2019, 2020-2023
                                        2019
Sector                                              2020 Estimate         2021 Forecast     2022 Forecast   2023 Forecast
                                       Actual
Retail                                  16,512           15,500               15,800               15,800       15,800
Professional & Business Services        17,364           16,600               16,800               17,000       17,200
Health Care                             20,893           20,000               20,500               20,800       21,000
Construction                             7,653            7,000                7,300                7,500        7,500
Leisure & Hospitality                   17,661           12,500               13,000               14,000       15,000
Transportation                          10,496           10,000               10,200               10,500       10,700
Oil and Gas                              2,500            2,200                2,500                2,500        2,500
Government                              27,195           26,000               26,500               26,500       26,500
Other                                   29,671           29,000               29,500               29,500       29,500
Total                                  149,945          138,800              142,100              144,100      145,700
Change from 2019                                        -11,145               -7,845              -5,845       -4,245

                                   Source: ADOLWD (2019); McDowell Group estimates (2020-2023).

This analysis indicates Anchorage employment in 2020 will average about 11,000 jobs below the 2019 average. In 2021, the
economy will add 3,300 jobs, but remain about 7,800 jobs below pre-pandemic levels. Similarly, the economy will add 2,000
jobs in 2022 and 1,600 jobs in 2023 but remain about 3% below the 2019 average of about 150,000 jobs.

If 2020 does show an annual decline of 11,000 jobs, Anchorage will be 17,000 jobs below its peak employment of 156,000
in 2015. Employment in Anchorage will have dropped back to its lowest point since 2001.

                                                                  9
Among the many uncertain factors that might result in job growth in
                                                        Anchorage above or below this forecast, the following are key:

                                                        • Effectiveness of efforts to control coronavirus infection rates in Anchorage
                                                        (and avoid additional rounds of business closures)

   •    Timing and availability of coronavirus treatment and vaccine

   •    The timeframe over which extended unemployment benefits continue to be paid

   •    The timeframe over which moratoriums on evictions and foreclosures are maintained

   •    Availability of additional federal funding to support businesses, non-profits, and communities

   •    National and global economic conditions, especially the pace of recovery

   •    Recovery of Alaska’s visitor industry, particularly the cruise industry

   •    Oil prices, which will impact oil sector capital investment and tax revenue generated by the State of Alaska

   •    How the State of Alaska addresses its ongoing fiscal crisis

   Finally, the status of Anchorage’s labor force may influence employment trends. As noted elsewhere in this forecast, the
   local labor force has been steadily shrinking (losing 12,000 workers between 2014 and 2019, an 8% decline). Further,
   during the pandemic, many employees’ ability to continue working or increase working hours will be directly related to
   K-12 school operations and child day care availability, which are critical to Anchorage’s workforce. While the majority of
   Anchorage and Mat-Su licensed childcare facilities have reopened following closures at the beginning of the pandemic,
   many facilities are operating at about half of normal capacity. A sustained reduction in child day care availability could
   result in overall lower employment in Anchorage than would otherwise be the case.

                                            Anchorage Average Employment,
                                                      2008-2023

        2008    2009    2010    2011    2012    2013    2014    2015        2016   2017   2018   2019   2020      2021   2022    2023

               Source: Alaska Department of Labor and Workforce Development (2008-2019); McDowell Group Estimates (2020-2023).
Source: Alaska Department of Labor and Workforce Development (2008-2019); McDowell Group Estimates (2020-2023).

                                                                       10
ACKNOWLEDGEMENTS
Employment data cited in this analysis are drawn from two data sets managed by the Alaska Department of Labor and
Workforce Development (DOLWD) Research and Analysis Section: the Quarterly Census of Employment and Wages
(QCEW) and the monthly Civilian Employment Statistics (CES). QCEW data is available on a 6-month lag and is a
complete count of employment and wages by detailed sector. CES data are estimates available monthly for broad industry
categories. CES data is subject to revision. Without the work of DOLWD Research and Analysis Section staff, tracking
employment conditions in Anchorage and elsewhere in Alaska would not be possible.
11PERSONAL INCOME
Personal income describes the amount of money Anchorage residents receive, either from employment, investments,
business ownership, or government transfers like unemployment benefits. This metric is important to monitor as it offers
insight on how much money might be able to circulate in the local economy. It can be viewed as an index of potential
spending, with increases meaning more money available to be spent with local businesses, generate taxes to support local
government services, support the housing market, and in general generate economic activity.
Personal income has three components: salaries, wages, and proprietors’ income; investment earnings; and government
transfers. The first component is the largest and includes the cost of employer-provided benefits. The second category
includes earnings from financial investments, dividends, and returns from real estate ownership. The smallest of the
three categories of personal income is government transfer payments which include the Permanent Fund Dividend,
unemployment benefits, and Social Security payments, among others.
Personal income in Anchorage has grown in most years. While part of this growth is due to inflation, its key components
have outpaced inflation. Investment earnings have grown the fastest over the past decade, followed by government
transfers, and wages and proprietors’ earnings.
The pandemic is impacting personal income in important ways. Unemployment, business closures, and slower economic
activity will push the salaries, wages, and proprietors’ income category lower. Some of this decline will be offset through
increased unemployment benefits, federal stimulus checks, and government assistance to businesses.
The outlook for investment earnings is uncertain but leans negative due to deteriorating economic conditions. The
resiliency of the stock market and strength of local real estate will also shape this category, as well as ability for
entrepreneurs to adjust, realize opportunity, and grow business.
AEDC expects personal income to total about $19 billion in 2020, about 5% below 2019. The extent of federal
unemployment benefits will factor heavily in personal income over the reminder of 2020, along with other federal grant
and loan programs. In 2021, personal income should return to a slow growth trend (relative to 2020), continuing through
2023, largely matching the rate at which employment recovers in Anchorage.
• In 2018 (the most recent data available), Anchorage residents had a total of $19.4 billion in personal income, including
o Salaries, wages, and proprietors’ income (including benefits): $12.6 billion
o Investment income: $4.0 billion
o Government transfer payments (including the PFD): $2.8 billion
• In 2019, personal income for the entire state grew 3.8% compared to 2018. Government transfers led the three
categories with 5.8% growth. Salaries, wages, and proprietors’ income expanded 3.8%, and investment income grew 2.1%.
• The number of unemployed individuals in Anchorage rose from 6,800 to 20,000 between February and March 2020.
By April, about 19,500 individuals were receiving unemployment benefits which replaced about 68% of earnings for
recipients. The top three sectors individuals worked in prior to receiving unemployment benefits were food service,
trades, and health & social services.
12• About 900 Anchorage businesses received a portion of the $1.2 billion disbursed to Alaska businesses as part of
the federal Paycheck Protection Program in the second quarter of 2020. A variety of other federal, state, and local
programs have offered unprecedented support of Anchorage’s businesses and nonprofits.
• In April 2020, $126 million in state and federal unemployment benefits were paid to more than 48,200 Alaskans. This
included 19,500 Anchorage residents who received $51.7 million in benefits. The federal government’s temporary
weekly benefit of $600 week was in addition to the average state payment of $247 per week.
• Anchorage residents received their 2020 PFD in July instead of the typical payment date of early October. The
payment was accelerated in response to pandemic-related economic disruption. The 2020 PFD was $800, totaling
about $200 million to Anchorage residents.
Anchorarge Personal Income
Anchorage Personal Income
($Billion), 2008-2023
($Billion), 2008-2023
$20.1
$18.4 $19.0
$19.4 $20.1
$18.6 $19.4
$18.5 $18.6 $19.0 $19.2 $19.4 $19.6
$17.5 $17.8 $17.5 $18.4 $19.0 $18.5 $19.0 $19.2 $19.4 $19.6
$16.6
$16.6 $17.5 $17.8 $17.5
$15.6
$15.6$15.4
$15.4
2008
20082009
2009 2010
2010 2011
2011 2012
2012 2013
2013 2014
2014 2015
2015 2016 2017
2016 2017 2018
2018 2019
2019 2020
2020 2021
2021 2022
20222023
2023
Source: Bureau of Economic Analysis (2008-2019); McDowell Group estimates (2018-2022).
Source: Bureau of Economic Analysis (2008-2018); McDowell Group Estimates (2019-2023).
13ANCHORAGE INTERNATIONAL AIRPORT
The Ted Stevens Anchorage International Airport (ANC) has recently seen passenger volume decline sharply while cargo
volume has increased. Located less than 10 hours by air from most of the industrialized world, ANC has become the
busiest airport on the globe on some days over the past few months. (In normal times ANC is ranked 5th globally based
on annual cargo volume.)
The airport is a key asset to the Anchorage economy. According to research conducted in 2018, operations at ANC
support about 22,000 jobs, or about 1 in 10 jobs in the local economy.
AEDC is confident in the long-term success of the airport. ANC continues to attract private investment and operates as
Alaska’s primary aviation hub. A strategic global location and reliable operations will ensure that Anchorage airport retains
its important role in the US-Asia air cargo trade and a critical point of entry for Alaska’s visitor industry.
AIR PASSENGERS
Prior to the COVID-19 pandemic, passenger volume in 2020 was expected to exceed records set in 2019. This
expectation changed quickly as travel restrictions mounted and it became clear the airport would not see the usual
seasonal increase in visitor travel.
Passenger volume has recovered slightly from lows observed in the spring of 2020. But a meaningful return to pre-
pandemic levels is not possible until travel restrictions are eased and the visitor industry regains its footing. Longer-term,
Alaskans may travel less for recreation and entertainment should the recession persist, and business travel could remain
lower as companies become increasingly comfortable in virtual meetings.
AEDC expects 2020 passenger volume to be well below 2019 levels, with some improvement in 2021. Through 2023, AEDC
expects a rebound in traffic, though a return to pre-pandemic levels is unlikely within the forecast period.
• A record 5.76 million passengers used the airport in 2019, a 2.0% increase from 2018. About 2.87 million people
enplaned and nearly an equal amount deplaned.
• Passenger volume at ANC is subject to significant seasonality. In 2019, the June-August period (a quarter of the year)
accounted for 38 percent of total volume. February is typically the slowest month of the year, with volume about 60%
lower than summer months.
• Pandemic-related disruptions including travel restriction pushed total passenger volume down to 62,000 for May and
April 2020, an 85% reduction from the same period in 2019.
• Airlines have struggled with much lower passenger loads due to COVID-19. The average passenger plane landing at
ANC in May 2019 had 129 passengers aboard; in May 2020 the average was 35 passengers.
• Passenger airplane landings are lower due to the pandemic. ANC received 1,272 passenger planes in May of 2020, a
66% reduction from the same month in 2019.
14ANC Air Passenger Volume (Million Passengers),
2008-2023
5.65 5.76
5.34 5.50 5.51 5.47
5.08 5.09 5.19 5.0
4.86 4.95 4.96
4.5
3.3
2.3
2008 2009 2010 2011 2012 2013 2014 2015 2016 2017 2018 2019 2020 2021 2022 2023
Source: State of Alaska Department of Transportation & Public Facilities (2008-2019); McDowell Group estimates (2020-2023).
Source: State of Alaska Department of Transportation & Public Facilities (2008-2019); McDowell Group Estimates (2020-2023).
AIR CARGO
Unlike passenger volume, the pandemic has boosted air cargo volume at the airport. Until March of this year, air cargo was
on a generally stable trajectory, with some expectation of slow growth in the near-term. These expectations shifted quickly
as cargo plane landings spiked, leading to a strong increase in cargo volume.
Roughly half of air cargo transported directly between the US and Asia (bypassing Anchorage) is in the belly of passenger
planes. As passenger planes were grounded due to the pandemic, this cargo shifted to dedicated air cargo flights which
are much more likely to refuel in Anchorage, driving Anchorage volumes higher. Urgent movement of personal protective
equipment also supported increased air cargo volume.
The increase in air cargo volume at the airport is not anticipated to be permanent. AEDC anticipates a return to typical
levels by the end of 2020 or early 2021, then generally matching global rates of economic growth through 2023.
• Cargo volume totaled 3.0 million tons in 2019, a 2.5% decline from 2018.Volume transiting the airport to other
markets totaled 1.5 million tons while 0.7 million tons were enplaned, and an equal amount deplaned.
• Through the first half of 2020, cargo volume was up 7.4%, including a 14.5% increase in the second quarter, compared
to the same period in 2019.
• Second quarter 2020 air freight totaled 900,000 tons, topping the previous high of 824,000 tons in the fourth quarter
of 2017. The spike occurred as freight typically carried in the belly of trans-Pacific passenger jets was diverted to air
freighters.
• Trade disputes have the potential to impact air cargo at the airport. Approximately one in four cargo planes that land
at ANC originate in China, according to a 2019 estimate.
15• Bollore Logistics estimates year-over-year global air cargo capacity is about 30% lower in July of 2020, due primarily to
reduced passenger flights (which often carry freight in the aircraft belly).
• The Asia to North America air corridor is the busiest on the globe with about four-in-five planes traveling the
corridor stopping at ANC.
• The number of cargo planes landing in Anchorage increased 41% in May 2020 compared to May 2019, nearly reaching
5,000 landings for the month. An average of six air cargo planes landed at ANC every hour in May.
• Cargo volumes at ANC fell sharply during the 2008/2009 recession and never recovered to pre-recession levels. While
that experience may not repeat itself, it does offer perspective on how ANC might be affected by global recession.
ANC Air Cargo Volume
(Million Tons), 2008-2023
3.01 3.08 3.00 3.1 3.0
2.80 2.80 2.92 2.81 2.8 2.9
2.70 2.70 2.75
2.60
2.20
2008 2009 2010 2011 2012 2013 2014 2015 2016 2017 2018 2019 2020 2021 2022 2023
Source: State
Source: State of Alaska
of Alaska Department
Department of Transportation
of Transportation & Public
& Public Facilities Facilities
(2008-2019); (2008-2019);
McDowell McDowell
Group estimates Group Estimates (2020
(2020-2023).
16PORT OF ALASKA
The Port of Alaska (POA) is Alaska’s most capable and important marine freight infrastructure asset. Refined petroleum products,
cement, consumer goods, construction materials and other supplies handled by the port are distributed throughout the state.
The Port has proven resilient and reliable through the pandemic crisis. No sailings were canceled, and the flow of goods was
smoothly maintained. Before the pandemic, AEDC had expected port volume to grow modestly in the coming years.
The outlook now is for lower total tonnages this year and next, then some growth in 2022 and 2023.
Two key factors are expected to drive port volume in the near-term: population trends and airport activity.The population of
Anchorage and the Railbelt requires a steady flow of consumer goods, construction supplies, and durable goods such as appliances
and ATVs. A growing population will support growth of volume at the port while a shrinking population is likely to reduce volume.
POA handles around one half to two-thirds of all jet fuel used at the Ted Stevens Anchorage International Airport (ANC).
As airport activity rises or falls, the petroleum component of port tonnage is impacted. Evidence of this relationship has been
on display in 2020 as strong air cargo activity at the airport has pushed petroleum volume at the port higher.
Other factors such as the severity of recession, competition with other Southcentral ports, and capital spending by private
enterprise and government will also impact port volumes.
• POA volume in 2019 totaled 4.34 million tons, a 9.9% increase from 2018 and the highest volume since 2008. In 2019,
2.6 million tons of refined petroleum were handled by the POA, the largest category, totaling 59% of all tonnage.Vans,
flats, and containers contributed 1.7 million tons (38% of the total). Other volume (mainly cement) accounted for the
remaining three percent of volume.
• Through the first half of 2020, volume at the port is slightly higher (1.4%) than the same period in 2019. Airport-related
petroleum activity increased the category by 5.7%, balancing a 4.2% decline in vans, flats, and container volume.
• Airplanes used 644 million gallons of jet fuel at ANC in 2019, with volume climbing in 2020. May 2020 fuel consumption
totaled 73 million gallons, a 34% increase from the same month in 2019. The Port also handles all jet fuel used by Joint
Base Elmendorf-Richardson.
• Modernization efforts at the Port continue with work focused on the new Petroleum and Cement Terminal. Construction
will continue into the fall and renew next spring, with the facility becoming operational by late 2021.
Port of Alaska Volume (Million Tons), 2008-2023
4.37 4.34 4.30
4.14 4.10 4.20
3.96 3.95 4.00
3.80 3.75 3.78
3.41 3.46 3.50 3.50
2008 2009 2010 2011 2012 2013 2014 2015 2016 2017 2018 2019 2020 2021 2022 2023
Source: Municipality of Anchorage,
Source: PortofofAnchorage
Municipality Alaska (2008-2019); McDowell
(2008-2019); Group
McDowell Estimates
Group (2020-2023).
estimates (2020-2023).BUILDING PERMIT VALUES
AEDC expects Anchorage building permit values will total about $425 million in 2020, a reduction of about $26 million
from 2019. Continued uncertainty in state capital budgets and heightened instability related to the coronavirus pandemic
will likely reduce construction permitting activity through the latter half of 2020. However, strong building permit values
in the first half of the year will contribute to total permit values finishing the year above non-earthquake-related 2019
permitting. AEDC expects further decline in permitting values in 2021 due to low demand for new commercial (retail,
office, hotel) space. Key drivers of construction spending over the next several years will likely include municipal projects
such as construction of Anchorage’s new solid waste transfer stations and school repairs, and infrastructure improvements
funded by the federal government, including pandemic relief projects at Ted Stevens Anchorage International Airport and
Merrill Field.
Prior to the ongoing coronavirus pandemic, the trajectory of building permit values in Anchorage was positive. In 2019,
building permit values totaled $451 million, a 17% increase from 2018. Despite this increase, permitting levels have not
rebounded to pre-recession highs of above $600 million in 2013 and 2014.
• Nearly $30.0 million in building permits were related to earthquake repairs, almost half of the total increase between
2018 and 2019.
• Commercial projects typically account for the largest share of total permit value. In 2019, the category accounted for
$261 million or 58% of the total.
• The following large projects were permitted in 2019:
o Construction of the Maple Springs Senior Living facility valued at $20.3 million and the Medline Warehouse
valued at $19.4 million.
o Repairs valued at nearly $15.0 million to the KeyBank building in downtown Anchorage due to earthquake
damage.
o Ongoing construction of a new ambulatory surgery center valued at $9.4 million.
• Residential construction permits contributed $147 million to the total value, the highest since the statewide recession
began but an amount far below the decade high of $194 million in 2014.
• In 2019, the government category of building permit values increased slightly to $43 million, up from a 16-plus year
low of $35 million in 2018. Early data for 2020 indicates values were trending upwards from 2018 and 2019. Continued
uncertainty in state capital budgets would likely have a negative impact on construction in Anchorage. Improvements
to area schools continue to be an important source of Anchorage construction activity.
• Through March of this year, total permit values were significantly higher compared to the same period in 2019 ($98.0
million in 2020 compared to $67.4 million in 2019). Commercial permitting increased by $20.5 million compared
to the first quarter of 2019, a 66% increase in value. Government permitting increased by 75% to $21.6 million and
residential permitting was on par with activity in the same period of 2019.
18Despite significant uncertainty related to the coronavirus pandemic, Anchorage building permits have continued about
on par with 2019, with about $270.0 million in permitting through the week of July 17, a 2.6% increase from the same
period in 2019.6 While not included in the permitting data, at least one major Anchorage construction project, the $60
million redevelopment of the downtown bus depot into a mixed-use commercial and residential center, has been slowed
by complications due to the pandemic and other issues. While uncertain, the pandemic is likely to constrain construction
activity in the near term, and perhaps beyond that, depending on the pace of economic recovery.
Anchorage Building Permit Values
($Million), 2008-2023
$681
$631
$549
$499
$448 $467 $451
$432 $432 $422 $425
$395 $379 $400 $400 $400
2008 2009 2010 2011 2012 2013 2014 2015 2016 2017 2018 2019 2020 2021 2022 2023
Source: Municipality
Source: Municipality of Anchorageof Anchorage (2007-2019);
(2008-2019); McDowell
McDowell GroupGroup estimates(2020-2023).
Estimates (2020-2023).
Source: Municipality of Anchorage
6
Municipality of Anchorage weekly building permit summaries for 2020 included a December 2019 permit of $14.9 million related to the
KeyBank project which McDowell Group attributes to 2019 permitting activity. Figures from the report have been adjusted to reflect the
timing of this permit submission.
19AVERAGE SINGLE-FAMILY HOME SALES
Despite slight sales volume decreases, average single-family home prices in Anchorage were largely unchanged at about
$375,000 in 2019 compared to 2018. While the 2020 housing market began the year stronger compared to 2019, the
number of sales has since decreased, likely due to significant household financial uncertainty during (and after) the
coronavirus pandemic. Due to changing demand by price range, average prices of sold homes actually increased in the first
months of the pandemic. While lower migration into and out of Anchorage may slow housing sales activity, AEDC expects
single-family home sales prices to remain resilient through the last half of 2020, though total sales volume may be down.
• In the first quarter of 2020, average home prices and loan origination activity had rebounded from recession-period
lows in 2019. However, sales volume decreased by about 10% in the second quarter compared to the same period
in 2019.
• Foreclosures remained at low levels across the city in 2019, decreasing compared to the five-year average.
Foreclosures remained low in the first quarter of 2020. State and federal governments placed a moratorium on
property foreclosures during the coronavirus pandemic, with moratoriums lifted on July 1 and July 25, respectively.
Expanded unemployment benefits have likely helped newly-unemployed individuals make mortgage and rent payments.
If federal unemployment benefits expire and the moratorium on foreclosures is lifted, Anchorage can expect an
increase in foreclosures, as unemployment is expected to remain high as the pandemic continues.
• Mortgage rates in Alaska declined to about 4.1% in 2019 after increases in 2018. Nationally, mortgage rates have fallen
to historic lows (below 3%) during the pandemic.
Anchorage Average Single-family Home Sales
Price ($1,000), 2008-2020
$373 $375 $385
$359 $367 $366 $365
$337 $347
$326 $321 $329 $322
2008 2009 2010 2011 2012 2013 2014 2015 2016 2017 2018 2019 2020
This representation is based in whole or in part on data supplied by, and to the Subscribers of Alaska Multiple Listing Service, Inc. (AK MLS).
Information contained Note:
hereinThis representation
is deemed is based
reliable but in whole orData
not guaranteed. in part on data by
maintained supplied
AK MLSby,is and to own
for its the Subscribers
use and mayofnot
Alaska Multiple
reflect all Listing Se
Source: Alaska Multiple Listingreal estateInc.
Service, activity in the market.
(2008-2019); McDowell Group estimate (2020).
Source: Alaska Multiple Listing Service, Inc. (2008-2018); McDowell Group estimate (2020).
20NEW HOUSING UNITS
Based on data through the first three months of the year, AEDC anticipates Anchorage will add about 420 housing units in
2020. With about 117,000 housing units in Anchorage, the annual rate of housing construction has hovered around 0.3%
for the last several years and multi-family units have composed about half of all new units. The level of construction activity
will be impacted if planned multi-unit projects are shelved due to the pandemic.
• In 2019, Anchorage added 345 housing units, roughly 90 units fewer than were added in 2018. Multi-family projects
accounted for 149 of these units while single-family homes contributed 185 units.16 mobile homes were added in 2019.
• New construction in the Mat-Su Borough held reasonably steady in 2019 at 807 units but added nearly double the
housing units compared to Anchorage. A much higher share of new housing in the Mat-Su are single-family residences
(82%) compared to Anchorage (54%).
Anchorage
Anchorage NewNew Housing
Housing
Units,
Units, 2009-2020
2009-2020
894 894
850 850
564 564 595 595
550 550 532 532
465 466
465 466
423 423 436 436 420 420
345 345
2009 2009
2010 2010
2011 2011
2012 2012
2013 2013
2014 2014
2015 2015
2016 2016
2017 2017
2018 2018
2019 2019
2020 2020
Source: Alaska Department of Labor and Workforce Development (2010-2018); McDowell Group estimate (2020).
Source:
Source: AlaskaAlaska Department
Department of Labor
of Labor and Workforce
and Workforce Development
Development (2009-2019);
(2009-2019); McDowell
McDowell Group Group estimate
estimate (2020)(2020)
Mat-Su
Mat-Su Borough
Borough NewNew Housing
Housing Units,
Units,
2010-2019
2010-2019
988 988 1005 1005
906929 929
906
750777 777 778 778 813 813807 807
750 729 729
2010 2010
2011 2011
2012 2012
2013 2013
2014 2014
2015 2015
2016 2016
2017 2017
2018 2018
2019 2019
Source: Source:Department
Alaska Department ofand
Labor and Workforce Development (2010-2019).
(2010-2019).
Source: AlaskaAlaska of Labor
Department of Labor Workforce
and Workforce Development
Development (2010-2019).VISITOR INDUSTRY
Until the COVID-19 pandemic hit Alaska in March 2020, Anchorage’s visitor industry was on a long-term growth
trajectory. Cruise passengers, in particular, were visiting Anchorage in ever-increasing numbers, fueled by strong growth
in the cross-gulf market. Indicators such as air traffic and tax revenues consistently showed increases, especially bed tax
revenues, which reflected a jump in room rates in addition to more guests.
The pandemic stopped the industry in its tracks, with virtually all cruises canceled, the highway borders with Canada
closed to all but essential travel, and tight restrictions for passengers arriving by air. While some Anchorage businesses
serving visitors were able to open on a limited capacity, such as hotels, bars, and restaurants, many others ceased
operations. Although the full impact was muted to a small degree by federal relief efforts, the industry shed thousands of
jobs and millions in wages in Anchorage in 2020.
The road to recovery is unclear. It depends on a variety of factors: the development of a vaccine and/or cure for the
virus, infection rates, nationwide and global economic conditions, and the confidence of the traveling public. It will also
be challenging for statewide and community destination marketing organizations to find the resources to promote their
destinations with reduced budgets. There is hope that Alaska’s vast spaces, outdoor opportunities, and perceived safety
will give the state an advantage over other destinations when people start traveling again. However, the dependence of
Anchorage (and the state) on the cruise sector is a challenge – of all travel modes, the American public now considers
taking a cruise as the riskiest of travel activities.7
After several years of increasing revenue, AEDC expects a significant drop in bed and vehicle/RV tax revenue. Both may
drop around 40% compared to the prior year, with larger declines possible.
Following are selected indicators, both pre- and post-COVID, for Anchorage’s tourism sector.
• Calendar year 2019 showed a 12.4% increase in bed tax revenue over 2018, growing from $27.8 million in 2018 to
$31.2 million in 2019.71 This followed a 7.0% increase in 2018.
o The first quarter of 2020, which started to be affected by the COVID-19 pandemic in March, showed an 18.0%
decrease from 2019.
• Visit Anchorage reports that hotel occupancy was up by 4.3% between 2018 and 2019, while the average daily hotel
rate (ADR) was up by 7.5%, and RevPAR (revenue per available room) was up 12% over the same period. 82
o The most recent period measured by Visit Anchorage and STR shows that occupancy in late June/early July 2020
was down 34% from 2019; ADR was down by 37%; and RevPAR was down by 57%.
• Anchorage car rental and rental RV tax revenues increased by 3.2% in calendar year 2019, on the heels of a 7.8%
increase in 2018.93
o Car and RV rental tax revenues were down by 5.3% in the first quarter of 2020.
7
Coronavirus Travel Sentiment Index, Destination Analysts, week of June 22. Question: “At this moment, how safe would you feel doing each
type of activity?” 77% of those surveyed said traveling on a cruise line was very or somewhat unsafe, the highest rate among 22 common travel
activities.
8
Municipality of Anchorage.
9
Visit Anchorage and STR.
22You can also read