Matching and Mismatching of Green Jobs: A Big Data Analysis of Job Recruiting and Searching - MDPI
←
→
Page content transcription
If your browser does not render page correctly, please read the page content below
sustainability

Article
Matching and Mismatching of Green Jobs: A Big Data Analysis
of Job Recruiting and Searching
Kyungho Song, Hyun Kim, Jisoo Cha and Taedong Lee *

                                          Department of Political Science & International Studies, Yonsei University, Seoul 03021, Korea;
                                          ecopower@yonsei.ac.kr (K.S.); hyunkim@yonsei.ac.kr (H.K.); wieder886@yonsei.ac.kr (J.C.)
                                          * Correspondence: tdlee@yonsei.ac.kr

                                          Abstract: Creating green jobs tackles two crises: the economic downturn and environmental degra-
                                          dation. Responding to the economic downturn, some governments have declared a “green new deal”
                                          to remedy unemployment and the economic crisis. Job creation has been suggested as a driving
                                          force for sustainable economic development and climate change action. However, the question of
                                          how many and what types of green jobs are required has not been systematically examined. Are
                                          green job openings and searches matching each other in terms of timing, sectors, regions, and salary?
                                          This study aims to explore the degree of matching between green job supply and demand using a
                                          big data analysis (BDA) of online job market recruiting services in South Korea from 2009 to 2020.
                                          The BDA of the Ecojob website reveals that green jobs are concentrated in Seoul and Gyeounggi-do
                                          metropolitan areas. The number of water- and air-quality-related jobs is high within these sectors.
                                          Job searches in the water quality sector outnumbered job openings. The findings imply that green job
                                          creation policy should reflect timing, regional, and sectoral demand and supply data. Creating and
                                          matching green jobs is expected to reduce environmental harm, enhance environmental quality, and
                                reduce unemployment.


Citation: Song, K.; Kim, H.; Cha, J.;
                                          Keywords: green job; green new deal; match and mismatch; job market; big data analysis
Lee, T. Matching and Mismatching of
Green Jobs: A Big Data Analysis of
Job Recruiting and Searching.
Sustainability 2021, 13, 4074.
                                          1. Introduction
https://doi.org/10.3390/su13074074
                                                Tackling two pressing crises—the economic downturn and climate change—is a
Academic Editor: Ermanno C. Tortia        complex and challenging task. Governments around the world have begun to initiate
                                          green recovery plans in the name of a green (new) deal. The concept of green recovery
Received: 3 March 2021                    is to boost the economy by spending government stimulus funds for climate change and
Accepted: 31 March 2021                   environmental causes [1]. Job creation in the green recovery has been a top priority for
Published: 6 April 2021                   providing income in green industries to reduce unemployment [2].
                                                The Korean Green New Deal Initiative, for instance, declared that KRW 42.7 trillion
Publisher’s Note: MDPI stays neutral      for a green transition of infrastructure and the energy sector would create 659,000 jobs
with regard to jurisdictional claims in   by 2025. The initiative proposed KRW 12.1 trillion for a green transition of infrastruc-
published maps and institutional affil-   ture to create 387,000 jobs, KRW 24.3 trillion for low-carbon and decentralized energy to
iations.                                  create 209,000 jobs, and KRW 6.3 trillion for innovation in the green industry to create
                                          63,000 jobs [3].
                                                Although this ambitious plan seems aimed at a sustainable future, the number of jobs
                                          is suggested in a top-down manner. There has been little effort to listen to what industries,
Copyright: © 2021 by the authors.         local governments, and job-seekers want for green jobs. Instead, the number of green jobs
Licensee MDPI, Basel, Switzerland.        has been calculated by multiplying money spent and employment induction coefficients.
This article is an open access article    This top-down manner may be easier for suggesting a large number. However, the problem
distributed under the terms and           is whether these suggestions are reflected in real supply and demand sides.
conditions of the Creative Commons              In the academic literature on green jobs, some studies have examined the driving
Attribution (CC BY) license (https://
                                          factors for green job numbers. Lee [1] suggested that U.S. states’ renewable energy regula-
creativecommons.org/licenses/by/
                                          tion policies, such as the renewable portfolio standards, are likely to reduce uncertainty in
4.0/).

Sustainability 2021, 13, 4074. https://doi.org/10.3390/su13074074                                        https://www.mdpi.com/journal/sustainability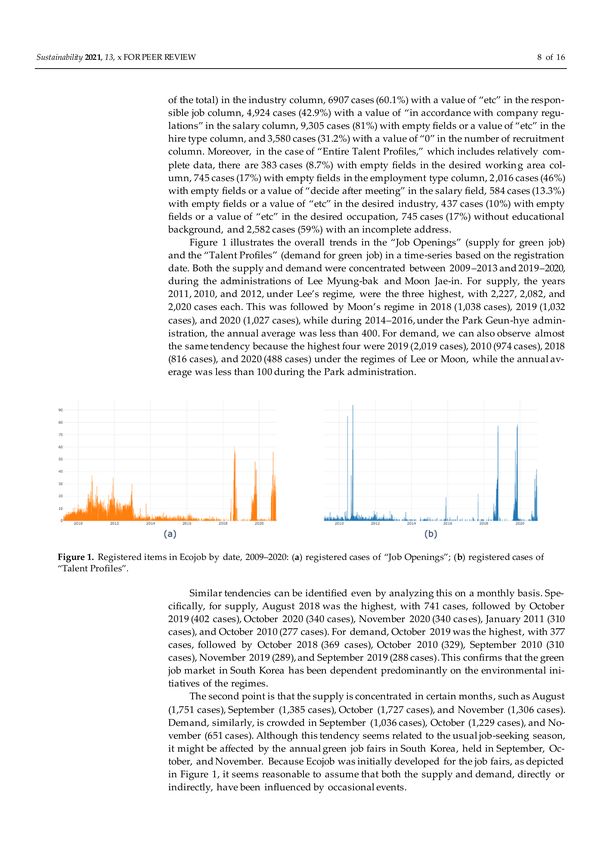
Sustainability 2021, 13, 4074                                                                                             2 of 15

                                the energy market and policy environment and thus create clean energy jobs [4]. Having
                                sustainability-related research centers and departments in higher education institutes is
                                likely to provide job training and create green jobs in U.S. metropolitan areas [5]. Yi [2] also
                                suggested that renewable energy policy adoption and the presence of clean energy business
                                associations are the major driving forces for green business in U.S. states [6]. The govern-
                                ment’s expenditure package, such as the American Recovery and Reinvestment Act, can be
                                essential to creating clean energy jobs [7]. Jung [4] critically evaluated the South Korean
                                government’s green job policies as “weak ecological modernization, relatively stressing
                                economic growth and excluding citizen participation” [8]. Despite the extant literature on
                                green jobs, the question of how many and what types of green jobs are requested has not
                                been fully answered yet. Furthermore, a big data analysis (BDA) of green jobs has been
                                rarely considered.
                                     In filling this gap, this study aims to explore the supply and demand of green jobs
                                using a BDA of a green job recruiting website. BDA of online green job market services is a
                                novel approach. Explorative research contributes to the literature in providing a review of
                                job match and mismatch studies, the empirical analysis of green job demand and supply,
                                and policy suggestions to respond to green job matching in reality.
                                     Accordingly, Section 2 reviews the green job literature to review matches and mis-
                                matches of green job supply and demand. Section 3 empirically analyzes collected big data
                                with regional and sectoral dimensions, illustrating the time-series and cross-sectional dis-
                                tribution of green job supply and demand. We also present the matches and mismatches of
                                green job openings and search regarding regional and sectoral dimensions. The Discussion
                                and Conclusions section concludes the study and provides policy suggestions to facilitate
                                matches in green job supply and demand and creation.

                                2. Concept and Mismatching in Green Jobs
                                2.1. Concept of Green Job
                                      The “green job” concept has gained rhetorical prominence in the last two decades
                                globally, and its popularity is growing in the economic recession caused by the unprece-
                                dented COVID-19 pandemic. In stark contrast to this global popularity, nations have not
                                reached a definitional consensus regarding what constitutes a “green job.” As OECD’s
                                2012 survey reveals, each nation adopts a slightly different statistical definition of “green
                                job” [9]. This definitional difference, however, should not cause us to think that the concept
                                of green jobs itself is controversial because it does not represent fundamental dissension on
                                what a green job is. Rather, it only signifies competing interpretations of the basic concept
                                of a green job.
                                      The concept of green jobs suggested by the United Nations Environment Programme
                                (UNEP) can be regarded as the primary one. In its 2008 report, UNEP, urging all nations
                                to adopt a nationwide policy to boost green jobs, describes green jobs as “those that
                                contribute appreciably to maintaining or restoring environmental quality and avoiding
                                future damage to the Earth’s ecosystems” [10]. Even though universal agreement on the
                                statistical definition has not been reached, in principle, the various definitions of green jobs
                                do not deviate from UNEP’s basic concept as expressed in their report. Their divergence
                                only reveals disparate interpretations of this basic concept for statistical measurement. It is
                                expressive of competing conceptions of green jobs, not the concept itself.
                                      Some countries, such as Austria and Japan, interpret the basic concept of green jobs
                                in a narrow sense by adopting only the “industry approach,” which identifies green jobs
                                with employment in industries that are judged to produce green goods and services [9].
                                According to this approach, suggested initially by Eurostat [11], green jobs correspond
                                to jobs involved in production in the Environmental Goods and Service Sector (EGSS).
                                In contrast, South Korea’s definition of green jobs, despite taking an industry approach
                                similar to that of Austria and Japan, differs slightly. The environmental goal of “low
                                carbon growth” is explicitly inserted, and more detailed methods to achieve the goal are
                                enumerated. Therefore, it is defined as the jobs involved in producing goods and services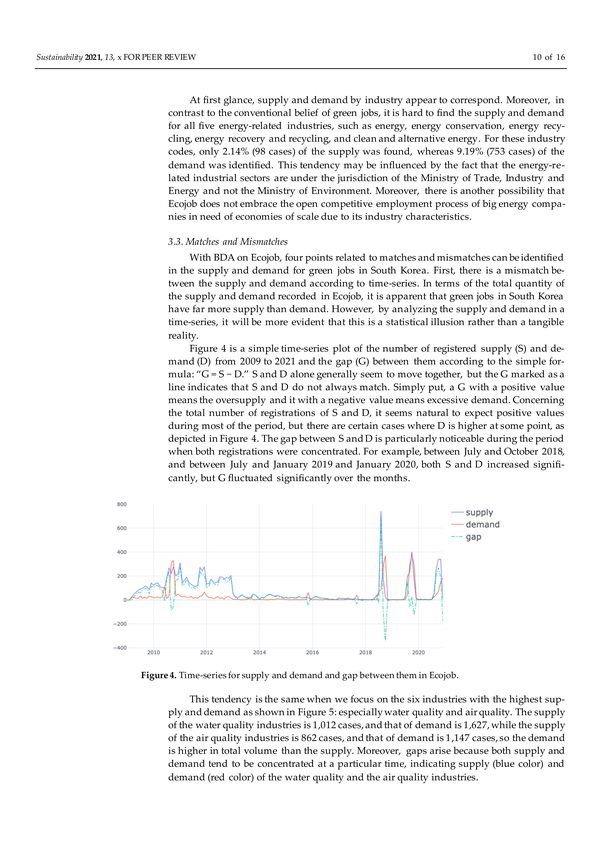
Sustainability 2021, 13, 4074                                                                                            3 of 15

                                that contribute substantially to “low carbon growth” by achieving higher energy efficiency
                                across the board and improving the environment [9].
                                     Germany, the U.S., and the E.U. capture the concept of green jobs broadly by adding
                                other approaches. In the U.S., the Bureau of Labor Statistics (BLS) takes two approaches,
                                output and process, to define the concept. The former is almost the same as the industry
                                approach because it identifies green jobs as the jobs associated with business establishments
                                that produce green goods. The latter deals with the jobs related to business establishments
                                that adopt environmentally friendly production processes and practices [9]. Germany
                                focuses on a different aspect, which is still ignored by the U.S. process approach: environ-
                                mental activities such as environmental consultants, planning and administration, nature
                                and landscape conservation. Therefore, in the German case, green jobs are defined as
                                employees who (1) produce environmental goods and services and (2) are involved in
                                environment-related activities [9]. Similarly, although different in specifics, the E.U. adds a
                                “transformation” approach instead of environmental activities [12].
                                     Consequently, the definition of green jobs varies by nation. Some focus on the output,
                                others on the process, and others on transformation. However, their difference lies in
                                how to interpret jobs that contribute to the improvement of the Earth’s ecosystems, not
                                the concept itself. Definitional inconsistency occurs due to different interpretations of
                                the concept, which is related to each nation’s statistical or policy purpose. Accordingly,
                                a definition that has been adopted most often by previous studies is that based on the
                                industry/output approach.

                                2.2. Green Job’s Double Dividend
                                      The green job literature has focused primarily on examining a variant of the double
                                dividend thesis. Originally, “double dividend” was a term used to describe the dual
                                benefits of environmental tax, referring to the idea that environmental taxes can ameliorate
                                environmental quality while reducing the general economic costs related to the tax system
                                by simultaneously employing the tax revenue produced to substitute for other distortionary
                                taxes [13,14]. In this sense, government intervention in the form of taxation can produce a
                                double dividend.
                                      Around 2008, international organizations, governments, and various interest groups
                                appropriated this double dividend argument to advocate for government action to promote
                                green jobs, arguing that green job policy could improve the environment and expand job
                                growth simultaneously. UNEP touted green jobs as “a key economic driver” and “a major
                                stimulus for much-needed employment” [10]. In its 2008 report, Current and Potential Green
                                Jobs in the U.S. Economy, the U.S. Conference of Mayors opined that the advantages of
                                investing in the green economy include both economic benefits manifested in job and
                                income growth and a cleaner environment [15]. The Center for American Progress also
                                urged the government to adopt a green economic recovery program that could assist a
                                struggling economy and accelerate a long-term transformation to a low-carbon economy. In
                                tandem with this political rhetoric, several studies were conducted to examine the validity
                                of the new double dividend argument, primarily focusing on the green job potential of
                                the eco-industry.
                                      These studies analyze estimates of job creation potential in the eco-industry, using
                                primarily computer simulations and input–output modeling. After reviewing them, Bowen
                                cautiously summarizes their findings as follows: “climate-change policies in general and
                                renewable energy in particular can generate considerable extra employment,” implying
                                that green job policy could achieve double objectives [16]. However, other studies crit-
                                icize the green jobs double dividend argument, arguing that the green job literature is
                                based on mythologies about economics, forecasting, and technology [17,18]. Regarding
                                methodology, Morriss et al. identify dubious assumptions of input–output modeling that
                                cannot address the deadweight loss problem and net job calculations. In response to this
                                criticism, several subsequent studies examined job creation potential in eco-industry more
                                extensively [19–22].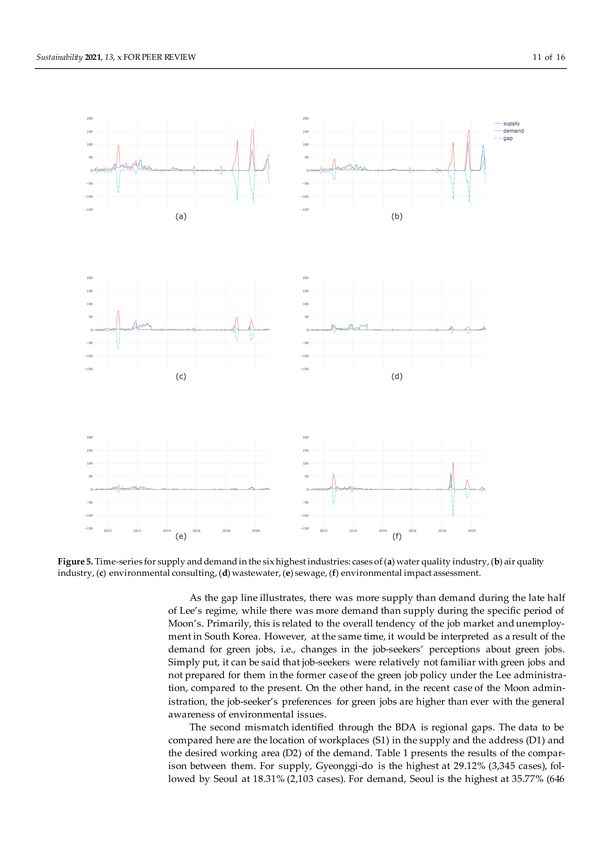
Sustainability 2021, 13, 4074                                                                                             4 of 15

                                      Furthermore, a group of researchers turned their attention from modeling studies to
                                an ex-post examination of implemented policies. In his review paper, Deschenes indicates
                                that by concentrating solely on determining job growth potential using a forecasting
                                methodology, previous studies ignored empirical evaluation of the employment effects of
                                green job policies. He also notes that this lack of empirical studies was due primarily to
                                “the limited availability of labor micro data with information on green jobs” [23].
                                      Empirical studies began in 2012 to address this academic research gap when the BLS
                                published its nationwide survey of green jobs in the U.S. for the first and, unfortunately,
                                only time. Pollack, based on this survey, finds that “greener industries grow faster than
                                the overall economy,” suggesting that green job policy could be vital in a job creation
                                strategy [24]. Yi, using cross-sectional job data from U.S. metropolitan areas, finds that state
                                and local clean energy and climate policies have moderately positive impacts on green
                                jobs [6]. Lee uses U.S. state-level panel data compiled by The Pew Charitable Trusts to
                                examine the employment effects of two generic policy tools. He finds that regulations
                                modestly increase the number of private-sector green jobs in states, whereas incentives
                                have a modest, negative effect [4].
                                      The green job literature has focused on examining the job growth potential of green job
                                policies using forecasting methodology or empirically evaluating the employment effects.
                                As a result, these studies try to determine whether green job policy can achieve its dual aim.
                                However, concerning green jobs becoming an engine of economic growth, it is necessary to
                                delve into another critical issue that has barely been explored—green job mismatches.

                                2.3. Mismatches in Green Jobs
                                     The idea of a job mismatch, referring to a mismatch between the workers sought by
                                employers and the preferences of job-seekers, is not uncharted territory in policy-oriented
                                studies. It was first identified by a group of economists in the 1970s to solve the puzzle of
                                the high unemployment rate in many European countries. Then, after the Great Financial
                                Crisis during the 2000s, scholarly interest in job mismatches was revived.
                                     Previous studies on job mismatches have paid attention primarily to mismatches
                                across occupations and geography (i.e., a poor match between the available occupations
                                and their location) and job-seeking workers’ occupational and geographic preferences,
                                aiming to demonstrate its effect on unemployment and economic productivity. Sahin et al.
                                examine mismatches across occupations and geographic areas in the U.S. labor market,
                                trying to determine their contribution to the rise in unemployment in the U.S. They find that
                                occupational mismatches are more serious for college graduates and, in the Western U.S.,
                                significantly affect the unemployment rate increase, whereas geographical mismatches do
                                not significantly contribute to the rise in unemployment [25].
                                     Marinescu and Rathelot draw a similar conclusion in their study to determine the
                                level of geographic mismatches in the U.S. They exploit data from the online employment
                                website CareerBuilder.com, arguing that geographic mismatches remain relatively low in
                                the U.S. and a minor driver of aggregate unemployment [26]. Herz and van Rens elaborate
                                on previous findings, adding a new explanation to the cause of mismatches in the U.S.
                                They argue that occupational mismatches in the U.S. account for approximately 13 percent
                                of unemployment and that barriers to job mobility, not worker mobility, are the primary
                                drivers of job mismatches [27].
                                     Regarding the effect of job mismatches on economic productivity, two studies are no-
                                table. Patterson et al. tackled the U.K. productivity puzzle by expanding the methodology
                                of Sahin et al. [25], developed initially to gauge unemployment mismatches and evaluate
                                the impact of job mismatches on output and labor productivity. They find that occupational
                                mismatches produced a cut in both employment and output, accounting for approximately
                                two-thirds of the departures from trend-growth in U.K. labor productivity since 2007 [28].
                                In contrast, Turrel et al., in their counter-factual simulations for the U.K. economy and using
                                a new dataset of online job advertisements, provide different findings. They argue that the
                                contributions of occupational mismatches to weak output and productivity growth since
Sustainability 2021, 13, 4074 5 of 15
the Great Financial Crisis were not significant, whereas resolving geographic mismatches
between 2008 and 2015 could have boosted output and productivity, putting them in line
with their pre-crisis tendencies [29].
Notwithstanding conflicting opinions on some specific issues, the job mismatch liter-
ature reveals the general consensus that job mismatches are critical to increasing unem-
ployment and dampening labor productivity. Consequently, they should be considered
during policymaking. This finding from the job mismatch literature allows us to pose a
new research question that has not been duly addressed before in green job studies. As
explained above, green job studies have been primarily interested in demonstrating green
jobs’ promised economic performance. However, given the result of job mismatch studies,
they ignore one possibility, an implication of which could be serious enough to demand a
new research.
The established finding that job mismatches occur in the general labor market indi-
cates the possibility that occupational and geographic mismatches within the green labor
market could happen and may now be taking place. If mismatches in the green labor
market actually exist, this has an important implication for an economic performance. As
job mismatch studies show clearly, they would disturb labor productivity and increase
unemployment within the green job market. This also would be a serious challenge for poli-
cymakers. Some governments have declared a “green new deal” to remedy unemployment
and the economic crisis. However, if a considerable amount of green job mismatch exists,
it is evident that they could not obtain the expected policy result. In this case, green job
policy must be thoroughly re-assessed beforehand based on the comprehensive evaluation
of green job mismatches and their effect on the economy.
Then, what needs to be done first is to see if there exists a green job mismatch or not
and, if it does, to identify its characteristics and compare them by country. This needs to be
a research agenda among green job studies. However, until now, even basic research has
not been conducted in this area. That is, it has not been determined whether a green job
mismatch exists. Our study tries to open up a new field of research within green job studies
by tackling simple research questions, namely, “Is there a job mismatch?” and “If there is,
what are its characteristics?” To answer these questions, this study addresses the green job
market in South Korea in particular. During the last decade, the country has implemented
two bold green job policies, the latter of which is still ongoing. We empirically analyze
collected big data from Ecojob, which covers the last decade, paying primary attention
to regional, occupational, and salary dimensions. While regional and occupational mis-
matches have attracted much scholarly interest, salary mismatches—mismatches between
salary desired by job-seekers and salary paid by business—have not been explored in the
previous literature. However, given that low salary is usually one of the main reasons for
job mismatches in South Korea, we include this dimension in our analysis.
3. Big Data Analysis (BDA) of Green Jobs
3.1. Green Jobs in South Korea and the Ecojob Website
The issue of green jobs in South Korea has been mentioned extensively under gov-
ernmental concerns such as the Lee Myung-bak administration’s “Low-Carbon Green
Growth” of 2008 and the Moon Jae-in administration’s “Green New Deal” of 2020. In terms
of these government policies, South Korea’s green labor market has also been encouraged.
However, the overall tendency of the supply and demand for green jobs demonstrates that
it was concentrated on short-term events such as green or environmental job fairs, usually
organized by the Ministry of Environment. As a result, supply and demand for green jobs
(registered on the Ecojob website) crowded in a particular year or month imply a fractional
tendency toward green jobs in South Korea.
Ecojob (ecojob.re.kr, accessed on: 1 January 2021), the only (thus leading) online
job market platform that specializes in green or environmental jobs, is the most accurate
indicator of the overall status of green jobs in South Korea. Ecojob has been developed
and operated by the Korea Environmental Industry & Technology Institute (KEITI) underSustainability 2021, 13, 4074 6 of 15
the Ministry of Environment since 2009, immediately after the establishment of KEITI as
a part of the former President Lee’s “Low-carbon Green Growth” proclamation of 2008.
Until now, it has been functioning as the only green job-specialized online platform for
corporations and job-seekers.
For more details, because the website does not provide an overall history of which,
we tracked the main changes of Ecojob using the Internet Archive Wayback Machine
(archive.org/web/, accessed on: 28 December 2020). Ecojob, developed with the Active
Server Pages, was initially launched as a subdomain (www.ecojob.konetic.or.kr accessed
on: 1 January 2021) of the National Environmental Industry Technology Information
System (NEITIS) operated by KEITI, but soon had a separate domain (ecojob.re.kr accessed
on: 1 January 2021) that is currently being used. Between these changes, Ecojob had
provided several subpages, including the webpage for the Green Environmental Industry
Job Fair hosted by the Ministry of Environment (such as keiti.ecojob.re.kr accessed on:
1 January 2021 and jobfair.ecojob.re.kr accessed on: 1 January 2021). Furthermore, for the
most recent fair, the “2020 Online Environmental Jobs Fair” now has a separate domain
(www.ecojobfair.com accessed on: 1 January 2021); its direct connectivity with Ecojob is
reduced more than ever.
As of 2021, it includes many (sub-)categories on green job-related information, such as
“Job Openings” (by recruiters), “Human Resource Information” (by job-seekers), “Green
Job Fairs,” and “Education.” Under “Job Openings,” for the direct posting of a recruiting
company, the information is categorized into a subcategory named “Entire Recruiting Infor-
mation.” Ecojob also provides various subcategories searchable by urgency, business field,
and region, depending on the detailed descriptions of the recruitment. Ecojob also provides
additional subcategories for the “Job Openings”, which includes the recruiting information
from related agencies or small businesses and other online job market services such as
Job Korea (www.jobkorea.co.kr accessed on: 1 January 2021), Worknet (www.work.go.kr
accessed on: 1 January 2021), Saram-In (www.saramin.co.kr accessed on: 1 January 2021),
and Incruit (www.incruit.com accessed on: 1 January 2021). Because this is summarized
information through the APIs, not limited to green jobs, we decided to exclude these
recruitment data from our analysis.
This implies the current status of green job market in South Korea, which does not
have a concrete standard to classify or categorize what green jobs mean. As we have
already mentioned in Section 2.1 above, this definitional inconsistency is related to the
governments’ statistical or policy purpose. Many studies have been conducted since 2010
to classify and categorize green jobs based on the Korea Standard Industry Code (KSIC) and
the Korea Standard Classification of Occupations (KSCO), but it is still difficult to clarify
exactly which industries or occupations can be classified as green jobs in South Korea.
Ecojob also includes these classification codes for the industry and occupation in each set
of detailed recruitment information, but these are not fully specified and systematized.
In response to our inquiries to KEITI, the operator of Ecojob, on the qualification and
procedure to post recruit information, the hands-on manager of the website answered
that a company must go through a process to confirm whether it belongs to the environ-
mental industry. For environmental-related job positions in non-environmental industry
companies, however, because there are currently no standards or documents that certify
environmental industry companies, the Ecojob manager in charge will review and register
the recruitment information. This reconfirms the limits of green job categorization in South
Korea, which has not yet been classified, rather than a problem with Ecojob itself. Because
there are no clear criteria for green job recruitment yet, in contrast to its category name, the
“Entire Recruiting Information” of Ecojob does not include complete green job recruitment
information in South Korea.
Under “Human Resource Information” for the direct posting of a job-seeker, the
information is categorized into a subcategory named “Entire Talent Profiles,” with many
subcategories, such as “Silver Professionals,” “Professionals from Training Program,”
and “Professionals from Specialized Graduate School.” In contrast to “Entire RecruitingSustainability 2021, 13, 4074 7 of 15
Information,” registering one’s own human resource information does not require any
further verification procedures or qualifications other than real-name authentication for
membership registration on Ecojob. Whether it is an individual (job-seeker) or a company
(recruiter), in fact, it is necessary to sign in as an integrated web service member of the
KONETIC to use Ecojob. However, there is no specific indication of how the user’s
information is utilized other than integrated login.
Although the Ecojob site provides two primary methods for job-seekers, the online
job application and the email job application, the registered information of job-seekers
is needed only for the former. Thus, while those who fill in their “Talent Profile” can be
considered active job-seekers using the online job application function of Ecojob, they
cannot be considered the complete set of green job-seekers in South Korea. This is a limit
of the data we collected, but unfortunately, Ecojob and any other platforms in South Korea
do not provide the data of entire job-seekers for green jobs yet. Despite the fact that the
collected data only represent active job-seekers registered on Ecojob, and they cannot be
considered the complete set of green job-seekers in South Korea, we believe it is enough to
analyze the overall tendency of matches and mismatches of green jobs and thus this does
not undermine our main arguments in this research.
3.2. Basic Analysis of Ecojob Data
In this study, we collected and analyzed all the information of Ecojob categories, such
as “Entire Recruiting Information” (11,488 cases in total) and “Entire Human Resource
Information” (4376 cases in total), from 2009 to 2020. In detail, for web scraping and
crawling, we used the Python 3.7.9 program with the Jupyter Notebook Development
Environment, and we also used essential modules such as Requests, Beatutifulsoup, and
Pandas for data loading and analysis. The collected data for “Entire Recruiting Information”
have 23 columns, including the ID number, title, company name, industry, representative
name, company type, employee number, capital, responsible job, location of workplace,
occupation, hire type, salary, number of recruitment, experience, gender, educational
background, age, more details, registration date, expiration date, and collection date.
Moreover, the data for “Entire Talent Profile” have 19 columns including ID number,
title, name, telephone, mobile phone, email, homepage, address, desired working area,
employment type, desired industry, desired occupation, educational background, qualifica-
tions, veterans, disability, military service, and registration date. The last ID number of the
“Entire Recruiting Information” is 13,209, but 1721 cases without actual data are considered
as deleted or missing; thus, only 11,488 of them can be subjected to analysis. Similarly, the
last ID number of “Entire Talent Profiles” was 6862, but only 4376 cases are subjected to
analysis, except for 2486 cases deleted or missing.
Given that Ecojob has operated for 12 years (142 months) from March 2009 to December
2020, there were only 957 recruitments registered per year (average of 81 per month) and
365 talent profiles enlisted per year (average of 31 per month). Furthermore, although
we searched all the information available from Ecojob, there was a significant amount
of missing data, including instances of missing or incomplete elements. Under “Entire
Recruiting Information,” there are many columns with arbitrarily completed data. In the
worst case, most of the information is described in the “More Details” column, without the
related columns filled in. It is difficult to standardize the raw data. Therefore, in this study,
we decided to focus on a manageable part of the searched data, and not the raw data.
In more detail, in the case of “Entire Recruiting Information”, there are 3585 cases with
empty fields (31.2%) and 1006 cases (8.8%) with a value of “etc”(in sum, around 40% of the
total) in the industry column, 6907 cases (60.1%) with a value of “etc” in the responsible job
column, 4924 cases (42.9%) with a value of “in accordance with company regulations” in
the salary column, 9305 cases (81%) with empty fields or a value of “etc” in the hire type
column, and 3580 cases (31.2%) with a value of “0” in the number of recruitment column.
Moreover, in the case of “Entire Talent Profiles,” which includes relatively complete data,
there are 383 cases (8.7%) with empty fields in the desired working area column, 745 casesSustainability 2021, 13, 4074 8 of 15
(17%) with empty fields in the employment type column, 2016 cases (46%) with empty
fields or a value of “decide after meeting” in the salary field, 584 cases (13.3%) with empty
fields or a value of “etc” in the desired industry, 437 cases (10%) with empty fields or a
value of “etc” in the desired occupation, 745 cases (17%) without educational background,
and 2582 cases (59%) with an incomplete address.
Figure 1 illustrates the overall trends in the “Job Openings” (supply for green job)
and the “Talent Profiles” (demand for green job) in a time-series based on the registration
date. Both the supply and demand were concentrated between 2009–2013 and 2019–2020,
during the administrations of Lee Myung-bak and Moon Jae-in. For supply, the years 2011,
2010, and 2012, under Lee’s regime, were the three highest, with 2227, 2082, and 2020 cases
each. This was followed by Moon’s regime in 2018 (1038 cases), 2019 (1032 cases), and
2020 (1027 cases), while during 2014–2016, under the Park Geun-hye administration, the
annual average was less than 400. For demand, we can also observe almost the same
tendency because the highest four were 2019 (2019 cases), 2010 (974 cases), 2018 (816 cases),
and 2020 (488 cases) under the regimes of Lee or Moon, while the annual average was less
than 100 during the Park administration.
Figure 1. Registered items in Ecojob by date, 2009–2020: (a) registered cases of “Job Openings”; (b) registered cases of
“Talent Profiles”.
Similar tendencies can be identified even by analyzing this on a monthly basis. Specif-
ically, for supply, August 2018 was the highest, with 741 cases, followed by October 2019
(402 cases), October 2020 (340 cases), November 2020 (340 cases), January 2011 (310 cases),
and October 2010 (277 cases). For demand, October 2019 was the highest, with 377 cases,
followed by October 2018 (369 cases), October 2010 (329), September 2010 (310 cases),
November 2019 (289), and September 2019 (288 cases). This confirms that the green job
market in South Korea has been dependent predominantly on the environmental initiatives
of the regimes.
The second point is that the supply is concentrated in certain months, such as August
(1751 cases), September (1385 cases), October (1727 cases), and November (1306 cases). De-
mand, similarly, is crowded in September (1036 cases), October (1229 cases), and November
(651 cases). Although this tendency seems related to the usual job-seeking season, it might
be affected by the annual green job fairs in South Korea, held in September, October, and
November. Because Ecojob was initially developed for the job fairs, as depicted in Figure 1,
it seems reasonable to assume that both the supply and demand, directly or indirectly, have
been influenced by occasional events.
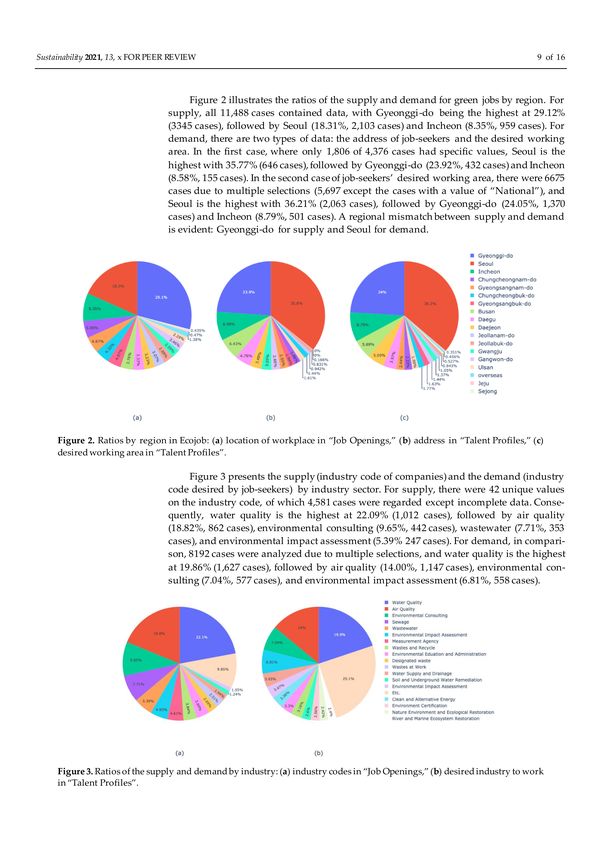
Figure 2 illustrates the ratios of the supply and demand for green jobs by region. For
supply, all 11,488 cases contained data, with Gyeonggi-do being the highest at 29.12%
(3345 cases), followed by Seoul (18.31%, 2103 cases) and Incheon (8.35%, 959 cases). For
demand, there are two types of data: the address of job-seekers and the desired working
area. In the first case, where only 1806 of 4376 cases had specific values, Seoul is the highest
with 35.77% (646 cases), followed by Gyeonggi-do (23.92%, 432 cases) and Incheon (8.58%,
155 cases). In the second case of job-seekers’ desired working area, there were 6675 casesSustainability 2021, 13, 4074 9 of 15
due to multiple selections (5697 except the cases with a value of “National”), and Seoul is
the highest with 36.21% (2063 cases), followed by Gyeonggi-do (24.05%, 1370 cases) and
Incheon (8.79%, 501 cases). A regional mismatch between supply and demand is evident:
Gyeonggi-do for supply and Seoul for demand.
Figure 2. Ratios by region in Ecojob: (a) location of workplace in “Job Openings,” (b) address in “Talent Profiles,” (c) desired
working area in “Talent Profiles”.
Figure 3 presents the supply (industry code of companies) and the demand (industry
code desired by job-seekers) by industry sector. For supply, there were 42 unique values
on the industry code, of which 4581 cases were regarded except incomplete data. Conse-
quently, water quality is the highest at 22.09% (1012 cases), followed by air quality (18.82%,
862 cases), environmental consulting (9.65%, 442 cases), wastewater (7.71%, 353 cases),
and environmental impact assessment (5.39% 247 cases). For demand, in comparison,
8192 cases were analyzed due to multiple selections, and water quality is the highest at
19.86% (1627 cases), followed by air quality (14.00%, 1147 cases), environmental consulting
(7.04%, 577 cases), and environmental impact assessment (6.81%, 558 cases).
Figure 3. Ratios of the supply and demand by industry: (a) industry codes in “Job Openings,” (b) desired industry to work
in “Talent Profiles”.
At first glance, supply and demand by industry appear to correspond. Moreover, in
contrast to the conventional belief of green jobs, it is hard to find the supply and demand
for all five energy-related industries, such as energy, energy conservation, energy recycling,
energy recovery and recycling, and clean and alternative energy. For these industry codes,
only 2.14% (98 cases) of the supply was found, whereas 9.19% (753 cases) of the demand wasSustainability 2021, 13, 4074 10 of 15
identified. This tendency may be influenced by the fact that the energy-related industrial
sectors are under the jurisdiction of the Ministry of Trade, Industry and Energy and not
the Ministry of Environment. Moreover, there is another possibility that Ecojob does not
embrace the open competitive employment process of big energy companies in need of
economies of scale due to its industry characteristics.
3.3. Matches and Mismatches
With BDA on Ecojob, four points related to matches and mismatches can be identified
in the supply and demand for green jobs in South Korea. First, there is a mismatch between
the supply and demand according to time-series. In terms of the total quantity of the supply
and demand recorded in Ecojob, it is apparent that green jobs in South Korea have far more
supply than demand. However, by analyzing the supply and demand in a time-series, it
will be more evident that this is a statistical illusion rather than a tangible reality.
Figure 4 is a simple time-series plot of the number of registered supply (S) and
demand (D) from 2009 to 2021 and the gap (G) between them according to the simple
formula: “G = S − D.” S and D alone generally seem to move together, but the G marked
as a line indicates that S and D do not always match. Simply put, a G with a positive value
means the oversupply and it with a negative value means excessive demand. Concerning
the total number of registrations of S and D, it seems natural to expect positive values
during most of the period, but there are certain cases where D is higher at some point, as
depicted in Figure 4. The gap between S and D is particularly noticeable during the period
when both registrations were concentrated. For example, between July and October 2018,
and between July and January 2019 and January 2020, both S and D increased significantly,
but G fluctuated significantly over the months.
Figure 4. Time-series for supply and demand and gap between them in Ecojob.
This tendency is the same when we focus on the six industries with the highest supply
and demand as shown in Figure 5: especially water quality and air quality. The supply of
the water quality industries is 1012 cases, and that of demand is 1627, while the supply
of the air quality industries is 862 cases, and that of demand is 1147 cases, so the demand
is higher in total volume than the supply. Moreover, gaps arise because both supply and
demand tend to be concentrated at a particular time, indicating supply (blue color) and
demand (red color) of the water quality and the air quality industries.Sustainability 2021, 13, 4074 11 of 15
Figure 5. Time-series for supply and demand in the six highest industries: cases of (a) water quality industry, (b) air quality
industry, (c) environmental consulting, (d) wastewater, (e) sewage, (f) environmental impact assessment.
As the gap line illustrates, there was more supply than demand during the late half
of Lee’s regime, while there was more demand than supply during the specific period
of Moon’s. Primarily, this is related to the overall tendency of the job market and unem-
ployment in South Korea. However, at the same time, it would be interpreted as a result
of the demand for green jobs, i.e., changes in the job-seekers’ perceptions about green
jobs. Simply put, it can be said that job-seekers were relatively not familiar with green
jobs and not prepared for them in the former case of the green job policy under the Lee
administration, compared to the present. On the other hand, in the recent case of the Moon
administration, the job-seeker’s preferences for green jobs are higher than ever with the
general awareness of environmental issues.
The second mismatch identified through the BDA is regional gaps. The data to be
compared here are the location of workplaces (S1) in the supply and the address (D1) and
the desired working area (D2) of the demand. Table 1 presents the results of the comparison
between them. For supply, Gyeonggi-do is the highest at 29.12% (3345 cases), followed
by Seoul at 18.31% (2103 cases). For demand, Seoul is the highest at 35.77% (646 cases),
followed by Gyeonggi-do at 23.92% (432 cases) for D1 and Seoul at 36.21% (2063 cases) and
Gyeonggi-do at 24.05% (1370 cases) for D2. Given that Ratio 2 of Table 1 excludes thoseSustainability 2021, 13, 4074 12 of 15
selected as “National” (14.7%, 978 cases), the percentages of Seoul and Gyeonggi-do as
desired working areas are reduced to 30.91% and 20.52%, respectively.
Table 1. Location of workplaces (S1) in supply, address (D1), and desired working area (D2) in demand.
Region S1 Ratio of S1 D1 Ratio of D1 D2 Ratio of D2
GyeongGi-do 3345 29.12% 432 23.92% 1370 24.05%
Seoul 2103 18.31% 646 35.77% 2063 36.21%
Incheon 959 8.35% 155 8.58% 501 8.79%
Chungcheongnam-do 581 5.06% 34 1.88% 133 2.33%
Gyeongsangnam-do 560 4.87% 46 2.55% 139 2.44%
Chungcheongbuk-do 496 4.32% 26 1.44% 101 1.77%
Gyeongsangbuk-do 468 4.07% 35 1.94% 93 1.63%
Busan 432 3.76% 116 6.42% 324 5.69%
Daegu 383 3.33% 86 4.76% 226 3.97%
Daejeon 371 3.23% 63 3.49% 290 5.09%
JeollaNam-do 353 3.07% 17 0.94% 60 1.05%
Jeollabuk-do 331 2.88% 15 0.83% 48 0.84%
Gwangju 298 2.59% 55 3.05% 78 1.37%
Gangwon-do 283 2.46% 48 2.66% 82 1.44%
Ulsan 263 2.29% 29 1.61% 113 1.98%
Oversea 158 1.38% 0 0.00% 26 0.46%
Jeju 54 0.47% 3 0.17% 20 0.35%
Sejong 50 0.44% 0 0.00% 30 0.53%
Total 11,488 100% 1806 100% 5697 100%
The supply is concentrated in Gyeonggi-do, while the demand is concentrated in
Seoul. The regional gap (R) is the largest in 1975 in Gyeonggi-do, while in Seoul, it was only
40, according to the simple formula “R = S1 − D2.” Except for Gyeonggi-do, in addition,
Incheon (458 cases), Chungcheongnam-do (448 cases), and Gyeongsangnam-do (421 cases)
had the most noticeable gaps in supply and demand. Given the geographical proximity
of Seoul and Gyeonggi-do, the mismatch or regional gap is not the most unlikely to be
resolved if job-seekers require some commuting time. Nonetheless, it is still problematic
that 47.43% of the total supply and 59.69% (D1) or 60.26% (D2) of the total demand are
concentrated in the Seoul metropolitan area, including Gyeonggi-do. This confirms that, for
green jobs, as with other jobs, there is a significant gap between the Seoul metropolitan area
and other regions. Especially, Daejeon, Busan, Gangwon-do, Gwangju, Gyeongsangnam-
do, and Jeju had low levels of both green job supply and demand over time.
The third mismatch is a gap by industry. As described previously, the supply and
demand registered in Ecojob are concentrated in specific industries. For example, 22.09% of
the entire supply (company’s industry code) and 19.86% of the entire demand (job-seekers’
desired industry code) are only for the water quality industry. As presented in Table 2, the
five industries with the highest supply and demand account for more than 50% of the total
supply and demand. However, with BDA alone, it is hard to provide a clear indication
of why there is more demand for particular industries, i.e., the industrial preference of
job-seekers. One possible hypothesis is that the tendency is related to the difficulty and
salary of industries. Considering that the degree of work difficulty may be different within
the same industry, further qualitative research is required to verify this. Moreover, the
correlation with salary will be examined in more detail below, but it also did not show
significant differences depending on the industry.
Table 2. Supply and demand for the four highest industries.
Sector Supply(S) Ratio of S Demand(D) Ratio of D
Water Quality 1012 22.09% 1627 19.86%
Air Quality 862 18.82% 1147 14.00%
Environmental Consulting 442 9.65% 577 7.04%
Wastewater 353 7.71% 217 2.65%
Environmental Impact Assessment 247 5.39% 558 6.81%
Sum 2916 63.65% 4126 50.37%Sustainability 2021, 13, 4074 13 of 15
Although the total registrations for “Entire Recruiting Information” (11,488 cases)
and “Entire Talent Profiles” (4376 cases) seem to indicate overall oversupply in green jobs,
the gaps between the supply and demand of the top five industries—water quality, air
quality, environmental consulting, wastewater, and environmental impact assessment—are,
respectively, −615, −285, −135, 296, and −482. They all had negative values, i.e., shortage
in the supply, except for the wastewater industry. This implies the undersupply of green
jobs in South Korea, especially those of popular industries, is in contrast to what is apparent
from the total numbers.
The fourth mismatch between supply and demand concerns the salary gap. Contrary
to our intuition that the difference between recruiters and job-seekers would be significant,
the level of salary offered by the supplier and the desired salary on the demand side did
not exhibit a significant difference. Figure 6 illustrates the maximum, minimum, and
median salaries registered by the supply and demand in the four major industries. The
median salary levels for supply and demand were KRW 27 and 28 million for water quality
and KRW 26 and 27 million for environmental consulting, respectively. The demand was
approximately KRW 1 million higher than the supply. However, for air quality, the two
were similar at KRW 28 million, and for wastewater, the supply was KRW 1 million higher
than the demand. The KRW 1 million in an annual salary is not a small amount of money,
but it seems hard to say that this is a significant mismatch between them. Thus, the salary
gap is a case of a minimal mismatch from the previous three.
Figure 6. Salary gap between supply and demand in the highest industries: (a) water quality, (b) air quality, (c) environmen-
tal consulting, (d) wastewater (unit: KRW 1 million).
Lastly, we would like to mention that the Ecojob data also include educational require-
ments and qualifications such as industry and occupational licenses in certain industries,
but they were excluded from the mismatch analysis mainly due to their irregularities.
Intuitively, we can see the certain level of mismatches between the supply and demand on
the requirements and qualifications, but regarding the above, it is hard to deal with the
current data set. We would like to carry out further research on this issue in near future.
4. Conclusions
Matching job supply with demand is challenging. Green jobs, which require a certain
level of expertise, may present unique job supply and demand in terms of timing, region,
sectors, and salary. However, it is critical to identify matches and mismatches of green job
supply and demand to reduce environmental harms and enhance sustainability through
jobs and business.
This study contributes to the literature on green jobs by highlighting the dimensions of
green job matches: timing, regions, sectors, and salary. By analyzing data from a green-job-
seeking website from 2009 to 2020, this study also finds that mismatches between supply
and demand occur across time, region, and sector. First, the time-series tendency of green
job demand confirms that government policy matters in creating green jobs. Two increases
in green job demand were associated with government initiatives for green growth from
2010 to 2012 and energy transition from 2018 to 2020. This tendency also poses the question
of how the government-led green new deal policy will impact green job growth after
2021. Second, a mismatch in sectors reveals that supply mostly exceeded demand inSustainability 2021, 13, 4074 14 of 15
water quality and air quality, while demand mostly exceeded supply in waste treatment
and environmental impact. Third, a mismatch is found in different regions. Job-seeking
exceeded job offers in Seoul. In 2020, job offers outnumbered job-seeking in Ulsan, Incheon,
and Jeollanam-do. Daejeon, Busan, Gangwon-do, Gwangju, Gyeongsangnam-do, and Jeju
had low levels of both green job supply and demand over time. Interestingly, the salary
from job supply and demand in various sectors matched. Across different sectors, salary
levels were similar. Market values for green jobs seemed to prevail.
These findings suggest policy implications. First, tracing matches and mismatches
of green job supply and demand is essential for providing information to businesses, job-
seekers, and governments. Sharing job-seeking information and providing an overview
of supply and demand in the recruiting website would help stakeholders in the green job
market. Second, with the match and mismatch information, central and local governments
can collaborate with local green businesses to foster environmentally friendly industries
and companies. Green new deal and job creation policies should be based on locally
available data. In addition, vocational education in high schools and colleges should
be tailor-made programs to cope with the environmental problems that local areas face.
Supporting green ventures and start-up companies would facilitate innovation and job
creation in local areas. Third, for comprehensive green job supply and demand data, Ecojob
should incorporate renewable- and energy-related job postings. In Korea, the Ministry of
Trade, Industry and Energy manages energy-related policies (including renewable energy)
and jobs. The Ministry of Environment manages conventional environmental industries,
including water, air, and waste management. If the job-seeking and hiring data could cover
all relevant jobs, the scope of the green jobs would be widely considered in the analysis.
Combining conventional and new green job data is imperative.
To extend our understanding of green jobs, first, studies on the causal mechanism for
green job matches and mismatches could be promising in the future. The BDA in this study
is descriptive. Scientific research on why there are matches and mismatches in regions,
sector, timing, and salary would shed light on future green job supply and demand studies.
Second, the prediction of job supply and demand matches and mismatches using a machine
learning process would provide valuable information for job-seekers, businesses, industry,
education institutes, and policymakers. Prediction would require more data collection,
well-designed feature extractions, and learning algorithms. Third, the expansion of BDA
on job supply and demand matching and mismatching in other sectors, such as information
and communication technology (ICT), would enhance our understanding of the job market.
Furthermore, BDA in other countries will provide comparative understandings of green
job supply and demand. Most countries have job recruiting websites. Collecting, data
processing, and analyzing job recruiting and seeking information would reveal matches
and mismatches in regions, sectors, timing, salaries, and the country-specific features. In
this comparative manner, we could understand general features as well as specific features
of green job distribution. Fourth, analyzing more nuanced elements such as job descriptions
and requirements would offer detailed information for stakeholders.
Author Contributions: Conceptualization, T.L. and H.K.; methodology, J.C. and K.S.; data curation
and visualization, J.C. and K.S.; writing—original draft preparation and writing, review and editing,
K.S., T.L., H.K., K.S. and J.C.; supervision, T.L.; funding acquisition, T.L. All authors have read and
agreed to the published version of the manuscript.
Funding: This research was funded by the National Research Foundation of Korea
(2019S1A5A2A01047251) and the Ministry of Environment (Research of Social Acceptance on 2050
Long-term Low Carbon Development Strategy) and conducted by big data analysis start-up company,
OurLocalPetitions.
Institutional Review Board Statement: Not applicable.
Informed Consent Statement: Not applicable.Sustainability 2021, 13, 4074 15 of 15
Data Availability Statement: The data are publicly available from ecojob.re.kr accessed on:
1 January 2021.
Conflicts of Interest: The authors declare no conflict of interest.
References
1. Lee, T. The Effect of Clean Energy Regulations and Incentives on Green Jobs: Panel analysis of the United States, 1998–2007.
Nat. Resour. Forum 2017, 41, 145–155. [CrossRef]
2. Yi, H. Green businesses in a clean energy economy: Analyzing drivers of green business growth in U.S. states. Energy 2014,
68, 922–929. [CrossRef]
3. Korean Government. Korean New Deal: National Strategy for a Great Transformation; Government of the Republic of Korea: Seoul,
Korea, 2020.
4. Jung, Y.-M. Is South Korea’s Green Job Policy Sustainable? Sustainability 2015, 7, 8748–8767. [CrossRef]
5. Lee, T.; van der Heijden, J. Does the knowledge economy advance the green economy? An evaluation of green jobs in the 100
largest metropolitan regions in the United States. Energy Environ. 2019, 30, 141–155.
6. Lee, J.-H.; Woo, J. Green New Deal Policy of South Korea: Policy Innovation for a Sustainability Transition. Sustainability 2020,
12, 10191. [CrossRef]
7. Lim, T.; Guzman, T.S.; Bowen, W.M. Rhetoric and Reality: Jobs and the Energy Provisions of the American Recovery and
Reinvestment Act. Energy Policy 2020, 137, 111182. [CrossRef]
8. OECD. Making the Green Recovery Work for Jobs, Income and Growth; OECD: Paris, France, 2020.
9. OECD. OECD Employment Outlook 2012; OECD: Paris, France, 2012.
10. United Nations Environmental Program (UNEP). Green Jobs: Towards Decent Work in a Sustainable, Low-Carbon World; UNEP:
Nairobi, Kenya, 2008.
11. OECD/Eurostat. The Environmental Goods and Services Industry: Manual for Data Collection and Analysis; OECD: Paris, France, 1999.
12. European Commission. European Employment Observatory Review: Promoting Green Jobs throughout the Crisis: A Handbook of Best
Practices in Europe 2013; European Commission: Luxembourg, 2013.
13. Pearce, D.W. The Role of Carbon Taxes in Adjusting to Global Warming. Econ. J. 1991, 101, 938–948. [CrossRef]
14. Goulder, L.H. Environmental Taxation and the Double Dividend: A Reader’s Guide. Int. Tax Public Financ. 1995, 2, 157–183.
[CrossRef]
15. U.S. Conference of Mayors. Current and Potential Green Jobs in the U.S. Economy; Global Insight, Inc.: Lexington, MA, USA, 2008.
16. Bowen, A. ‘Green’ Growth, ‘Green’ Jobs and Labor Markets; World Bank Policy Research Working No. 5990; World Bank: Washington,
DC, USA, 2012.
17. Morris, A.A.P.; Bogart, W.T.; Dorchak, A.; Meiners, R.E. Green Jobs Myths. Mo. Environ. Law Policy Rev. 2009, 16, 326–473.
[CrossRef]
18. Michaels, R.; Murphy, R. GREEN JOBS: Fact or Fiction? Institute for Energy Research: Houston, TX, USA, 2009.
19. Bowen, W.M.; Park, S.; Elvery, J.A. Empirical Estimates of the Influence of Renewable Energy Portfolio Standards on the Green
Economies of States. Econ. Dev. Q. 2013, 27, 338–351. [CrossRef]
20. Baer, P.; Brown, M.A.; Kim, G. The job generation impacts of expanding industrial cogeneration. Ecol. Econ. 2015, 110, 141–153.
[CrossRef]
21. Cecere, G.; Mazzanti, M. Green jobs and eco-innovations in European SMEs. Resour. Energy Econ. 2017, 49, 86–98. [CrossRef]
22. Aldieri, L.; Grafström, J.; Sundström, K.; Vinci, C.P. Wind Power and Job Creation. Sustainability 2020, 12, 45. [CrossRef]
23. Deschenes, O. Green Jobs; IZA Policy Paper No. 62; Institute of Labor Economics: Bonn, Germany, 2013.
24. Pollack, E. Counting up to Green; EPI Briefing Paper; Economic Policy Institute: Washington, DC, USA, 2012.
25. Şahin, A.; Song, J.; Topa, G.; Violante, G. Mismatch unemployment. Am. Econ. Rev. 2014, 104, 3529–3564. [CrossRef]
26. Marinescu, I.; Rathelot, R. Mismatch Unemployment and the Geography of Job Search. Am. Econ. J. Macroecon. 2018, 10, 42–70.
[CrossRef]
27. Herz, B.; van Rens, T. Accounting for Mismatch Unemployment. J. Eur. Econ. Assoc. 2020, 18, 1619–1654. [CrossRef]
28. Patterson, C.; Şahin, A.; Topa, G.; Violante, G.L. Working hard in the wrong place: A mismatch-based explanation to the UK
productivity puzzle. Eur. Econ. Rev. 2016, 84, 42–56. [CrossRef]
29. Turrel, A.; Speigner, B.; Djumalieva, J.; Copple, D. Using Job Vacancies to Understand the Effects of Labour Market Mismatch on UK
Output and Productivity; Staff Working Paper No. 737; Bank of England: London, UK, 2018.You can also read