GEP 2020-06 The Airbnb Rent-Premium and the Crowding-Out of Long-Term Rentals - Graz Economics P ap ers - GEP
←
→
Page content transcription
If your browser does not render page correctly, please read the page content below
Graz Economics Papers – GEP

                                                        GEP 2020–06

                               The Airbnb Rent-Premium and the
                              Crowding-Out of Long-Term Rentals

                              Robert J. Hill, Norbert Pfeifer, and Miriam Steurer
                                                             August 2021

                                                      Department of Economics
                                                   Department of Public Economics
                                                         University of Graz

                                         An electronic version of the paper may be downloaded
                                    from the RePEc website: http://ideas.repec.org/s/grz/wpaper.html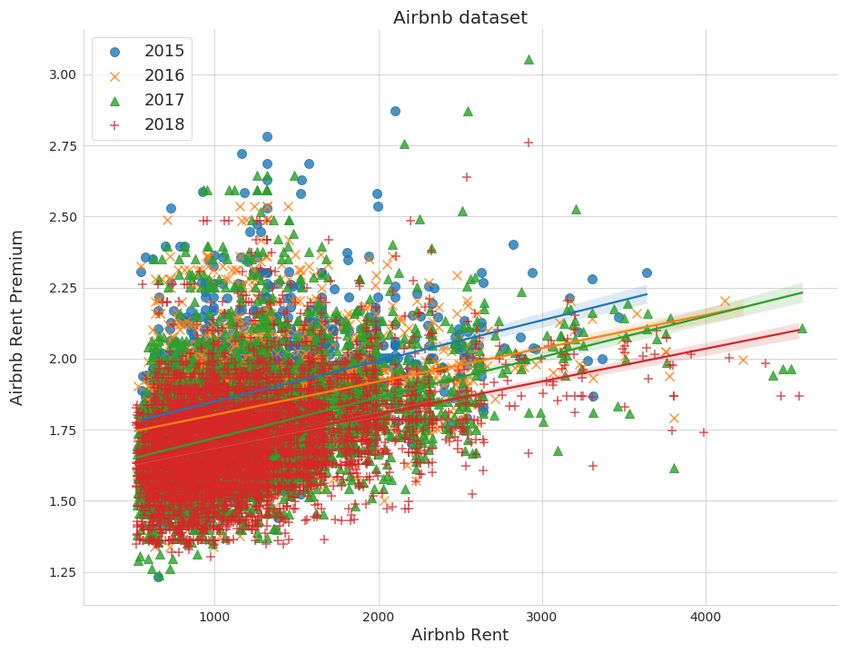
This is an updated version of GEP2020-06 originally posted on August 5, 2020.

  The Airbnb Rent Premium and the Crowding-Out of
                Long-Term Rentals
            Robert J. Hill, Norbert Pfeifer and Miriam Steurer
                        Department of Economics, University of Graz,
                        Universitätsstrasse 15/F4, 8010 Graz, Austria:
                 robert.hill@uni-graz.at, norbert.pfeifer@uni-graz.at,
                               miriam.steurer@uni-graz.at

                                             July 29, 2021

     Abstract:
     Concerns about crowding out of long-term rentals have led many cities to impose
     limits on the number of days per year that properties can be let via Airbnb or other
     short-term rental platforms. The effectiveness of such limits depends on the size of
     the Airbnb rent premium (i.e., how much more landlords can earn on Airbnb). We
     estimate these Airbnb rent premia for each of 170 000 Airbnb and long-term rental
     apartments in Sydney, Australia, using both hedonic and matching methods. The
     estimated premia on Airbnb apartments are not distorted by selection bias. We
     find that between 2015 and 2018, the Airbnb rent premium fell as Airbnb supply
     increased. Premia were fairly stable across neighborhoods, although larger and more
     expensive properties and those managed by owners of multiple Airbnb properties
     had higher premia. After adjusting for extra costs incurred by landlords on Airbnb,
     we find that, on average, tax-paying landlords break even after 220 days on Airbnb.
     A proposed 180-day per year Airbnb limit would therefore incentivize most landlords
     to prefer the long-term rental market. However, a much lower 138-day limit would
     be needed for tax-avoiding landlords. (JEL. C21; C43; L85; R31; R52; Z32)
     Keywords: Airbnb Rent Premium; Regulating the Sharing Economy; Hedonic
     Prediction; Characteristic Matching; Marginal landlord

We acknowledge financial support for this project from the Austrian Research Promotion Agency (FFG), grant
#10991131. We also wish to thank Chris Bollinger, Canh Thiem Dang, Don Haurin, and Masatomo Suzuki for
helpful comments. Drafts of this paper have been presented at the International Comparisons Conference at
University of Groningen, the AREUEA Conference at Bocconi University, the ERES Conference at the ESSEC
Business School, the SEM conference at Goethe University Frankfurt, the University of Tokyo & Hitotsubashi
Workshop on Economic Measurement and Activities, and at Amsterdam Business School.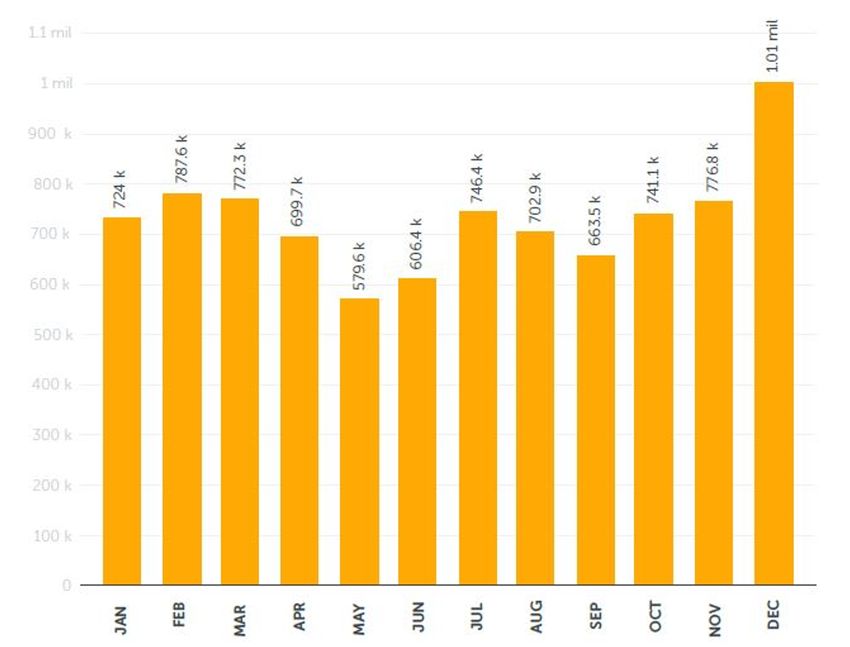
1         Introduction

The dramatic rise of Airbnb has led to concerns that landlords in cities around the world
are switching properties from the long-term rental market to Airbnb. For example, Combs,
Kerrigan and Wachsmuth (2020) estimate that in Canada 31 000 units have moved from the
long-term rental market to Airbnb. This reduces the supply of long-term rentals and pushes
up rents, potentially increasing inequality and causing resentment among local residents.1,2

To counteract the movement of long-term rentals to Airbnb, city councils have begun to
impose limits on the number of days per year a property may be rented out via short-term
rental platforms. For example, the maximum in Amsterdam is 30 days, in Munich 56 days
(i.e., 8 weeks), in New Orleans, San Francisco, London, Berlin, and Reykjavik it is 90 days,
in Los Angeles and Paris it is 120 days, in Tokyo it is 180 days (see the Airbnb help center
and Lagrave, 2018).3

We employ hedonic and matching methods to estimate individual Airbnb rent premia for prop-
erties in Sydney, Australia. In particular, we compute – at the level of individual properties
– the difference in income landlords can earn from renting out via Airbnb as compared with
the long-term rental market while controlling for differences in location and physical charac-
teristics of properties. In addition to providing an insight into how Airbnb returns depend on
the type of property, these Airbnb rent premia can also help city councils set effective limits
on Airbnb.

Sydney is a good choice for such a study, since it is one of Airbnb’s most penetrated markets,
and it has a very flexible long-term rental market, which makes it easy for landlords to “try
out” Airbnb.4 Currently the New South Wales state government is considering imposing a
    1
        There is a tendency for renters to be poorer on average. However, the extent to which this is true varies
considerably across countries (see Waltl, 2021).
   2
     While the covid-19 pandemic has severely hit the Airbnb market, it is likely that business-as-usual will
resume once the pandemic ends. Regarding covid-19’s short-run impact, Hu and Lee (2020) find that Airbnb
rentals of rooms in London are more affected than rentals of whole apartments.
   3
     New York has taken a different approach, banning short-term leases of less than 30 days on Airbnb unless
the owner is in residence in the same property.
   4
     The standard lease length in the Sydney rental market is either 6 or 12 months, after which each party

                                                         1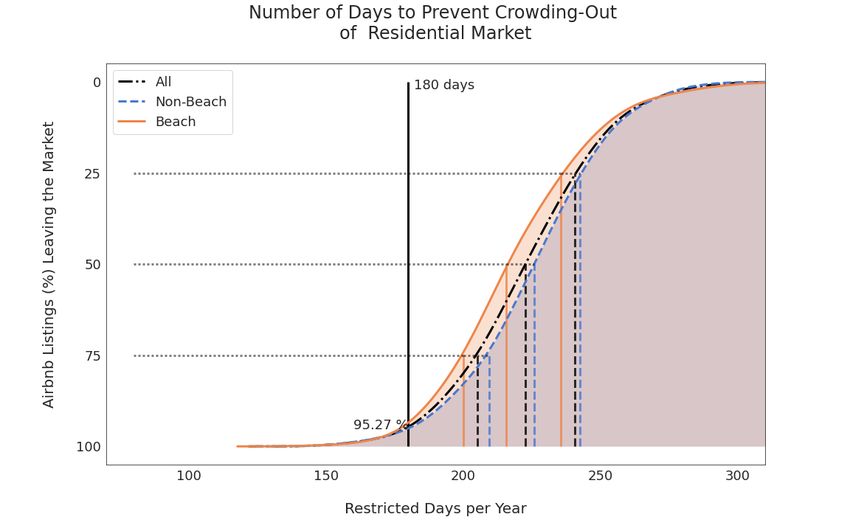
180 day limit on all short-term rentals in Sydney (see Davidson, 2019). The question is: is
this enough to protect the long-term rental market from encroachment by Airbnb?

We find that the average Airbnb rent premium in 2017 is 66 percent (adjusted for additional
costs of cleaning, utilities/internet, and furniture borne by Airbnb hosts), implying that the
average Airbnb landlord breaks even with the long-term rental market after 220 days. Our
results are based on 170 000 Airbnb- and long-term apartment rental contracts between 2015
to 2018 and are robust to the method used to measure the Airbnb rent premium (i.e. hedonic
or matching methods). Hence the 180-day limit currently considered in Sydney would provide
the average Airbnb landlord with an incentive to switch to the long-term rental market.

For tax-evading Airbnb landlords, however, the average break-even point lies at only 138
days. This difference is important since it is easier for Sydney landlords to evade tax on
Airbnb income than on long-term rental income. While all long-term rental contracts are
automatically lodged with NSW Fair Trading and are trackable by the Australian Tax Office,
so far, there is no agreement on information sharing between Airbnb and Australian tax
authorities.

Considering the whole cross-section distribution of Airbnb rent premia, we compute the
marginal property for which a landlord would be indifferent between the long-term rental
market and Airbnb with a 180-day limit. The results are striking. While with a 180-day
limit, tax-compliant Airbnb landlords would have an incentive to switch 95 percent of Airbnb
properties to the long-term rental market, tax-avoiding landlords would be incentivized to
switch only onehttps://de.overleaf.com/project/5d074b668d00cb75f46586e7 percent of their
properties. Thus, our results show how important it is to combine Airbnb day limits with
effective tax collection.

Besides our analysis of the effectiveness of a 180-day limit on Airbnb rentals in Sydney, we
also highlight a number of additional findings: (i) The Airbnb rent premium is higher for pro-
fessional Airbnb hosts (i.e., those that provide at least two properties via Airbnb); (ii) Higher
quality apartments, as well as bigger apartments, have higher Airbnb rent premia; (iii) The
can freely walk away from the rental contract.

                                                 2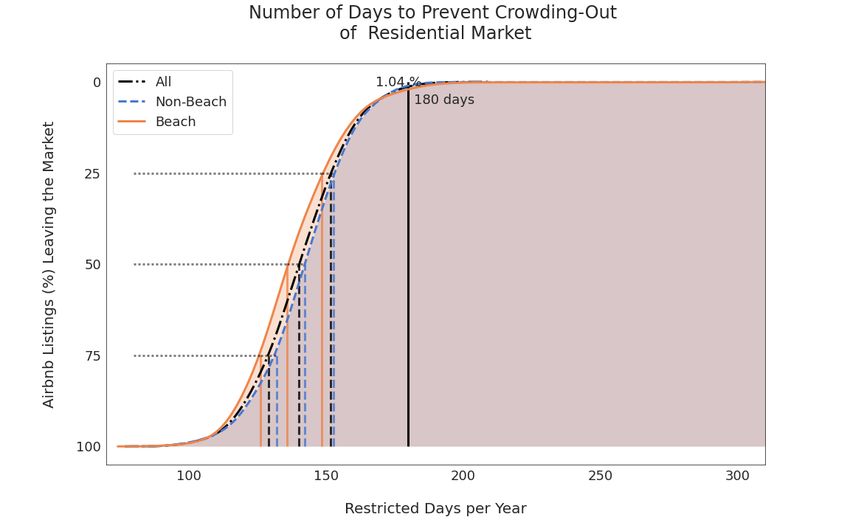
Airbnb rent premium declined between 2015 and 2018 while Airbnb supply rose during this
period; (iv) We show that quality adjustment matters since professional Airbnb apartments
are on average of higher quality than long-term rental apartments. (v) We illustrate that
selection into Airbnb does not distort the results of our hedonic analysis.

The remainder of the paper is structured as follows: Section 2 provides a brief literature review
on Airbnb. Section 3 describes the Airbnb and long-term rental datasets. The hedonic and
matching methods and our empirical findings are presented in section 4. The main conclusions
are summarized in section 5.

2         Existing Literature on Airbnb

Airbnb is part of the sharing economy that has revolutionized the short-term rental market
by acting as an intermediary for people looking to rent out living space, and those looking for
a place to stay. Its value comes from the large number of hosts and guests using its platform,
both paying a fee for each rental transaction. Airbnb was founded in 2007. There are now
4 million properties listed on Airbnb worldwide and over 800 million guests have stayed in
Airbnb properties.5 In December 2020 Airbnb was listed on the Nasdaq stock exchange. As
of July 21, 2021 it had a market capitalization of 84 billion US dollars.

Airbnb’s rapid expansion has raised concerns about how it is affecting house prices, rents and
the hotel industry. Airbnb’s impact on the hotel industry is investigated by Zervas, Proserpio,
and Byers (2017) and Coyle and Yeung (2018).

Most of the research on how Airbnb is affecting house prices and rents has focused on the
North American market. Combs, Kerrigan and Wachsmuth (2020) estimate that in Canada
31 000 units were removed from the long-term rental market due to Airbnb. Horn and Merante
(2017) assess the impact of Airbnb on the Boston rental market using a fixed-effects model
to control for unobserved variables. They estimate that a one standard deviation increase in
    5
        https://airbnb2020ipo.q4web.com/press-releases/news-details/2021/
Airbnb-Announces-First-Quarter-2021-Results/.

                                                 3
Airbnb-density in Boston over the period September 2014 to January 2016 reduced the number
of long-term rental offers by 5.9 percent and increased rents by about 0.4 percent. In the
most popular Boston Airbnb destinations, the effect on price was 3.1 percent. Sheppard and
Udell (2016) combine a hedonic model with a difference-in-difference approach to estimate the
impact of Airbnb’s market entry on house prices. They argue that, in New York, a doubling in
the number of Airbnb listings increases property prices by between 6 and 31 percent, depending
on the model specification (17.7 percent is their preferred estimate). And Barron, Kung and
Proserpio (2021) consider the impact of Airbnb on both rents and prices for the entire USA,
using an instrumental variable approach. They calculate that a 1 percent increase in Airbnb
listings leads to a 0.018 percent increase in rents and a 0.26 percent increase in prices at the
median owner-occupancy zip-code. They also find that the more owner-occupiers exist in a
market, the weaker is the effect of Airbnb on rents.

Looking at data from outside the USA, Garcia-López, Jofre-Monseny, Martı́nez-Mazza and
Segú (2020) find – using panel fixed effect models, instrumental variable approaches and event
studies – that Airbnb has increased prices by 4.6% and rents by 1.9% in Barcelona, Spain.

Other topics addressed include exploring the interaction between online reviews and comments
of guests, and the pricing behavior of Airbnb hosts (Lawani et al., 2019), and investigations of
racial and other forms of discrimination by Airbnb hosts (Edelman, Luca, and Svirsky, 2019;
Bliss, Engelberg and Warachka, 2021).

Closest to our particular interest are Valentin (2021) and Koster, van Ommeren and Volhausen
(2021). These authors consider the impact of regulations imposed on Airbnb. Valentin focuses
on New Orleans, where Airbnb was banned from one neighborhood while in some others
Airbnb hosts’ names and addresses needed to be registered with the city authorities. Koster,
van Ommeren and Volhausen focus on the banning of informal short-term rentals in parts
of Los Angeles. Both find that regulations targeting Airbnb are effective in reducing Airbnb
participation and at the same time lowering house prices and rents in the affected areas
(although sometimes raising them in surrounding areas). Our objective here is different but
complementary to these papers. We focus on regulations that take the form of restricting the

                                               4
number of days per year that whole apartments can be rented on Airbnb. In particular, we
assess how effective a proposed 180 day limit in Sydney is likely to be given the prevailing
Airbnb rent premia observed in the market.
3 Airbnb and Long-Term Rents
3.1 Airbnb in Sydney
Airbnb opened an office in Sydney in 2012 (although Australian households already advertised
on the Airbnb website prior to this time) and its presence has grown rapidly since then. Sydney
has an enormous influx of visitors each year (around 10 million in 2018 according to Tourism
Australia). According to Airbnb Australia Manager Sam McDonagh:
Australia is an exciting growth area for Airbnb globally, and a major driver of this
growth is Sydney, one of Airbnb’s top ten cities globally. (San Francisco Business
Times, 2017, p. 10)
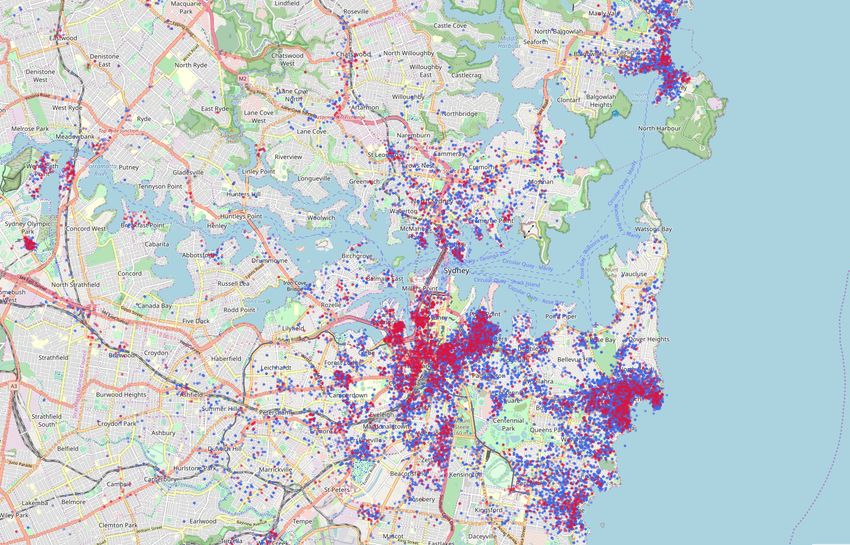
Figure 1 illustrates the Airbnb market in Sydney between 2015-2018. Red dots indicate
professional listings, while blue dots indicate non-professional listings. The huge expansion
during the target time period of Airbnb in Sydney can be seen in Figure 2.6
6
We interpolate the total number of listings for 2018, as we only have partial coverage for this year.
5Note: Red dots indicate professional listings, while blue dots indicate non-professional listings.
Figure 1: Airbnb in Sydney 2015-2018
Note: Entire denotes whole property rentals, while Shared denotes shared rentals.
Figure 2: The growth of Airbnb in Sydney 2015-2018
Sydney experiences tourist inflows year-round. The visitor flow increases slightly in the sum-
mer months (particularly around Christmas), but otherwise there is little seasonal variation.
6Figure 3 shows the arrival numbers of short term visitors at Sydney airport. While these num-
bers cannot be directly translated into Sydney visitor numbers, they give a good indication
of the yearly tourist flow.
(Source: ABS, Time Series 3401.0 “Overseas Arrivals and Departures”, published: Apr. 2019)
Figure 3: International short term visitor arrivals in Sydney 2017
3.2 The Airbnb and Long-Term Rental Datasets
We use Airbnb micro-level rental listings for Sydney obtained from the Inside Airbnb website
created by Murray Cox (see http://insideairbnb.com). We purchased the data on long-
term rental listings from Australian Property Monitors (APM)(https://www.apm.com.au).
Both datasets provide listing prices quoted on a weekly basis.7 House prices at different stages
of the buying/selling process.
Airbnb charges a 3 percent fee to hosts on the sum of the rent and cleaning fee. We deduct this
3 percent fee from the Airbnb rental rate. We discuss the impact of the cleaning fee in section
4.6. The Airbnb rental rate we focus on is the amount actually received by hosts. Airbnb also
7
In the buying/selling literature Haurin et al. (2010), Shimizu, Nishimura and Watanabe (2016) and Kolbe
et al. (2021) show that list prices tend to be higher than actual transaction prices. However, for rents these
differences are smaller. Also, given that both the long-term and Airbnb rents we use are list prices, any biases
should at least partially offset each other when we take their ratio.
7charges guests a fee of 10-20 percent, but since this fee is unrelated to the incentives faced by
hosts, we do not need to consider it here.
We focus on whole apartment rentals Duplicates of the same property in a given year are
removed by randomly selecting one of the listings, and we delete Airbnb listings that have
never received a review, and hence might not be active. We exclude the top and bottom 1
percent of the rent distribution, as well as apartments with 4 or more bedrooms or bathrooms.
Such deletions are justified by the high prevalence of data entry errors at the extremes of the
price distribution, and the lack of representativity of these extremes for the bulk of the market
(see Table A1).
The long-term dataset provides a weekly list of all available rental apartments in Sydney.
Sometimes apartments appear on that list for several weeks (not always with the same price).
In such cases we take the latest entry as it contains the most recent information. Again, we
delete the top and bottom 1 percent of the rent distribution and apartments with 4 or more
bedrooms or bathrooms.
Our aim here is to estimate the Airbnb rent premium for locations where Airbnb is active.
Therefore, we restrict our sample to those postcodes where we have at least 30 different Airbnb
properties listed each year. The number of observations in the Airbnb and long-term datasets
for each year are shown in Table A1.
The characteristics in the long-term dataset are generally recorded in a consistent way by
professional rental agents. By contrast, the information in the Airbnb dataset is typed in by
individual hosts. We therefore had to make some ad hoc decisions with respect to the Airbnb
dataset. We decided to cut all apartment listings with zero bedrooms and/or bathrooms. Also,
the number of bathrooms in the long-term rental dataset is given in integers and only counts
bathrooms that contain a shower or bath. In the Airbnb dataset 3.65 percent of apartments
contain “half-bathrooms” (e.g. 1.5 or 2.5). We rounded these down to the nearest integer.
8Dataset Year Observations Mean Stdev Min Max
2015 45,975 595.00 168.96 285.00 1,390.00
Long-term 2016 45,408 614.65 174.77 285.00 1,390.00
rental (APM) 2017 46,328 637.26 179.52 288.00 1,390.00
2018 5,211 646.13 188.28 285.00 1,390.00
2015 806 1,332.22 489.22 582.00 3,638.54
Airbnb 2016 1,564 1,381.00 506.04 539.85 4,465.88
Professional 2017 2,653 1,343.77 486.97 538.35 4,557.01
2018 3,386 1,308.22 478.38 531.04 4,712.21
2015 2,542 1,141.35 427.34 551.55 3,638.54
Airbnb 2016 4,142 1,150.18 434.71 529.96 4,225.91
Non-Professional 2017 5,717 1,148.07 464.78 528.65 4,588.10
2018 6,171 1,150.23 468.04 522.62 4,566.71
Table 1: Price statistics of different datasets
Some summary statistics are provided in Table 1. We split the Airbnb dataset into professional
and non-professional listings. Professional listings are by hosts with two or more listings in
the Airbnb dataset. Even with this conservative definition, we find that about 30 percent of
Airbnb listings qualify as professional. Further details on the datasets are provided in Table
A1 in Appendix A.
94 The Airbnb Rent-Premium: An Empirical Applica-
tion
4.1 Defining the Airbnb Rent-Premium
Our starting point is the Airbnb rent premium at the level of individual properties defined as
follows:
RA (xA
h)
ARP (xA
h) = L A
, (1)
R (xh )
where xA A
h is the vector of characteristics of property h in the Airbnb dataset, and R and
RL denote, respectively, the weekly rent for this property in the Airbnb and long-term rental
markets. For an Airbnb property RA is observed while RL is not.
We use two approaches to calculate Airbnb rent premia: hedonic prediction and matching.
These methods are explained below.
4.2 Hedonic Models of Airbnb and Long-Term Rents
A hedonic model assumes that price is determined by the observed characteristics of a good.
The hedonic equation is a reduced form arising from the interaction between supply and
demand (Rosen, 1974). In our context, the hedonic model regresses the rental price of a
property on its observed physical and locational characteristics, thereby generating shadow
prices for these characteristics. Hedonic models are used for various purposes, such as for
automated valuation (Schulz, Wersing and Werwatz, 2014), the construction of house price
indexes (Hill, 2013; Silver, 2016; Diewert and Shimizu, 2017), the valuation of characteristics,
particularly local amenities or disamenities (Dröes and Koster, 2019), or the estimation of
time discount rates for housing (Bracke, Pinchbeck and Wyatt, 2018).
Here we use hedonic models to predict both the long-term and Airbnb rental price of in-
dividual properties. We estimate separate hedonic models each year for professional and
non-professional Airbnb properties, as well as for long-term rental properties. We use the
10following semi-log functional form for the hedonic models:8
ln(RA ) = X A β A + DA δ A + uA (2)
and
ln(RL ) = X L β L + DL δ L + uL , (3)
where the superscripts A and L denote the Airbnb and long-term rental market, respectively,
and uA and uL are the errors. To simplify the notation, we omit the distinction between
professional and non-professional Airbnb rentals in (2) as well as the time subscripts in (2)
and (3). ln(RA ) in (2) is the vector of natural logarithms of observed Airbnb rents. X A
is a matrix of non-locational dummy variables (number of bedrooms, number of bathrooms,
quarter of listing) in the Airbnb dataset, and DA a matrix of postcode dummy variables. β A
and δ A are the Airbnb characteristic and postcode shadow price vectors. The terms in (3) are
defined in an analogous way, except now they apply to the long-term rental dataset.9
In Appendix A, we present the estimation results for the professional and non-professional
Airbnb markets and for the long-term rental market. All coefficients – with the exception of
some quarter dummies and a small number of postcode dummies – are significant at the 99
percent level for all model specifications.
Variance is much lower in the long-term rental market compared to the Airbnb market (inde-
pendently of whether we consider professional or non-professional Airbnb hosts). The average
adjusted R2 for the long-term rental models is around 0.68, whereas the corresponding R2 for
the Airbnb dataset is around 0.50 for professionals and 0.40 for non-professional listings.
8
See Diewert (2003) and Malpezzi (2008) for a discussion of some of the advantages of the semi-log functional
form.
9
While more characteristics are available in the Airbnb dataset, we use only those characteristics that are
also available in the long-term dataset. This is because we use each hedonic model to predict rental prices
from both datasets. Postcodes with less than 30 Airbnb listings per year are deleted prior to estimation of the
hedonic models, so as to ensure a certain degree of compositional balance in the two datasets.
114.3 Hedonic Double Prediction
The Airbnb rent premium can be estimated using either single or double hedonic prediction
(imputation). When focusing on the Airbnb dataset, single prediction uses hedonics to predict
only the denominator of the Airbnb rent premium, while double prediction uses hedonics to
predict both the numerator and denominator.
RA (xA
h)
Single prediction : ARPSP (xA
h) = ;
R̂L (xA
h)
R̂A (xA
h)
Double prediction : ARPDP (xA
h) = ;
R̂L (xA
h)
where R̂A (xA
h ) denotes the predicted Airbnb rent for property h in the Airbnb dataset obtained
from the Airbnb hedonic model, while R̂L (xA
h ) denotes the predicted long-term rent for this
same property obtained from the long-term rental hedonic model.
The relative merits of single and double prediction in hedonic models are discussed in Silver
and Heravi (2001), de Haan (2004), Hill and Melser (2008), Rambaldi and Rao (2013), and
Rambaldi and Fletcher (2014). Double prediction implies replacing an actual observed price
with an estimate obtained from a hedonic model. At first glance this may seem like a strange
thing to do. Our reason for preferring double prediction is that it can partially address the
problem of omitted variables. For example, suppose an Airbnb property is of particularly high
quality in terms of its building materials and finishes (both of which are omitted variables).
Single prediction will overestimate the Airbnb rent premium on such a property, since the
hedonic model will under-predict the long-term rent (the denominator of the Airbnb rent
premium). By contrast, both denominator and numerator will be under-predicted with double
prediction, and hence the two biases will partially offset each other. This assumes that omitted
variables act on long-term and Airbnb rents in the same direction, which should generally be
the case.
When focusing on the Airbnb dataset, given the hedonic models are semilog, what is actually
being estimated is the following:
" # C C
R̂A (xA X X
h)
ln[ARP (xA
h )] ≡ ln = β̂cA xA
h,c − β̂cL xA
h,c , (4)
R̂L (xA
h) c=1 c=1
A
where ln R̂ (xA
h) and ln R̂ L
(xA
h) denote the predicted log Airbnb rent and log long-term rent
12for property h in the Airbnb dataset, and β̂ A and β̂ L are the estimated characteristic shadow
prices obtained from equations (2) and (3). To simplify the notation in equation (4), we
include the estimated coefficients on the postcode dummy variables in the β̂ vectors.
To obtain predictions of RA (xA L A
h ) and R (xh ) in (4), a Jensen-type correction term is needed
ˆ We follow the adjustment approach introduced
because E[R̂] = E[exp (X β̂ + )] 6= exp (X β).
by Duan (1983) and transform the estimated log rents from (2) and (3) such that:
E[R̂] = ϕ̂ exp(X β̂) = ϕ̂R̂(xh )
H A
1 X
A
with ϕ̂ = A exp(A
h ),
H h=1 (5)
H L
1 X
L
with ϕ̂ = L exp(Lh ),
H h=1
where H A and H L are the sample sizes of the Airbnb and long-run hedonic models, A L
h and h
are the differences between observed and predicted values (i.e. ln(Rh ) − ln(Rˆh )), and ϕA and
ϕL are the adjustment factors.10 Empirically, we find that this adjustment factor is bigger
for the Airbnb dataset than for the long-term rental dataset. Hence the adjustment acts to
increase the measured Airbnb rent premium.
The average Airbnb rent premium defined on the Airbnb dataset is obtained by averaging
across all properties in the Airbnb dataset:
P
HA HA A C A A
1 X 1 X ϕ̂ exp β̂
c=1 c h,cx
ARP (xA ) = A ARP (xA
h) =
P . (6)
H h=1 A
H h=1 ϕ̂L exp C A
L
c=1 β̂c xh,c
To check for bias arising from selection of landlords into the Airbnb market we also estimate
(1) for each apartment in the long-term rental dataset. In this case we estimate the following
for each long-term rental property:
" # C C
R̂A (xLh ) X X
ln[ARP (xLh )] ≡ ln = β̂cA xLh,c − β̂cL xLh,c , (7)
R̂L (xLh ) c=1 c=1
We again correct for Jensen’s inequality using Duan’s adjustment. The average Airbnb rent
premium defined on the long-term rental dataset is then obtained by averaging across all
10
Unlike the standard Jensen-type adjustment of the form R̂ = exp(X β̂ + 0.5σ̂ 2 ) (Kennedy, 1981), the Duan
adjustment does not require the errors to be normally distributed.
13properties in the long-term rental dataset:
P
C
1
HL
X 1
HL
X β̂ A L
ϕ̂A exp
c=1 c h,cx
ARP (xL ) = L ARP (xLh ) = L P . (8)
H h=1 H h=1 ϕ̂L exp C L L
c=1 β̂c xh,c
We can check whether selection of landlords into the Airbnb market is distorting our estimates
of the Airbnb rent premium by comparing the average Airbnb rent premia generated from
the Airbnb and long-term rental datasets. An overall Airbnb rent premium is obtained by
averaging these two estimates:
ARP (xA ) + ARP (xL )
ARP = . (9)
2
If ARP is similar to ARP (xA ) then this suggests that selection is not a problem.
In our empirical analysis we go beyond the average Airbnb rent premium and also consider the
whole cross-section distribution of Airbnb rent premia defined on the Airbnb dataset. From
this distribution we determine the marginal Airbnb landlord that is indifferent between the
Airbnb and long-term rental market given a 180 day limit on Airbnb rentals. Identifying the
marginal Airbnb landlord allows us to determine the effectiveness of day limits.
4.4 Sample Matching
Matching – especially exact matching – is an alternative to hedonic methods for correcting
for compositional differences between the datasets and provides us with a robustness check
for the double prediction approach outlined above.
The basic idea of the matching literature (Rosenbaum and Rubin, 1983) is to recreate the
conditions of a randomized control trial and then rely on the conditional sample means to
derive treatment effects. An advantage of the matching approach is that it does not rely on
any functional form assumptions. Once the datasets are matched, we can essentially treat
them as if they came from a randomized trial, using simple conditional means to describe the
effects of Airbnb. A second advantage is that it does not require an adjustment for Jensen’s
inequality, since it does not involve any log or exponential transformations.
Here, we aim to match every property in the Airbnb dataset with a property in the long-term
14rental dataset using exact matching with calipers on some covariates. In particular, we insist
on exact matches (without calipers) for the year and number of bedrooms between properties,
but allow bathrooms to differ by 1 unit, and also set a 150m caliper on longitude and latitude.
If we cannot find a match with this procedure, we drop the Airbnb property from the dataset.11
We match with replacement as this makes the matching outcome invariant to the order in
which properties are matched.
Once the datasets are matched, the Airbnb rent premium is computed by simply taking the
arithmetic mean of the matched premia as follows:
H A∗
1 X RhA
ARP = A∗ , (10)
H h=1 RhL
∗
where h = 1, . . . , H A now indexes the properties in the Airbnb dataset that are successfully
matched with properties in the long-term rental dataset.
Using the terminology of the matching literature, the Airbnb dataset can be thought of as the
treated sample, while the long-term dataset describes the control group, and the difference
in rental returns between long-term and Airbnb markets as a treatment effect. It should
be noted, however, that while matching on observable characteristics corrects for sample
imbalances between the treated (Airbnb) and untreated (long-term rental) datasets, it does
not control for biases due to unobservable characteristics.
Figures 4 and 5 illustrate covariate balance for bedrooms and longitude before and after the
matching approach. The Airbnb dataset is represented in blue and the long-term dataset in
red. On the left-hand side of the graphs we see that, while the unmatched datasets differ
somewhat with respect to size (long-term rental apartments being on average bigger), the real
difference between them is location (Airbnb rentals are concentrated along the more touristy
coastal and inner city areas). The right-hand side of these graphs shows how well the matching
process manages to balance the samples.
11
See Appendix B for more details.
15Note: The Airbnb dataset is represented in blue and the long-term rental dataset in red.
Figure 4: Unmatched and matched datasets with respect to bedrooms
Note: The Airbnb dataset is represented in blue and the long-term rental dataset in red.
Figure 5: Unmatched and matched datasets with respect to longitude
164.5 The Airbnb Rent-Premium in Sydney
Note: All methods show that the Airbnb rent premium is higher for professionals, and that it falls
from 2016 to 2018.
Figure 6: Airbnb rent premia (2015-2018)
The average Airbnb rent premium for each year for each method is shown in Figure 6 and
Table 2. The main results that emerge are as follows:
(i) Average results are quite robust to the choice of method, although the matching approach
provides slightly higher Airbnb rent premium estimates.
(ii) The Airbnb rent premium decreases during our sample period (2015-18) for both profes-
sionals and non-professionals.
(iii) Professionally managed Airbnb apartments have higher rent premia compared to non-
professional listings.
(iv) The Airbnb rent premium is more than 100 percent in 2015 (i.e., RA /RL > 2), falling to
17about 80 percent by 2018.12
(v) Quality-adjusted Airbnb rent premia are smaller than simple average Airbnb rent pre-
mia for professionals but not for non-professionals. This indicates that professional Airbnb
rentals are on average of better quality than long-term rentals, but the reverse is true for
non-professional Airbnb rentals. These results indicate why estimated Airbnb rent premia
need to be quality adjusted.
(vi) Selection into Airbnb does not seem to be distorting the results, since the average Airbnb
rent premia obtained from the Airbnb dataset are similar to those obtained by using both the
Airbnb and long-term dataets.
12
These results do not account for the additional costs incurred by Airbnb hosts. We return to this issue in
section 4.8.
18Simple Avg Hedonic Hedonic Matching
Airbnb data Airbnb & APM data
2015 2.18 2.07 2.09 2.07
(0.30) (0.44) (0.64)
Professional
2016 2.17 2.00 2.00 2.07
(0.22) (0.26) (0.65)
2017 2.09 1.87 1.90 1.94
(0.17) (0.22) (0.60)
2018 2.02 1.79 1.81 1.85
(0.17) (0.19) (0.55)
2015 1.87 1.87 1.87 1.91
(0.16) (0.24) (0.61)
Non-Professional
2016 1.81 1.82 1.84 1.89
(0.15) (0.18) (0.64)
2017 1.74 1.75 1.76 1.79
(0.17) (0.17) (0.61)
2018 1.71 1.71 1.73 1.77
(0.15) (0.17) (0.59)
Note: This table shows the Airbnb rent premia generated by each model, with bootstrapped
standard errors given in brackets. “Hedonic: Airbnb data” refers to when hedonic double
prediction is applied only to the Airbnb dataset as in (6), while “Hedonic: Airbnb and APM data”
refers to when hedonic prediction is applied to both the Airbnb and long-term rental (APM)
datasets as in (6), (8) and (9).
Table 2: Airbnb Rent Premia per Year
Hypothesis tests that the Airbnb rent premia are larger than 1 are calculated from Table 2
as follows: t = [(RA /RL ) − 1]/SE, where RA /RL is the Airbnb rent premium and SE the
standard error shown in brackets.13 The t-statistics range between 2.5 and 5.5 for the hedonic
double prediction methods. Hence the rent premia in all four years for both professionals and
13
The standard errors for the hedonic methods (i.e., all except the matching method) are bootstrapped
using the approach outlined in Guan (2003).
19non-professionals are significantly higher than 1. In contrast, the corresponding t-statistics
for the matching method all lie between 1.3 and 1.7 implying that the Airbnb rent premia are
not significantly higher than 1.
Table 3 illustrates that trends observed at the aggregate level are also visible at a more
disaggregate level. In addition, this more disaggregated analysis reveals that larger apartments
have higher Airbnb rent premia. In Appendix C we undertake hypothesis tests that show that
these results are statistically significant.
Spatial variation at the micro-level in the Airbnb rent premia is explored in Figures 7 and 8.
In Figure 7 each dot in the left panel represents a property in the professional Airbnb dataset
in 2017, while each dot in the right panel represents a property in the long-term rental dataset
also in 2017. For each property the predicted long-term rent is shown on the horizontal axis
and the predicted Airbnb rent on the vertical axis. The average Airbnb rent premium is shown
by the slope of the best fit regression line through the origin.
Figure 7: Double hedonic prediction in 2017: Left Airbnb dataset, Right APM dataset
Note: This Figure plots the predicted Airbnb rent against the predicted long-term (APM)
rent at the level of individual properties. The Airbnb rent premium for a property is the
slope of a ray from the origin to that point. The left graph in focuses on properties in the
Airbnb dataset, and the right graph on properties in the long-term (APM) dataset. The
slope of the red line is the average Airbnb rent premium, denoted by ARP in the legend.
20Professional Non-Professional
Hedonic Matching Hedonic Matching
2015 1.94 2.02 1.80 1.88
1 Bedroom (0.21) (0.57) (0.12) (0.56)
2016 1.87 2.00 1.75 1.87
(0.15) (0.56) (0.11) (0.63)
2017 1.78 1.92 1.66 1.75
(0.13) (0.55) (0.12) (0.56)
2018 1.69 1.82 1.63 1.73
(0.12) (0.51) (0.11) (0.55)
2015 2.12 2.08 1.94 1.93
(0.27) (0.67) (0.15) (0.67)
2 Bedroom
2016 2.05 2.09 1.90 1.90
(0.19) (0.67) (0.14) (0.64)
2017 1.91 1.92 1.82 1.82
(0.16) (0.60) (0.14) (0.63)
2018 1.83 1.84 1.78 1.79
(0.16) (0.54) (0.13) (0.60)
2015 2.39 2.25 2.14 2.09
(0.44) (0.74) (0.18) (0.75)
3+ Bedroom
2016 2.31 2.39 2.06 2.00
(0.25) (0.84) (0.14) (0.68)
2017 2.08 2.14 2.05 2.08
(0.16) (0.8) (0.17) (0.78)
2018 1.99 2.08 1.99 2.04
(0.18) (0.76) (0.14) (0.86)
Note: Both the matching and hedonic results are calculated based on the properties in the Airbnb
dataset.
Table 3: Airbnb Rent Premia
Three main findings emerge from Figure 7. First, the scatter plots and least squares regression
lines in the left and right panels are similar, thus indicating that selection into Airbnb is not
distorting the estimated Airbnb rent premia for the Airbnb dataset. Second, in the left panel
21there is not much variation in the Airbnb rent premium across Airbnb properties. Third, the
Airbnb rent premium is slightly higher for more expensive properties. This is consistent with
the main finding in Table 3 that larger apartments (other things equal) have higher Airbnb
rent premia
Figure 8 combines the results from all four years in our dataset. Each dot represents a property
in the Airbnb dataset. For each of these properties, the predicted Airbnb rent is plotted on the
horizontal axis against the predicted Airbnb rent premium on the vertical axis. In each year
the Airbnb rent premium line is upward sloping, implying that more expensive apartments
have higher Airbnb rent premia. This confirms the third finding from Figure 7 noted above.
Three other results are also apparent in Figure 8. First, the Airbnb rent premium line shifts
downwards from one year to the next. This is consistent with the finding from Figure 6 that
the Airbnb rent premium is falling over time. Second, the slope of the Airbnb rent premium
line becomes flatter from one year to the next, indicating that the gap in the Airbnb rent
premium between cheaper and more expensive apartments is getting smaller. Third, the
dispersion of the individual Airbnb rent premia around the least squares regression line gets
smaller from one year to the next. This suggests that the Airbnb market may be becoming
more efficient over time as landlords become more familiar with prevailing market prices.
22Note: Each dot represents a property in the Airbnb dataset. Least squares regression lines are
included for each year of data.
Figure 8: Airbnb rent and Airbnb Rent Premium
4.6 Interpreting the Declining Airbnb Rent Premium over Time
In Figure 9 we provide rent indices for the Airbnb market (professional and non-professional)
as well as the long-term rental market. The rent indices are computed using the hedonic
time-dummy method (see Melser, 2005, and Hill, 2013). The time-dummy method estimates
a semi-log hedonic model over the whole dataset. In addition to the property characteristics,
the model includes a dummy variable, δt , for each period t in the dataset. The price index for
period t is then given by exp(δ̂t ).
The price development in these two markets diverges from 2016 onward: while the Airbnb
rent indices for the professional as well as the non-professional groups decrease, prices in the
long-term rental market rose strongly during the entire sample period. The combination of
these trends explains the observed fall in the Airbnb rent premium. Also, the development
23of these rent indices is consistent with landlords withdrawing apartments from the long-term
rental market (reducing supply) and transferring them to the Airbnb market (where they
increase supply). Combs, Kerrigan and Wachsmuth (2020) find evidence of such crowding out
by Airbnb of long-term rentals in the Canadian market.
Figure 9: Price indices for Airbnb and long-term rental markets computed using the hedonic
time-dummy method
4.7 The Airbnb Break-Even Point
The Airbnb break-even point is the number of days per year a property needs to be rented out
on Airbnb to earn the same as a whole year’s rent on the long-term rental market. To compute
the break-even point, it is first necessary to adjust the Airbnb rent premium for extra costs
borne by Airbnb landlords that they would not incur in the long-term rental market. As noted
in section 3, we already deducted the fees charged to hosts by Airbnb prior to computing the
Airbnb rent premium. There are three main extra costs associated with Airbnb rentals that we
have not yet accounted for. These are the costs of cleaning, utilities/internet, and furnishing
24an Airbnb rental. Our calculation of these additional costs is explained in Appendix D.
The Airbnb rent premium corrected for these additional costs is calculated by modifying (1)
as follows:
RA (xA A
h ) − Y (xh )
ARP (xA
h) = , (11)
RL (xAh)
where Y (xA A
h ) denotes the additional costs incurred by Airbnb landlord h. Here Y (xh ) is
assumed to depend on the number of bedrooms in the apartment (see Appendix D).
When an Airbnb landlord does not pay tax, the estimate of the Airbnb rent premium needs to
be further modified. It can be assumed that landlords in the long-term rental market always
report rental income, since the Australian Tax Office can track all rental contracts lodged
at NSW Fair Trading. By contrast, an information sharing agreement between Airbnb and
Australia only comes into effect on 1 July 2022 (Airbnb, 2019).
The adjusted Airbnb rent premium, when tax is not paid on Airbnb rental income, is calculated
as follows:
RA (xA A
h ) − Y (xh )
ARP (xA
h )notax = ,
0.63 × RL (xAh)
where a marginal tax rate of 37 percent is assumed. This is the marginal rate faced by Aus-
tralian residents with a taxable income between $87 001 and $180 000 per year (in Australian
dollars).
The most recent full year results (i.e., for 2017) for professional Airbnb hosts based on the
hedonic double prediction method are shown in Table 2. The average Airbnb rent premium
is 1.87 (i.e., landlords can earn 87 percent more per week on Airbnb). As shown in Table 4,
taking account of the extra costs reduces the average Airbnb rent premium to 1.66, which –
assuming that a long-term property is occupied for the full year – implies a break-even Airbnb
occupancy rate of 220 days per year. This break-even occupancy rate exceeds the 180 day
limit currently considered in Sydney, which suggests that the 180 day rule would help protect
the long-term rental market.14 However, for Airbnb hosts that do not pay tax on their Airbnb
14
It should be noted, however, that landlords may find ways of bypassing these rules, such as listing a
property under two different names during the year, or listing the property also on other platforms in addition
to Airbnb.
25income, the break-even occupancy rate lies at just 138 days (derived from an Airbnb rent
premium of 2.64 in (11) in 2017), which lies considerably below the 180 day limit currently
under consideration.
Year With tax payment No tax payment
2015 1.84 2.91
2016 1.78 2.83
2017 1.66 2.64
2018 1.58 2.51
The first column shows the Airbnb rent premium when Airbnb hosts pay tax on their rental
income. The second column shows the Airbnb rent premium when they do not.
Table 4: Airbnb rent premia for professionals after including additional costs
Table 5 shows the break-even number of days for the lower quartile, median and upper quartile.
For example, to give 75 percent of professional Airbnb landlords an incentive to switch back to
the long-term rental market, the maximum number of Airbnb days would need to be 205 days
with tax, and 129 days without tax. For properties nearer to beaches (within 950 meters),
the maximum number of Airbnb days would need to be slightly lower than further away from
the beach (see Table 5).
The results become more striking when we consider the marginal Airbnb property where the
landlord is indifferent between renting it on Airbnb with a 180 day limit versus on the long-
term rental market. From this marginal property we can determine the percentage of Airbnb
properties for which a 180 day limit provides an incentive to switch back to the long-term
rental market.
The cross-section distributions of break-even Airbnb days are shown in Figure 10. From
these graphs we can see that with a 180 day limit tax-compliant Airbnb landlords would
have an incentive to switch 95 percent of properties back to the long-term rental market, as
compared with only 1 percent for tax-evading Airbnb landlords. These calculations illustrate
that the success of maximum Airbnb day limits depends crucially on the extent to which tax
26rules are enforced. A 180 day limit will be very effective if Airbnb hosts pay tax on their
rental income, but largely ineffective otherwise. Fortunately, the tax compliance of Airbnb
hosts should increase significantly from 1 July 2022, when the information sharing agreement
between Airbnb and Australia comes into effect.
One further consideration from a policy perspective is the secondary effects of a day limit. If
the limit succeeds in causing some professional Airbnb landlords to relocate their properties
to the long-term rental market, this would act to increase long-term rents and reduce Airbnb
rents. Hence the cross-section distribution of Airbnb rent premia would be altered. Estimating
these second round effects is beyond the scope of this paper. So our findings on the number
of Airbnb landlords with an incentive to switch to the long-term rental market is an upper
bound. Nevertheless, our results clearly show that to get serious traction, the 180 day limit
needs to be combined with improved tax collection.
Paying Taxes Evading Taxes
ARP Break-Even Days ARP Break-Even Days
LQ 1.52 240 2.41 151
Med 1.64 223 2.60 140
All
UQ 1.78 205 2.82 129
Mean 1.66 220 2.64 138
LQ 1.55 235 2.46 148
Near-Beach
Med 1.69 216 2.69 136
UQ 1.82 201 2.89 126
Mean 1.69 216 2.69 136
LQ 1.50 243 2.39 153
Non-Beach
Med 1.61 227 2.56 143
UQ 1.74 210 2.76 132
Mean 1.64 223 2.61 140
Table 5: Airbnb rent premia and break even days for different quartiles in 2017
27(a) Paying Taxes
(b) Evading Taxes
Figure 10: The cross-section distribution of break-even Airbnb days in 2017
Figure 10 also shows that the Airbnb rent premium is only slightly higher in coastal areas (by
about 3 percent on average) than in non-coastal areas.
285 Conclusion
To reduce the potential crowding-out of long-term rental contracts, many cities around the
world started to restrict the number of days that properties can be let on Airbnb or other short-
term rental sites. Based on a large micro-level housing dataset, we estimate the distribution
of Airbnb rent premia (i.e., how much more landlords can earn on Airbnb) based on 170,000
Airbnb and long-term rental contracts for Sydney, Australia, between 2015 to 2018.
We use hedonic- as well as matching methods to adjust for quality differences between Airbnb
and long-term rental properties and find that quality adjustment significantly reduces the
measured Airbnb rent premium, particularly for professional Airbnb landlords (i.e. landlords
with at least two Airbnb properties listed full-time in the Sydney market). Also, Airbnb rent
premia are higher for larger properties and declined between 2015 and 2018 (while supply of
Airbnb properties increased sharply).
To investigate whether the selection of landlords into Airbnb distorts our results, we compare
how the estimated Airbnb rent premia differ for properties in the Airbnb market with those
listed in the long-term rental market. We find the results are similar and hence conclude that
selection is not a problem.
Including all costs typically incurred by Airbnb landlords (i.e., the cleaning fee, utilities/internet,
and furniture), we find that the average tax-paying Sydney Airbnb landlord breaks even after
220 days. Thus, a proposal to limit short-term rentals to a maximum of 180 days per annum
should be successful in making Airbnb less attractive for landlords. However, tax avoidance on
short-term rental income is systemic. For example, the Australian Taxation Office estimated
that short-term rental property owners are a ”key driver” of a 9 billion income tax shortfall
(Financial Review, 2019).
Thus, while the 180-day proposal would incentivize tax-compliant landlords to switch around
95 percent of their properties to the long-term rental market, it would only incentivize 1
percent of tax-avoiding Airbnb landlords. Our results, therefore, demonstrate the importance
of combining an Airbnb day limit with effective tax collection of Airbnb rental income.
29Sydney has a liberal rental market without much rental protection. In cities subject to more
rent control, the Airbnb rent premium and the crowding-out of long-term rentals may be
significantly higher, implying that Airbnb day limits would need to be lower to induce landlords
away from short-term rentals.
References
Airbnb (2019), Airbnb welcomes improved data sharing framework to make tax simpler,
Airbnb, 16 December 2019. https://news.airbnb.com
Barron, K., E. Kung, and D. Proserpio (2021), “The Sharing Economy and Housing Afford-
ability: Evidence from Airbnb,” Marketing Science, forthcoming.
Bliss, B. A., J. Engelberg and M. Warachka (2021), Affiliation bias in the online market for
rental accommodation, Real Estate Economics 49, 224-266.
Bracke, P., E. W. Pinchbeck and J. Wyatt (2018), “The Time Value of Housing: Historical
Evidence on Discount Rates,” The Economic Journal 128(613), 1820-1843.
Combs, J., D. Kerrigan and D. Wachsmuth (2020), “Short-Term Rentals in Canada: Uneven
Growth, Uneven Impacts,” Canadian Journal of Urban Research 29(1), 119-134.
Coyle, D. and T. Yu-Cheong Yeung (2018), “Understanding Airbnb in Fourteen European
Cities,” Mimeo. file:///C:/Users/hillr/AppData/Local/Temp/Yeung-Understanding-AirBnB-in
1-1-1.pdf
Davidson, J. (2019), “Airbnb’s Days Really Are Numbered,” Financial Review, August 19,
2019.
de Haan, J. (2004), “Direct and indirect time dummy approaches to hedonic price measure-
ment,” Journal of Economic and Social Measurement 29(4) 427-443.
Diewert, W. E. (2003), “Hedonic Regressions: A Consumer Theory Approach,” in Scanner
Data and Price Indexes, Conference on Research in Income and Wealth, Volume 64, R. C.
Feenstra and M. D. Shapiro (eds.), National Bureau of Economic Research, The University
of Chicago Press, 317-348.
Diewert, W. E. and C. Shimizu (2017), “Hedonic Regression Models for Tokyo Condominium
Sales,” Regional Science and Urban Economics 60, 300-315.
30Diewert, W. E. and C. Shimizu (2019), “Residential Property Price Indexes: Spatial Co-
ordinates versus Neighbourhood Dummy Variables,” Discussion Paper 19-08, Vancouver
School of Economics, The University of British Columbia, Vancouver, Canada.
Dröes, M. and H. R. A. Koster (2019), “A World Divided: Refugee Centers, House Prices, and
Household Preferences,” Tinbergen Institute Discussion Paper; No. TI 2019-075/VIII,
Amsterdam, Tinbergen Institute.
Duan, N. (1983), “Smearing Estimate: A Nonparametric Retransformation Method,” Journal
of the American Statistical Association 78(383), 605-610.
Edelman, B., M. Luca, and D. Svirsky (2017), “Racial Discrimination in the Sharing Econ-
omy: Evidence from a Field Experiment,” American Economic Journal: Applied Economies,
9(2), 1-22.
Financial Review (2019), Airbnb exposed as driver of $9b tax shortfall.
https://www.afr.com/wealth/tax/short-term-rentals-exposed-as-driver-of-9-billion-tax-shortfall-
20191025-p5347u (November 4, 2019)
Garcia-López, M., J. Jofre-Monseny, R. Martı́nez-Mazza and M. Segú (2020), “Do Short-term
Rental Platforms Affect Rents? Evidence from Airbnb in Barcelona,” Journal of Urban
Economics 119, 103278.
Gibbs, C., D. Guttentag, U. Gretzel, J. Morton, and A. Goodwill (2018), “Pricing in the
sharing economy: a hedonic pricing model applied to Airbnb listings,” Journal of Travel
and Tourism Marketing 35(1), 46-56.
Guan, W. (2003): “Bootstrapped standard Errors”, The Stata Journal 3(1), 71-80.
Haurin, D. R, J. L. Haurin, T. Nadauld and A. Sanders (2010), “List Prices, Sale Prices
and Marketing Time: An Application to U.S. Housing Markets,” Real Estate Economics
38(4), 659-685.
Hill, R. J. (2013), “Hedonic Price Indexes for Residential Housing: A Survey, Evaluation and
Taxonomy,” Journal of Economic Surveys 27(5), 879-914.
Hill, R. J. and D. Melser (2008), “Hedonic Imputation and the Price Index Problem: An
Application to Housing,” Economic Inquiry 46(4), 593-609.
Horn, K. and M. Merante (2017), “Is home sharing driving up rents? Evidence from Airbnb
in Boston”, Journal of Housing Economics 38, 14-24.
Hu, M. R. and A. D. Lee (2020), “Airbnb, COVID-19 Risk and Lockdowns: Local and Global
Evidence,” https://papers.ssrn.com/sol3/papers.cfm?abstract_id=3589141.
31Kennedy, P. E. (1981), “Estimation with Correctly Interpreted Dummy Variables in Semilog-
arithmic Equations,” American Economic Review 71(4), 801.
Kolbe, J., R. Schulz, M. Wersing and A. Werwatz (2021), “Real estate listings and their
usefulness for hedonic regressions, Empirical Economics, forthcoming.
Koster, H. R. A., J. Van Ommeren and N. Volkhausen (2021), “Short-term Rentals and the
Housing Market: Quasi-Experimental Evidence from Airbnb in Los Angeles,” Journal of
Urban Economics 124, 1-33.
Lagrave, K. (2018), “13 Places Cracking Down on Airbnb,” Conde Nast Traveler, http://www.cntraveler.co
(December 13, 2018).
Lawani, A., M. R. Reed, T. Mark, Y. Zheng (2019), “Reviews and price on online platforms:
Evidence from sentiment analysis of Airbnb reviews in Boston,” Regional Science and
Urban Economics 75, 22-34.
Malpezzi, S. (2008), “Hedonic pricing models: a selective and applied review,” in T. OSullivan
and K. Gibb (eds.), Housing Economics and Public Policy, 67-89. Blackwell Science Ltd:
Oxford, UK.
Melser, D. (2005), “The hedonic regression time-dummy method and the monotonicity ax-
ioms,” Journal of Business and Economic Statistics 23 (4),485-492.
Rambaldi, A. N. and C. S. Fletcher (2014), “Hedonic Imputed Property Price Indexes: The
Effects of Econometric Modeling Choices,” Review of Income and Wealth 60(S2), S423-
S448.
Rambaldi, A. N. and D. S. P. Rao (2013). “Econometric Modeling and Estimation of The-
oretically Consistent Housing Price Indexes,” CEPA Working Papers Series WP042013,
School of Economics, University of Queensland, Australia.
Rosen, S. (1974), “Hedonic prices and implicit markets: product differentiation in pure com-
petition,” Journal of Political Economy 82(1), 34-55.
Rosenbaum, P. R. and D. B. Rubin (1983), “The central role of the propensity score in
observational studies for causal effects,” Biometrika 70(1), April, 41-55.
San Francisco Business Times (2017), Bridge to Sydney, Advertising Supplement, October
13, 2017.
Schulz, R., M. Wersing and A. Werwatz (2014), “Automated valuation modelling: a specifi-
cation exercise,” Journal of Property Research 31(2), 131-153.
Sekhon, J. S. (2019), Multivariate and Propensity Score Matching with Balance Optimization,
R Package. https://cran.r-project.org/web/packages/Matching/Matching.pdf
32Sheppard, S. and A. Udell (2016), “Do Airbnb properties affect house prices?” Department
of Economics Working Papers 2016-03, Department of Economics, Williams College.
Shimizu, C., K. G. Nishimura and T. Watanabe (2016), “House prices at different stages of
the buying/selling process,” Regional Science and Urban Economics 59, 37-53.
Silver, M. (2016), “How to Better Measure Residential Property Price Indexes,” IMF Working
Paper Series WP/16/213.
Silver, M. and Heravi, S. (2001), “Quality adjustment, sample rotation and CPI practice:
an experiment,” Presented at the Sixth Meeting of the International Working Group on
Price Indices, Canberra, Australia, April 26.
Valentin, M. (2021), “Regulating short-term rental housing: Evidence from New Orleans,”
Real Estate Economics, forthcoming.
Waltl, S. R. (2021), “Multidimensional Wealth Inequality: A Hybrid Approach toward Dis-
tributional National Accounts in Europe,” Review of Income and Wealth, forthcoming.
Zervas, G., D. Proserpio, and J. W. Byers (2017), “The Rise of the Sharing Economy: Es-
timating the Impact of Airbnb on the Hotel Industry,” Journal of Marketing Research
54(5), 687-705.
33Appendix A: Estimation of Hedonic Models
Table A1 shows how many observations were deleted during the data-cleaning process. Most
of the deletions from long-term rental (APM) dataset were because these properties were
located in postcodes that did not attain the threshold of 30 Airbnb listings.
Raw data after duplicate removal After cleaning
APM Airbnba APMc Airbnbb,d
All Non-Prof. Prof. All Non-Prof. Prof.
2015 76 876 3 255 1 074 70 713 2 542 806
2016 78 207 5 350 2 154 71 733 4 142 1 564
2017 82 339 7 454 3 562 74 868 5 717 2 653
2018 10 337 8 115 4 554 9 019 6 171 3 386
Total 247 759 24 174 11 344 226 333 18 572 8 409
Note: In our long-term rental (APM) dataset only a limited amount of data are available for 2018.
a In addition to removing all duplicates within one year, we deleted all Airbnb listings without a
review ( ∼36%).
b About 10% of Airbnb listings had either 0 or 0.5 bedrooms. These listings were deleted.
c For approximately 5% of the long-term rental (APM) dataset we did not have information about
geographic coordinates. These listings were deleted.
d For each estimation, we applied the restriction to have at least 30 observations per postcode.
Due to this restriction, we deleted approximately 15% (16%) for professional (non-professional)
Airbnb listings.
Table A1: Duplicate removal and cleaning of the datasets
34You can also read