VizWiz Grand Challenge: Answering Visual Questions from Blind People
←
→
Page content transcription
If your browser does not render page correctly, please read the page content below
VizWiz Grand Challenge: Answering Visual Questions from Blind People

                                                             Danna Gurari1 , Qing Li2 , Abigale J. Stangl3 , Anhong Guo4 , Chi Lin1 ,
                                                                      Kristen Grauman1 , Jiebo Luo5 , and Jeffrey P. Bigham4
                                                                 1
                                                                   University of Texas at Austin, 2 University of Science and Technology of China,
                                                             3
                                                               University of Colorado Boulder, 4 Carnegie Mellon University 5 University of Rochester
arXiv:1802.08218v4 [cs.CV] 9 May 2018

                                                                 Abstract                                        Over the past three years, many VQA datasets have
                                                                                                             emerged in the vision community to catalyze research on
                                           The study of algorithms to automatically answer visual            the VQA problem [7, 8, 17, 18, 21, 22, 26, 31, 35, 43, 44,
                                        questions currently is motivated by visual question answer-          47, 49]. Historically, progress in the research community on
                                        ing (VQA) datasets constructed in artificial VQA settings.           a computer vision problem is typically preceded by a large-
                                        We propose VizWiz, the first goal-oriented VQA dataset               scale, publicly-shared dataset [13, 28, 33, 36, 46]. However,
                                        arising from a natural VQA setting. VizWiz consists of over          a limitation of available VQA datasets is that all come from
                                        31,000 visual questions originating from blind people who            artificially created VQA settings. Moreover, none are “goal
                                        each took a picture using a mobile phone and recorded a              oriented” towards the images and questions that come from
                                        spoken question about it, together with 10 crowdsourced              blind people. Yet, blind people arguably have been produc-
                                        answers per visual question. VizWiz differs from the many            ing the big data desired to train algorithms. For nearly a
                                        existing VQA datasets because (1) images are captured by             decade, blind people have been both taking pictures [4, 9]
                                        blind photographers and so are often poor quality, (2) ques-         and asking questions about the pictures they take [9, 12, 27].
                                        tions are spoken and so are more conversational, and (3)             Moreover, blind people often are early adopters of computer
                                        often visual questions cannot be answered. Evaluation of             vision tools to support their real daily needs.
                                        modern algorithms for answering visual questions and de-                 We introduce the first publicly-available vision dataset
                                        ciding if a visual question is answerable reveals that VizWiz        originating from blind people, which we call “VizWiz”, in
                                        is a challenging dataset. We introduce this dataset to en-           order to encourage the development of more generalized al-
                                        courage a larger community to develop more generalized               gorithms that also address the interests of blind people. Our
                                        algorithms that can assist blind people.                             work builds off previous work [9] which established a mo-
                                                                                                             bile phone application that supported blind people to ask
                                                                                                             over 70,000 visual questions [11] by taking a photo and
                                        1. Introduction                                                      asking a question about it. We begin our work by imple-
                                           A natural application of computer vision is to assist blind       menting a rigorous filtering process to remove visual ques-
                                        people, whether that may be to overcome their daily visual           tions that could compromise the safety or privacy of any
                                        challenges or break down their social accessibility barriers.        individuals associated with them; e.g., blind people often
                                        For example, modern object recognition tools from private            willingly share personal information with strangers to over-
                                        companies, such as TapTapSee [3] and CamFind [2], al-                come personal obstacles [5]. We then crowdsource answers
                                        ready empower people to snap a picture of an object and              to support algorithm training and evaluation. We next con-
                                        recognize what it is as well as where it can be purchased.           duct experiments to characterize the images, questions, and
                                        Social media platforms, such as Facebook and Twitter, help           answers and uncover unique aspects differentiating VizWiz
                                        people maintain connections with friends by enabling them            from existing VQA datasets [7, 8, 17, 18, 21, 22, 26, 31, 35,
                                        to identify and tag friends in posted images as well as re-          43, 44, 47, 49]. We finally evaluate numerous algorithms for
                                        spond to images automatically described to them [29, 45].            predicting answers [18, 24] and predicting if a visual ques-
                                        A desirable next step for vision applications is to empower          tion can be answered [30]. Our findings highlight VizWiz
                                        a blind person to directly request in a natural manner what          is a difficult dataset for modern vision algorithms and offer
                                        (s)he would like to know about the surrounding physical              new perspectives about the VQA problem.
                                        world. This idea relates to the recent explosion of inter-              It is also useful to understand why VizWiz is challenging
                                        est in the visual question answering (VQA) problem, which            for modern algorithms. Our findings suggest the reasons
                                        aims to accurately answer any question about any image.              stem from the fact VizWiz is the first vision dataset to in-

                                                                                                         1
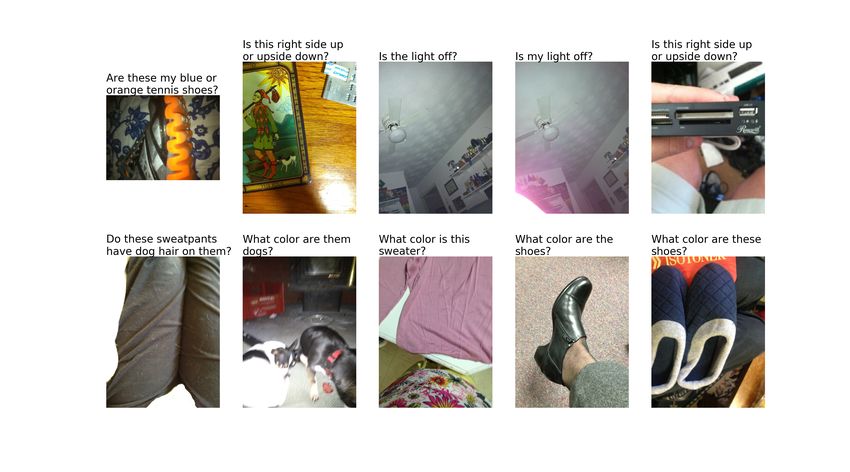
Figure 1: Examples of visual questions asked by blind people and corresponding answers agreed upon by crowd workers.
The examples include questions that both can be answered from the image (top row) and cannot be answered from the image
(bottom row).

troduce images and questions from blind people as well as        2. Related Works
questions that originally were spoken. Unlike existing vi-
sion datasets, images are often poor quality, including due      VQA for Blind Users. For nearly a decade, human-
to poor lighting, focus, and framing of the content of in-       powered VQA systems have enabled blind people to over-
terest. Unlike existing VQA datasets, the questions can be       come their daily visual challenges quickly [1, 9, 27]. With
more conversational or suffer from audio recording imper-        such systems, users employ a mobile phone application to
fections such as clipping a question at either end or catching   capture a photo (or video), ask a question about it, and then
background audio content. Finally, there is no assurance         receive an answer from remotely located paid crowd work-
that questions can be answered since blind people cannot         ers [9, 27] or volunteers [1]. Such VQA systems have been
verify their images capture the visual content they are ask-     shown to be valuable for many daily tasks including gro-
ing about for a plethora of reasons; e.g., blur, inadequate      cery shopping [9], locating a specific object in a complex
lighting, finger covering the lens, etc. Several of the afore-   scene [10], and choosing clothes to wear [12]. Yet, these
mentioned issues are exemplified in Figure 1.                    systems are limited because they rely on humans to pro-
                                                                 vide answers. An automated solution would be preferred
                                                                 for reasons such as cost, latency, scalability, and enhanced
                                                                 privacy. For example, the latency between sending out an
    More broadly, VizWiz is the first goal-driven VQA            image and getting the answer back may take minutes [9],
dataset to capture real-world interests of real users of a       disrupting the natural flow of a blind user’s life. Our work
VQA system. Furthermore, it is the first VQA dataset to          describes the unique challenges for creating public datasets
reflect a use case where a person asks questions about the       with data captured in natural settings from real-world users
physical world around himself/herself. This approach is          and, in particular, blind users. Our work also offers the first
critical for empowering blind people to overcome their daily     dataset for enabling algorithm development on images and
visual-based challenges. Success in developing automated         questions coming from blind people, which in turn yields
methods would mitigate concerns about the many undesired         new vision-based and language-based challenges.
consequences from today’s status quo for blind people of re-     Images in Vision Datasets. When constructing vision
lying on humans to answer visual questions [9, 12, 27]; e.g.,    datasets, prior work typically used images gathered from
humans often must be paid (i.e., potentially expensive), can     the web (e.g., [13, 28, 33, 36, 46]) or created artificially
take minutes to provide an answer (i.e., slow), are not al-      (e.g., [7, 8, 21]). Such images are typically high quality and
ways available (i.e., potentially not scalable), and pose pri-   safe for public consumption. For example, images curated
vacy issues (e.g., when credit card information is shared).      from the web intrinsically pass a human quality assessment
of “worthy to upload to the internet” and typically are in-      tions are deemed unanswerable by crowd workers, despite
ternally reviewed by companies hosting the images (e.g.,         the availability of several automated systems designed to
Google, Facebook) to ensure the content is appropriate. Al-      assist blind photographers to improve the image focus [3],
ternatively, artificially constructed images come from con-      lighting [9], or composition [20, 41, 48].
trolled settings where either computer graphics is employed          We propose the first VQA dataset which naturally pro-
to synthesize images with known objects and scenes [7, 21]       motes the problem of predicting whether a visual question
or crowd workers are employed to add pre-defined clipart         is answerable. We construct our dataset by explicitly ask-
objects to pre-defined indoor and outdoor scenes [8]. In         ing crowd workers whether a visual question is answer-
contrast, images collected “in the wild” can contain inap-       able when collecting answers to our visual questions. Our
propriate or private content, necessitating the need for a re-   work relates to recent “relevance” datasets which were ar-
view process before releasing the data for public consump-       tificially constructed to include irrelevant visual questions
tion. Moreover, images from blind photographers regularly        by injecting questions that are unrelated to the contents of
are poor quality, since blind people cannot validate the qual-   high quality images [22, 30, 34, 40]. Unlike these “rele-
ity of the pictures they take. Our experiments show these        vance” datasets, our dataset also includes questions that are
images pose new challenges for modern vision algorithms.         unrelated because images are too poor in quality (e.g., blur,
VQA Datasets. Over the past three years, a plethora of           over/under-saturation). Experiments demonstrate VizWiz is
VQA datasets have been publicly shared to encourage a            a difficult dataset for the only freely-shared algorithm [30]
larger community to collaborate on developing algorithms         designed to predict whether a visual question is relevant,
that answer visual questions [7, 8, 17, 18, 21, 22, 26, 31,      and so motivates the design of improved algorithms.
35, 43, 44, 47, 49]. While a variety of approaches have
been proposed to assemble VQA datasets, in all cases the         3. VizWiz: Dataset Creation
visual questions were contrived. For example, all images            We introduce a VQA dataset we call “VizWiz”, which
were either taken from an existing vision dataset (e.g.,         consists of visual questions asked by blind people who were
MSCOCO [28]) or artificially constructed (e.g., Abstract         seeking answers to their daily visual questions [9, 11]. It
Scenes [8], computer graphics [7, 21]). In addition, ques-       is built off of previous work [9] which accrued 72,205 vi-
tions were generated either automatically [7, 21, 22, 31, 35,    sual questions over four years using the VizWiz application,
47], from crowd workers [8, 17, 18, 22, 26, 49], or from         which is available for iPhone and Android mobile phone
in-house participants [22, 44]. We introduce the first VQA       platforms. A person asked a visual question by taking a pic-
dataset which reflects visual questions asked by people who      ture and then recording a spoken question. The application
were authentically trying to learn about the visual world.       was released May 2011, and used by 11,045 users. 48,169
This enables us to uncover the statistical composition of vi-    of the collected visual questions were asked by users who
sual questions that arises in a real-world situation. More-      agreed to have their visual questions anonymously shared.
over, our dataset is the first to reflect how questions appear   These visual questions serve as the starting point for the de-
when they are spoken (rather than automatically generated        velopment of our dataset. We begin this section by compar-
or typed) and when each image and question in a visual           ing the approach for asking visual questions in VizWiz with
question is created by the same person. These differences        approaches employed for many existing VQA datasets. We
reflect a distinct use case scenario where a person interac-     then describe how we created the dataset.
tively explores and learns about his/her surrounding phys-
ical world. Our experiments show the value of VizWiz as          3.1. Visual Question Collection Analysis
a difficult dataset for modern VQA algorithms, motivating            We summarize in Table 1 how the process of collect-
future directions for further algorithm improvements.            ing visual questions for VizWiz is unlike the processes em-
Answerability Visual Questions. The prevailing as-               ployed for 14 existing VQA datasets. A clear distinction
sumption when collecting answers to visual questions is          is that VizWiz contains images from blind photographers.
that the questions are answerable from the given images [7,      The quality of such images offer challenges not typically
8, 17, 18, 21, 26, 31, 35, 44, 43, 47, 49]. The differ-          observed in existing datasets, such as significant amounts
ences when constructing VQA datasets thus often lies in          of image blur, poor lighting, and poor framing of image
whether to collect answers from anonymous crowd work-            content. Another distinction is that questions are spoken.
ers [7, 8, 17, 22, 26], automated methods [21, 31], or in-       Speaking to technology is increasingly becoming a stan-
house annotators [31, 43, 44]. Yet, in practice, blind people    dard interaction approach for people with technology (e.g.,
cannot know whether their questions can be answered from         Apple’s Siri, Google Now, Amazon’s Alexa) and VizWiz
their images. A question may be unanswerable because an          yields new challenges stemming from this question-asking
image suffers from poor focus and lighting or is missing         modality, such as more conversational language and audio
the content of interest. In VizWiz, ∼28% of visual ques-         recording errors. A further distinction is VizWiz is the first
Dataset                      Which Images?                         Who Asked?                                   How Asked?
 DAQUAR [31]                  NYU Depth V2 [37]                   In-house participants, Automatically           ——–
                                                                  generated (templates)
 VQA v1.0: Abstract [8]       Abstract Scenes                     Crowd workers (AMT)                            Typed
 VQA v1.0: Real [8]           MSCOCO [28]                         Crowd workers (AMT)                            Typed
 Visual Madlibs [47]          MSCOCO [28]                         Automatically generated (templates)            ——–
 FM-IQA [17]                  MSCOCO [28]                         Crowd workers (Baidu)                          Typed
 KB-VQA [44]                  MSCOCO [28]                         In-house participants                          Typed
 COCO-QA [35]                 MSCOCO [28]                         Automatically generated (captions)             ——–
 VQA v2.0: Real [18]          MSCOCO [28]                         Crowd workers (AMT)                            Typed
 Visual7W [49]                MSCOCO [28]                         Crowd workers (AMT)                            Typed
 CLEVR [21]                   Synthetic Shapes                    Automatically generated (templates)            ——–
 SHAPES [7]                   Synthetic Shapes                    Automatically generated (templates)            ——–
 Visual Genome [26]           MSCOCO [28] & YFCC100M [39] Crowd workers (AMT)                                    Typed
 FVQA [43]                    MSCOCO [28] & ImageNet [15]         In-house participants                          Typed
 TDIUC [22]                   MSCOCO [28] & YFCC100M [39] Crowd workers (AMT), In-house par-                     Typed
                                                                  ticipants, Automatically generated
 Ours - VizWiz                     Blind people use mobile phones to take a picture and ask question             Spoken

        Table 1: Comparison of visual questions from 14 existing VQA datasets and our new dataset called VizWiz.

dataset where a person both takes the picture and then asks a    to remove any possible meta-data attached to the original
question about it. This reflects a novel use-case scenario in    image, such as the person’s location.
which visual questions reflect people’s daily interests about        Filtering. Our aim also was to remove visual questions
their physical surroundings. VizWiz is also unique because,      that could make the producers (e.g., askers) or consumers
in contrast to all other VQA datasets, the people asking the     (e.g., research community) of the dataset vulnerable. Ac-
questions could not “see” the images. Consequently, ques-        cordingly, we obtained from two committees that decide
tions could be unrelated to the images for a variety of rea-     whether proposed research is ethical – the Collaborative In-
sons that are exemplified in Figure 1.                           stitutional Training Initiative board and Institutional Review
                                                                 Board – approval to publicly release the filtered dataset.
3.2. Anonymizing and Filtering Visual Questions                      We initiated this work by developing a taxonomy of vul-
                                                                 nerabilities (see Supplementary Materials for details). We
   We faced many challenges with preparing the dataset for       identified the following categories that came from erring on
public use because our visual questions were collected “in       the safe side to protect all people involved with the dataset:
the wild” from real users of a VQA system. The challenges
related to protecting the privacy and safety of the many indi-    1. Personally-Identifying Information (PII); e.g., any part
viduals involved with the dataset. This is especially impor-         of a person’s face, financial statements, prescriptions.
tant for visually impaired people, because they often make        2. Location; e.g., addressed mail, business locations.
the tradeoff to reveal personal information to a stranger in      3. Indecent Content; e.g., nudity, profanity.
exchange for assistance [5]; e.g., credit card numbers and
                                                                  4. Suspicious Complex Scenes: the reviewer suspects PII
personal mail. This is also important for those reviewing
                                                                     may be located in the scene but could not locate it.
the dataset since visual questions can contain “adult-like”
content (e.g., nudity), and so potentially offensive content.     5. Suspicious Low Quality Images: the reviewer suspects
Our key steps to finalize our dataset for public use involved        image processing to enhance images could reveal PII.
anonymizing and filtering candidate visual questions.               We next performed two rounds of filtering. We first in-
   Anonymization. Our aim was to eliminate clues that            structed AMT crowd workers to identify all images show-
could reveal who asked the visual question. Accordingly,         ing PII, as reflected by “any part of a person’s face, anyone’s
we removed the person’s voice from the question by em-           full name, anyone’s address, a credit card or bank account
ploying crowd workers from Amazon Mechanical Turk to             number, or anything else that you think would identify who
transcribe the audio recorded questions. We applied a spell-     the person who took the photo is”. Then, two of the in-
checker to the transcribed sentences to fix misspellings. We     house domain experts who established the vulnerability tax-
also re-saved all images using lossless compression in order     onomy jointly reviewed all remaining visual questions and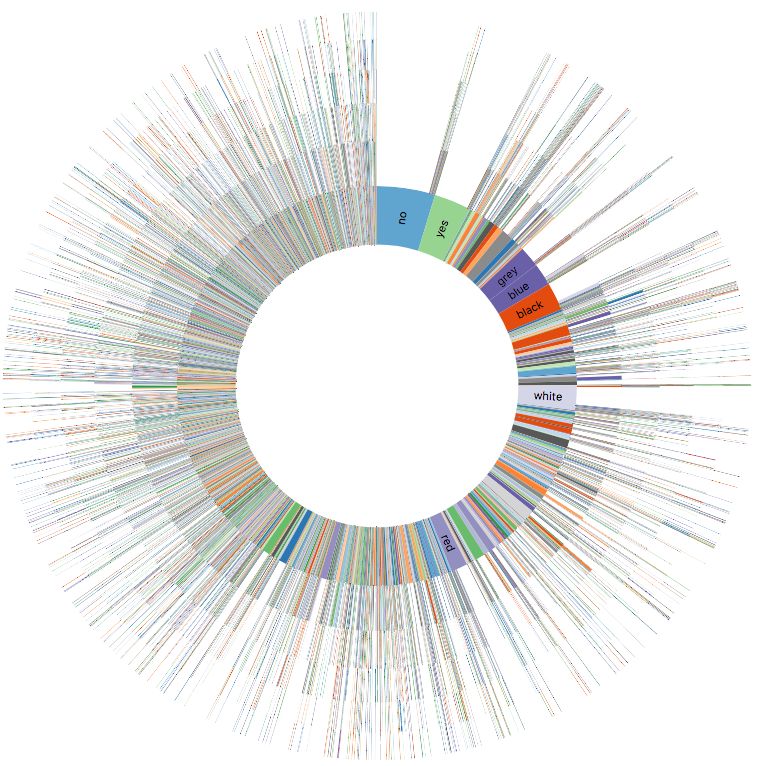
Filter                                 # of VQs             10 answers per visual question from AMT crowd workers
                                                                  located in the US by showing crowd workers a question
      Crowd Workers                            4,626              and associated image and instructing them to return “a brief
      In-House Experts                         2,693              phrase and not a complete sentence”. We augmented this
      - PII                                     895               user interface to state that “you will work with images taken
      - Location                                377               by blind people paired with questions they asked about the
      - Indecent Content                         55               images”. We also added instructions to answer “Unsuit-
      - Suspicious Complex Scene                725               able Image” if “an image is too poor in quality to answer
      - Suspicious Low Quality Image            578               the question (i.e., all white, all black, or too blurry)” or
      - Other                                    63               “Unanswerable” if “the question cannot be answered from
                                                                  the image”. While both additions to the annotation protocol
Table 2: We report the number of visual questions filtered in     indicate a visual question is unanswerable, this annotation
our iterative review process by crowd workers and then in-        approach enables more fine-grained understanding for why
house domain experts (including with respect to each vul-         a visual question is unanswerable. The final set of answers
nerability category).                                             should represent common sense from sighted people.

                                                                  4. VizWiz: Dataset Analysis
marked any instances for removal with one of the five vul-
                                                                     Our aim in this section is to characterize the visual ques-
nerability categories or “Other”. This phase also included
                                                                  tions and answers in VizWiz. We analyze (1) What is the
removing all instances with a missing question (i.e., 7,477
                                                                  diversity of natural language questions?, (2) What is the di-
visual questions with less than two words in the question).
                                                                  versity of images?, (3) What is the diversity of answers?,
    Table 2 shows the resulting number of visual questions
                                                                  and (4) How often are visual questions unanswerable? A
tagged for removal in each round of human review, includ-
                                                                  valuable outcome of this analysis is it enriches our under-
ing a breakdown by vulnerability issue. We attribute the
                                                                  standing of the interests of blind users in a real VQA set-up.
extra thousands of flagged visual questions from domain
experts to their better training on the potential vulnerabil-     4.1. Analysis of Questions
ities. For example, location information, such as zip codes
and menus from local restaurants, when augmented with ad-             We first examine the diversity of questions asked by vi-
ditional information (e.g., local libraries have lists of blind   sualizing the frequency that questions begin with different
members in the community) could risk exposing a person’s          words/phrases. Results are shown in a sunburst diagram
identity. Also, blurry and/or bright images, when post-           in Figure 2. While many existing VQA datasets include a
processed, could reveal PII. Additionally, people’s faces can     small set of common initial words (e.g., “What”, “When”,
appear in reflections on monitor screens, window panes, etc.      “Why”, “Is”, “Do”), we observe from the upper left quad-
We do not expect crowd workers to understand such nu-             rant of Figure 2 that VizWiz often begins with a rare first
ances without extensive instructions and training.                word. In fact, the percentage of questions starting with a
                                                                  first word that occurs for less than 5% of all questions is
    In total, ∼31% of visual questions (i.e., 14,796) were fil-
                                                                  27.88% for VizWiz versus 13.4% for VQA 2.0 [8] (based
tered from the original 48,169 candidate visual questions.
                                                                  on random subset of 40,000 VQs). We attribute this finding
While our taxonomy of vulnerabilities helps guide what vi-
                                                                  partially to the use of more conversational language when
sual questions to filter from real-world VQA datasets, it also
                                                                  speaking a question; e.g., “Hi”, “Okay”, and “Please”. We
identifies visual questions that would be good to generate
                                                                  also attribute this finding to the recording of the question
artificially so datasets could address all needs of blind peo-
                                                                  starting after the person has begun speaking the question;
ple without requiring them to release personal information.
                                                                  e.g., “Sell by or use by date of this carton of milk” or “oven
3.3. Collecting Answers                                           set to thanks?”. Despite such questions being incomplete,
                                                                  it is still reasonable the intended question can be inferred
   We next collected answers for a final set of 31,173 vi-        and so answered; e.g., “What is the oven set to?”. We also
sual questions. The original VizWiz application prioritized       observe in Figure 2 that most questions begin with “What”.
providing a person near real-time access to answers and per-      This suggests many visual questions do a poor job in nar-
mitted the person to receive answers from crowd workers,          rowing the scope of plausible answers. In contrast, initial
IQ Engines, Facebook, Twitter, or email. Since our aim is         wordings such as “How many...” and “Is...” often narrow
to enable the training and evaluation of algorithms, we col-      plausible answers to numbers and “yes/no” respectively.
lected new answers to all visual questions for this purpose.          We also analyze question diversity by computing statis-
   To collect answers, we modified the excellent protocol         tics summarizing the number of words in each question.
used for creating VQA 1.0 [8]. As done before, we collected       The median and mean question lengths are five and 6.68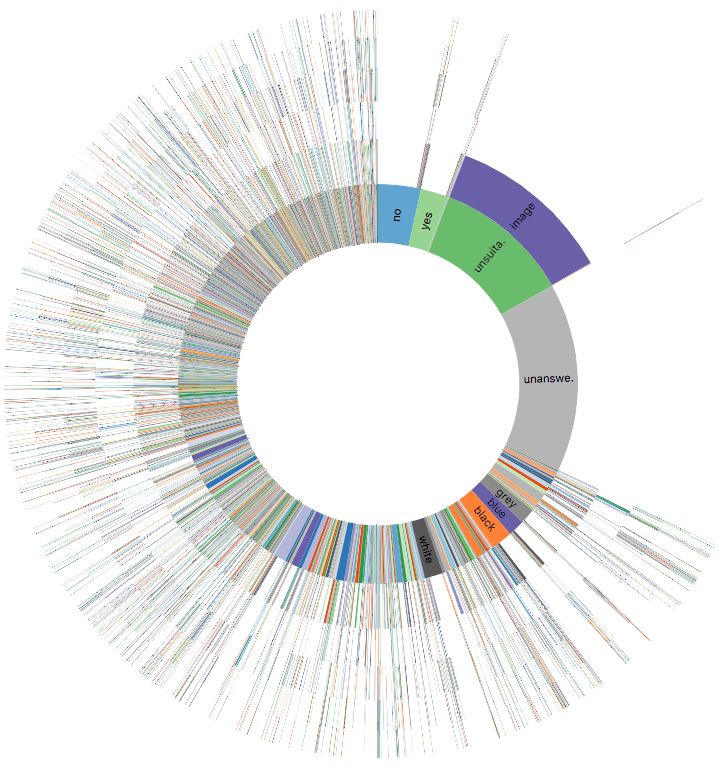
Figure 3: The average image created using all images in
                                                                  VizWiz.

                                                                  Figure 4: Popularity of answers in VizWiz, with the text
                                                                  size proportional to the number of times the answer occurs.
Figure 2: Distribution of the first six words for all questions
in VizWiz. The innermost ring represents the first word and
each subsequent ring represents a subsequent word. The            from a diverse dataset, the resulting gray image confirms
arc size is proportional to the number of questions with that     our dataset does not conform to a particular structure across
word/phrase.                                                      all the images. We also tallied how many images had at least
                                                                  two crowd workers give the answer “unsuitable image”. We
                                                                  found 28% of images were labelled as such.
words respectively and 25th and 75th percentile lengths
are four and seven words respectively. This resembles the         4.3. Analysis of Answers
statistics found in the existing artificially constructed VQA        We next analyze the diversity of the answers. We first vi-
datasets, nicely summarized in [14] and [22]. We also ob-         sualize the popularity of different answers in Figure 4 using
serve three words regularly suffice for a question: “What         a word map (cropped to fit in the paper) which excludes the
is this?”. As observed in Figure 2, this short object recog-      answers “Unanswerable” and “Unsuitable Image”. This vi-
nition question is the most common question. Longer and           sually highlights the fact that there are a large number of
multi-sentence questions also occasionally arise, typically       unique answers; i.e., ∼58,789. While in absolute terms
because people offer auxiliary information to disambiguate        this number is an order of magnitude smaller than exist-
the desired response; e.g., “Which one of these two bags          ing larger-scale datasets such as VQA 2.0 [8], we find the
would be appropriate for a gift? The small one or the tall        answer overlap with existing datasets can be low. For ex-
one? Thank you.” Longer questions also can arise when the         ample, only 824 out of the top 3,000 answers in VizWiz are
audio recording device captures too much content or back-         included in the top 3,000 answers in VQA 2.0 [8]. This ob-
ground audio content; e.g., “I want to know what this is.         servation is used in the next section to explain why existing
I’m have trouble stopping the recordings.”                        prediction systems perform poorly on the VizWiz dataset.
                                                                     We also tally how often a visual question is unanswer-
4.2. Analysis of Images
                                                                  able, as indicated by at least half the crowdsourced answers
   We next investigate the diversity of images. We first ad-      for a visual question stating the answer is “unanswerable”
dress a concern that our dataset has high quality images          or “unsuitable image”. We find 28.63% of visual questions
showing a single, iconic object, which is a possibility since     are not answerable. This finding validates the practical im-
our filtering process erred on removing “suspicious” scene-       portance of the recent efforts [22, 30, 34, 40] to augment
based and blurry images and the remaining visual questions        VQA datasets with irrelevant visual questions. Moreover,
contain many object recognition questions. Following prior        our dataset offers more fine-grained annotations that enable
work [15], we computed the average image from all im-             research to automatically identify whether the answerability
ages in VizWiz. Figure 3 shows the result. As desired             issue is due to inadequate image quality (e.g., “Unsuitable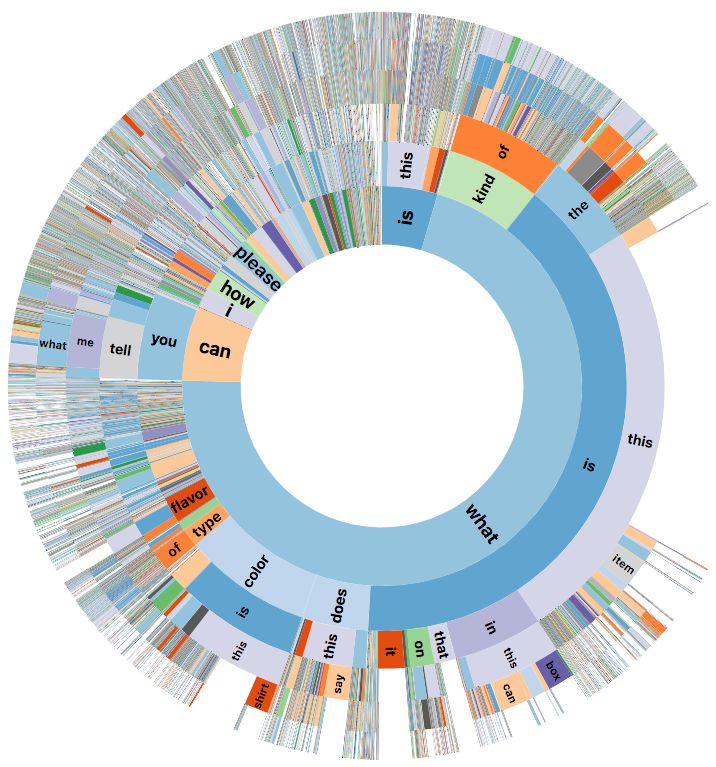
Image”) or image content (i.e., “Unanswerable”).                  Evaluation Metrics. We evaluate with respect to four
    We also analyze answer diversity by computing statistics      metrics: Accuracy [8], CIDEr [42], BLEU4 [32], and ME-
for the number of words in each answer. The median and            TEOR [16]. Accuracy [8] was introduced as a good metric
mean answer lengths are 1.0 and 1.66 words respectively.          when most answers are one word. Since nearly half the
These statistics resemble what is observed for numerous ar-       answers in VizWiz exceed one word, we also use image de-
tificially constructed VQA datasets, as summarized in [14]        scription metrics provided by [13] which are designed for
and [22]. We also compute the percentage of answers with          evaluating longer phrases and/or sentences.
different answer lengths: 67.32% have one word, 20.74%            Results. We first analyze how existing prediction mod-
have two words, 8.24% have three words, 3.52% have four           els [6, 18, 24] perform on the VizWiz test set. As ob-
words, and the remaining 0.01% have more than four words.         served in the first three rows of Table 3, these models per-
Interestingly, our answers are longer on average than ob-         form poorly, as indicated by low values for all metrics; e.g.,
served by Antol et al. [8], who used a similar crowdsourc-        ∼0.14 accuracy for all algorithms. We attribute the poor
ing system. We attribute this discrepancy in part to many         generalization of these algorithms largely to their inability
VizWiz visual questions asking to read multi-word text.           to predict answers observed in the VizWiz dataset; i.e., only
    We finally compute the level of human agreement on an-        824 out of the top 3,000 answers in VizWiz are included in
swers, using exact string matching. Despite that humans           the dataset (i.e., VQA 2.0 [18]) used to train the models.
provided open-ended text as answers, we observe agree-                We observe in Table 3 that fine-tuning (i.e., rows 4–6)
ment from independent people on the answer for most vi-           and training from scratch (i.e., rows 7–9) yield significant
sual questions (i.e., 97.7%). More than three people agreed       performance improvements over relying on the three pre-
on the most popular answer for 72.83% of visual questions,        diction models [6, 18, 24] as is. We find little performance
exactly three people agreed for 15.5% of visual questions,        difference between fine-tuning and training from scratch for
and exactly two people agreed for 9.67% of visual ques-           the three models. While the number of training examples in
tions. This agreement level is the lower bound since less         VizWiz is relatively small, we hypothesize the size is suffi-
stringent agreement measures (e.g., that resolve synonyms)        cient for teaching the models to retain knowledge about an-
may lead to greater agreement.                                    swer categories that are applicable in this setting. Despite
                                                                  the improvements, further work is still needed to achieve
5. VizWiz Benchmarking                                            human performance (i.e., 0.75 accuracy)1 .
                                                                      We next analyze what predictive cues may lead to algo-
    We now investigate the difficulty of the VizWiz dataset       rithm success/failure. We observe models that add the at-
for existing algorithms. We divide the final dataset into         tention mechanism [6, 24] consistently outperform relying
training, validation, and test sets of 20,000, 3,173, and 8,000
                                                                     1 Performance is measured by partitioning the dataset into 10 sets of one
visual questions, respectively (i.e, approximately a 65/10/25
                                                                  answer per visual question and then evaluating one answer set against the
split). All results below are reported for the test dataset.      remaining nine answer sets for all 10 partitions using the accuracy metric.

5.1. Visual Question Answering
   We assess the difficulty of the VizWiz dataset for modern        Method                Acc        CIDEr       BLEU         METEOR
VQA algorithms and evaluate how well models trained on              Q+I [18]              0.137      0.224       0.000        0.078
VizWiz generalize (more details in Supp. Materials).                Q+I+A [24]            0.145      0.237       0.000        0.082
                                                                    Q+I+BUA [6]           0.134      0.226       0.000        0.077
Baselines. We benchmark nine methods. Included are                  FT [18]               0.466      0.675       0.314        0.297
three top-performing VQA methods [6, 18, 24], which we              FT [24]               0.469      0.691       0.351        0.299
refer to as Q+I [24], Q+I+A [18], and Q+I+BUA [6]. These            FT [6]                0.475      0.713       0.359        0.309
baselines are trained on the VQA V2.0 dataset [18] to pre-          VizWiz [18]           0.465      0.654       0.353        0.298
dict the 3,000 most frequent answers in the training dataset.       VizWiz [24]           0.469      0.661       0.356        0.302
[18] relies on image and question information alone, [24]           VizWiz [6]            0.469      0.675       0.396        0.306
adds an attention mechanism to specify image regions to
focus on, and [6] combines bottom-up and top-down at-
tention mechanisms to focus on objects and other salient          Table 3: Performance of VQA methods on the VizWiz test
image regions. We introduce three fine-tuned classifiers          data with respect to four metrics. Results are shown for
built on the three networks, which we refer to as FT [18],        three variants of three methods [6, 18, 24]: use models as is,
FT [24], and FT [6]. We also train the three networks from        fine-tuned (FT), and trained on only VizWiz data (VizWiz).
scratch using the VizWiz data alone, and we refer to these        The methods use different combinations of image (I), ques-
as VizWiz [18], VizWiz [24], and VizWiz [6].                      tion (Q), and attention (A) models.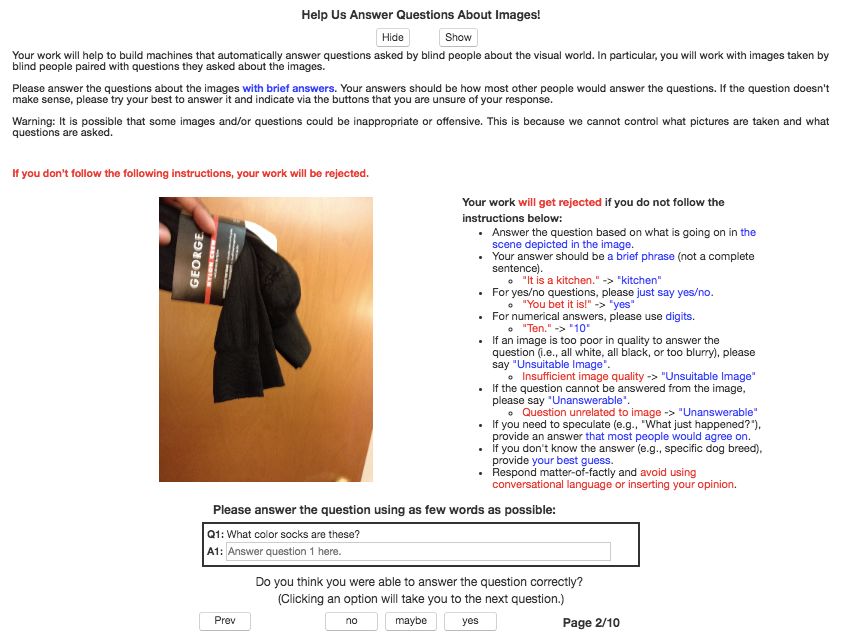
Yes/No     Number      Unans    Other
  Q+I [18]          0.598      0.045       0.070    0.142
  Q+I+A [24]        0.605      0.068       0.071    0.155
  Q+I+BUA [6]       0.582      0.071       0.060    0.143
  FT [18]           0.675      0.220       0.781    0.275
  FT [24]           0.681      0.213       0.770    0.287
  FT [6]            0.669      0.220       0.776    0.294
  VizWiz [18]       0.597      0.262       0.805    0.264
  VizWiz [24]       0.608      0.218       0.802    0.274
  VizWiz [6]        0.596      0.210       0.805    0.273

Table 4: Accuracy of nine VQA algorithms for visual ques-
tions that lead to different answer types.

on image and question information alone [18]. Still, the
improvements are relatively small compared to improve-           Figure 5: Precision-recall curves and average precision
ments typically observed on VQA datasets. We hypothe-            scores for the answerability models tested on the VizWiz
size this improvement is small in part because many images       test dataset.
in VizWiz include few objects and so do not need to attend
to specific image regions. We also suspect attention mod-
els perform poorly on images coming from blind photogra-         The model is trained on the QRPE dataset [30]. We use
phers since such models were not trained on such images.         the model as is (i.e., Q+C [30]), fine-tuned to the VizWiz
   We further enrich our analysis by evaluating the nine         data (i.e., FT [30]), and trained from scratch on the VizWiz
algorithms for visual questions that lead to different an-       data only (i.e., VizWiz [30]). We also employ our top-
swer types (their frequencies in VizWiz are shown in paren-      performing VQA algorithm by using its output probability
theses): “yes/no” (4.80%), “number” (1.69%), “other”             that the predicted answer is “unanswerable” (VQA [18]). We
(58.91%), and “unanswerable” (34.6%). Results are shown          enrich our analysis by further investigating the influence of
in Table 4. Overall, we observe performance gains by             different features on the predictions: question alone (i.e., Q),
fine-tuning algorithms (rows 4–6) and training from scratch      caption alone (i.e., C), image alone using ResNet-152 CNN
(rows 7–9), with the greatest gains for “unanswerable” vi-       features (i.e., I), and the question with image (i.e., Q+I).
sual questions and smallest gains for “number” and “other”       Evaluation Metrics. We report the performance of each
visual questions. Exemplar failures include when asking          method to predict if a visual question is not answerable us-
for text to be read (e.g., captchas, cooking directions) and     ing a precision-recall curve. We also report the average pre-
things to be described (e.g., clothes).                          cision (AP); i.e., area under a precision-recall curve.
   Finally, we evaluate how well algorithms trained on
VizWiz predict answers for the VQA 2.0 test dataset [18].        Results. Figure 5 shows the precision-recall curves. As
The six models that are fine-tuned and trained from scratch      observed, all methods outperform the status quo approach
for the three models [6, 18, 24] do not generalize well; i.e.,   by 25% to 41%; i.e., AP score of 30.6 for [30] versus 71.7
accuracy scores range from 0.218 to 0.318. This result sug-      for Q+I. We hypothesize this large discrepancy arises be-
gests that VizWiz provides a domain shift to a different, dif-   cause the irrelevance between a question and image arises
ficult VQA environment compared to existing datasets.            for more reasons in VizWiz than for QRPE; e.g., low quality
                                                                 images and fingers blocking the camera view. When com-
5.2. Visual Question Answerability                               paring the predictive features, we find the image provides
    We next turn to the question of how accurately an algo-      the greatest predictive power (i.e., AP = 64) and is solidly
rithm can classify a visual question as answerable.              improved by adding the question information (i.e., AP =
                                                                 71.7). Again, we attribute this finding to low quality images
Baselines. We benchmark eight methods. We use the                often leading visual questions to be unanswerable.
only publicly-available method for predicting when a ques-
tion is not relevant for an image [30]. This method uses         6. Conclusions
NeuralTalk2 [23] pre-trained on the MSCOCO captions
dataset [28] to generate a caption for each image. The              We introduced VizWiz, a VQA dataset which orig-
algorithm then measures the similarity between the pro-          inates from a natural use case where blind people took
posed caption and the question to predict a relevance score.     images and then asked questions about them. Our analysis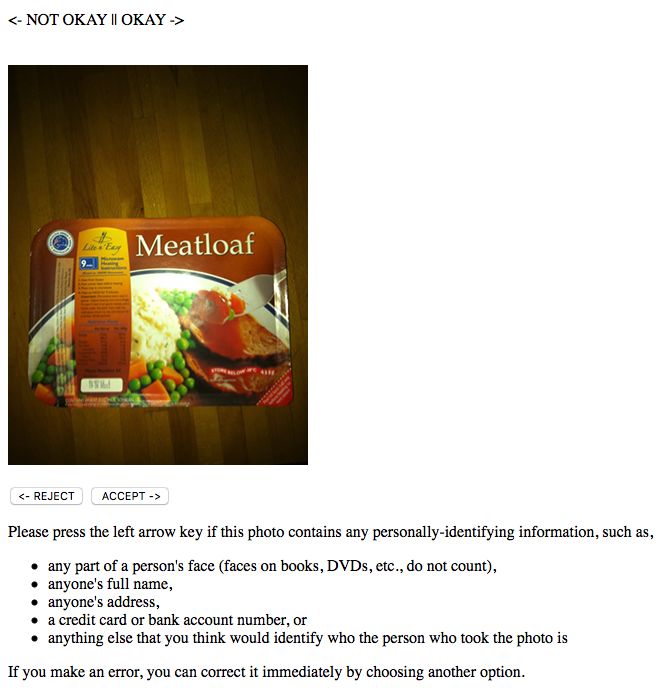
demonstrates this dataset is difficult for modern algorithms.           [11] E. Brady, M. R. Morris, Y. Zhong, S. White, and J. P.
Improving algorithms on VizWiz can simultaneously edu-                       Bigham. Visual challenges in the everyday lives of blind
cate people about the technological needs of blind people                    people. In ACM Conference on Human Factors in Comput-
while providing an exciting new opportunity for researchers                  ing Systems (CHI), pages 2117–2126, 2013. 1, 3
to develop assistive technologies that eliminate accessibility          [12] M. A. Burton, E. Brady, R. Brewer, C. Neylan, J. P. Bigham,
barriers for blind people. We share the dataset and code to                  and A. Hurst. Crowdsourcing subjective fashion advice using
                                                                             VizWiz: Challenges and opportunities. In ACM SIGACCESS
facilitate future work (http://vizwiz.org/data/).
                                                                             conference on Computers and accessibility (ASSETS), pages
                                                                             135–142, 2012. 1, 2
Acknowledgements: We thank Erin Brady, Samuel White,                    [13] X. Chen, H. Fang, T. Lin, R. Vedantam, S. K. Gupta,
and Yu Zhong for supporting the VizWiz deployment, the                       P. Dollár, and C. L. Zitnick. Microsoft coco captions: Data
anonymous users of the VizWiz application for sharing their                  collection and evaluation server. CoRR, abs/1504.00325,
visual questions, the authors of [8] for sharing their answer                2015. 1, 2, 7
collection code, and the anonymous crowd workers for pro-               [14] A. Das, S. Kottur, K. Gupta, A. Singh, D. Yadav, J. M. F.
viding the annotations. This work is supported by NSF                        Moura, D. Parikh, and D. Batra. Visual dialog. In IEEE
awards to D.G. (IIS-1755593), K.G. (IIS-1514118), and J.L.                   Conference on Computer Vision and Pattern Recognition
(IIS-1704309); AWS Machine Learning Research Award                           (CVPR), 2017. 6, 7
to K.G.; Google Research Award to J.P.B.; Microsoft Re-                 [15] J. Deng, W. Dong, R. Socher, L. Li, K. Li, and L. Fei-Fei.
search support to J.P.B.; and New York State support from                    ImageNet: A large-scale hierarchical image database. In
the Goergen Institute for Data Science to J.L.                               IEEE Conference on Computer Vision and Pattern Recog-
                                                                             nition (CVPR), pages 248–255. IEEE, 2009. 4, 6
References                                                              [16] D. Elliott and F. Keller. Image description using visual de-
                                                                             pendency representations. In Conference on Empirical Meth-
 [1]   Be my eyes. http://www.bemyeyes.org/. 2                               ods in Natural Language Processing (EMNLP), pages 1292–
 [2]   http://camfindapp.com/. 1                                             1302, 2013. 7
 [3]   http://www.taptapseeapp.com/. 1, 3                               [17] H. Gao, J. Mao, J. Zhou, Z. Huang, L. Wang, and W. Xu.
 [4]   D. Adams, L. Morales, and S. Kurniawan. A qualitative                 Are you talking to a machine? dataset and methods for
       study to support a blind photography mobile application.              multilingual image question answering. In arXiv preprint
       In International Conference on PErvasive Technologies Re-             arXiv:1505.05612, 2015. 1, 3, 4
       lated to Assistive Environments, page 25. ACM, 2013. 1           [18] Y. Goyal, T. Khot, D. Summers-Stay, D. Batra, and
 [5]   T. Ahmed, R. Hoyle, K. Connelly, D. Crandall, and A. Ka-              D. Parikh. Making the V in VQA matter: Elevating the role
       padia. Privacy concerns and behaviors of people with vi-              of image understanding in visual question answering. arXiv
       sual impairments. In ACM Conference on Human Factors in               preprint arXiv:1612.00837, 2016. 1, 3, 4, 7, 8, 12, 14
       Computing Systems, pages 3523–3532. ACM Conference on
                                                                        [19] S. Ioffe and C. Szegedy. Batch normalization: Accelerating
       Human Factors in Computing Systems (CHI), 2015. 1, 4
                                                                             deep network training by reducing internal covariate shift. In
 [6]   P. Anderson, X. He, C. Buehler, D. Teney, M. Johnson,
                                                                             International Conference on Machine Learning, pages 448–
       S. Gould, and L. Zhang. Bottom-up and top-down attention
                                                                             456, 2015. 12
       for image captioning and visual question answering. arXiv
                                                                        [20] C. Jayant, H. Ji, S. White, and J. P. Bigham. Supporting blind
       preprint arXiv:1707.07998, 2017. 7, 8, 12, 14
                                                                             photography. In ASSETS, 2011. 3
 [7]   J. Andreas, M. Rohrbach, T. Darrell, and D. Klein. Neural
       module networks. In IEEE Conference on Computer Vision           [21] J. Johnson, B. Hariharan, L. van der Maaten, L. Fei-Fei,
       and Pattern Recognition (CVPR), pages 39–48, 2016. 1, 2,              C. L. Zitnick, and R. Girshick. Clevr: A diagnostic dataset
       3, 4                                                                  for compositional language and elementary visual reasoning.
 [8]   S. Antol, A. Agrawal, J. Lu, M. Mitchell, D. Batra, C. L. Zit-        arXiv preprint arXiv:1612.06890, 2016. 1, 2, 3, 4
       nick, and D. Parikh. VQA: Visual Question Answering. In          [22] K. Kafle and C. Kanan. An analysis of visual question an-
       IEEE International Conference on Computer Vision (ICCV),              swering algorithms. arXiv preprint arXiv:1703.09684, 2017.
       pages 2425–2433, 2015. 1, 2, 3, 4, 5, 6, 7, 9, 11                     1, 3, 4, 6, 7
 [9]   J. P. Bigham, C. Jayant, H. Ji, G. Little, A. Miller, R. C.      [23] A. Karpathy and L. Fei-Fei. Deep visual-semantic align-
       Miller, R. Miller, A. Tatarowicz, B. White, S. White, and             ments for generating image descriptions. In IEEE Confer-
       T. Yeh. Vizwiz: Nearly real-time answers to visual ques-              ence on Computer Vision and Pattern Recognition (CVPR),
       tions. In ACM symposium on User interface software and                pages 3128–3137, 2015. 8
       technology (UIST), pages 333–342, 2010. 1, 2, 3                  [24] V. Kazemi and A. Elqursh. Show, ask, attend, and answer: A
[10]   J. P. Bigham, C. Jayant, A. Miller, B. White, and T. Yeh.             strong baseline for visual question answering. arXiv preprint
       Vizwiz:: Locateit-enabling blind people to locate objects in          arXiv:1704.03162, 2017. 1, 7, 8, 12, 14
       their environment. In Computer Vision and Pattern Recog-         [25] D. Kingma and J. Ba. Adam: A method for stochastic opti-
       nition Workshops (CVPRW), 2010 IEEE Computer Society                  mization. arXiv preprint arXiv:1412.6980, 2014. 12
       Conference on, pages 65–72. IEEE, 2010. 2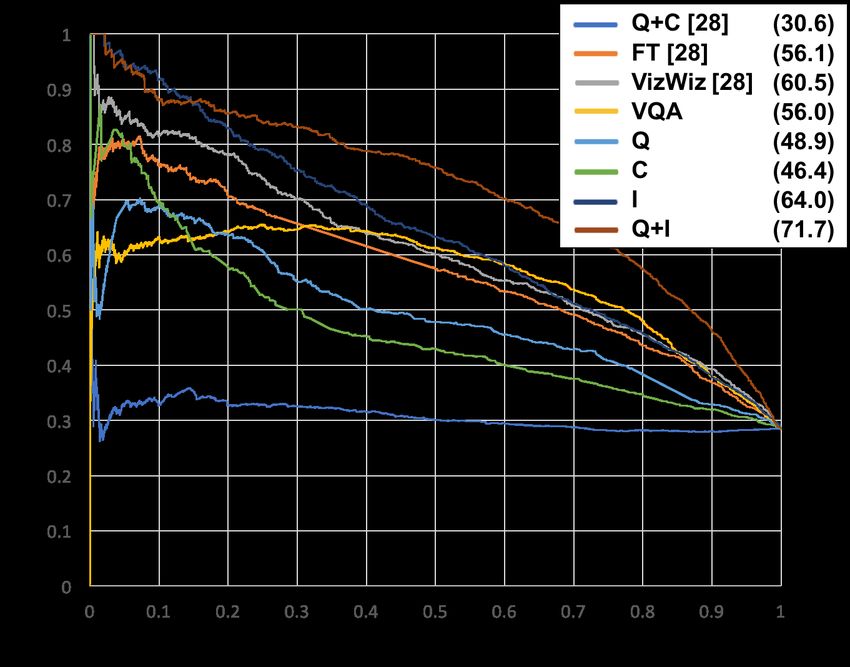
[26] R. Krishna, Y. Zhu, O. Groth, J. Johnson, K. Hata, J. Kravitz,   [37] N. Silberman, D. Hoiem, P. Kohli, and R. Fergus. Indoor seg-
     S. Chen, Y. Kalantidis, L. Li, D. A. Shamma, et al. Vi-               mentation and support inference from RGBD images. Com-
     sual genome: Connecting language and vision using crowd-              puter Vision–ECCV 2012, pages 746–760, 2012. 4
     sourced dense image annotations. International Journal of        [38] N. Srivastava, G. E. Hinton, A. Krizhevsky, I. Sutskever, and
     Computer Vision, 123(1):32–73, 2017. 1, 3, 4                          R. Salakhutdinov. Dropout: A simple way to prevent neu-
[27] W. S. Lasecki, P. Thiha, Y. Zhong, E. Brady, and J. P.                ral networks from overfitting. Journal of machine learning
     Bigham. Answering visual questions with conversational                research, 15(1):1929–1958, 2014. 12
     crowd assistants. In ACM SIGACCESS Conference on Com-            [39] B. Thomee, D. A. Shamma, G. Friedland, B. Elizalde, K. Ni,
     puters and Accessibility (ASSETS), number 18, pages 1– 8,             D. Poland, D. Borth, and L. Li. YFCC100M: The new
     2013. 1, 2                                                            data in multimedia research. Communications of the ACM,
[28] T. Lin, M. Maire, S. Belongie, J. Hays, P. Perona, D. Ra-             59(2):64–73, 2016. 4
     manan, P. Dollar, and C. L. Zitnick. Microsoft COCO: Com-        [40] A. S. Toor, H. Wechsler, and M. Nappi. Question part rel-
     mon objects in context. In IEEE European Conference on                evance and editing for cooperative and context-aware vqa
     Computer Vision (ECCV), pages 740–755, 2014. 1, 2, 3, 4, 8            (c2vqa). In International Workshop on Content-Based Mul-
[29] H. MacLeod, C. L. Bennett, M. R. Morris, and E. Cutrell.              timedia Indexing, page 4. ACM, 2017. 3, 6
     Understanding blind people’s experiences with computer-          [41] M. Vázquez and A. Steinfeld. An assisted photography
     generated captions of social media images. In ACM Confer-             framework to help visually impaired users properly aim a
     ence on Human Factors in Computing Systems (CHI), pages               camera. In ACM Transactions on Computer-Human Interac-
     5988–5999. ACM, 2017. 1                                               tion (TOCHI), volume 21, page 25, 2014. 3
[30] A. Mahendru, V. Prabhu, A. Mohapatra, D. Batra, and              [42] R. Vedantam, L. C. Zitnick, and D. Parikh. CIDEr:
     S. Lee. The promise of premise: Harnessing question                   Consensus-based image description evaluation. In IEEE
     premises in visual question answering. arXiv preprint                 Conference on Computer Vision and Pattern Recognition
     arXiv:1705.00601, 2017. 1, 3, 6, 8, 14                                (CVPR), pages 4566–4575, 2015. 7
[31] M. Malinowski and M. Fritz. A multi-world approach to            [43] P. Wang, Q. Wu, C. Shen, A. Dick, and A. Hengel. FVQA:
     question answering about real-world scenes based on uncer-            fact-based visual question answering. IEEE Transactions on
     tain input. In Advances in Neural Information Processing              Pattern Analysis and Machine Intelligence, 2017. 1, 3, 4
     Systems (NIPS), pages 1682–1690, 2014. 1, 3, 4                   [44] P. Wang, Q. Wu, C. Shen, A. Hengel, and A. Dick. Explicit
[32] K. Papineni, S. Roukos, T. Ward, and W. Zhu. BLEU: A                  knowledge-based reasoning for visual question answering.
     method for automatic evaluation of machine translation. In            arXiv preprint arXiv:1511.02570, 2015. 1, 3, 4
     Proceedings of the 40th Annual Meeting on Association for        [45] S. Wu, J. Wieland, O. Farivar, and J. Schiller. Automatic alt-
     Computational Linguistics (ACL), pages 311–318. Associa-              text: Computer-generated image descriptions for blind users
     tion for Computational Linguistics, 2002. 7                           on a social network service. In CSCW, pages 1180–1992,
[33] G. Patterson and J. Hays. Sun attribute database: Discover-           2017. 1
     ing, annotating, and recognizing scene attributes. In IEEE       [46] J. Xiao, J. Hays, K. A. Ehinger, A. Oliva, and A. Torralba.
     Conference on Computer Vision and Pattern Recognition                 Sun database: Large-scale scene recognition from abbey to
     (CVPR), pages 2751–2758. IEEE, 2012. 1, 2                             zoo. In IEEE Conference on Computer Vision and Pattern
[34] A. Ray, G. Christie, M. Bansal, D. Batra, and D. Parikh.              Recognition (CVPR), pages 3485–3492. IEEE, 2010. 1, 2
     Question relevance in VQA: Identifying non-visual and            [47] L. Yu, E. Park, A. C. Berg, and T. L. Berg. Visual madlibs:
     false-premise questions. arXiv preprint arXiv:1606.06622,             Fill in the blank image generation and question answering. In
     2016. 3, 6                                                            IEEE International Conference on Computer Vision (ICCV),
[35] M. Ren, R. Kiros, and R. S. Zemel. Exploring models and               pages 2461–2469, 2015. 1, 3, 4
     data for image question answering. In Advances in Neural         [48] Y. Zhong, P. J. Garrigues, and J. P. Bigham. Real time ob-
     Information Processing Systems (NIPS), pages 2935–2943,               ject scanning using a mobile phone and cloud-based visual
     2015. 1, 3, 4                                                         search engine. In SIGACCESS Conference on Computers
[36] O. Russakovsky, J. Deng, H. Su, J. Krause, S. Satheesh,               and Accessibility, page 20, 2013. 3
     S. Ma, Z. Huang, A. Karpathy, A. Khosla, M. Bernstein,           [49] Y. Zhu, O. Groth, M. Bernstein, and L. Fei-Fei. Visual7W:
     et al. Imagenet large scale visual recognition challenge. In-         Grounded question answering in images. In IEEE Confer-
     ternational Journal on Computer Vision (IJCV), 115(3):211–            ence on Computer Vision and Pattern Recognition (CVPR),
     252, 2015. 1, 2                                                       pages 4995–5004, 2016. 1, 3, 4
Supplementary Materials which words in the answers neither reflected common nor
popular modern words: (1) Enchant2 provides an API to
This document supplements the main paper with the fol-
multiple libraries such as Aspell/Pspell and AppleSpell and
lowing details about:
(2) an algorithm invented by Google search quality direc-
1. I - Filtering visual questions (supplements Section tor Peter Norvig3 , that is based on frequent words in popu-
3.2). lar Wikipedia articles and movie subtitles, and so augments
modern words such as iPhone and Gmail. Both the afore-
2. II - Collecting answers to visual questions (supple- mentioned tools also employ different mechanisms to re-
ments Section 3.3). turn correct word candidates. When the most probable cor-
rect word from both tools matched, we replaced the orig-
3. III - Analyzing the VizWiz dataset (supplements Sec- inal word with the candidate. For the remaining answers,
tion 4). we solicited the correct spelling of the word from trusted
4. IV - Benchmarking algorithm performance (supple- in-house human reviewers. We found many of the detected
ments Section 5). “misspelled” words were valid captchas and so did not need
spell-correction.
I - Filtering Visual Questions Crowdsourcing System
We first used the crowdsourcing system shown in Fig- We show the Amazon Mechanical Turk (AMT) interface
ure 6 to identify images showing personal-identifying in- that we used to collect answers in Figure 7. We limited our
formation. To err on the safe side in protecting all involved users to US citizens to minimize concerns about whether a
parties, we next iteratively developed a taxonomy of possi- person is familiar with the language. We also limited our
ble vulnerabilities people face when working with a VQA users to those who previously had 95% jobs approved for
dataset created “in the wild”. During an initial brainstorm- over 500 jobs to increase the likelihood of collecting high
ing session, we identified the following three categories: quality results. Finally, we used the “Adult Qualification” in
(1) personally-identifying information, also called PII (e.g., AMT to ensure our selected crowd was comfortable review-
any part of a person’s face, financial statements, prescrip- ing adult content. This was important because visual ques-
tions), (2) Location (e.g., addressed mail, business loca- tions are gathered “from the wild” so could contain content
tions), and (3) Adult Content (e.g., nudity, cuss words). We that is not appropriate for a general audience (e.g., nudity).
then examined the robust-ness of this taxonomy by eval-
uating the inter-annotator agreement between three domain III - VQA Dataset Analysis
experts who reviewed 1,000 randomly-selected visual ques-
tions and labeled “vulnerable” instances. We found exactly Question Length Distribution
one person marked a visual question for removal for the We augment the statistics supplied in the main paper,
majority of instances (i.e., 44) that visual questions were with the fine-grained distribution showing the number of
tagged for removal (i.e., 64). We found most disagreements words in each visual question in Figure 8. We cut the plot
occurred on visual questions for which the researchers were off at 30 words in the visual question4 . This distribution
not sure, such as in poor quality images or complex scenes. highlights the prevalence of outliers with few words or 10s
We therefore added two more categories to our taxonomy of words in the question.
that reflected our desire to err on the safe side: (4) Ques-
tionable Complex Scenes and (5) Questionable Low Quality Average Image Excluding “Unanswerable" Visual
Images. Questions
We show a parallel image supplied in the main paper
II - Answer Collection here, with the only change being that we show the aver-
Answer Post-Processing age of all images excluding those coming from visual ques-
tions labelled as unanswerable. The resulting image shown
Following prior work [8], we converted all letters to in Figure 9 resembles that shown in the main paper by also
lower case, converting numbers to digits, and removing being a gray image, and so reflecting a diverse set of images
punctuation and articles (i.e., “a”, “an”, “the”). We fur- that do not conform to a particular structure.
ther post-processed the answers by fixing spelling mistakes
2 https://www.abisource.com/projects/enchant/
and removing filler words (i.e., “it’”, “is”, “its”, “and”,
3 http://norvig.com/spell-correct.html
“&”, “with”, “there”, “are”, “of”, “or”). For spell check- 4 There is a small tail of visual questions that spread to a maximum of
ing, we relied on two automated spell-checkers to reveal 62 words in the question.Figure 6: AMT user interface for identifying images showing PII.
Answer Analysis initialize the corresponding parameters from the pre-trained
model, and if not, we randomly initialize the parameters.
We show in Figure 10 sunburst diagrams which vi-
We use Adam solver [25] with a batch size of 128 and an
sualize the frequency that answers begin with different
initial learning rate of 0.01 that is dropped to 0.001 after
words/phrases. The most common answers, following “Un-
the first 10 epochs. The training is stopped after another 10
suitable Image” and “Unanswerable”, are yes, no, and col-
epochs. We employ both dropout [38] and batch normaliza-
ors. We observe there is a large diversity of uncommon
tion [19] during training.
answers as well as answer lengths spanning up to 6 words
In the main paper, we also report results for models
long.
trained from scratch. Each model is trained using the 3,000
We also show in Figure 11 plots of the cumulative cov-
most frequent answers in the train split of VizWiz. We ini-
erage of all answers versus the most frequent answers. The
tialize all parameters in the model to random values.
straight line with a slope of roughly 1 further illustrates the
Finally, we report fine-grained details to expand on our
prevalence of a long tail of unique answers.
findings reported in the main paper about how well algo-
IV - VizWiz Algorithm Benchmarking rithms trained on VizWiz predict answers for the VQA 2.0
test dataset [18]. We report results for the six models that
VQA are fine-tuned and trained from scratch for the three mod-
In the main paper, we report results for fine-tuned mod- els [6, 18, 24] with respect to all visual questions as well
els. We fine-tune each pre-trained model on VizWiz us- as with respect to the four answer types in Table 5. These
ing the most frequent 3,000 answers in the training set of results highlight that VizWiz provides a domain shift to a
different, difficult VQA environment compared to existing
VizWiz. For the initialization of the last layer, if the answer
datasets.
is in the candidate answer set of VQA V2.0 dataset [18], weFigure 7: AMT user interface for collecting answers to visual questions.
Figure 8: Distribution of number of words per visual question.Model Average Precision Average F1 score
Q+C [30] 0.306 0.383
FT [30] 0.561 0.542
VizWiz [30] 0.605 0.549
VQA [18] 0.560 0.569
Q 0.490 0.233
C 0.464 0.270
I 0.640 0.518
Q+I 0.717 0.648
Table 6: Shown are the average precision scores and aver-
age F1 scores for eight models used to predict whether a
visual question is answerable.
Figure 9: The average image created using all images in
VizWiz, excluding those that are in unanswerable visual
questions.
(a)
All Yes/No Number Other
FT [18] 0.300 0.612 0.094 0.079
FT [24] 0.318 0.601 0.163 0.110
FT [6] 0.304 0.595 0.082 0.105
VizWiz [18] 0.218 0.461 0.074 0.042
VizWiz [24] 0.228 0.465 0.131 0.049
VizWiz [6] 0.219 0.453 0.083 0.048
Table 5: Shown is the cross-dataset performance of six
models trained on VizWiz and tested on the VQA 2.0 test
dataset [18].
Answerability
Below is a brief description of the implementations of
the models we use in the main paper:
• Q: a one-layer LSTM is used to encode the question
and is input to a softmax layer.
(b) • C: a one-layer LSTM is used to encode the caption and
is input to a softmax layer.
Figure 10: Distribution of the first six words for (a) all an-
swers in VizWiz and (b) all answers in VizWiz excluding • I: ResNet-152 is used to extract the image features
unanswerable visual questions. The innermost ring repre- from the pool5 layer and is input to a softmax layer.
sents the first word and each subsequent ring represents a
subsequent word. The arc size is proportional to the num- • Q+C: the question and caption are encoded by two sep-
ber of answers with that initial word/phrase. arate LSTMs and then the features of the question and
caption are concatenated and input to a softmax layer.
• Q+I the features of question and image are concate-
nated and input to a softmax layer.(a)
(b)
Figure 11: Cumulative number of visual questions covered by the most frequent answers in VizWiz for (a) all answers in
VizWiz and (b) all answers in VizWiz excluding unanswerable visual questions.
For the fine-tuned model, we initialize the parameters us- using the AP score or F1 score.
ing the pre-trained model. We train from scratch by ran- We also show the top 10 most confident answerable and
domly initializing the parameters. For both approaches, we answerable predictions for the top-performing Q+I imple-
train for 10 epochs on the VizWiz dataset. mentation in Figure 12. Our findings highlight how predic-
We augment here our findings of the average precision tive cues may relate to the quality of images and specific
in the main paper with the average F1 score in Table 6. As questions (e.g., “What color...?”).
observed, the top-performing method remains Q+I whetherYou can also read