CACI - Derby City Council
←
→
Page content transcription
If your browser does not render page correctly, please read the page content below
CACI Property Consulting

                        Derby City Centre
         Retail Circuit Strategy 2008-2012
                               Full Report – Final

                     Simon Ho,
                     Managing Consultant
                     Colette Shields,
                     Account Manager
                     Property Consultancy Group

                     Date:    November 2008

                     Tel:     0207 605 6226

                     Email:   sho@caci.co.uk

Page 1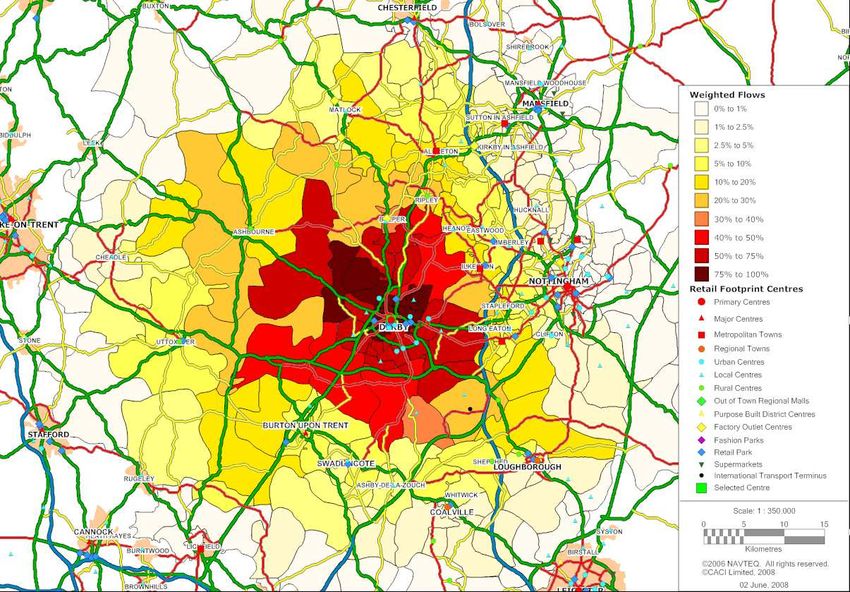
CACI Property Consulting

 Report Structure

     1. Project Scope and Methodology

     2. Derby’s Current Catchment and Competition

     3. Centre Benchmarking & Potential to change Market
        Positioning

     4. Current Retail Provision and Pitch Performance

     5. Future Retail Circuit and Zone Strategy

     6. Future Option Testing

     7. Conclusions & Recommendations

Page 2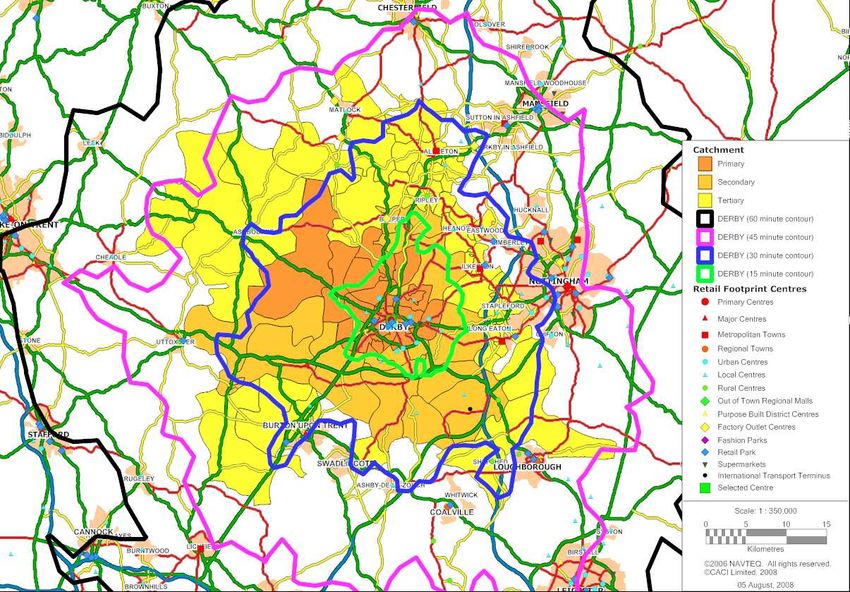
CACI Property Consulting

         Derby City Retail Circuit

          1. Project Scope and Methodology

Page 3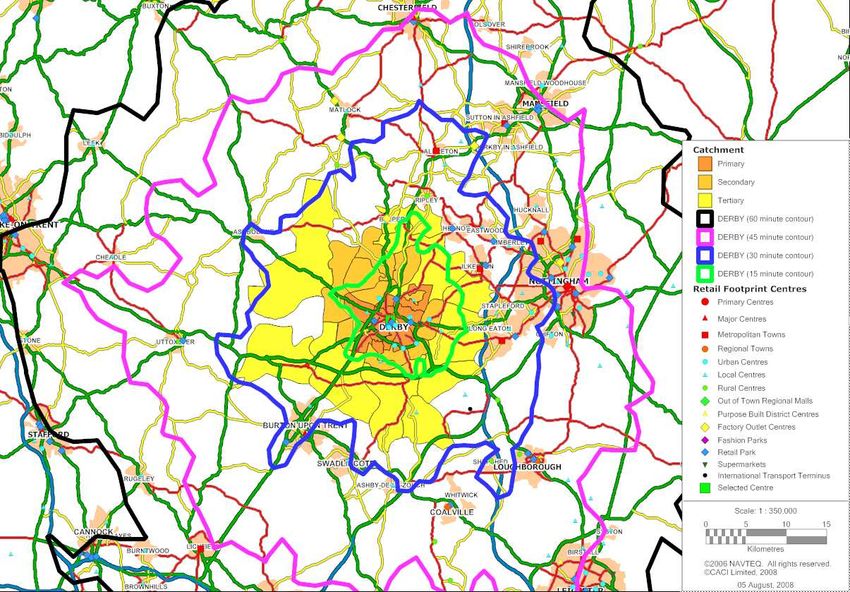
CACI Property Consulting

 Project Scope
        CACI have been instructed by Derby City Council to examine the current retail market for the Derby
         City’s Retail Circuit and to assess the strengths, weaknesses, opportunities and threats for a
         strategy to maximise the future performance of the city’s retail.
        This project has been commissioned shortly following the opening of the new Westfield Derby
         scheme. This means that it has been able to review the year 1 performance of the new scheme, and
         what the short-term consequences have been for Derby City as a whole.
        CACI have been able to review the subsequent implications for Derby’s retail ranking and
         attractiveness as a location for retail and leisure operators.
        A major part of the project has been to review the potential for new operators to take existing space
         within the city, and what part the new Cathedral Quarter BID can play in making this a commercial
         reality.

Page 4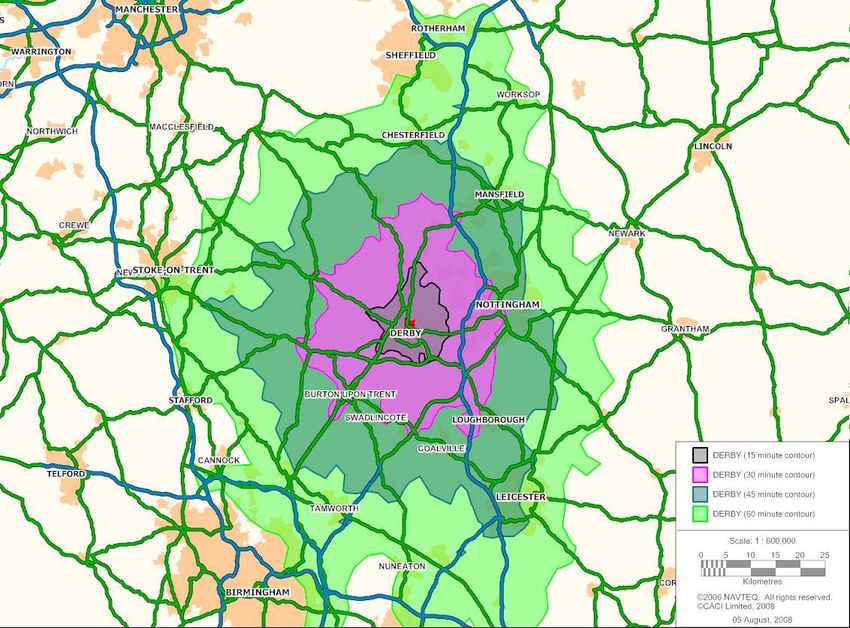
CACI Property Consulting

 Project Scope
        Provide a strategy for the city centre that includes:
             A short term solution to capitalise on new visitors to Derby attracted by the
              opening of Westfield Derby.
             A longer term strategy for Derby City Centre ensuring that the centre’s regional
              position is consolidated.
             A qualification of the fit between Derby Cathedral Quarter BID aims and an
              optimal strategy for the city centre as a whole.
        Address the following issues:
             Help to understand target consumers and identify missing shoppers & visitors to
              the City.
             Identify and analyse distinct trading zones / pitches in the City Centre.
             Identify gaps for new complementary food and drink, leisure and retail
              requirements in the city centre.
             Define areas undergoing change and advise on strategy to revitalise these areas.
             Advise on new uses for vacant and underperforming sites/premises.

Page 5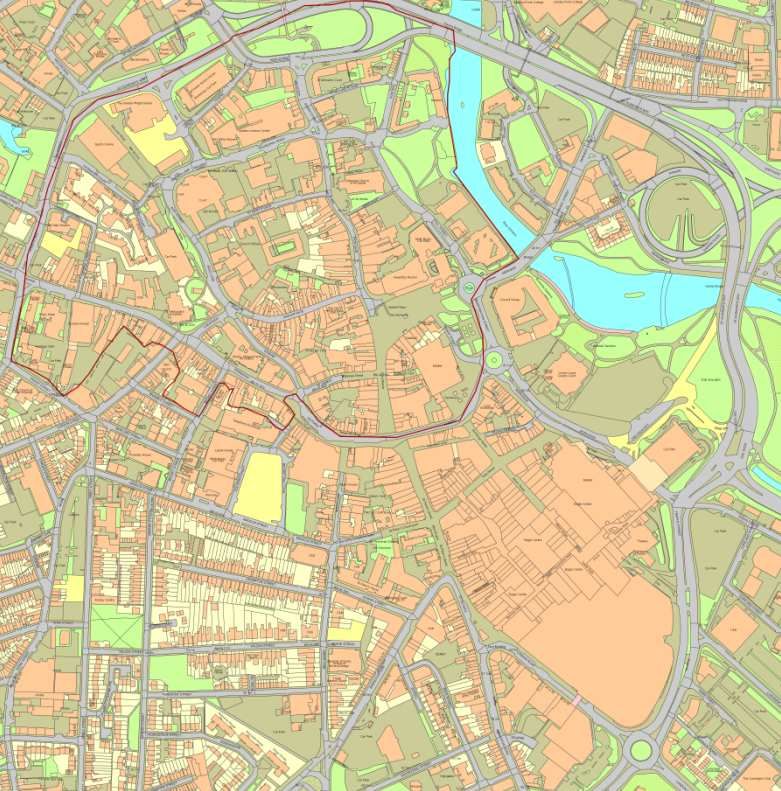
CACI Property Consulting

 Methodology – Shopper Flows
                                                                             Stratford-upon-
  Retail Footprint predicts the flow of shoppers
                                                       Leamington            Avon
   at postcode sector level to competing retail
   destinations. It is a consumer driven model         Spa
   that reflects the choices available to shoppers
   for comparison goods shopping trips.
  For each postcode sector, the market is
   allocated out to centres as a function of the
   size (or attraction) of the centre versus the
   accessibility (cost) of travelling there.
  The Retail Footprint Score (RF Score)                         CV37 6
   measures the size of each centre.           It is
   weighted by the national average turnover per
   outlet for each retailer within the centre.
  Ultimately, Retail Footprint defines overlapping
   catchments for over 3,000 retail centres within
   the United Kingdom. This enables assessment
   of market potential, competition levels, and
   consumer groups.
  Retail Footprint catchments are defined by the                          Birmingham
   sub catchments: Primary (first 50% of
   shoppers), Secondary (next 25% of shoppers),
                                                        Oxford
   Tertiary (next 15% of shoppers), and
   Quaternary (final 10% of shoppers).

Page 6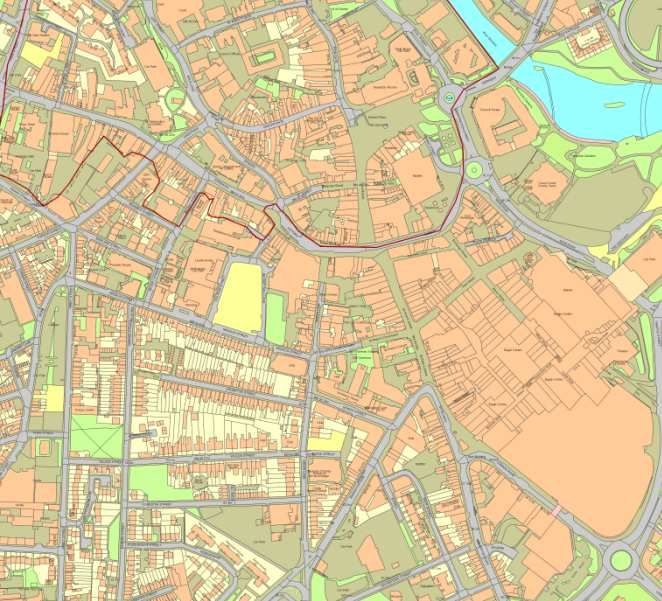
CACI Property Consulting
Methodology – Retail Centre Class
In Retail Footprint, centres are further described by their Class, which defines the role or function of centres within the
retail hierarchy and the consequent characteristics of shopping trips. For instance, Classes such as ‘Primary Centres’ see
strong shopper flows over large distances, and very strong flows from local customers. At the other end of the hierarchy
customers will only travel to ‘Small Rural Centres’ or ‘Small Local Centres’ if they live very close.
CACI recalibrate Retail Footprint on an annual basis using new data on shopper flows received from a combination of
credit and debit card transactions, client’s own in-house exit surveys and loyalty cards.
30
Average Drive Time (minutes)
25
20
15
10
5
0
es
s
es
s
s
ns
es
ns
es
s
tre
n
tre
tre
ls
rk
tr
tr
io
w
tr
tr
w
al
en
en
en
Pa
en
en
To
sh
en
en
To
lM
lC
C
lC
C
C
Fa
tC
tC
ng
al
na
an
n
or
y
ra
ca
on
le
ba
pi
ar
ic
ith
io
li t
aj
Ru
Lo
ut
tr
op
im
gi
Ur
eg
po
M
w
is
O
Re
Pr
Sh
s
R
D
ro
y
rk
n
or
et
ilt
or
Pa
w
M
Bu
ct
aj
To
Fa
il
M
e
ta
of
os
Re
ut
rp
O
Pu
Page 7
CACI Property Consulting

 Methodology – Market Positioning
  Retailers have also been divided into Premium, Mass and Value categories in order to provide greater understanding of the
    market position and role of centres. Value retailers include Poundstretcher, TK Maxx, Argos, Woolworths, New Look, and
    Peacocks. Mass retailers include WHSmith, Top Shop, Clinton Cards, Next, and Dixons. Premium retailers include House of
    Fraser, Selfridges, French Connection, Zara, LK Bennett, and Joseph.
  The proportion of Value, Mass and Premium retailers present in a major centre will have an effect on the distances people will
    travel to get to a centre. Value orientated major centres have smaller more localised catchments, while shoppers will be willing
    to travel further to reach a Premium offer.
  In the case of regional centres, people are more willing to drive longer distances for the larger scale retail offer, amongst which a
    good provision of premium shops can be found.
                              Regional Centre                              Quality Major Centre
                              Average Major Centre                         Value Major Centre
                       100%

                       90%

                       80%

                       70%
          % Shoppers

                       60%

                       50%
                       40%

                       30%
                       20%

                       10%

                        0%
                          0

                              5

                                    10

                                          15

                                                20

                                                       25

                                                             30

                                                                   35

                                                                          40

                                                                                 45

                                                                                        50

                                                                                               55

                                                                                                      60
                                                     Drivetime Band (minutes)

Page 8
CACI Property Consulting

 ACORN: An Overview
        ACORN combines geography with demographics and lifestyle information, grouping the entire population into 5
         categories, 17 groups and 56 types. By analysing significant social factors and consumer behaviour, it provides precise
         information and an in-depth understanding of the different types of consumers in every part of the country.
        ACORN can be used proactively as part of a shopper-focused tenant mix strategy, to facilitate ongoing asset
         management, for effective catchment zoning and ‘battleground’ analysis, and to drive marketing and shopper
         communication strategies.

                                                            ACORN

                     Wealthy Achievers Urban Prosperity      Comfortably Off   Moderate Means      Hard Pressed
                        Category 1         Category 2          Category 3         Category 4         Category 5

                        Groups A - C      Groups D - F         Groups G - J     Groups K - M       Groups N - Q

                        Types 1 - 12      Types 13 - 23        Types 24 - 36     Types 37 - 43     Types 44 - 56

                    Most Affluent                                                           Most Deprived

Page 9
CACI Property Consulting

          Derby City Retail Circuit
          2. Derby’s Current Catchment and
                     Competition

Page 10
CACI Property Consulting
Study Area – Drivetimes from Derby City Centre
Derby City is located to the west
of the M1, from which it gains
strategic access to the north and
south.
Nottingham to the east,
Loughborough to the south-east
and Burton-Upon Trent to the
south-west are located 30
minutes drivetime from Derby.
Chesterfiield to the north,
Mansfield to the north-east and
Leicester to the south-east are
located 45 minutes drivetime
from Derby.
Stoke-On-Trent to the west,
Birmingham to the south-west
and Sheffield to the north all lie
60 minutes drivetime from
Derby.
Derby benefits from a number of
radial A-Roads providing access
north-west, north, east, south-
east, south-west and west.
Access directly south is the least
convenient.
Page 11CACI Property Consulting
Derby 2007 catchment*
2007 Retail Catchment Map Centre Class Average Major Centre
Retail Footprint Score 543 Centres competing
Ranking 53 locally within Derby’s
catchment shoppers
Comparison goods exp £429.7m include Burton-On-
Share of 15 minute catchment 63.8% Trent, McArthur-Glen
Outlet Centre at
Share of 15-30 min catchment 14.8% Mansfield, the
Share of 30-45 min catchment 1.0% metropolitan towns of
Long Eaton and
Ilkeston.
Belper local centre and
the Wyvern and
Kingsway retail parks
trade within Derby’s
core market area.
Derby’s main
competitor is
Nottingham, located
over 30 minutes
drivetime away.
Despite relative low
levels of local
competition, Derby’s
catchment in 2007
was not filling its full
potential – in
particular with respect
to it not extending
further into the 30
minute drivetime of
the city.
* This scenario was prior to the opening of the Westfield Extension in Derby
Page 12CACI Property Consulting
Derby 2008 catchment*
2008 Retail Catchment Map Centre Class Average Regional Centre
Retail Footprint Score 716 Derby’s new Major
Ranking 38 Catchment, where
90% of spend comes
Comparison goods exp £682.9m from, has substantially
Share of 15 minute catchment 76.1% expanded following
the opening of the
Share of 15-30 min catchment 29.9% Westfield extension. It
Share of 30-45 min catchment 4.0% is now contained
within a 45 minute
drivetime of Derby.
The Core Catchment
(Primary & Secondary)
is contained within a
30 minute drivetime.
To the south and
south-east of Derby,
the major catchment
is contained within 30
minutes, due to the
influences of Burton-
On-Trent and
Loughborough.
To the east and north-
east the catchment is
similarly contained,
due to Nottingham,
just 30 minutes away.
There is less
competition to the
west, meaning the
catchment extends
further.
* This scenario is prior to the opening of Leicester’s Highcross extension and Nottingham Trinity Square scheme due to open later in 2008.
Page 13CACI Property Consulting
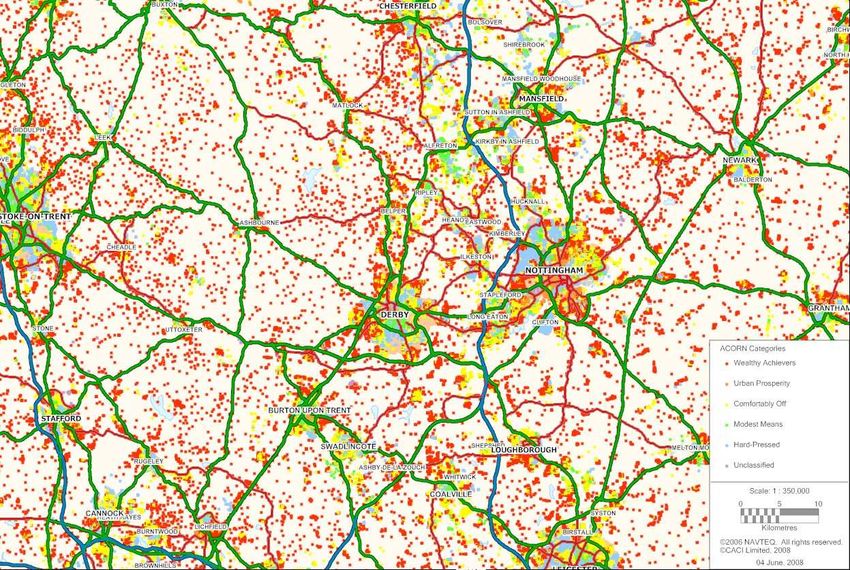
Derby Catchment Area: ACORN Spatial Distribution
The ACORN Category
of each postcode in
the catchment area of
Derby has been
plotted, providing a
visual clue to the
spatial distribution of
Derby’s varying
demographic groups.
The higher
concentration of
‘ACORN dots’ reflects a
larger concentration of
postcodes, and hence
population.
A number of
residential areas
within Derby’s
catchment have been
identified on the map,
which represent
important areas from
which Derby needs to
attract trade. These
areas are used on the
next page to
understand what
market share Derby is
taking from these
areas.
Page 14CACI Property Consulting
Current Shopper Flows Map
The better north-south connections
compared with east-west is a benefit
to Derby’s ability to attract market
shares.
The areas to the north and west
access Nottingham via Derby, which
means Derby achieves higher market Competition
shares from these residents. here with
Nottingham is
intense.
Market shares
extend further west
due to less
competition.
Derby is in direct competition with
Nottingham in this area, with Derby
benefiting from the residents living
west of the M1. The Westfield
extension has succeeded in turning
customers back towards Derby.
Wealthier residents living to the
This area is good territory for Derby,
north of Burton-On-Trent now have
with Nottingham further away and a
an alternative to shopping in their
weaker retail offer in Burton-On-
more local Average Centre. These are
Trent & Loughborough.
newly won customers, due to the
improved offer from the Westfield
extension.
Page 15CACI Property Consulting
Derby’s Catchment Residents: ACORN Group Profile
Derby Shopper Profile 07 Derby Shopper Profile 08 UK average 30 minutes of Derby
20%
18%
16%
14%
% Shoppers
12%
10%
8%
6%
4%
2%
0%
es
es
s
ip
es
es
es
ys
t
ts
a
s
es
ls
ty
le
es
s
u
er
bi
sh
te
oo
iti
ili
ili
na
i li
gl
O
re
si
ng
il i
iv
ur
n
m
m
ni
m
un
d
in
er
am
G
R
io
g
io
ut
ar
Si
ub
Fa
ba
Fa
t in
a
S
dv
ss
m
ns
r
t
ec
F
H
lla
n
lF
g
d
S
Ur
m
fe
ar
A
g
ue
ng
Pe
re
Ex
in
ne
e
Co
ia
in
d
Co
o
St
s
y
ir
cu
ed
ffl
hi
tle
Pr
i
de
gl
tr
it
t
-R
sp
e-
hy
en
s
A
C
Se
us
ug
at
an
et
ri
ur
s
lu
A
h
lt
ud
r
u
uc
ou
nd
S
ig
ea
si
tr
B
B
ne
ro
H
Pr
A
S
Ed
Fl
-I
W
In
pe
st
os
Po
Pr
Derby’s catchment shopper demographic profile provides strong market opportunities, with an above average presence of
Wealthy Achievers and a particularly high level of Secure Families (15.9% of shoppers, index of 111 against UK average).
There are indices of Wealthy Executives, Affluent Greys, Flourishing Families and Settled Suburbia are 8.7%, index of 114,
13.3%, index of 166, 9.2%, index of 115 and 10.4%, index of 159 respectively. This means Derby will be more resilient to an
economic turn-down and has a large population of family groups – who have particularly strong shopping patterns, supporting
a wide-range of retail categories.
Derby’s catchment is generally older and more suburban and rural than those of larger cities, with less Professionals, Educated
Urbanites and Aspiring Singles than the UK average. The impact of improving the retail offer in Derby has been to draw in
more people from all groups, but in particular the relative proportion of Affluent Greys and Flourishing Families has increased.
NB Derby Shopper Catchment Profiles ’07 and ’08 derived from respective Retail Footprint catchments. The difference in profiles is the result of the
Page 16 change in shopper catchment between 2007 and 2008 due to the improved shopping offer brought about by the Westfield Extension. It should
be noted that this profile shows the POTENTIAL to draw spend from each group, as opposed to actual spend attainment.CACI Property Consulting
Derby’s Catchment Residents: ACORN Group Profile
Derby Nottingham
20%
18%
16%
14%
% Shoppers
12%
10%
8%
6%
4%
2%
0%
s
ut
ys
ip
es
ia
es
es
ty
es
rs
s
es
es
ls
s
s
le
ot
ie
ve
rb
sh
na
O
ne
re
si
gl
ili
ili
ili
it
ili
ng
o
it
er
ti
n
u
m
g
n
m
G
rd
am
m
io
R
io
n
ba
ub
Si
in
Si
u
dv
u
Fa
Fa
Fa
ss
t
a
ns
r
ec
en
m
rt
a
F
H
r
g
S
ed
A
fe
U
ll
Pe
in
Ex
a
g
m
g
al
re
u
d
e
co
St
in
y
ro
en
in
d
is
fl
ri
ir
le
o
cu
it
nt
y
te
e-
gl
C
f
sh
sp
st
P
R
tt
rd
C
A
h
Se
ca
g
de
an
lu
du
s
Se
lt
h
ri
A
er
u
ru
ou
ig
ea
B
u
u
B
ru
si
In
n
Ed
o
St
H
er
W
In
A
P
Fl
t
sp
os
ro
P
P
Derby’s profile of Wealthy Executives, Affluent Greys and Flourishing Families is as strong as that of Nottingham, and actually
has higher relative proportions of Secure Families and Settled Suburbia.
Whilst difficult to compete against Nottingham for the younger and more urban lifestyle groupings, Derby’s profile enables
Derby to compete for custom from all other shopping groups. The main exception here would be the Starting Out group,
where there is the same relative proportion of this group in Derby’s catchment as there is in Nottingham.
There is an opportunity for Derby to differentiate from Nottingham by focusing on its profile strengths, to appeal to family
groups and older groups.
Page 17CACI Property Consulting
ACORN Groups – Typical Retailers
Wealthy Affluent Flourishing Prosperous Educated Aspiring Starting Secure Settled
Executives Greys Families Professionals Urbanites Singles Out Families Suburbia
John Lewis Jacques Vert Polo Ralph Lauren Karen Millen Diesel Mango Warehouse Debenhams Marks & Spencer
Russell & Bromley Country Casuals Fiorelli L K Bennett Whistles Zara Oasis Next Hawkshead
Mulberry Church's Lacoste Reiss Jigsaw Office Schuh Dorothy Perkins Clarks
Mappin & Webb Viyella Petit Bateau Hobbs Ted Baker GAP Sole Trader Top Shop Wallis
DAKS Windsmoor Ecco Hugo Boss Dune Elle Bank Mothercare Principles
Austin Reed Marks & Spencer Daisy & Tom Gieves & Hawkes Crew Clothing Adams HoF
Molton Brown EWM Fat Face Pink T M Lewin Miss Selfridge H&M
Bally Monsoon Jo Malone River Island
Prudent Asian Post Industrial Blue-collar Struggling Burdened High Rise Inner City
Pensioners Communities Families Roots Families Singles Hardship Adversity
Damart Littlewoods New Look Barratts Woolworths Aldi Internacionale Bon Marche
Scholl Morrisons Bay Trading Co Burton M K One Shoe Express Bacons Shoes QS
Littlewoods Matalan H Samuel Peacocks Stead & Simpson Primark Bewise Shoefayre
BHS Argos T K Maxx George Ciro Citterio Cromwell's Madhouse The Officers Club
Claire's Slater Menswear BHS Shoe Zone
Ethel Austin TJ Hughes
Wealthy Executives are some of the most affluent people in the UK. They live in wealthy, high status suburban, rural and
semi-rural areas of the country. Since incomes in this group are high, the shoppers favour upmarket, quality retailers such as
Jigsaw, Austin Reed, Jaeger, Ted Baker, John Lewis, Jones the Bootmaker, Karen Millen and Monsoon.
Flourishing Families are wealthy families with mortgages. The live in established suburbs, new housing developments around
commuter towns and villages and rural areas. These are high income achievers, successfully juggling both jobs and families.
Preferred shops range from the upmarket traditional House of Fraser & John Lewis to the mass brands of Debenhams. H&M,
Fat Face, Coast and The Body Shop.
Secure Families comprises of home owning families living comfortably in stable areas in suburban and semi-rural locations.
People are employed in a range of occupations, including middle management and clerical roles. The retail choices of Secure
Families demonstrate lower spending patterns with many mass and value retailers featuring. Dorothy Perkins, New Look,
River Island and Miss Selfridge for womenswear and Next for men.
Page 18CACI Property Consulting
Current Catchment Summary – RF Catchment Areas
Total comparison Weighted
Total Total Market
Catchment goods expenditure Market
population households Share
(£m) Potential (£m)
Primary 209,187 89,912 £457.6 £345.5 75.5%
Secondary 150,852 64,183 £346.9 £167.1 48.2%
Tertiary 323,293 140,523 £731.9 £102.8 14.0%
Outside £67.5
Core 360,039 154,095 £804.5 £512.6 63.7%
Major 683,332 294,618 £1,536.3 £615.4 40.1%
Total £682.9
Derby currently attracts Comparison goods market potential of £682.9m per annum.
The major catchment area (Primary, Secondary and Tertiary) is where 90% of Derby’s comparison goods spend is
estimated to come from. Comparison goods expenditure from this area is £615.4m. This is generated from a major
catchment area of 663 thousand households with an annual Comparison goods spend of £1.5 billion.
Derby captures a 75.5% market share from the Primary catchment and 48.2% from the secondary catchment, together
generating Comparison goods expenditure of £512.6m from this core catchment area, where 75% of Derby’s comparison
goods spend is estimated to come from.
The market share achieved from the core catchment is 63.7%, whilst the market share achieved across the major
catchment is 40.1%.
Page 19CACI Property Consulting
Current Catchment Summary – Drivetime Catchment Areas
Total comparison Weighted
Total Total Market
Catchment goods expenditure Market
population households Share
(£m) Potential (£m)
0-15 Mins 156,495 68,329 £335.5 £255.4 76.1%
15-30 Mins 500,395 214,795 £1,121.4 £335.6 29.9%
30-45 Mins 940,374 403,778 £2,111.3 £85.2 4.0%
45-60 Mins 517,195 225,466 £1,185.7 £6.7 0.6%
0-30 Mins 656,890 283,124 £1,456.9 £591.0 40.6%
0-45 Mins 1,597,264 686,902 £3,568.2 £676.1 18.9%
0-60 Mins 2,114,459 912,368 £4,753.9 £682.8 14.4%
Derby currently attracts Comparison goods market potential of £682.8m per annum from within a 60 minute drivetime
catchment. This is generated from a catchment area of 912 thousand households with an annual Comparison goods
spend of £4.7 billion.
Derby captures a 76.1% market share from the 15 minute catchment and 29.9% from the 15-30 minute catchment,
together generating Comparison goods expenditure of £591.0m from this 30 minute catchment area, where 87% of
Derby’s comparison goods spend is estimated to come from.
The market share achieved from the 30 minute catchment is 40.6%, whilst the market share achieved across the 45
minute catchment is 18.9% and across the 60 minute catchment area is 14.4%.
Page 20CACI Property Consulting
Leakage to Competing Centres
Derby's current market penetration of its major catchment is 40.2% and 63.5% of its core catchment, making it the dominant
retail centre within its catchment.
The list of centres taking market share from Derby’s catchment has been ranked by the share of its major catchment. Other
than Derby, only Nottingham and Burton-on-Trent takes more than 5% market share of this catchment area, where 90% of
Derby’s current shoppers are estimated to come from.
In relation to the core catchment, other than Derby only Nottingham takes more than 5% market share. Burton-on-Trent
takes 3.9% whilst Wyvern and Kingsway Retail Parks take 2.5% and 2.4%, and Belper 2.0%.
This means that Derby has very little in the way of significant local competition, with its only main competitor being
Nottingham.
Centre Name Retail Classification Retail Ranking Market Market Share
(2008) Share (Core)
(Major)
Derby Average Regional Centres 38 40.2% 63.5%
Nottingham Principal Centres 7 16.0% 10.3%
Burton-on-Trent Lower Average Centres 125 8.5% 3.9%
Mansfield - McArthurGlen Outlet Centre Major FOCs Mass Market 217 2.8% 1.7%
Long Eaton Lower Average Metropolitan Towns 538 2.6% 0.8%
Ilkeston Value Metropolitan Towns 615 2.4% 0.6%
Heanor Average Local Centres 740 2.0% 0.6%
Ashbourne Rural Centres 886 1.8% 0.2%
Ripley Rural Centres 836 1.8% 0.7%
Alfreton Value Metropolitan Towns 669 1.7% 0.1%
Belper Average Local Centres 972 1.6% 2.0%
Derby - Wyvern Retail Park Retail Parks Minority Fashion 1041 1.5% 2.5%
Derby - Kingsway Retail Park Retail Parks Minority Fashion 1087 1.3% 2.4%
Spondon - Asda Wal-Mart Supermarkets 1304 1.0% 1.5%
Leicester Quality Regional Centres 14 0.9% 0.9%
Page 21CACI Property Consulting
Section Summary – Derby’s Current Catchment
Since last year, following the opening of the 36,897 sqm gla Westfield Extension in October 2007,
Derby has seen substantial growth in its trading catchment area and market penetration of existing
trading areas.
Market Potential has increased by 65%, from £414.2m to £682.9m per annum – increasing Derby’s
UK ranking from 63rd to 38th.
Derby’s catchment area contains strong concentrations of Wealthy Executives, Affluent Greys,
Flourishing Families and Secure Families. This means that there are particularly strong retailing
opportunities for the centre, and that engaging with these groups will be critical to maximising
Derby’s potential as a retail destination.
Derby’s catchment is generally older and more suburban and rural than those of larger cities, with
less Professionals, Educated Urbanites and Aspiring Singles than the UK average.
The impact of improving the retail offer in Derby has been to draw in more people from all groups, but
in particular the relative proportion of Affluent Greys and Flourishing Families has increased.
Derby has very little in the way of significant local competition, with its only main competitor being
Nottingham.
There is an opportunity for Derby to differentiate from Nottingham by focusing on its profile strengths,
to appeal to family groups and older groups.
Page 22CACI Property Consulting
Derby City Retail Circuit
3. Centre Benchmarking & Potential to change
Market Positioning
Page 23CACI Property Consulting
Derby 2008 – Current Benchmarks
CACI have used ACORN and expenditure data to identify towns with a similar market potential size (in terms of Comparison
Goods expenditure) and shopper lifestyle profile to Derby, that share a post-industrial heritage. The similarity of the ACORN
profile is measured by the degree of correlation. A correlation of 1 is a perfect match with Derby. A correlation greater than
0.70 is considered to be a strong fit.
Southampton is classed as a ‘Quality Regional Centre’, whilst Leicester and Sheffield are classed as an ‘Average Regional
Centre’ in Retail Footprint; the same as Derby. Bradford and Coventry are classed as ‘Major Centres’; one classification
beneath the ‘Regional Centre’ classification, and have much lower market potential sizes; more similar to Derby pre Westfield
extension. Furthermore, the profiles of these city’s do not correlate so well with that of Derby.
The performance of Leicester shown here is prior to the opening of the Highcross Extension, which will take Leicester from
‘Average’ to ‘Quality’ Regional Centre. Alongside the benchmarks, Nottingham is included in the analysis, as Derby’s main
competitor. Nottingham is classified as a ‘Principal Centre’ – a classification above ‘Regional Centre’.
Annual Comparison Expenditure
£1,600 1.00
£1,400
0.90
£1,200
Correlation
£1,000 0.80
(£m)
£800
£600 0.70
£400
0.60
£200
£0 0.50
by
ry
d
ld
r
on
am
or
te
nt
er
fie
pt
es
f
gh
ad
ve
D
ef
m
ic
tin
Sh
Co
Br
ha
Le
ot
ut
N
So
Comparison Expenditure (£Millions) Correlation
Page 24CACI Property Consulting
Derby’s Current Benchmarks – ACORN profile
The individual profiles of Leicester, Southampton and Sheffield each vary from the profile of Derby in different ways, but
generally fit well to Derby’s profile, although in both Southampton and Sheffield the proportions of Prosperous
Professionals, Educated Urbanites and Aspiring Singles are higher, where Derby’s profile is weaker.
Leicester has the closest overall fit to Derby, albeit with lower relative levels of Affluent Greys and higher relative levels
of Secure Families, but sharing the characteristic of lower levels of Prosperous Professionals, Educated Urbanites and
Aspiring Singles. Both Bradford and Coventry are most dissimilar to Derby, due to much lower levels of Wealthy
Executives, Affluent Greys and Flourishing Families, against much higher levels of Asian Communities in Bradford and
Post-Industrial Families and Blue-collar Roots in Coventry.
Derby Leicester Southampton Sheffield Bradford Coventry
25%
20%
% Shoppers
15%
10%
5%
0%
s
es
es
p
es
es
ut
s
ys
a
s
es
s
ls
ity
le
es
s
le
hi
ot
er
bi
te
iti
ili
ili
ili
O
na
re
ng
ili
ng
ds
iv
rs
ur
Ro
on
m
am
ni
m
un
m
G
g
io
ut
ve
ar
Si
Si
ub
Fa
ba
t in
Fa
si
Fa
m
s
r
nt
ec
F
H
Ad
lla
en
es
g
d
S
Ur
ar
m
e
g
ng
re
rin
Ex
e
l
se
of
o
flu
ria
lin
d
tP
en
Co
St
ty
cu
-c
ed
le
hi
pi
Pr
Ri
y
gg
Af
st
en
Ci
rd
tt
ue
r is
Se
As
lth
at
n
du
h
us
Se
ru
Bu
ia
ud
r
Bl
uc
ou
ig
ea
ne
As
In
ro
St
H
Pr
Ed
Fl
W
In
pe
st
os
Po
Pr
Page 25CACI Property Consulting
Derby’s Current Benchmarks – average ACORN profile
The overall fit with the benchmark average provides a reasonable good fit with Derby. However, Derby has higher
relative levels of Wealthy Executives, Affluent Greys, Flourishing Families, Secure Families, Settled Suburbia and
Struggling Families than the benchmark average. This is counter-balanced with lower relative levels of Prosperous
Professionals, Educated Urbanites, Aspiring Singles, Post-Industrial Families, Burdened Singles and High Rise Hardship.
Derby Current Benchmark Average
20%
18%
16%
% Shoppers
14%
12%
10%
8%
6%
4%
2%
0%
s
es
es
p
es
es
es
ut
ys
a
s
s
es
ls
ity
le
es
s
hi
ot
bi
er
te
iti
ili
ili
il i
O
gl
na
re
ng
ili
ds
iv
rs
ur
Ro
on
m
m
ni
m
un
in
m
G
g
io
ut
ve
ar
Si
ub
Fa
ba
Fa
t in
Fa
S
i
Fa
s
m
s
nt
r
ec
H
Ad
lla
en
es
g
d
S
Ur
ar
m
e
g
ng
re
rin
Ex
e
l
se
o
of
flu
ria
lin
d
tP
en
Co
St
ty
cu
-c
ed
le
hi
pi
Pr
Ri
y
gg
Af
st
en
Ci
rd
ue
tt
ris
Se
As
lth
at
n
du
h
us
Se
ru
Bu
ia
ud
r
Bl
uc
ou
ig
ea
ne
As
In
ro
St
H
Pr
Ed
Fl
W
In
pe
st
os
Po
Pr
Page 26CACI Property Consulting
Benchmarks: Market Positioning
Comparing the current market positioning of Derby’s multiple comparison goods stores with the market
positioning of its benchmarks demonstrates that Derby has a stronger mass-bias than the average, with a
lower level of value stores.
Both Leicester and Southampton have higher overall RF Scores (reflecting a higher overall presence of
multiple comparison goods stores) and a higher level of Premium. Derby’s current retail positioning is most
similar to Plymouth, which also has a strong mass-bias. Sheffield, Coventry and Bradford all have much
higher relative levels of value retailers and a lower level of Premium.
The healthy presence of premium independents in Derby, and its demographic profile, that contains more
Wealthy Achievers and Secure Families than across its current benchmarks would all suggest that Derby
should be performing better than these centres, with an opportunity to develop a premium multiple market.
This opportunity is particularly pertinent to retaining spend from Nottingham, whose overall multiple
comparison goods retail offer is not only 70% larger (based on RF Score) but has a higher relative mix of
premium stores.
The strong premium multiple market in Nottingham can be viewed as a threat to developing one in Derby. To
qualify the opportunity, more evidence is needed on other centres which have achieved a strong multiple
premium market despite a larger, dominant neighbour.
Centre Name RF Score Premium % Mass % Value %
Derby 716 15.6% 62.8% 21.7%
Nottingham 1202 22.9% 56.7% 20.4%
Leicester 782 18.4% 56.5% 25.2%
Southampton 785 18.6% 57.6% 23.7%
Sheffield 753 11.6% 54.5% 33.9%
Bradford 699 7.1% 58.2% 34.7%
Coventry 730 9.9% 55.0% 35.1%
Benchmark Average 750 13.1% 56.4% 30.5%
*Based on count of multiple fascias only, Derby data updated from audit
Page 27CACI Property Consulting
Main Competing Centres on catchment: Market Positioning
The table below shows the current top six competing centres on Derby’s catchment, detailing their size (in
terms of Retail Footprint score) and market positioning in comparison to Derby.
Nottingham is Derby’s key competitor. It has a larger Retail Footprint score and has a much higher level of
premium outlets. This means that not only does Nottingham have a larger retail offer, it better caters for the
more affluent groups in Derby’s catchment – meaning that currently more of their spend will leak from the
Derby catchment to Nottingham.
Other than Nottingham, all other centres competing within Derby’s catchment have a higher mix of value
retailing than Derby (where the mix is already high), and therefore are more effective at competing for spend
from lower income groups and bargain hunters.
This highlights a key opportunity for Derby to improve its performance against its dominant competitor, by
growing a niche premium offer within the city centre, that will retain and attain greater patronage and spend
from the wealthier groups in Derby’s catchment.
Centre Name RF Score Premium % Mass % Value %
Derby 716 15.6% 62.8% 21.7%
Nottingham 1299 22.9% 56.7% 20.4%
Burton-on-Trent 429 5.6% 54.4% 40.0%
Mansfield - McArthurGlen Outlet Centre 61 10.8% 51.4% 37.8%
Long Eaton 173 0.0% 56.3% 43.8%
Ilkeston 130 4.0% 48.0% 48.0%
Page 28CACI Property Consulting
Derby 2008 –Aspirational Benchmarks
CACI have used ACORN and expenditure data to identify towns with a similar market potential size (in terms of Comparison
Goods expenditure) and shopper lifestyle profile to Derby, that can help qualify the opportunities for Derby to develop a
premium market. The similarity of the ACORN profile is measured by the degree of correlation. A correlation of 1 is a perfect
match with Derby. A correlation greater than 0.70 is considered to be a strong fit.
All of the selected benchmarks, excluding Sheffield, are classed as ‘Quality Regional Centres’ in Retail Footprint.
Bath, Chester and York are all particularly relevant benchmarks, due to their competitive position with the larger cities of
Bristol, Liverpool and Leeds respectively.
Annual Comparison Expenditure
£900 1.00
£800
£700 0.90
£600
Correlation
0.80
£500
(£m)
£400
0.70
£300
£200 0.60
£100
£0 0.50
by
rk
er
th
r
ld
m
te
Yo
et
Ba
er
fie
a
es
nh
Ex
D
ef
Ch
te
Sh
el
Ch
Comparison Expenditure (£Millions) Correlation
Page 29CACI Property Consulting
Derby’s Aspirational Benchmarks – ACORN profile
The individual profiles of the benchmarks each vary from the profile of Derby in different ways, but generally
fit well to Derby’s profile, with exception of the proportion of Prosperous Professionals and Educated
Urbanites, where Derby’s profile is weaker.
Chester has the closest fit to Derby, similar with respect to lower levels of Prosperous Professionals and
Educated Urbanites.
Derby Chester York Cheltenham Sheffield Bath Exeter
25%
20%
% Shoppers
15%
10%
5%
0%
s
es
es
p
es
es
ut
s
ys
a
s
es
s
ls
ity
le
es
s
le
hi
ot
er
bi
te
iti
ili
ili
ili
O
na
re
ng
ili
ng
ds
iv
rs
ur
Ro
on
m
am
ni
m
un
m
G
g
io
ut
ve
ar
Si
Si
ub
Fa
ba
t in
Fa
si
Fa
m
s
r
nt
ec
F
H
Ad
lla
en
es
g
d
S
Ur
ar
m
e
g
ng
re
rin
Ex
e
l
se
of
o
flu
ria
lin
d
tP
en
Co
St
ty
cu
-c
ed
le
hi
pi
Pr
Ri
y
gg
Af
st
en
Ci
rd
tt
ue
r is
Se
As
lth
at
n
du
h
us
Se
ru
Bu
ia
ud
r
Bl
uc
ou
ig
ea
ne
As
In
ro
St
H
Pr
Ed
Fl
W
In
pe
st
os
Po
Pr
Page 30CACI Property Consulting
Derby’s Aspirational Benchmarks – average ACORN profile
The overall fit with the benchmark average provides a particularly good fit with Wealthy Executives, Affluent Greys and
Flourishing Families. However, Derby has lower proportions of Prosperous Professionals and Educated Urbanites, and
higher proportions of Secure Families and Settled Suburbia – presenting stronger opportunities amongst older
consumer groups and family groups.
Derby Aspirational Benchmark Average
20%
18%
16%
% Shoppers
14%
12%
10%
8%
6%
4%
2%
0%
s
es
es
p
es
es
es
ut
ys
a
s
s
es
ls
ity
le
es
s
hi
ot
bi
er
te
iti
ili
ili
il i
O
gl
na
re
ng
ili
ds
iv
rs
ur
Ro
on
m
m
ni
m
un
in
m
G
g
io
ut
ve
ar
Si
ub
Fa
ba
Fa
t in
Fa
S
i
Fa
s
m
s
nt
r
ec
H
Ad
lla
en
es
g
d
S
Ur
ar
m
e
g
ng
re
rin
Ex
e
l
se
o
of
flu
ria
lin
d
tP
en
Co
St
ty
cu
-c
ed
le
hi
pi
Pr
Ri
y
gg
Af
st
en
Ci
rd
ue
tt
ris
Se
As
lth
at
n
du
h
us
Se
ru
Bu
ia
ud
r
Bl
uc
ou
ig
ea
ne
As
In
ro
St
H
Pr
Ed
Fl
W
In
pe
st
os
Po
Pr
Page 31CACI Property Consulting
Anchor Department Stores @ Benchmarks & Competing Centres
Derby: Debenhams, Co-Op, Bennetts
Nottingham:Debenhams, House of Fraser, John Lewis
Leicester: Fenwick, House of Fraser, John Lewis
Chester:Debenhams (Browns of Chester), TJ Hughes
Liverpool: John Lewis, Lewis’s, TJ Hughes, Debenhams*
York: Boyes, Browns of York, Debenhams, Fenwick Chester
Leeds: Debenhams, Harvey Nichols, House of Fraser
Cheltenham:Debenhams, House of Fraser
Bath:House of Fraser, Debenhams
Bristol: House of Fraser, Debenhams
Sheffield: Atkinsons, Debenhams, TJ Hughes, John Lewis
Meadowhall:House of Fraser, Debenhams
Exeter: Debenhams, House of Fraser
Bath
Source: EGI, CACI Retail Locations
Page 32CACI Property Consulting
Existing Malls & A1 Development Pipeline @ Benchmarks
Derby:
Westfield Derby – 90,897 sqm gla: (just completed 36,897 sqm gla extension)
Nottingham:
Victoria Shopping Centre – 91,137 sqm gla
The Pod – 9,290 sqm gla (opened 2007, mixed retail and hotel)
Trinity Square – 16,258 sqm gla: under construction
Westfield’s Broadmarsh – 44,227 sqm, gla: planned 76,073 sqm gla extension
The Pod - Nottingham
Chester:
The Mall – 20,903 sqm gla: Just sold to Carlyle, potential for 10,000 sqm ext.
Northgate Centre – 9,290 sqm gla
York:
Coppergate Shopping Centre – 13,935 sqm gla, Lasalle have just bought from Landsec and
appointed Centros to deliver circa 26,942 sqm gla extension.
Cheltenham:
Beechwood SC – 11,799 sqm gla Princesshay -
Regent Arcade – 17,837 sqm gla Exeter
Bath:
The Podium SC – 6,596 sqm gla
Multi’s Southgate Shopping Centre – 35,220 sqm gla (just completed 19,148 extension)
Exeter:
Henderson’s Princesshay Shopping Centre, opened Sep 07 – 36,308 sqm gla
Source: EGI, CACI Centre Futures
Page 33CACI Property Consulting
Existing Malls & Development Pipeline @ Sheffield
Existing Malls:
Orchard Square – 14,864 sqm gla (1987)
Moor Shopping Centre – 30,000 sqm gla (1997)
New A1 Retail Development
New Retail Quarter: Sevenstone, Hammerson – 79,896 sqm
gla under construction, to include John Lewis – due to open
New Commercial Office Development
Sevenstone - Sheffield
St Pauls Place (Norfolk Street), Heart of The City – 18,580
sqm gla – under development
Riverside Exchange – 12,820 sqm gla – under construction
Sheffield Digital Campus, Sheaf Street:–15,000 sqm gla in
phase 1 alongside ‘Electric Works’ creative space
The Square, Castlegate; 8,000 sqm gla 1st and 2nd phases,
full potential up to 15,000 sqm gla. Phase 1 complete.
St Pauls Place - Sheffield
Source: EGI, CACI Centre Futures
Page 34CACI Property Consulting
Aspirational Benchmarks: Market Positioning
Comparing the current market positioning of Derby with the market positioning of its benchmarks, shows
that the benchmarks have a higher representation of premium retailers than Derby, with exception of
Sheffield.
This demonstrates that whilst the recent extension of the Eagle Centre significantly improved market shares,
the size of its catchment and its UK ranking, Derby City Centre has further opportunities to capitalise on this
investment.
There is an unmissable opportunity to optimise its retail mix throughout the rest of the centre to alter the
overall market positioning of the centre. This change in market positioning should in turn maximise
conversion of the spend available within its catchment, in particular from the wealthier groups.
This opportunity is based on the current market potential of the centre, and is therefore is an opportunity for
immediate action – relating to improving the leasing of existing units throughout the city centre; drawing
footfall out of the Eagle Centre through a stronger city centre retail circuit.
Since the requirements of premium retailers are less dependent upon the size of retail floorplates, but rather
the quality of the high street environment, there exists a timely opportunity for the Derby BID to initiate this
new leasing scenario through investment in the public realm and partnership work with local landlords and
agents.
Centre Name RF Score Premium % Mass % Value %
Derby 716 15.6% 62.8% 21.7%
Chester 756 21.2% 62.4% 16.4%
York 755 22.9% 60.8% 16.3%
Cheltenham 728 26.9% 56.9% 16.3%
Sheffield 699 11.6% 54.5% 33.9%
Bath 611 31.4% 57.7% 10.9%
Exeter 665 17.4% 61.7% 20.9%
Average 702 21.9% 59.0% 19.1%
*Based on count of multiple fascias only, Derby data updated from audit
Page 35CACI Property Consulting
Market Positioning of Clothing & Accessories – Benchmark Targets
Comparing Derby’s clothing & accessories mix by market positioning against Derby’s aspirational
benchmarks, we confirm that the opportunity for improving the premium mix of Derby lies with the
opportunity to improve upon the representation of ‘Upper’ and ‘Upper Middle’ retailers in the centre.
These premium fashion retailers trade well in areas with good quality public realm, mixed in with strong
independent fashion and specialist stores.
There is an opportunity to build a cluster of such stores in the city centre, catalysing the development of a
strong, complementary area of retail pitch to the Eagle Centre, creating a point-of-difference for Derby
compared to out-of-town style shopping provision, and develop a city centre environment convivial to
attracting more of the Wealthy Executives, Affluent Greys and Flourishing Family groups.
Derby Aspirational Benchmarks
60%
50%
% Multiple Clothing Retailers
40%
30%
20%
10%
0%
Upper Upper Middle Middle Lower Middle Lower
*Based on count of multiple fascias only, Derby data updated from audit
Page 36CACI Property Consulting
Premium Retailer Model – sustainable levels of demand
To determine a sustainable level of premium shopping for Derby City Centre, post-development, CACI have
built a regression model to predict the average premium RF score supportable in centres across the UK,
based upon the ‘premium shopper population’ of each centre, defined by the estimated number of shoppers
in the following ACORN group categories: Wealthy Executives, Flourishing Families, Prosperous Professionals,
Educated Urbanites and Secure Families.
500
450
400
Premium RF Score
350
300
250
200
150
100
50
0
0 20,000 40,000 60,000 80,000 100,000 120,000 140,000
Premium Shopper Population
Predicted Actual
Page 37CACI Property Consulting
Premium Retailer Model – sustainable levels of demand
The extended Westfield Derby has had the effect of significantly increasing the market potential of Derby to
support a strong cluster of premium retailers. However at current this opportunity has only been taken up as
far as what the Average Trend across the UK would predict.
Derby’s affluent catchment and BID improvements to the public realm in the Cathedral Quarter means that
there is potential to outperform this Average Trend, and work at the Upper Trend, performing closely to
benchmark towns of Cheltenham, Chester and Bath.
250 London -
Knightsbridge Norwich Upper Trend
Cheltenham Newcastle-
200 Tunbridge Upon-Tyne
Merry Wells Bath Southampton/
Meadowhall
Premium RF Score
Hill
Oxford Cardiff/Aberdeen
Chester
150 Solihull Bromley
Average Trend
Croydon
100 Watford
Sheffield
Thurrock
50
Derby 2008
Derby 2007
0
10,000 15,000 20,000 25,000 30,000 35,000 40,000 45,000 50,000 55,000 60,000 65,000
Premium Shopper Population
Predicted Actual
Page 38CACI Property Consulting
Section Summary – Centre Benchmarking & Market Positioning
Comparisons with other post-industrial cities such as Leicester, Southampton, Plymouth, Sheffield and Hull
reveals that Derby has a stronger mass-bias than the benchmark average, with a lower level of value stores,
associated with a stronger level of Wealthy Executives, Affluent Greys, Flourishing Families, Secure Families
and Settled Suburbia compared with the average market these benchmark towns operate in.
In terms of demographic profile, Derby is closest to Leicester. Both Leicester and Southampton have a stronger
premium presence than Derby. Considering the healthy presence of premium independents in Derby, and its
strong demographic profile, Derby should be performing better with respect to its market positioning balance,
with a clear opportunity to develop a premium multiple market.
The strong premium multiple market in Nottingham can be viewed as a threat to developing one in Derby. To
qualify the opportunity, more evidence is needed on other centres which have achieved a strong multiple
premium market despite a larger, dominant neighbour.
Chester, York and Bath have all developed strong premium multiple markets in the shadow of a more dominant
neighbour. Other relevant benchmarks, which have similar market potential size and demographic profile
include Cheltenham and Exeter. Sheffield has also been selected as a particularly relevant benchmark – a city
which needs to compete against Meadowhall and which has a strong set of office developments in the pipeline,
despite strong competition with Manchester, Leeds and Nottingham in terms of office markets.
Comparisons with these cities/towns qualifies that there is an economically sound argument for Derby to
strengthen its premium market, with opportunities to attract a significant number of additional ‘upper’ and
‘upper-middle’ clothing and premium home, jewellery and toiletry retailers.
In order to achieve this, Derby will need to create a step-change in the way that it is perceived, by both the
retail community as well as consumers, to achieve a premium market, supportable along the lines of an ‘Upper
Trend’ established by a number of successful towns and cities across the UK.
Chester, York and Bath benefit from heritage and a strong tourism strategy. Sheffield does not operate under
the shadow of a nearby dominant centre. Therefore, despite the comparisons, ultimately Derby’s situation and
future development strategy will be unique to Derby. The key lessons to draw is that Derby needs to have a
wider point of interest than retailing alone, and like Sheffield, will need to develop a much stronger city-based
employment sector to support the city retail economy, in the absence of such a strong tourism market as other
benchmarks enjoy.
Page 39CACI Property Consulting
Derby City Retail Circuit
4. Current Retail Provision & Pitch
Performance
Page 40CACI Property Consulting
Derby City Centre– Identified Areas
The city centre and
North Area the adjoining
riverside and North
Castleward areas has
been divided into 4
distinct areas.
The Retail Core is
where the core city
centre retailing
occurs, and broadly
fits with DCC’s
current planning
boundaries.
West Area East Area The limits of the new
Cathedral Quarter
BID (red) are also
Retail Core shown which broadly
encompasses the
identified north-west
business area.
© Crown Copyright. All rights reserved. (100024913) (2008)
Page 41CACI Property Consulting
Derby City Centre– Places of Note
Joseph Wright College
Derby Cathedral
Fountain – Market Place
Ark –Sadler Gate
Friar Gate Sadler Gate
Market Place
Victoria Street
Pedestrianised Street
St Peters Street – St Peters Street
La Tasca –Friar Gate
Westfield Derby
Westfield Shopping Mall
Buses – Victoria Street
© Crown Copyright. All rights reserved. (100024913) (2008)
Page 42CACI Property Consulting
Derby City Centre – Audit June ‘08
On the 23rd June 2008 CACI conducted a detailed retail floorspace audit of all retailers currently trading in the
Retail Core of Derby to determine:
Derby’s current retail provision by fascia category (Clothing, Health & Beauty, Leisure Goods etc.)
Current Operator Configuration (Department Store, Variety Store, MSU, Multiple and Independent)
Floorspace provision by Retail Pitch (Westfield Derby, St Peters Street, Sadler Gate etc.)
This critical appraisal of current retail supply has enabled CACI to draw conclusions on the relative strength of
competing areas of retail pitch and operator configuration and market positioning relative to catchment
potential and demand.
In order that this report remains relevant at point of publication, the old M&S store in the Cornmarket has been
entered into the audit as the new Primark, and the old M&S food hall a new Tesco-Metro.
To estimate net internal trading areas, CACI auditors have paced the size of every retail unit open for trade.
For vacant premises, CACI have used either OS mapping or estimated the available net trading space from
taking external measurements of the unit.
Page 43CACI Property Consulting
Retail & Services Provision – Floorspace Breakdown
Retail / Service Provider Net Sq. M % of RCG % of Total Derby city centre’s Retail Core
Category currently provides 79,056 net
sq.m. in the core ‘Retail
Centre Goods’ (RCG)
Department Stores 20,544 26.0% 17.1% categories, with the
Variety Stores 7,020 8.9% 5.8% department stores and
Clothing & Accessories 34,458 43.6% 28.6% clothing & accessories sector
representing 69.6% of this
Leisure Goods 7,186 9.1% 6.0% space.
Household Goods 3,047 3.9% 2.5% The Leisure Goods category
Health & Beauty 3,704 4.7% 3.1% has 9.1% of RCG floorspace,
Electrical Goods 3,098 3.9% 2.6% Household Goods has 3.9%
whilst Health & Beauty
Retail Centre Goods Sub-Total 79,056 100.0% 65.7% account for 4.7% and
Catering 9,495 7.9% Electricals 3.9%.
Markets 6,222 5.2% Amongst the 23.1% of retail
Supermarkets 3,144 2.6% floorspace categorised as Non-
RCG, Catering takes 7.9%, the
Convenience 588 0.5% markets take 5.2% of all
Other Sales of Goods* 1,034 0.9% space, Supermarkets
Banks and Building Societies 2,075 1.7% (Sainsbury’s and Tesco Metro)
2.6%, Banks & Building
Other Services** 4,030 3.3% Societies 1.7% and Other
Amusements/Betting Shops 1,263 1.0% Services 3.3%.
Non RCG Sub-Total 27,851 23.1% Total floorspace in Derby city
Non-Vacant Sub-Total 106,907 88.8% centre’s Retail Core available
for retail and services is
Vacant 13,501 11.2% 120,408 net sq.m. 13,501 net
Grand Total 120,408 sq.m. is vacant (11.2%).
NB. Retail Centre Goods are those retail categories which represent the majority of shopping centre trading activity
*Other Sales of Goods include antique shops, charity, florists and DIY.
Page 44 **Other Services include surgeries, dentists, estate agents, hairdressers, insurance, laundry, pawnbrokers, photo-processing, piercing and tattoo
studios, post office, recruitment, repairs, salon, travelCACI Property Consulting
RCG Operator Configuration (proportion of floorspace)
Other MSU's Other Variety Stores
Coop Bennetts 9% 2%
Primark
4% 2%
MAXX (T K) 4% Multiples - Units
2% 30%
BHS
2%
Wilkinson
2%
Matalan
3%
Woolworths
2%
Next Boots Independents
3% 2% Debenhams Marks & Spencer 15%
10% 8%
The town is anchored by a number of Department Stores, Variety Stores and major space users (MSUs) accounting for 55.7%
of net space. There are currently five department stores, of which just Debenhams and M&S occupy a significant floorplate. The
circa 8,500 sq m net Debenhams is located in the new Westfield Derby centre, on the southern end of the centre – meaning it
is located right on the edge of the city centre. Debenhams was previously located on Victoria Street. The Marks & Spencer is a
circa 7,000 sq m net store that joins the new Debenhams in anchoring the southern end of the new Westfield Derby centre.
M&S was previously located in two units; one on the top end of St Peters Street and the other on Cornmarket. Together they
take 19% of floorspace.
Derby’s other Department, Variety and MSU stores together take up 35% of space respectively and include Westfield Derby
centre –Boots, Woolworths, SportDirect.Com, New Look, Next, Zara, Top Shop, H&M,; St Peters Street– BHS, JJB Sports, ;
London Road – Woolworths, WH Smith, Matalan, Argos, Wilkinson; East Street – Co-Op, TK Maxx; Irongate – Bennetts and the
new Primark on Cornmarket.
Multiples (national retailers operating out of non-MSU units) currently account for the largest percentage of sales space in
Derby city centre, 32%. These are most highly concentrated in Westfield Derby, St Peters Street, East Street, Albion Street and
London Road.
There is also high concentration of independents in Derby, taking 15% of utilised retail space. These are most highly
concentrated in Babington Lane, Sadler Gate and Irongate. There is also strong independent presence in Green Lane,
Osmanton Road and The Strand.
Page 45CACI Property Consulting
Derby City Centre– Core Retail
North Side
Sadler Iron Gate
Wardwick Friar Gate
Gate
Cornmarket
East Side
Market Place
East
Curzon Street
St Peters Street
Street
Green Eagle
Lane
Westfield
The Spot
Extension
Green Lane
East Street
Babington Lane © Crown Copyright. All rights reserved. (100024913) (2008)
Page 46CACI Property Consulting
Retail Category – Floorspace (Net Sq M) by Primary Areas of Pitch
Retail / Service Provider Westfield East St Peters Corn Sadler Green
Category Extension The Spot Eagle Street Street market Gate Lane Total
Department Stores 14,199 0 0 2,835 1,839 0 1,671 0 20,544
Variety Stores 0 6,258 284 312 166 0 0 0 7,020
Clothing & Accessories 17,175 879 1,914 3,751 2,843 4,051 2,662 1,182 34,458
Leisure Goods 3,001 1,079 481 1,536 229 116 368 377 7,186
Household Goods 417 1,311 294 0 0 0 96 929 3,047
Health & Beauty 425 266 2,665 50 99 71 0 128 3,704
Electrical Goods 980 74 334 641 135 74 480 381 3,098
Retail Centre Goods Sub-Total 36,197 9,866 5,972 9,125 5,310 4,312 5,276 2,997 79,056
Catering 2,817 839 391 436 441 1,055 2,620 896 9,495
Market 0 0 4,405 0 0 1,818 0 0 6,222
Supermarket 0 0 1,555 0 1,589 0 0 0 3,144
Convenience 0 161 38 131 23 12 95 128 588
Other Sales of Goods 0 212 0 20 100 267 77 359 1,034
Banks and Building Societies 0 222 0 684 358 632 146 33 2,075
Other Services 295 672 197 124 186 814 1,087 655 4,030
Amusements/Betting Shops 0 164 0 205 133 139 308 315 1,263
Non RCG Sub-Total 3,112 2,270 6,585 1,599 2,829 4,738 4,332 2,386 27,851
Non-Vacant Sub-Total 39,309 12,136 12,558 10,724 8,139 9,050 9,608 5,383 106,907
Vacant 881 200 1,756 445 1,018 515 1,363 7,324 13,501
Grand Total 40,190 12,336 14,314 11,169 9,157 9,565 10,971 12,707 120,408
NB. Retail Centre Goods are those retail categories which represent the majority of shopping centre trading activity
*Other Sales of Goods include antique shops, charity, florists and DIY.
Page 47 **Other Services include surgeries, dentists, estate agents, hairdressers, insurance, laundry, pawnbrokers, photo-processing, piercing and tattoo
studios, post office, recruitment, repairs, salon, travelYou can also read