Online Appendix (For Online Publication Only) - Census.gov
←
→
Page content transcription
If your browser does not render page correctly, please read the page content below
Online Appendix (For Online Publication Only)

A     Further Details and Results
A.1     Property Taxation and the Protesting Process
In this section we provide more details about the institutional context.
    Section 25 of the Texas Property Code stipulates how property taxes are assessed and
collected. Property taxes must be computed according to several steps. First, the county is
responsible for estimating the “total market value” (i.e. value of the land plus any improve-
ments) for each of its residential and commercial properties. Note that we refer to this total
market value as “proposed value” in our paper. The Texas Property Code mandates each
estimated total market value must (a) accurately reflect the market value of the property
as of January 1st and (b) be “fair” insofar as being consistent with the estimated values
of comparable properties. A household may protest the proposed value it receives on the
grounds that (a) and/or (b) are not satisfied.
    Second, the county calculates each household’s “appraised value”, defined as the lower of
total market value or the homestead cap (this homestead cap can apply only for properties
with homestead status, for more see Section 3, minus certain exemptions, such as agricultural
use “total” exemptions. Third, each property’s “taxable value” is computed by jurisdiction
as the household’s appraised value less certain additional exemption amounts applied by the
jurisdiction. These include any additional exemptions for which the household has been ap-
proved qualifying and submitting relevant paperwork, such as exemptions for homesteads,
over age 65, disability, veteran, low income, historic properties, and more. In Texas, Inde-
pendent School Districts are required (and other jurisdictions may elect) to “freeze” property
taxes for households with Over 65 or Disabled exemptions as of the year they qualified for
the exemption.
    Finally, the taxes due to each jurisdiction are calculated by multiplying the jurisdiction’s
taxable value of the home by the jurisdiction’s tax rate. The household receives a bill for the
total taxes due for the year, which equals the sum of the taxes due across all jurisdictions
in which the home resides. See for example the sample DCAD notification in Appendix G,
which includes a break-down of the property tax calculation.

A.2     Data Sources
In this section we presents further details about the data sources used in the paper.

                                               i
Our main data source is made publicly available and easily accessible by the DCAD. Under
the Texas Public Information Act, all government information in Texas, with a few exceptions,
is available to the public.48 As of August of 2020, the raw data that we used in the paper
can be downloaded from the following links http://www.dallascad.org/DataProducts.
aspx and http://www.dallascad.org/TaxRates.aspx. Government information that is
not publicly available on the Internet, can be requested from any governmental body in
Texas for a fee to cover the cost of producing copies of the records. We requested data from
the DCAD on the “Opinion of Value” for all protests that were filed using the online system.
    The protest dates recorded in the DCAD data correspond to the dates when protests
are recorded in the system. These recorded dates are an approximation of the dates when
protests are submitted. Specifically, protests submitted online are recorded every business
day (e.g., protests submitted on weekends are recorded the following Monday). The system
does not contain dates when protests are postmarked for protests submitted by mail, which
might create an small difference between the date when protests are submitted and recorded
in the system. For this reason, some protests that were received shortly after June 15th
may still have been filed by the June 15th deadline. To be conservative, in all the analysis
presented in the paper we include protests that were recorded as received by the DCAD
before July 15th .
    We collected some complementary data from RedFin and Zillow. We use Redfin to
identify all houses sold in the county from October 1st , 2019 to May 9th , 2020, including
information on the sales price, address, and property characteristics. We used this data to
generate the information on comparable properties included in the letters we sent to subjects
in the extra aid treatment. We scraped RedFin estimates for subject pool households in
the field experiment to further validate the matches made by the comparison algorithm (see
Appendix A.5 for details). We found RedFin estimates for 95.8% of the households in the
subject pool. For the remaining households, we scraped Zillow’s estimates (a.k.a. Zestimates)
for the properties in lieu of the RedFin estimate, locating estimates for an additional 2.6%
of the subject pool. For the remaining 1.6% of the subject pool, we used a prediction model
to impute estimated home values, employing household characteristics predictors along with
zip code fixed effects.

A.3        Descriptive Statistics
In this section we provide some basic descriptive statistics for the different samples used in
the paper.
48
     https://www.texasattorneygeneral.gov/open-government/members-public/overview-public-information-
     act

                                                    ii
Table A.1 presents descriptive statistics for the key variables and for each of the samples
used in this paper. The table reports pre-treatment characteristics using data from 2019.
Column (1) corresponds to the sample used in the quasi-experiment. Column (1) shows that
the average home in this sample had 3.24 bedrooms, was assessed at $306,000, paid $6,150
annually in property taxes, or equivalent to a tax rate of 1.98%. Within this sample, 5.93%
owners protested directly in 2019 and 7.96% through an agent, and 74.24% had homestead
status. For this sample, we do not have information on demographics and partisan identity.
    Column (2) of Table A.1 shows the average pre-treatment characteristics for the subject
pool used in the field experiment. Comparing columns (1) and (2) reveals that the samples
are similar but not identical in terms of observable characteristics. Properties included in
the field experiment are slightly more expensive than those in the quasi-experiment. The
differences between these two samples are explained by the filters listed in A.6.
    We have information on demographics and partisan identity for the sample used in the
field experiment, and the last seven rows of Column (2) of Table A.1 present summary
statistics.
    Column (3) of Table A.1 presents average characteristics for the sub-sample of survey
respondents associated with the field experiment. A comparison between columns (2) and
(3) of Table A.1 shows that survey respondents are not a random sample of the subject pool.
Specifically, the households selected to receive a letter that in turn answered the Field Survey
in column (3) own properties that are more expensive than those in column (2). In addition,
direct protests are substantially higher in column (3) than in column (2). Because column
(3) uses a subset of the households used in column (2), for this sample used in column (3)
we also have information on demographics and partisan identity. White and Republican
homeowners disproportionately answered the Field Survey.
    Column (4) of Table A.1 presents average characteristics for the sample of 2,065 Mturk
respondents. A comparison of columns (2) and (4) of Table A.1 shows that the survey
respondents are certainly not identical to the subjects in the field experiment, but they are
not wildly different either. Property taxes are lower for this sample, which reveals that
property taxes in Texas are higher than in other states. For this sample, we do not observe
if respondents protested directly or through an agent nor the homestead status. In the
Mturk Survey we included questions on demographics and partisan identity, and the last 7
rows include summary statistics for these variables. Mturk Survey respondents are younger,
include a larger proportion of white homeowners, and a smaller proportion of Republicans
homeowners compared to both the subject pool sample in column (2) and the Field Survey
sample in column (3).

                                               iii
A.4     Additional Falsification Tests
In the body of the paper, we present a number of falsification tests. In this section we provide
additional falsification tests.
    One of the event-study falsification tests we conduct in the paper consists of estimating
the regression of interest but with pre-treatment outcomes as the dependent variable. For the
sake of brevity, the body of the paper presents results using the 2019 protest as the “placebo
outcome.” In this Appendix, we reproduce this analysis for each of the other pre-treatment
years for which we have data available: 2015, 2016, 2017, and 2018.
    Figure A.1 corresponds to the results on the homestead cap presented in Table 1 and
discussed in Section 3. The rightmost coefficient (year 2020) corresponds to the results from
column (1) of Table 1, where the dependent variable takes the value 100 if the household
protested in 2020. The coefficient for year 2019 corresponds to the results from column
(2) of Table 1, where the dependent variable takes the value 100 if the household protested
in 2019. Likewise, the coefficients for each of the years 2018, 2017, 2016 and 2015 have a
dependent variable that takes the value 100 if the household protested in 2018, 2017, 2016 and
2015, respectively. As expected, the coefficients are consistently close to zero for each of the
falsification years (2015-2019), and always highly statistically different from the coefficient
for 2020. In two of the falsification years the coefficient is small but borderline statistically
significant, although that is expected: given the large number of falsification tests that we
conduct in this paper, a few of them a bound to be spuriously significant from time to time.
    Figure A.2 corresponds to the results on the effects of the letters presented in Table 2 and
discussed in Section 4. The rightmost coefficient (year 2020) corresponds to the results from
column (1) of Table 2, where the dependent variable takes the value 100 if the household
protested in 2020. The coefficient for year 2019 corresponds to the results from column (2)
of Table 2, where the dependent variable takes the value 100 if the household protested in
2019. And then each of the other coefficients reproduce the falsification exercise for each of
the other years with available data (2015-2018). As expected, the coefficients are consistently
close to zero and statistically insignificant for each of the falsification years (2015-2019).
    Figure A.3 corresponds to the conditional cooperation results presented in Table 4 and
discussed in Section 5. The rightmost coefficient (year 2020) corresponds to the results from
column (1) of Table 4, where the dependent variable takes the value 100 if the household
protested in 2020. The coefficient for year 2019 corresponds to the results from column (2)
of Table 4, where the dependent variable takes the value 100 if the household protested in
2019. And then each of the other coefficients reproduce the falsification exercise for each of
the other years with available data (2015-2018). As expected, the coefficients are consistently
close to zero and statistically insignificant for each of the falsification years (2015-2019).

                                               iv
A.5 Details about the Algorithm for the Comparison Properties
In this section we provide more details about the algorithm we used to find the values of
comparable properties that we included in the letters.
Although we identified one comparable property for all households in the subject pool, we
only displayed this information in the letter for the subjects randomly selected for the extra
aid letter. The algorithm begins by matching each household in our subject pool sample with
all houses listed on RedFin.com as sold between October 15th , 2019 and May 6th 2020, that
meet a list of criteria. Comparable properties were required to be within 0.75 miles of the
subject household, have the same number of bedrooms (or if the subject household has five or
greater bedrooms, then the comparison property must have five or greater as well), have at
least the number of bathrooms of the household minus one (or both must have five or greater
bathrooms), have a square footage between 95% and 120% of the subject household’s square
footage, and have an estimated sales price within 80% and 95% of DCAD’s 2020 proposed
value. Subject households were not permitted to be matched with themselves. Out of all
matches per the above criteria for a given subject household, we kept the single closest match
by distance.
Due to the fact lot size was only populated for about half of residential properties before we
performed our compables matching, we did not include lot size as part of our comparables
matching criteria, so as to avoid sample selection or generalizability concerns. A manual
review of matches found no perceptible difference in the quality of matches using either
approach.
We took random samples to manually inspect the quality of the comparable property, and
we found that the vast majority of the cases seemed reasonable. For a more formal assessment
of the quality of the arguments provided in the letter, we present some descriptive statistics
of the comparables identified by our algorithm.
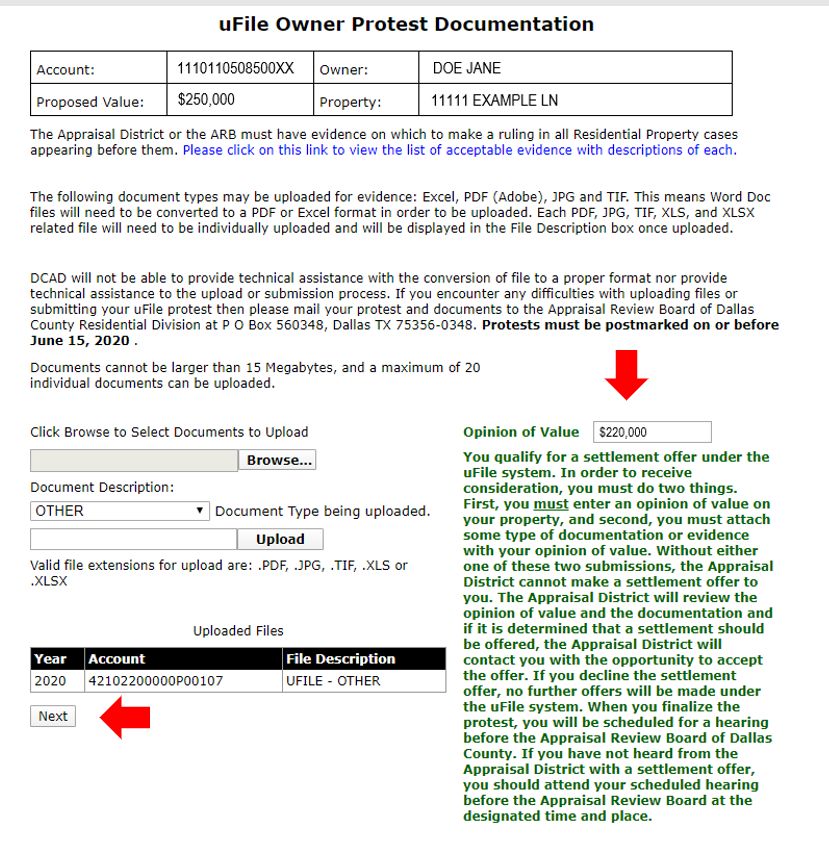
Figure A.4 presents the distribution of “proposed savings” generated by the comparison
algorithm for all subject households in the field experiment. “Proposed savings” is calculated
as the household’s 2020 proposed market value minus the comparable home’s 2020 proposed
market value (i.e., the market value reduction the household would achieve if the household
placed the value of the comparable home in the “Opinion of Value” line on the protest
form and the DCAD settled for that value). Among other filters, the algorithm restricted
matches to homes with proposed market values in the range of 80% to 95% of the proposed
value of the subject household. The mean proposed savings was $37,973 (10.77%), while
the median proposed discount was $26,020 (10.01%)). Notably, households with comparison
homes valued 15%-20% cheaper are less frequent than those with comparison homes valued
5% to 10% lower. This suggests high overvaluation is less prevalent than lower levels of
v
overvaluation, as expected.
     As an alternative method to verify our comparison algorithm, we can compare different
characteristics between the recipient’s property and the comparison property that we iden-
tified. The results are presented in Figure A.5. Figure A.5.a compares the estimated home
values according to a third party: we obtained estimates from RedFin (and when these were
unavailable, Zillow estimates) of the subject households’ and comparison homes’ market val-
ues. RedFin and Zillow estimates are not perfect and certainly have measurement error, but
on average they provide a reasonable proxy for home market values. Figure A.5.a shows
the the distribution of the %-difference between the value of the property and its compari-
son. The mean (median) difference is -1.66% (-2.17%), which indicates that our algorithm
identified a reasonable (if anything, slightly conservative on average) comparison property.
Figure A.5.b shows the distribution of the distance between the recipient’s own property
and the comparison property. On average, these pairs of properties are 0.38 miles from each
other, sometimes next door to each other, and at most 0.75 miles from each other. Figure
A.5.c shows the difference in square footage. Note that our algorithm selected comparison
properties that are, if anything, slightly larger than the recipient’s own property. That is,
the comparison property is conservative in this dimension. Last, Figure A.5.c shows that
most of the time the recipient’s property has the exact same number of bathrooms as the
comparison property, and the vast majority of the pairs are within half a bathroom of each
other.

A.6     Field Experiment: Design and Implementation
In this section we provide additional information about the design and implementation of
the field experiment.
   We begin describing the filters used to arrive at the subject pool. We begin with the
universe of 423,607 residential single-family properties used for the analysis in Section 3.2,
and use various filters to arrive at 78,462 households in the final subject pool of the field
experiment. We exclude commercial real properties, non single-family residential homes (e.g.,
condos, townhouses, mobile homes, apartments, P.O. boxes, vacant lots), properties with
missing information such as the proposed value, taxable values, property address, owner’s
mailing address, households lacking data on characteristics used for the comparison algorithm
such as number of bedrooms, number of bathrooms, or year built (see Appendix A.5), or
where the Census geocoding did not yield an address match. We further exclude households
with proposed values lower than $50,000 or greater than $7.5 million and tax rates lower
than 1 percent.
   We did not include non owner-occupied properties (i.e., where the owner’s mailing address

                                              vi
was not the same as the property address), as those owners may take much longer to receive
the letter and/or are more likely to be investors. Properties with keywords in the owner field
that suggested it was a business operating out of a residential property (e.g., “LLC,” “corp,”
“realty”), was owned by a government body (e.g., “texas,” “city”), or that we could not
address our letter to an owner’s actual name (e.g., “estate,” “community”) were excluded.
We drop households where the owner had already filed a 2020 protest before May 21st .
Households without a comparison home match, an important input for the extra aid letter,
were dropped. After our letters were mailed, we excluded XX households which the mailing
company’s National Change of Address Verification (NCOAV) flagged as the owner(s) moved
or the property address was invalid.
    All subject households in the field experiment were shown figures for their own proposed
market value and estimated tax amount in the table on the first page of the letter we mailed.
We cross-randomized whether in addition subjects were shown the “Average Dallas Home”
column and/or the “Estimated Tax Rate” row in the table (see Section 4.2 for a description
of the mailing design and see Figure 3 for the first page of a sample letter with red boxes
highlighting the parts that were randomized, for exposition purposes).
    Since we cross-randomized two aspects of the tables, in total there were thus four possible
types of tables, which are summarized in Figure A.6. The first randomization (average tax
rate in the extra column), is central to the research design. The second randomization, about
whether the tax rate is made salient or not, is a minor aspect of the design that allows us to
establish whether the effects are sensitive to salience. In fact, the last row does not add any
new information: it is simply the ratio between the previous two rows, and thus its inclusion
should not matter for the results. Rejection of this null hypothesis would then mean that
households compare tax amounts or tax rates depending on what information was made more
salient to them, thus complicating the interpretation of our findings.
    Definitions for each of the variables disclosed in the table of the letter are summarized in
the notes below the table. Moreover, we discussed those definitions in more detail below:

     Proposed Value for “Your Home”: The estimated market value of the property on
     January 1st, 2020, as proposed by the DCAD. This is the market value included in
     the Notice of Appraised Value mailed to homeowners by the DCAD around May 15th,
     2020 if DCAD either proposed a change in the property’s market value or changed the
     property’s homestead exemption status.

     Proposed Value for the “Average Dallas Home”: The average market value for all single-
     family residential properties, excluding condos, townhomes, and mobile homes in Dallas
     County on January 1st, 2020, as proposed by Dallas CAD.

                                              vii
Estimated Tax Amount for “Your Home”: This is the estimated total property taxes
      due summed across all applicable jurisdictions for the 2020 tax year for the subject’s
      household. We followed a similar process as the DCAD for estimating property taxes
      due. That is, for each jurisdiction, the property’s estimated taxes due are calculated
      as the jurisdiction’s estimated taxable value for the household (provided by DCAD)
      multiplied by the jurisdiction’s 2019 tax rate.49 Each jurisdiction’s 2019 tax rate was
      obtained from Dallas CAD’s website.50 In general, estimated current taxable values
      are calculated as the appraised value (i.e., the lesser of (a) the household’s proposed
      value and (b) homestead cap value, minus (c) agricultural-use exemption and (d) ab-
      solute exemption) less any applicable Homestead, Over Age 65, Disabled, or Veteran
      exemptions. For some jurisdictions (most frequently school districts), Over Age 65,
      Disabled, and Veteran exemptions freeze the property’s taxable value at the taxable
      value of the year in which the exemption started. To calculate estimated taxes due for
      properties in jurisdictions where frozen tax amounts apply, we use the lower of (a) the
      frozen tax value and (b) the current taxable value multiplied by the tax rate for that
      jurisdiction.51 Estimated Tax Amount is calculated as the sum of the estimated taxes
      due for each jurisdiction.

      Estimated Tax Amount for the “Average Dallas Home”: This is the average 2020
      estimated total property taxes due across all single-family residential properties in
      Dallas County (excluding condominiums, town homes, and mobile homes). Estimated
      Tax Amount was computed for all Dallas County households in the same way as for
      subject households as outlined in “Estimated Tax Amount for ’Your Home’” above.

      Estimated Tax Rate for “Your Home”: The estimated property tax rate for the subject’s
      household. This is calculated as the household’s Estimated Tax Amount divided by its
      Proposed Value.

      Estimated Tax Rate for the “Average Dallas Home”: This is the average 2020 estimated
      property tax rate for all single-family residential properties in Dallas County (excluding
      condominiums, townhomes, and mobile homes). It is calculated as the average of
      Estimated Tax Amount divided by Proposed Value for all Dallas County households.
49
   Due to data availability, we did not include Special Districts in our calculation of estimated taxes due.
   This makes little difference in practice, as these special rates account for less than 0.01% of the average
   tax amount.
50
   The tax rates by jurisdiction in 2019 were obtained from http://www.dallascad.org/TaxRates.aspx.
51
   Note that the DCAD does not include the effect of “frozen” taxes in the estimated taxes due shown in
   their letter. For the sake of accuracy, we do utilize the “frozen” tax amounts to calculate the estimated
   taxes due shown in our letters.

                                                     viii
A.7     Field Experiment: Randomization Balance
In this section we show that the treatments are well-balanced in terms of observable charac-
teristics, demonstrating that the randomization was successful.
    Table A.2 breaks down the average characteristics we used in the randomization by treat-
ment group. Column (1) correspond to the average characteristics for the whole subject
pool (which by construction is equal to column (2) of Table A.1). Columns (2) through
(4) present the pre-treatment characteristics by households that were randomly assigned to
receive no letters, letters with the basic aid message, and letters with the extra aid message,
respectively. Column (5) reports p-values for the null hypothesis that the average of each
characteristic is equal across these three treatment groups. The results show that, consistent
with successful random assignment, the observable characteristics are balanced across these
treatment groups. Columns (6) through (9) of Table A.2 present the pre-treatment char-
acteristics by households who received a letter and were randomly assigned to each of the
four treatment groups corresponding to the four types of tables. These four types of tables
result from the four possible combinations given by the inclusion or exclusion of an extra
column with the county average tax burden and the inclusion or exclusion of an extra row
with the calculated tax rates. Column (10) reports p-values for the null hypothesis that each
average characteristic is equal across these four treatment groups. Consistent with successful
random assignment, the results show that the observable characteristics are well-balanced
across these treatment groups.

A.8     Timing of The Letter Delivery, Visits to the Website and
        Protests
In this section we present the timing of when subjects in the field experiment read the letters
we mailed and when subjects protested.
    Following Perez-Truglia and Cruces (2017), Perez-Truglia and Troiano (2018) and Bottan
and Perez-Truglia (2020), we use the distribution of dates when the surveys included in
the letter were completed as a proxy for when the letters were actually read. This proxy
is conservative because some households may have read the letter and waited a few days
until responding to the survey. The results are presented in Figure A.7. The first survey
response was received on May 21st . This date coincided with the best guess provided by the
mailing company and the scan records from the Unites States Postal Service. This figure
suggests that a majority of the read-receipts happened in the first week after the start of
the letter delivery. The remaining read-receipts took place gradually until the last responses
were received on the deadline of the protest, on June 15th , 2020.

                                              ix
We can also use the number of visits to the study’s website to infer when the letters were
received and read (the letters we mailed included the URL to the study’s website). We used
Google Analytics to track visits in an anonymous manner. Figure A.7.b shows the number
of visits by date. The evolution of the visits to the website tracks the survey responses very
closely. Note that this is not because the visitors were looking for the link to the survey: they
already had that link prominently displayed in the letter. The vast majority of the visitors go
to the website to find the step-by-step instructions on how to protest. Visits to the study’s
website began on May 21st and increased progressively until the tax filing deadline.52
    For reference, Figure A.7 shows the timing of the protests in the subject pool. As ex-
plained in Appendix A.2 above, there might be differences between the dates when protests
are submitted and recorded in the DCAD’s system, and that in this paper we use recorded
dates since only these dates are available to us. Note that the vast majority of the direct
protests happened at least a week after our letters were delivered. Note also that there is a
quite similar gradual increase in the share of survey responses, the visits to the website and
the direct protests (Figures A.7.a, A.7.b and A.7.c, respectively). This probably means that
while most subjects received our letters shortly after May 20th , many of them held on to the
letter and used our website and responded to the survey weeks later. Indeed, in the survey
we asked households when they first saw our letter, and their responses confirm this view
(details in Appendix A.7).
    Last, we would like to note that since we mailed the letters until the day we stopped
tracking protests (July 15th ), we performed several online searches on Google and social media
sites such as Facebook and Next Door and did not find any indication of contamination of
the field experiment due to public reports on this experiment while it was being conducted.

A.9      Effects from the Official DCAD Notifications
In this section we describe the official mail notifications sent by DCAD and present some
estimates of its effects on the probability of protesting.
    According to the information posted in its official website,53 on May 15th all Notices of
Appraised Value for residential and commercial real properties became available on the Dallas
CAD website. Additionally, DCAD mailed the 2020 Notice of Appraised Value on May 15th
to those properties meeting the following criteria: an increase in the property appraised value,
an ownership change, a loss of homestead exemption, rendered property, or a new property.
52
   We used Qualtrics for our survey and it is not possible to use Google Analytics to track visits the the
   survey’s link included in the study’s website.
53
   Source:        http://dallascad.org/ViewPDFs.aspx?type=1&id=%5C%5Cdcad.org%5Cweb%5Cwebdata%
   5Cheadlines%5CHEALTHALERTRecentHeadlines04032020.pdf.

                                                    x
DCAD did not mail notices if the property value did not change or if the property value
decreased.
To estimate the effect of the DCAD mail notification, we exploit the discontinuity in the
rule used to decide who gets a mail notification and who doesn’t. Figure A.8 presents the
regression discontinuity results. The vertical axis measures the protest probability and the
horizontal axis measures the percentage growth in the proposed value between 2019 and 2020.
We restrict to a narrow band around 0%: i.e., between -5% and +5% growth in the proposed
value. The coefficient on the discontinuity (0.436) is positive, but small in magnitude and
statistically insignificant. This coefficient suggests that, if anything, receiving an official mail
notification from DCAD increases the probability of protesting directly by 0.436 pp. The
magnitude of this effect is much smaller than the effects of our letters reported in Section 4
above. This evidence supports the view that our letters in the field experiment did not
operate just as reminders.
A.10 Tax Amount versus Tax Rate
In the results on conditional cooperation, we focus on the belief about the average tax rate.
In principle, however, households could care instead about the average tax amount. In this
section we present some evidence supporting this specification choice.
The main motivation for this specification choice is data from the Field Survey indicating
that the vast majority of households think that the fair thing would be for all households to
pay the same tax rate.
The respondents are told that they can distribute a total tax burden of $10,000 between
two hypothetical households: Household A (whose home is worth $100,000) and Household
B (whose home is worth $400,000). The question provides a menu of six options to choose
from: Household A pays $0 (and thus Household B pays $10,000), $1,000, $2,000, $5,000,
$8,000, $9,000 or $10,000. The household is asked to report whatever allocation would be
most fair. If the respondent thinks that the fair allocation is for everyone to pay the same tax
rate, then he or she would choose the third option in which both households pay a tax rate
of 2%. If a respondent thinks that the fair thing is for everyone to pay the same tax amount,
then he or she should pick the middle option in which both households pay $5,000 (implying
a tax rate of 5% for Household A and a tax rate of 1.25% for Household B). The responses
to this question are presented in Figure A.9. A strong majority (76.5%) of households chose
the option that equalizes tax rates, while a minority of them (5.47%) chose the option that
equalizes the tax amounts and the rest chose a different option. This evidence suggests that
for a strong majority of households, the “fair” thing is for everyone to pay the same tax rate.
Last, we included a similar questions (whose parameters were randomized) in the Mturk
xiSurvey and the results are largely consistent.
A.11 Mturk Survey: Design and Implementation
In this section, we discuss more details about the design and implementation of the Mturk
Survey.
In the Mturk advertisement we explicitly noted that the survey was for homeowners.
However, some individuals who are not homeowners may miss that part of the advertisement
and click into the link to the survey anyways. For that reason, we included additional
screening questions at the beginning of the survey. We use these questions to exclude the
following categories: individuals who are not homeowners, respondents who were under age
18, or lived with their parents. For these respondents, as well as those that lived in counties
for which we did not have ACS data, the survey ended immediately after the screening
questions and they received the $0.25 base reward given to all participants. Respondents
that passed these filters were allowed to finish the survey. Those that completed the entire
survey were awarded a $0.50 bonus (on top of the $0.25 base reward).
We included a number of additional questions that we expected to be potentially useful
for descriptive statistics, robustness checks or heterogeneity analysis. For example, we asked
respondents whether they felt confident about their knowledge of their own property taxes,
how long they have lived in the current residency, how pays the property taxes and what is
the frequency of the payments. We asked them whether they thought that tax appeals of
property taxes were allowed in their county and whether they would consider appealing their
taxer or being late on their payments in the future. We included a question related to social
norms like the one included in the Field Survey (and described in Appendix A.10). And at
the end of the survey, we included a few additional questions about the individuals (such as
their age and political party) as well as their properties (e.g., number of bedrooms).
To create the feedback for the Mturk Survey, we utilized the latest data from the 2018
American Community Survey (ACS) to compute average home values and property taxes
for 3,210 counties across all 50 U.S. states. We used 2018 ACS one-year estimates, and for
counties where those were not available, 2018 ACS five-year estimates.54
The survey was advertised as a five-minute survey. The median respondent took about 7
minutes to complete the survey. Towards the end of the survey, there was an attention check,
similar to the one used in other studies (Bottan and Perez-Truglia, 2017; ?). A total of 99%
of the respondents passed the attention check. The payment scheme was on par with other
MTurk surveys (Bottan and Perez-Truglia, 2020). Participation in the Mturk Survey was
54
The ACS provides numbers of homes in different value ranges, so we used the number of households in
each range and the ranges’ midpoints to construct a weighted average home value by county.
xiirestricted to respondents located within the U.S. We created an additional restriction so that
each Mturk worker ID could only complete the survey once. We filtered out respondents who
did not complete the entire survey or for whom we were unable to confirm the validity of their
Mturk IDs. And to address potential concerns with outliers, we followed the standard practice
of filtering out the top and bottom 0.1 percentiles in prior beliefs as well as winsorizing the
top and bottom 0.1 percentiles in posterior beliefs (Fuster et al., 2018).
A.12 Salience of Tax Rate
In this section we discuss the role of salience of the tax rate.
In both the field experiment and the Mturk Survey, we cross-randomized whether the
tax rate was salient or not. We did this by cross-randomizing whether the table included a
third row with the tax rate. Since this third row does not add any new information (it is
simply the ratio between the previous two rows) its inclusion should not matter if agents are
rational, but might matter if they are salient. Rejection of this null hypothesis would then
mean that households compare tax amounts or tax rates depending on what information was
made more salient to them, thus complicating the interpretation of our findings. We will
report these results in a future version of the paper.
A.13 Partisanship Data
In this section we describe in more detail how we classified the households from the tax
records into likely Republicans and likely Democrats.
Based on the full name and address, the vendor provided a measure of whether each
owner of a household in the subject pool is Democrat (Republican). This was determined
either from the owner(s) self-reporting to be Democrat (Republican) in a survey (rarely
the case), or based on past voting behavior. In the latter case, households were assigned
to Democrat (Republican) if they voted in more Democrat (Republican) primaries than
they voted in Republican (Democrat) primaries since 2000. If the household did not have
any Democrat or Republican primary voting history, they were assigned to Democrat if
there is a record of a Democrat/liberal donation, the household has a "pro-choice" flag, or
if the household was an Affordable Care Act supporter. In turn, anyone with a record of a
past Republican/conservative donation, pro-life, or anti-Affordable Care Act is assigned to
Republican.
The vendor was able to match the data to 73.2% of owners in the sample. For properties
with multiple owners, we classify the household as Democrat if at least one of them is
Democrat, and Republican if at least one is classified as Republican. In the rare cases where
xiiithey are assigned to different groups, we pick the party of the person who is listed first in the
deed. Of the matched sample, 35.0% of households are identified as likely Democrat, 38.3%
are identified as likely Republican and the partisanship of the rest is unknown (i.e., there is
no sufficient data to classify them as Democrat or Republican). We can provide a validation
of this raw data on partisanship provided by the vendor. To do this, we use results from the
2012 presidential election at the voting precinct level.55 For each precinct, we compare the
share of households in our sample who were identified as Democrat (among those identified as
either Democrat or Republican) versus the actual voting share of the Democrat presidential
candidate (Barack Obama) among those who voted for either the Democrat candidate or
his Republican opponent (Mitt Romney). The results are presented in Figure A.10. The
dashed line is the 45-degree line, representing what a one-to-one relationship between inferred
democrats and democrat voting results would look like. Each grey dot corresponds to one
of the voting precincts, with a size proportional to the voting age population. The dark
dots correspond to a binned scatterplot. Note that the coefficient from the linear regression
(1.075) is very close to one, as expected. Moreover, the R2 of the regression (0.604) indicates
that the two variables are highly correlated.
We want to classify everyone, not just a subsample. For that reason, we build a simple
Logit model to predict whether you are Republican (or Democrat) based on the subsample
with a classification. The independent variables are the household’s proposed value, the
percentage of voters in the same precinct as the household that voted for Obama in the 2012
presidential election, a dummy for whether the home has multiple owners, a 2020 homestead
indicator, and fixed effects for each zip code and Independent School District. The model
is quite predictive, with an Area Under the ROC curve (AUC) of 78.1%. We then use
the predictive model to extrapolate to the subjects who were uncategorized. In the final
sample, 55% of the subjects are categorized as more likely to identify as Democrats and the
remaining 45% are categorized as more likely to be Republican. This narrow advantage for
the Democrats is consistent with recent electoral results from Dallas County. In the 2012
presidential election Barack Obama received 57% of the votes while Mitt Romney received
42% of the votes. In the 2016 presidential election, the Democrat advantage in Dallas county
was more pronounced, although this may be due to the unusual platform of the Republican
candidate: Hillary Clinton received 60.8% of the votes while Donald Trump received 34.6% of
the votes and Gary Johnson (a conservative candidate from the Libertarian party) received
3.2% of the votes.
55
This data was obtained Harvard’s Precinct-Level Election database, which is available at https://
dataverse.harvard.edu/dataset.xhtml?persistentId=hdl:1902.1/21919.
xivFigure A.1: Additional Falsification Tests: Effects of the 2020 Homestead Cap on the
Probability of Protesting
40
Protest Probability (p.p.)
20
0
−20
15
16
17
18
19
20
20
20
20
20
20
20
Year
Notes: The horizontal axis presents the year and the vertical axis the protest
rate. The blue dots represent the coefficient on τi from the Instrumental Variables
regression shown in equation 6 from Section 3.2, except the dependent variable is
an indicator variable that takes the value 100 if the owner protested directly in the
corresponding year between 2015-2020. The endogenous variable (τi ) corresponds
to the property tax rate (in percentage points) to which the household is subject.
The excluded instrument is the interaction between two variables: the difference
between the proposed value and the potential homestead cap, and an indicator
variable for whether that difference is positive. The regressions controls for the
difference between the proposed value and the potential homestead cap as well
as a host of additional variables – see Section 3.2 for the full list. Results based
on households with single-family homes, 2020 homestead status, and an absolute
difference between the proposed value and the potential homestead cap of less
than $15,000.
xvFigure A.2: Additional Falsification Tests: Effects of the two Letter Types on the Probability
of Protesting
Basic Aid Letter
Extra Aid Letter
3
Protest Probability (p.p.)
Start of
Intervention
2
1
0
−1
15
16
17
18
19
20
20
20
20
20
20
20
Year
Notes: The horizontal axis presents the year and the vertical axis the protest
rate relative to the control group. The blue dots and red diamonds represent
the average direct protest rate relative to the control group for the subjects who
received the basic aid and extra aid letter respectively.
xviFigure A.3: Additional Falsification Tests: Effect of the Information on Average Tax Rate
in the County on the Probability of Protesting
1
Protest Probability (p.p.)
0
−1
−2
15
16
17
18
19
20
20
20
20
20
20
20
Year
Notes: All results are based on households who received a letter in the field
experiment in 2020. The horizontal axis presents the year and the vertical axis
the protest rate. The blue dots represent the coefficient on the information shock
(Di · (τ − τi )) based on equation (10) from Section 5.5, except the dependent
variable is an indicator variable that takes the value 100 if the owner protested
directly in the corresponding year between 2015-2020.
xviiFigure A.4: Distribution of Proposed Savings Implied by the Extra Aid Message
4
3
Percent
21
0
5 10 15 20
Proposed Savings (%)
Notes: This figure shows the distribution of proposed savings, expressed as a
percentage of the home’s market value as notified by DCAD, for all households
in the subject pool of the field experiment. Proposed savings is defined as the
difference between the household’s proposed value (as notified by the DCAD) and
the sale price of the nearby, comparable home that was chosen by our algorithm.
Each household that was mailed the extra aid letter had the comparable home
included in the letter which could be used to support the household’s protest
(see Section 4.1). Details about the algorithm used select comparison homes are
contained in Appendix A.5.
xviiiFigure A.5: Differences between Subject’s Properties and their Comparable Properties
a. RedFin/Zillow Estimates b. Distance to Comparable
10
2.5
8
2
1.5
6
Percent
Percent
4
1
2
.5
0
0
00
5
0
5
0
25
50
75
0
0
5
.5
5
−7
−5
−2
10
.2
.7
−1
Household − Comparable RedFin Estimates (%−Difference) Distance to Comparable (Miles)
c. Square Footage d. Number of Bathrooms
60
4
40
3
Percent
Percent
2
20
1
0
.5
.0
.5
0
5
0
5
0.
0.
1.
1.
−1
−1
−0
0
>=May 15th, 2020 May 15th, 2020
Dear Jose E Alamillo, Dear Michael & Kim Walker,
We are researchers at The University of Texas at Dallas and we are reaching out to you as part of a We are researchers at The University of Texas at Dallas and we are reaching out to you as part of a
research study. You can lower your tax burden by protesting the taxable value assessment of research study. You can lower your tax burden by protesting the taxable value assessment of
your property. We want to share information that we hope will be useful. your property. We want to share information that we hope will be useful.
Figure A.6: Sample Information Tables
Some people
THE may choose to OF
UNIVERSITY protest
TEXASbecause they feel they are paying more than their fair share. Find
AT DALLAS Some people may choose to protest because they feel they are paying more than their fair share. Find
below some information
Naveen about
Jindal the estimated
School 2020 taxes for your home at 7117 Christie Ln (Dallas, TX)
of Management below some information about the estimated 2020 taxes for your home at 1320 Amsbury Dr (Desoto,
in Dallas County: a. Average:No & Rate:No TX) in Dallas County: b. Average:Yes & Rate:No
YOUR HOME YOUR HOME AVERAGE DALLAS HOME
May 15th, 2020
Proposed Value Proposed Value
Dear Robert Kevin &Tax
Estimated Becky Francis Drew,
Amount Estimated Tax Amount
We are
Source: Dataresearchers
provided by DallasatCentral
TheAppraisal
University
Districtof Texas
(CAD). at Value
Proposed Dallas andCAD's
is Dallas weestimate
are reaching out
of the home's to value
market youasasof January
part of1st,a Source: Data provided by Dallas Central Appraisal District (CAD). Proposed Value is Dallas CAD's estimate of the home's market value as of January 1st,
research
2020. study.
Estimated Youis our
Tax Amount can lower
estimate your
of taxes tax
due this yearburden by tax
using the latest protesting
rates available the
(some taxable value
exemptions might assessment
not be included). of 2020. Estimated Tax Amount is our estimate of taxes due this year using the latest tax rates available (some exemptions might not be included). Average
your property. We want to share information that we hope will be useful. Dallas Home values are based on all single-family homes in Dallas County, excluding condos, townhomes, and mobile homes.
The deadline to protest is June 15th, 2020. You can fill out a short form online or mail it in. You can
Some people may choose to protest because they feel they are paying more than their fair share. Find The deadline to protest is June 15th, 2020. You can fill out a short form online or mail it in. You can
find instructions on how to do this on the study's website:
below some information about the estimated 2020 taxes for your home at 317 Meadowcreek Rd
c. Average:No & Rate:Yes find instructions on how to do this on the study's website:
d. Average:Yes & Rate:Yes
(Coppell, TX) in Dallas County:
https://www.utdallas.edu/taxproject/
https://www.utdallas.edu/taxproject/
YOUR HOME
If you would like to help us with our study, we kindly ask you fill out the following confidential
Proposed Value If you would like to help us with our study, we kindly ask you fill out the following confidential
survey. It only takes a couple of minutes, and we would greatly appreciate your participation:
Estimated Tax Amount survey. It only takes a couple of minutes, and we would greatly appreciate your participation:
xx
Visit http://www.utdallas.edu/taxsurvey/
Estimated Tax Rate and enter validation code AACLFY
Visit http://www.utdallas.edu/taxsurvey/ and enter validation code AABBMJ
Source: Data provided by Dallas Central Appraisal District (CAD). Proposed Value is Dallas CAD's estimate of the home's market value as of January 1st,
2020. Estimated Tax Amount is our estimate of taxes due this year using the latest tax rates available (some exemptions might not be included).
Estimated Tax Rate is the estimated tax amount divided by Proposed Value.
The deadline to protest is June 15th, 2020. You can fill out a short form online or mail it in. You can
find instructions on how to do this on the study's website:
Notes: Each panel corresponds
800 W. Campbell Road to the hypothetical table
Website: https://www.utdallas.edu/taxproject/ that a 800
Please
recycle
given household
W. Campbell Road would receive under the different treatment
Website: https://www.utdallas.edu/taxproject/ Please
recycle
Richardson, TX 75080 Richardson, TX 75080
https://www.utdallas.edu/taxproject/
groups. The table was placed in the middle of the first page of the letter, within the red frame with dashed lines in Figure 3
43294 22598
If you would like to help us with our study, we kindly ask you fill out the following confidential
208672 - May 2020 - UTD Letter.indd 1 5/15/2020 208672 AM
9:40:41 - May 2020 - UTD Letter.indd 1 5/15/2020 9:40:41 AM
survey. It only takes a couple of minutes, and we would greatly appreciate your participation:
Visit http://www.utdallas.edu/taxsurvey/ and enter validation code AAARMX
800 W. Campbell Road Website: https://www.utdallas.edu/taxproject/ Please 800 W. Campbell Road Website: https://www.utdallas.edu/taxproject/ Please
Richardson, TX 75080 recycle Richardson, TX 75080 recycle
17245
208672 - May 2020 - UTD Letter.indd 1 5/15/2020 9:40:41 AMFigure A.7: Timing of Survey Responses, Visits to the Website and Tax Protests
a. Cumulative Share of Survey Responses
100%
Start of Filing
90%
Share of Letters Read (Proxy)
Letter Delivery Deadline
80%
70%
60%
50%
40%
30%
20%
10%
0%
−2
−1
+1
+2
+3
+4
+5
+6
+7
+8
+19
+10
+11
+12
+13
+14
+15
+16
+17
+18
+29
+20
+21
+22
+23
+24
+25
+26
+27
+28
+39
+30
+31
2
+ Days Since Start of Letter Delivery
b. Unique Visitors to the Project’s Website
3,000
Unique Visitors to Project’s Website
Mail Walkthrough
2,500 Online Walkthrough
2,000 Filing
Deadline
1,500 Start of
Letter Delivery
1,000
500
0
−2
−1
+1
+2
+3
+4
+5
+6
+7
+8
+19
+10
+11
+12
+13
+14
+15
+16
+17
+18
+29
+20
+21
+22
+23
+24
+25
+26
+27
+28
+39
+30
+31
2
+
Days Since Start of Letter Delivery
c. Cumulative Share of Subjects who Protested
15%
Share of Subjects who Protested
Through Agent Filing
Direct Deadline
10%
5% Start of
Letter Delivery
0%
−2
−1
+1
+2
+3
+4
+5
+6
+7
+8
+19
+10
+11
+12
+13
+14
+15
+16
+17
+18
+29
+20
+21
+22
+23
+24
+25
+26
+27
+28
+39
+30
+31
2
+
Days Since Start of Letter Delivery
Notes: The first red line indicates the date when the first letter was delivered (May 21st , 2020), and
the second line denotes the deadline for filing a protest (June 15th , 2020). Panel (a) shows the cumulative
fraction of the 1,888 responses to the survey included in the field experiment. Panel (b) shows the cumulative
number of unique visitors to the website, by the type of activity. Panel (c) shows the cumulative fraction
of the 78,462 subjects in the field experiment who protested, by type of protest.
xxiFigure A.8: Effect of Official DCAD Mail Notification: Regression Discontinuity Design
15
14
13
12
11
Direct Protest Rate (%)
10
9
8
7
6
5
4
3
2
1
0 RD Coefficient: 0.436 (1.174)
−5
−4
−3
−2
−1
0
1
2
3
4
5
%−Growth in Market Value, 2020−2019
Notes: This figure features a binned scatterplot of the relationship between the
growth in the proposed value from 2019 to 2020 and the direct protest rate in
2020. The lines on each side of the threshold of zero corresponds to separate OLS
regressions. The RD coefficient corresponds to the difference in intercepts from
the two regression lines, with robust standard errors in parentheses. The sample
includes 40,111 households, 5,432 with negative change in proposed value and
34,679 with positive change in proposed value.
xxiiFigure A.9: Social Norms about the Fair Distribution of Taxes
80
60
Percent
4020
0
}
K}
K}
K}
K}
K}
}
0K
$0
$9
$8
$5
$2
$1
$1
B
,H
B
B
B
B
B
H
H
H
H
H
B
,H
0K
K,
K,
K,
K,
K,
$0
$1
$1
$2
$5
$8
$9
A
A
A
A
A
A
A
{H
{H
{H
{H
{H
{H
{H
Preferred Tax Distribution
Notes: This figure shows the distribution of social norms based on a question
included in the Field Survey regarding the fair tax burden distribution. The
horizontal axis presents the options given to respondents on how to distribute a
total tax burden of $10,000 between Household A which is worth $100,000 and
Household B which is worth $400,000. The vertical axis presents the share of the
responses choosing each option.
xxiiiFigure A.10: Validation of Partisan Identity Data: Inferred Democrat Identity vs. Voting
Results by Precinct
100
80
Inferred Democrats (%)
40 20 60
Slope: 1.075 2(0.030)
R : 0.604
N= 555
0
0 20 40 60 80 100
Democrat Votes (%)
Notes: This figure features the relationship between inferred Democrat identity
and the percentage of votes for Obama in the 2012 presidential election. Each
light dot correspond to a different precinct, while the dark dots denote the corre-
sponding binned scatterplot. The dashed line is the 45-degree line, representing
what a one-to-one relationship between inferred democrats and democrat voting
results would look like. The slope (and R2 of the relationship is shown in the
note.
xxivTable A.1: Descriptive Statistics: Quasi-Experiment, Field Experiment and Mturk Samples
Dallas County Mturk
(1) (2) (3) (4)
QE FE FE-S SE
Home Value ($1,000s) 306.91 343.91 394.98 294.12
(0.56) (1.15) (6.99) (5.70)
Number of Bedrooms 3.24 3.31 3.41 3.08
(0.00) (0.00) (0.01) (0.02)
Property Tax Amount ($1,000s) 6.15 7.17 8.22 3.50
(0.01) (0.02) (0.14) (0.07)
Property Tax Rate (%) 1.98 2.10 2.11 1.28
(0.00) (0.00) (0.01) (0.02)
Owner-Protest in 2019 (%) 5.93 5.95 10.33
(0.04) (0.08) (0.70)
Agent-Protest in 2019 (%) 7.96 4.64 5.67
(0.04) (0.08) (0.53)
2020 Homestead Exemption (%) 74.24 83.81 92.80
(0.07) (0.13) (0.60)
Age 52.29 52.68 42.69
(0.06) (0.34) (0.28)
Democrat (%) 55.07 45.55 38.64
(0.18) (1.15) (1.07)
Republican (%) 44.93 54.45 31.57
(0.18) (1.15) (1.02)
White (%) 65.12 75.17 82.95
(0.21) (1.14) (0.83)
African-American (%) 8.55 6.57 4.84
(0.12) (0.66) (0.47)
Hispanic (%) 20.39 12.03 4.50
(0.17) (0.86) (0.46)
Observations 423,607 78,462 1,888 2,065
Notes: Average pre-treatment characteristics (i.e., prior to the letter delivery) with standard errors in parentheses.
Column (1) corresponds to the Quasi-Experiment (QE). Column (2) is the subsample of the subjects from column (1)
who were selected to participate in the Field Experiment (FE). Column (3) is the subsample of the subjects from column
(2) who responded to the survey included in the letter (FE-S). Column (4) corresponds to the individuals recruited
from Amazon Mechanical Turk who participated in the Survey Experiment (SE). Home Value is the notified assessed
value; Property Tax Amount is the estimated amount of property taxes based on the notified value; Owner-Protest
and Agent-Protest indicate whether the subject protested directly or through an agent, respectively; 2020 Homestead
Exemption indicates effective homestead exemption. In columns (1)–(3), the first seven variables are obtained from the
county’s administrative records and the rest are provided by a private company (and obtained only for the households
in the field experiment). Column (4) is based on survey responses.
xxvTable A.2: Randomization Balance Test
By Letter Type By Table Type
(1) (2) (3) (4) (5) (6) (7) (8) (9) (10)
All No Letter Basic Aid Extra Aid P-value No/No Yes/No No/Yes Yes/Yes P-value
Home Value ($1,000s) 343.910 345.253 342.616 343.700 0.637 340.086 345.895 337.883 344.581 0.181
(1.148) (1.982) (1.960) (2.014) (3.377) (2.497) (3.329) (2.433)
Number of Bedrooms 3.305 3.307 3.304 3.304 0.781 3.306 3.306 3.307 3.300 0.785
(0.002) (0.004) (0.004) (0.004) (0.007) (0.005) (0.007) (0.005)
Property Tax Amount ($1,000s) 7.166 7.188 7.162 7.145 0.748 7.085 7.216 7.028 7.188 0.088
(0.023) (0.039) (0.040) (0.040) (0.067) (0.050) (0.067) (0.049)
Property Tax Rate (%) 2.103 2.104 2.106 2.099 0.239 2.107 2.104 2.093 2.104 0.252
(0.002) (0.003) (0.003) (0.003) (0.005) (0.004) (0.005) (0.004)
Owner-Protest in 2019 (%) 5.954 6.135 5.833 5.874 0.279 5.831 6.032 5.549 5.837 0.492
xxvi
(0.084) (0.143) (0.148) (0.148) (0.254) (0.184) (0.252) (0.180)
Agent-Protest in 2019 (%) 4.642 4.721 4.610 4.586 0.731 4.597 4.707 4.822 4.380 0.352
(0.075) (0.127) (0.133) (0.131) (0.227) (0.164) (0.236) (0.158)
2020 Homestead Exemption (%) 83.809 83.896 83.592 83.926 0.529 83.318 83.593 84.139 83.963 0.400
(0.132) (0.219) (0.234) (0.231) (0.404) (0.286) (0.402) (0.282)
Observation 78,462 28,068 25,012 25,382 8,506 16,761 8,253 16,874
Notes: Average pre-treatment (i.e., before the start of letter delivery) characteristics of subjects, with standard errors in parentheses. Column (1)
corresponds to the entire sample. Columns (2)–(3) break down that sample into households assigned to no letter, basic aid letter and extra aid
letter, respectively. Column (4) reports the p-value of the test of equal means across the three treatment groups. Columns (6)–(9) break down
the subjects assigned to letters by whether the table in the letter included the additional column (i.e., the county averages) and/or the additional
row (i.e., the explicit tax rate). Column (10) reports the p-value of the test of equal means across the last four treatment groups. Home Value is
the proposed assessment value; Property Tax Amount is the estimated amount of property taxes based on the proposes assessment; Property Tax
Rate is the ratio of Property Tax Amount over Home Value; Owner-Protest and Agent-Protest indicates whether the subject protested directly or
through an agent, respectively; 2020 Homestead Exemption indicates an effective homestead exemption.You can also read