BROWN CRAB COVID-19 IMPACT ON THE SUPPLY CHAIN - WWW.EUMOFA.EU
←
→
Page content transcription
If your browser does not render page correctly, please read the page content below
BROWN CRAB

                   COVID-19 IMPACT ON THE
                             SUPPLY CHAIN

                                     JULY 2021

                              WWW.EUMOFA.EU

Maritime Affairs
and Fisheries
Manuscript completed in July 2021.
The European Commission is not liable for any consequence stemming from the reuse of this publication.
Luxembourg: Publications Office of the European Union, 2021
© European Union, 2021

The reuse policy of European Commission documents is implemented based on Commission Decision 2011/833/EU
of 12 December 2011 on the reuse of Commission documents (OJ L 330, 14.12.2011, p. 39).
Except otherwise noted, the reuse of this document is authorised under a Creative Commons Attribution 4.0
International (CC-BY 4.0) licence (https://creativecommons.org/licenses/by/4.0/). This means that reuse is allowed
provided appropriate credit is given and any changes are indicated.

For any use or reproduction of elements that are not owned by the European Union, permission may need to be
sought directly from the respective rightholders. The European Union does not own the copyright in relation to the
following element:
cover photo: Valentyn Volkov©. Source: Shutterstock
PDF     ISBN 978-92-76-40317-3         KL-06-21-002-EN-N        doi:10.2771/070703

FOR MORE INFORMATION AND COMMENTS:
Directorate-General for Maritime Affairs and Fisheries
B-1049 Brussels
Tel: +32 229-50101
E-mail: contact-us@eumofa.eu

                                                                                                                 i
CONTENTS
SUMMARY ............................................................................................................................................................. 2
LIST OF ACRONYMS ........................................................................................................................................... 3
0       SCOPE AND CONTENT ............................................................................................................................... 4
    0.1 STUDY SCOPE...................................................................................................................................................................................4
    0.2 METHODOLOGY ...............................................................................................................................................................................4
        0.2.1           Brexit .....................................................................................................................................................................................4
    0.3 DATA ..................................................................................................................................................................................................4
1       BROWN CRAB .............................................................................................................................................. 8
    1.1 BIOLOGY............................................................................................................................................................................................8
    1.2 FISHERY AND RESOURCE MANAGEMENT ....................................................................................................................................9
2       THE SUPPLY CHAIN OF BROWN CRAB ............................................................................................... 11
    2.1 CATCH .............................................................................................................................................................................................11
    2.2 LANDINGS ......................................................................................................................................................................................12
    2.3 PROCESSING..................................................................................................................................................................................13
    2.4 INTERNATIONAL TRADE ...............................................................................................................................................................14
        2.4.1           Exports...............................................................................................................................................................................14
    2.5 CONSUMPTION..............................................................................................................................................................................18
3       MARKET CHANGES ................................................................................................................................... 20
    3.1 COVID-19 ...................................................................................................................................................................................20
        3.1.1           Landings ...........................................................................................................................................................................20
        3.1.2           First sales ........................................................................................................................................................................21
        3.1.3           International trade ......................................................................................................................................................22
    3.2 CADMIUM .......................................................................................................................................................................................27
    3.3 BREXIT ............................................................................................................................................................................................28
4       CONCLUDING REMARKS ......................................................................................................................... 29

                                                                                                                                                                                                                        i
EUMOFA - European Market Observatory for Fisheries and Aquaculture Products

                                                                              Brown crab: COVID-19 impact on the supply chain

      SUMMARY
This study aims to provide an understanding of the brown crab (Cancer pagurus) supply chain and
establish the status for the sector both prior to and during the COVID-19 pandemic. It also aims to give
insight into how stakeholders in the nations that catch the most brown crab were affected by the COVID-
19 pandemic, and their course of action in dealing with the consequences. The study is based on publicly
available literature, research, news articles, and available data. Stakeholders in Norway, the UK, Ireland,
and France were contacted and asked to contribute to the study. The main data source for this study
concerning catches of brown crab was the FAO, while data from EUMOFA (based on EUROSTAT and IHS
Markit – Global Trade Atlas) and Statistics Norway were used when analysing the international trade
flows.
Brown crab, also known as edible crab, is a benthic species that lives on a wide range of seafloors: sand,
gravel, and rock, at depths of 6 to 100 metres. It is found in the Eastern Atlantic, from northern Morocco,
extending along the Atlantic coast of Europe, to the British Isles and northern Norway.
In 2019, the FAO reported a total global catch of 50.480 tonnes of brown crab. The majority of this
(60%) was caught by the UK. Other major catching nations are Ireland, Norway, and France. Together
these four nations have accounted for 94% of total catches since 2010. In terms of first sales, large
parts of the edible crab industry consist of fishers selling catches to processors and exporters through
temporary or long-term contracts. The brown crab may be sold live or processed into products ranging
from boiled whole (sold chilled or frozen), crab meat, or other value-added products.
The COVID-19 pandemic represented a shock for the brown crab sector in 2020. The pandemic disrupted
the supply chain, tested the robustness of the sector, and forced innovation. The effect of the pandemic
hit stakeholders differently depending on their business model. Processors who had diversified sales to
both retail and HoReCa were better equipped to keep up sales when one market disappeared, as opposed
to those who only sold to the HoReCa sector. Many processors also had the advantage of being able to
build inventory and postpone sales. The effect of the COVID-19 pandemic differed between nations. In
the UK, many fishers refrained from fishing crab as prices were too low to cover costs. In addition,
weather conditions caused a poor fishing season. On the other hand, Norwegian and French crab fishers
were shielded from the full impact of COVID-19 as the largest Norwegian processor continued buying
crab from fishers and demand during the peak season in France remained consistent.
In addition to the COVID-19 pandemic, the issue of cadmium restrictions on live brown crab exported to
China has been, and still is, affecting the sector. Market access has been reduced for all exporters, except
for crab caught and exported from the Netherlands. Many stakeholders reported that exports to China
would increase if the cadmium testing regime were eased.

                                                                                                                           2
EUMOFA - European Market Observatory for Fisheries and Aquaculture Products
Brown crab: COVID-19 impact on the supply chain
LIST OF ACRONYMS
CN Combined Nomenclature
HS Harmonised Standard
EU European Union
FAO Food and Agriculture Organisation of the United Nations
HoReCa Hotel, Restaurant, Café
MAC Market Advisory Council
MCRS Minimum Conservation Reference Size
3EUMOFA - European Market Observatory for Fisheries and Aquaculture Products
Brown crab: COVID-19 impact on the supply chain
0 SCOPE AND CONTENT
0.1 Study scope
This study was suggested by the Market Advisory Council (MAC). The MAC drew attention to the need for
specific studies to assess the significant impact of the COVID-19 pandemic on the entire seafood supply
chain, and in particular on the brown crab (Cancer pagurus) supply chain. In this context, it was also
necessary to evaluate possible mitigation measures to develop a strategy to cope with such global crises
in the future.
This study thus aims to provide an understanding of the brown crab value chain and establish the status
for the sector both prior to and during the COVID-19 pandemic. This study also aims to give insight into
how stakeholders in brown crab catching nations were affected by the COVID-19 pandemic and their
course of action in dealing with the consequences.
0.2 Methodology
The study is based on publicly available literature, research, news articles and data sources. Stakeholders
in Norway, the UK, Ireland, and France were contacted and asked to contribute to the study. Five
interviews were conducted, leading to contributions of both general and specific insight regarding
production, trade, and market outlets.
Despite involvement from the MAC, it has proven difficult to find stakeholders willing to participate in
this study. This study is subject to inherent limitations with results and recommendations shaped by the
input of the interviews.
0.2.1 Brexit
This report analyses data for the years 2010-2020. The UK formally left the EU on 31st January 2020
and entered a transition period that lasted until 31st December 2020. Starting from February 2020, trade
data reported by the UK are not available in EUROSTAT. For the sake of consistency, the UK is excluded
from the EU aggregate and treated as an extra-EU country throughout the whole period in all analyses
in this report.
The IHS Markit – Global Trade Atlas has been therefore used as the source for data on UK imports and
exports,
0.3 Data
The main data source for this study concerning catches of brown crab is the FAO, while data from
EUMOFA (based on EUROSTAT and IHS Markit – Global Trade Atlas) and Statistics Norway are used when
analysing the international trade flows.
The EUMOFA international trade database includes volumes and values of imports and exports of fishery
and aquaculture products from almost 100 reporting countries. EUROSTAT (Comext) data is available
through EUMOFA and monitors monthly trade flows within the EU and between EU Member States and
third countries. Although both EUROSTAT-COMEXT and IHS data are comprehensive, it must be
highlighted that imports and exports of goods are reported in line with the Harmonised System1 (HS) and
1
World Customs Organization http://www.wcoomd.org/en/topics/nomenclature/overview/what-is-the-harmonized-system.aspx
4EUMOFA - European Market Observatory for Fisheries and Aquaculture Products
Brown crab: COVID-19 impact on the supply chain
the Combined Nomenclature2 (CN), which do not include detailed information on brown crab products.
Data on international trade flows between Member States, and between Member States and third
countries, are publicly available at MCS3 level on the EUMOFA website.
The codes used for the analysis of brown crab exports from the EU, UK, and Norway during the time
scope of this study are listed below. The bolded codes are currently in use for trade of brown crab, while
the non-bolded codes are historical and no longer in use.
HS-8 Description
Frozen crabs "Cancer pagurus", even smoked, whether in shell
0306 14 30
or not, incl. crabs in shell, cooked by steaming or by boiling in
water.
EU and the UK
Crabs "Cancer pagurus", whether in shell or not, live, fresh or
0306 33 10
chilled.
Crabs, with the exception of red king crab (Paralithodes
0306 14 08
camtschaticus) and snow crab (Chionoecetes opilio), frozen.
Crabs of the species Cancer pagurus, not frozen.
0306 24 30 Used until 2016, when it was split into H8 codes 0306 33 10
and 0306 93 10.
Crabs, with the exception of red king crab (Paralithodes
0306 33 91
camtschaticus) and snow crab (Chionoecetes opilio), live.
Crabs, with the exception of red king crab (Paralithodes
0306 33 99 camtschaticus) and snow crab (Chionoecetes opilio), fresh or
chilled.
Crabs, with the exception of red king crab (Paralithodes
0306 93 09
Norway
camtschaticus) and snow crab (Chionoecetes opilio), dried,
smoked, salted or in brine.
Crabs, with the exception of red king crab (Paralithodes
camtschaticus), frozen.
0306 14 09
Used until 2015, when it changed to 0306 14 08 (snow crab
removed).
Crabs, with the exception of red king crab (Paralithodes
0360 24 08
camtschaticus) and snow crab (Chionoecetes opilio) not frozen.
2
Council Regulation (EEC) No 2658/87 of 23 July 1987 on the tariff and statistical nomenclature and on the Common
Customs Tariff. https://ec.europa.eu/taxation_customs/business/calculation-customs-duties/what-is-common-customs-
tariff/combined-nomenclature_en
3
Main Commercial Species are EUMOFA aggregates of CN and HS codes as part of the harmonisation rules. Read more about
EUMOFA data management methodologies (https://www.eumofa.eu/supply-balance-and-other-methodologies) and
harmonisation correlation tables (https://www.eumofa.eu/harmonisation).
5EUMOFA - European Market Observatory for Fisheries and Aquaculture Products
Brown crab: COVID-19 impact on the supply chain
HS-8 Description
Used until 2017 when it was split to 0306 33 91, 0306 33
99, and 0306 93 09.
Crabs, with the exception of red king crab (Paralithodes
0360 24 09 camtschaticus), not frozen.
Used until 2015 when it was split to 0360 24 08.
Monitoring the international trade of brown crab is challenging, as products are exported under codes
which only reflect the preservation states of the products: live and/or fresh/chilled, frozen, dried, salted,
smoked or in brine. All these categories include whole crab, claws and meat and are presented as an
aggregated net weight. Corresponding data must therefore be interpreted with care, as they do not
reflect the product composition and the difference in value. For example, a tonne of crab traded under
the HS-8 code 0306 33 10 could contain mainly live crab or mostly crab claws and meat. If most of one
trade flow includes live crab, the weight does not reflect the amount of crab meat which is consumed,
which is much lower as shells and innards are discarded. Similarly, if one trade flow mainly includes
claws and meat, the amount of crab needed to produce the product is higher than the product weight
indicated.
The uncertainty regarding the product composition also makes price analysis misleading as the price per
kg of crab meat, claws, and other form of processed crab is higher than whole crab. Variances in unit
price could reflect demand, the type of product purchased, or a combination of the two. Results regarding
price should therefore be treated with extreme caution. As data on the international trade of crab
products are aggregated based on their preservation and presentation state, it is not possible to
implement analysis regarding prices.
In 2017, a revision of the HS nomenclature led to separation of data for live, fresh, or chilled crab, and
other preservation states of crab (excluding frozen products), which prior to 2017 were combined into
one trade number.
In Norway, trade data prior to 2015 only singled out the red king crab (Paralithodes camtschaticus), while
all other crab species were reported under the codes HS 0306 14 09 (frozen) and 0360 24 09 (not
frozen). Snow crab (Chionoecetes opilio) was given an individual code in 2015. With the exception of red
king crab and snow crab, which are currently exported under their own codes, crab exports from Norway
primarily contain brown crab. Although it cannot be established that the Norwegian crab export under
the relevant trade codes are exclusively brown crab after 2015, the export of any other crab species can
be considered minor.
Trade data for Norwegian crab distinguish between live crab and fresh or chilled crab, while EU trade
data does not. To create aggregated and comparable statistics, the Norwegian trade data regarding live
crab and fresh or chilled crab were manually combined.
As brown crab catches are limited to coastal countries in Europe, all exports must at one point originate
from these nations. Trade data for the most part reflects this, with some exceptions. The sixth largest
exporter in 2020 in terms of volume and value was South Korea, reporting exports of 832 tonnes.
Although this could be re-export, exports to South Korea are only 46,3 tonnes. The most likely explanation
is that South Korea is reporting trade of other crab species under the brown crab code. South Korean
import data confirms this suspicion. In 2019 South Korea reported brown crab imports of 26.000 tonnes.
The same year, the global aggregated volume of brown crab exports was 23.731 tonnes. Given that it is
impossible for South Korean imports to exceed global exports, it is highly likely that species other than
brown crab are included in the import statistics. Reported brown crab exports and imports from South
Korea are therefore excluded.
6EUMOFA - European Market Observatory for Fisheries and Aquaculture Products
Brown crab: COVID-19 impact on the supply chain
The four largest catching nations, namely the UK, Ireland, Norway, and France, together accounted for
96% of all catches in 2019. When considering exports, only data from the four major catching nations
are used. This is done to avoid double-counting crabs which are exported to intermediary nations (hubs)
for re-export.
7EUMOFA - European Market Observatory for Fisheries and Aquaculture Products
Brown crab: COVID-19 impact on the supply chain
1 BROWN CRAB
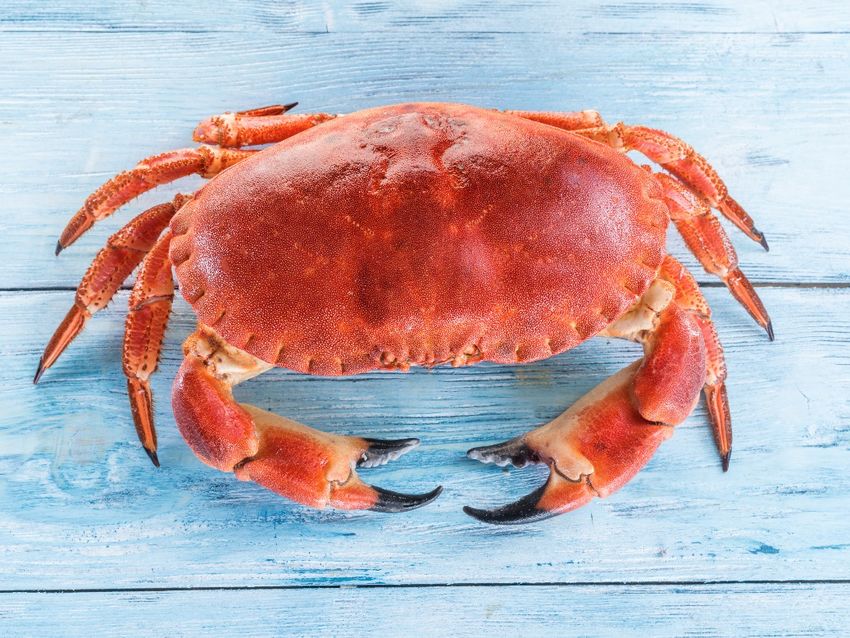
Brown crab (Cancer pagurus) also known as edible Figure 1: Brown crab (Cancer pagurus)
crab, is a benthic species that lives on a wide range
of seafloors: sand, gravel, and rock, at depths of 6
to 100 metres, but most commonly between 6 and
40 metres4.
Brown crab is found in the Eastern Atlantic, from
northern Morocco, along the Atlantic coast of
Europe, to the British Isles and northern Norway
(about 70º N). There have also been reports of
brown crab being observed along the north coast Source: FAO
of the Mediterranean (Marseille, Naples, Greece),
although these are mostly old reports with no current reports recording catches in this area5.
Figure 2: Geographic distribution of brown crab
Source: FAO
1.1 Biology
Brown crabs have a heavy, oval shaped body and can easily be identified by their “piecrust” edge and
black-tipped pincers6. The carapace (the hard upper shell of a crustacean) can reach a maximum length
of 20 cm and a maximum width of 30 cm, though most commonly has a width of under 24 cm7. Adult
brown crabs may vary in colour, being primarily reddish brown with patches of yellowish brown, while
4
http://www.fao.org/fishery/species/2627/en
5
Ibidem
6
Neal, K.J. & Wilson, E. 2008. Cancer pagurus Edible crab. In Tyler-Walters H. and Hiscock K. (eds) Marine Life Information
Network: Biology and Sensitivity Key Information Reviews, [on-line]. Plymouth: Marine Biological Association of the United
Kingdom. [cited 11-02-2021]. Available from: https://www.marlin.ac.uk/species/detail/1179
7
http://www.fao.org/fishery/species/2627/en
8EUMOFA - European Market Observatory for Fisheries and Aquaculture Products
Brown crab: COVID-19 impact on the supply chain
juveniles may have a more purplish colour. The “legs” (pereopods) are covered in tufts of stiff hairs in
rows, and the last segment of the walking legs (dactyls) end in spine-like tips8.
Brown crabs grow by moulting, a process in which they crawl out of their exoskeletons, allowing the body
to take up water and increase in size before the new shell hardens. The water absorbed will later be
replaced by tissue, constituting the actual growth. Moulting happens in the warm season, with the
frequency of exoskeleton shedding decreasing with age.
Mating takes place in late autumn and early winter shortly after the female has moulted. The male
stands over the female to form a protective cage while she is moulting, and internal fertilisation takes
place before the new carapace hardens. Females carry eggs under their abdomen (berried) for five to
nine months, releasing the larva in late spring or early summer. While the females are berried they do
not feed but dig pits in which they reside. Fishing actives are therefore unlikely to catch berried females
or affect larval supply9, although some bycatch from bottom trawling might still occur. When young
crabs reach juvenile stage in the late summer/early autumn, they settle in intertidal zones10 where they
remain for roughly three years until the carapace grows to a width of 6-7 cm, after which they move to
subtidal areas11. Sexual maturity is reached after about 10 years, and on average a brown crab has a
lifespan of 30 years12.
Brown crabs are omnivores, scavengers, and active predators. Their main diets are bivalves, smaller
crustaceans, barnacles, and snails13. Their omnivore diet contributes to keeping the seafloor free from
organic debris.
1.2 Fishery and resource management
The period of highest catches is from June to November, with some regional variance. Brown crab is
usually caught with baited traps, called pots, but may also be bycaught in trawl fisheries and gillnet
fisheries14. Commercial crab fishing is usually undertaken by day boats or vivier vessels. The latter are
used for more offshore fishing and contain water tanks to hold live crab15. After being caught, crabs may
be 'nicked': fracturing the apodemes (attachment site for muscles), to immobilize the claws to prevent
cannibalism and fighting during storage16. This is especially common for catches done by vivier vessels.
Commercial fishers primarily use pots, a closed basket with baited soft-eye side-entry ports. These pots
have a low impact on the environment and are very selective, limiting the bycatch of other species17.
Instances where crab pots have not been collected, due to equipment failure or human error, has led to
the term “ghost fishing” as crabs are trapped in the pot and starve to death, becoming bait for other
scavengers. In Norway, crab pots are required to have escape hatches which are held closed by a cotton
thread which dissolves after a certain time in water to allow the catch to escape18.
Brown crab fisheries are not managed by quotas or a total allowable catch (TAC) which has raised
sustainability concerns in fishery nations and the EU, according to stakeholders. In Ireland, a brown crab
8
Neal, K.J. & Wilson, E. 2008. Cancer pagurus Edible crab. In Tyler-Walters H. and Hiscock K. (eds) Marine Life Information
Network: Biology and Sensitivity Key Information Reviews, [on-line]. Plymouth: Marine Biological Association of the United
Kingdom. [cited 11-02-2021]. Available from: https://www.marlin.ac.uk/species/detail/1179
9
https://www.marlin.ac.uk/species/detail/1179
10
An area which is above water level at low tide and under water at high tide.
11
An area which is below the intertidal zone (see previous footnote), and is continuously covered by water.
12
https://www.mcsuk.org/downloads/seachampions/205-2012_Crab%20Festival_F.pdf
13
Woll A., Bakke S., van der Meer G., Krabben (2021), Kolonfon Forlag AS
14
http://www.fao.org/fishery/species/2627/en
15
https://fishingnews.co.uk/features/carvela-new-stromness-vivier-crabber-proving-its-fishing-credentials-west-of-orkney/
16
https://www.sciencedirect.com/science/article/abs/pii/S0022201112002182
17
https://thefishsite.com/articles/brown-crab-a-guide-to-handling-and-quality
18
https://www.fiskeridir.no/Fritidsfiske/Reiskap/Teiner
9EUMOFA - European Market Observatory for Fisheries and Aquaculture Products
Brown crab: COVID-19 impact on the supply chain
fishery improvement project (FIP) has been created to increase the transparency and sustainability of
the sector19.
Regulation (EU) No 2019/124120 sets minimum conservation reference size (MCRS) at 140 mm,
measured as the maximum width of the carapace measured perpendicular to the antero-posterior
midline of the carapace21. A few geographical exceptions are noted for the MCRS ranging from 70 mm
to 115 mm22. For brown crabs caught in pots or creels, a maximum of 1% by weight of the total catch
may consist of detached claws. For brown crabs caught with any other fishing gear, a maximum of 75
kg of detached crab claws may be landed 23.
The UK is the largest catch nation of brown crabs. England has five defined Crab Fishery Units which
each encompass water covered by international, national, and local legislation which may vary within
each region24. The MCRS in England varies from 115 mm to 160 mm for male crabs25,26. In Scotland, the
MCRS is 150 mm, with the exception of Shetland where it is 140 mm27.
Prior to Brexit, Norway was the largest non-EU catch nation of brown crab. The Norwegian MCRS ranges
from 110 mm to 130 mm along the coast28. The Norwegian crab fishing fleet is dominated by vessels
below 11 m, consisting mostly of small-scale operations fishing for other species in addition to crabs29.
In 2018, more than 400 boats registered landings of brown crab in Norway30. Non-commercial fishers
may set up to 20 pots per person or per vessel, and can sell catch up to, but not exceeding, NOK 50.000
(EUR 4.67131) per year32.
19
http://irishbrowncrabfip.ie/
20
Regulation (EU) No 2019/1241of 20 June 2019 on the conservation of fisheries resources and the protection of marine
ecosystems through technical measures.
21
https://eur-lex.europa.eu/legal-content/EN/TXT/PDF/?uri=CELEX:32019R1241&from=EN
22
In ICES divisions 6a and 7a a minimum conservation reference size of total length of 70 mm and a carapace length of 20
mm shall apply. In an area in ICES divisions 4b and 4c limited by a point at 53°28′22″ N, 0°09′24″ E, on the coast of England,
a straight line joining this point with 53°28′22″ N, 0°22′24″ E, the 6-mile boundary of the United Kingdom, and a straight line
connecting a point at 51°54′06″ N, 1°30′30″ E, with a point on the coast of England at 51°55′48″ N, 1°17′00″ E, a minimum
conservation reference size of 115 mm shall apply.
23
https://eur-lex.europa.eu/legal-content/EN/TXT/PDF/?uri=CELEX:32019R1241&from=EN
24
https://assets.publishing.service.gov.uk/government/uploads/system/uploads/attachment_data/file/974752/Crab_assessments_
2019__March_21_update.pdf
25
https://www.gov.uk/government/publications/minimum-conservation-reference-sizes-mcrs/minimum-conservation-
reference-sizes-mcrs-in-uk-waters
26
https://assets.publishing.service.gov.uk/government/uploads/system/uploads/attachment_data/file/974752/Crab_assessments_
2019__March_21_update.pdf
27
https://www.gov.scot/publications/landing-controls-for-crab-and-lobster/
28
https://www.fiskeridir.no/Fritidsfiske/Artar/Krabbefiske
29
https://www.hi.no/en/hi/temasider/species/edible-crab
30
Ibidem
31
With the average ECB exchange rate for 2020 of 0.09342 EUR/NOK
32
https://www.fiskeridir.no/Fritidsfiske/Artar/Krabbefiske
10EUMOFA - European Market Observatory for Fisheries and Aquaculture Products
Brown crab: COVID-19 impact on the supply chain
2 THE SUPPLY CHAIN OF BROWN CRAB
2.1 Catch
According to the FAO, brown crab is only caught by European countries and all catches are registered in
FAO fishing area number 27 in the Northeast Atlantic Ocean. In 2019, the FAO reported a total catch of
50.480 tonnes, a decrease of 5% compared to 2018. Yearly catch volumes fluctuate but there is a
general increasing trend: since 2010, catches of brown crab have experienced a year-over-year increase
of 8%.
The UK is by far the largest catching nation, catching around 60% of total global volume between 2015
and 2019. The UK is followed by Ireland, Norway and France. Together, these four countries have
accounted for roughly 94% of the catches since 2010.
UK catches increased by 27% between 2010 and 2019 and have increased sevenfold since 1950.
Catches in Ireland and Norway have remained stable over the last 10 years, with Irish catches fluctuating
between 6.260 tonnes and 8.261 tonnes and Norwegian catches between 4.742 tonnes and 5.852
tonnes.
Table 1: Catches of Cancer pagurus by country (tonnes)
Country 2010 2011 2012 2013 2014 2015 2016 2017 2018 2019
United
24.457 25.763 27.273 28.778 32.063 28.986 33.761 32.410 32.018 31.004
Kingdom
Ireland 8.210 6.691 6.269 6.378 7.118 7.191 7.285 6.577 8.261 7.744
Norway 5.773 5.319 4.981 5.241 4.629 4.743 4.926 4.924 5.852 5.365
France 5.916 6.950 6.141 5.925 6.132 4.565 4.490 4.324 3.706 3.193
Netherlands 394 444 470 554 580 519 577 596 572 1.028
Channel
1.179 1.193 1.252 1.173 1.233 996 1.073 984 944 696
Islands
Isle of Man 459 554 495 453 519 477 534 967 629 435
Sweden 213 204 204 223 212 224 208 251 271 275
Denmark 61 74 81 69 79 138 292 233 329 259
Belgium 95 104 272 271 272 330 305 280 258 240
Germany 135 144 114 115 107 169 186 158 149 158
Spain 61 65 86 82 49 67 66 61 70 72
Portugal 1 1 2 1 2 3 2 16 11 12
Total 46.954 47.506 47.640 49.263 52.995 48.408 53.705 51.781 53.070 50.480
* Due to rounding there might be small variations between the totals and the sum of data.
Source: FAO
11EUMOFA - European Market Observatory for Fisheries and Aquaculture Products
Brown crab: COVID-19 impact on the supply chain
Figure 3: Catches of brown crab by main fishery nations (1.000 tonnes)
35
30
25
1.000 tonnes
20
15
10
5
0
2010 2011 2012 2013 2014 2015 2016 2017 2018 2019
United Kingdom Ireland Norway France
Source: FAO
2.2 Landings
Brown crab fishing is not regulated by quotas, and catches are not as closely monitored as other species.
This leads to discrepancies in catch and landing data. As landing data for Ireland is unavailable for 2018,
total landings in 2018 and 2019 are not comparable. For 2020, only UK and Norway data are available,
and are analysed in chapter 3.1.1.
In terms of first sales, large parts of the edible crab industry consist of fishers selling catches to
processors and exporters through temporary or long-term contracts, and there are also some examples
of vertically integrated undertakings (where the same organisation manages several parts of the supply
chain). Consequently, data on first sales are lacking, as much of the landings are sold directly and
therefore not registered as first sales. These data are therefore not analysed in this chapter.
Table 2: Landings of brown crab by country (tonnes)
Country 2010 2011 2012 2013 2014 2015 2016 2017 2018 2019
United
22.691 24.372 25.630 25.881 29.723 26.467 29.478 27.304 25.571 26.124
Kingdom
Ireland 6.706 5.314 6.075 5.745 5.782 6.304 7.686 6.713 7.301
Norway 5.714 5.317 4.981 5.240 4.629 4.743 4.898 4.863 5.779 5.280
France 4.315 6.683 6.178 5.797 5.822 4.196 4.155 3.943 3.293 2.959
Netherlands 1.922 2.194 977 711 1.314 2.715 522 1.269 2.521 540
Denmark 73 83 99 72 84 259 353 313 267
Sweden 114 127 113 103 86 99 76 113 93 141
Belgium 88 98 94 76 98 151 108 101 80 65
Spain 73 70 85 85 47 67 66 59 68 62
Portugal 1 1 1 1 1 2 3 6 3 6
Germany 2 19 7 5 1 3 3 70 9 6
Total 41.698 44.278 44.238 43.715 47.589 45.005 47.345 44.441 37.729 42.753
* Due to rounding there might be small variations between the totals and the sum of data.
Source: EUROSTAT
12EUMOFA - European Market Observatory for Fisheries and Aquaculture Products
Brown crab: COVID-19 impact on the supply chain
2.3 Processing
Brown crab may be sold live, or the crab may be processed into products ranging from boiled whole and
sold chilled or frozen, crab meat, or other value-added products.
Live crabs are commonly transported either packed in Styrofoam boxes or in vivier tanks33. Trucks are
used for transportation between catch nations and other nations in Europe, while airfreight is used for
exports to overseas markets, predominantly in Asia. Airplanes may or may not contain vivier tanks, and
trucks may be standard or be specially designed vivier trucks. Vivier trucks can hold up to 12 tonnes34 of
live crab and contain water tanks that keep the crab alive and fresh. Although crabs can be stored live
in vivier tanks for longer periods than in Styrofoam boxes, mortality rates increase with time and long
storage periods should be avoided.
As crabs are highly perishable once killed, they must be boiled shortly after being euthanised. After
boiling they can be chilled, frozen, or further processed. Following an initial cooking step, crabs are
cleaned, cooled, and packaged35. A second heating step is added for pasteurisation (typically 70 °C for 2
min for picked meat or 90 °C for 10 min for whole crab)36. The product may then be frozen or chilled.
Crab claws are often sold as separate products and are pre-boiled. Claws are usually scored, where the
shell contains cuts to break apart the shell more easily and obtain the meat. Claws may also be sold as
cocktail claws which consist of the last segment of the claw with the shell removed, except for the tip
which may be used as a handle for dipping the meat in sauce.
Meat from brown crab is either white or brown. White meat originates from muscle tissue derived from
the purse, claws, and legs, while brown meat is derived from the hepatopancreas37 and gonads inside
the carapace. Crab meat may be sold in various combinations of white meat where the origin of the
meat is specified (legs, claws, or purse) or as a mixture of all white meat. Crab meat may also be sold
as pure brown meat, or as a combination of both brown and white meat. ‘Dressed crabs’ are also a
popular item where the crab shell is stuffed with crab meat and sometimes topped with a claw. These
products are typically sold frozen or chilled to the retail sector.
Crabs are processed with a mix of automated and manual labour. The majority of crab purses go through
a spin-sheller machine which extracts the crab meat through centrifugal force, creating a favourable
meat texture. The majority of toes (the ends of the legs) and legs have their meat blown out using
machines that first cut the end off and then use air pressure to blow out the meat. If the filling in the
legs is poor, manual extraction is undertaken. Crab meat may also be used as an ingredient in value-
added products such as crab cakes, pates, or pastes38.
Processing is for the most part done in the landing country, primarily through automated processes.
Products whose meat quality is not suitable for automated processing may be sent abroad, typically to
Asian countries such as Vietnam, for manual processing before being reimported as boiled or frozen. A
challenge in the brown crab industry, and especially processing, is the filling degree in the crab. After the
crab has moulted, they are known as softshell crabs, filled with water and with little meat. Whilst the
colouring and hardness of the shell - in addition to crab weight and strength - are indicators for filling
degree, guaranteeing the quality of the crab is challenging. Only about 20% of landed brown crabs in
33
Water tanks designed to keep shellfish alive during transportation
34
https://mcbridefishing.ie/products.html
35
Condon-Abanto S., Arroyo C., Alvarez I., Brunton N., Whyte P., Lyng J.G. An assessment of the application of ultrasound in the
processing of ready-to-eat whole brown crab (Cancer pagurus) Ultrason.
36 McDermott, A.; Whyte, P.; Brunton, N.; Lyng, J.; Bolton, D.J. Increasing the Yield of Irish Brown Crab (Cancer pagurus) during
Processing without Adversely Affecting Shelf-Life. Foods 2018, 7, 99. https://doi.org/10.3390/foods7070099
37
Digestive gland
38
https://www.seafish.org/document/?id=4B914136-D687-46A1-BD0D-A0BC1EA3E19E
13EUMOFA - European Market Observatory for Fisheries and Aquaculture Products
Brown crab: COVID-19 impact on the supply chain
Norway are fully filled with white meat, liver, and roe, and in general the filling degree in Norwegian
crabs is lower than crabs caught around the British Isles39. The difference in filling degree is likely due
to the different marine environments such as water depth, currents, and temperature. Some processes
use transillumination machines or scanners to determine the filling degree. On average, the yield of raw
material (live crab) to processed product is about 40%. The crabs may be cooked and thereby pasteurised
by a processor in the country of origin before possibly further processing in another location40.
2.4 International trade
This chapter aims to establish the status quo of brown crab exports. The discrepancies between export
volumes and values when comparing 2020 to previous years are discussed in the chapter on market
changes (see § 3.1.3). For a premise on how to interpret data and analyses on trade flows of brown crab,
please see § 0.2 and § 0.3.
2.4.1 Exports
The United Kingdom is the largest exporter of brown crab both in volume and value, making up 68% of
total export volume and 55% of total export value in 2020. In the same year, Ireland exported 20% of
the total volume and covered 34% of the value. France and Norway both covered 6% of total exports,
with France covering 6% of value and Norway 5%.
In 2020, the highest unit price was achieved by Ireland at 11,31 EUR/kg, a 37% increase from 8,26
EUR/kg in 2019. France had the second highest unit price in 2020 with 6,15 EUR/kg, a 13% decrease
from 7,05 EUR/kg in 2019. Norway and the UK achieved similar unit prices of 5,28 EUR/kg and 5,39
EUR/kg, a decrease of 16% and 21% respectively since 2019.
Table 3: Total exports of brown crab* from major catch nations (volume in tonnes, value in
EUR 1.000)
2017 2018 2019 2020
Country Volume Value Volume Value Volume Value Volume Value
United Kingdom 10.663 55.136 13.117 89.141 13.682 93.550 9.827 52.921
Ireland 5.576 32.980 5.007 41.246 5.403 44.619 2.878 32.547
France 1.444 8.026 1.230 7.889 1.047 7.383 885 5.446
Norway 759 4.316 883 5.879 798 5.111 858 4.614
Total 18.443 100.459 20.237 144.155 20.930 150.663 14.448 95.528
*Includes all product types, whether live, whole chilled/ frozen, claws chilled/frozen, or meat chilled/frozen/processed.
** Due to rounding there might be small variations between the totals and the sum of data.
Source: EUMOFA elaboration of IHS MARKIT
In 2020, brown crab exports were dominated by live and fresh/chilled products, which accounted for 54%
of export volume and 41% of value, and frozen crab, which made up 35% of export volume and 48% of
export value. Other preservation types made up the remaining exports, accounting for 12% of export
volume and 11% of the total value. The explanation behind the difference in export volumes and values
between preservation states may be found in the product compositions of the exports.
39
Woll A., Bakke S., van der Meer G., Krabben (2021), Kolonfon Forlag AS
40
Ibidem
14EUMOFA - European Market Observatory for Fisheries and Aquaculture Products
Brown crab: COVID-19 impact on the supply chain
Frozen brown crab products achieved the highest unit price of 9,09 EUR/kg, a 15% increase from the
price of 7,91 EUR/kg in 2019. All other states of preservation experienced a decrease in unit prices. Live,
fresh, and chilled brown crab achieved a unit price of 5,09 EUR/kg, a decrease of 24% from 6,74 EUR/kg
in 2019, while the price was 6,45 EUR/kg in 2018 and rose by 5% to 2019. With a unit price at 6,18
EUR/kg in 2020, brown crab of other preservation states experienced a 9% decrease from 2019.
The lower price of live, fresh, and chilled products could be due to the fact that live/whole crabs are sold
at lower prices per kg compared to processed meat, which are more often sold as frozen or other, pulling
down the average unit price.
Table 4: Total exports of brown crab* by preservation state (volume in tonnes, value in EUR
1.000) from major catch nations
2017 2018 2019 2020
Country Volume Value Volume Value Volume Value Volume Value
Live, fresh,
8.812 42.538 9.480 61.108 11.229 75.700 7.744 39.428
chilled
Frozen 8.069 48.926 9.336 72.572 8.112 64.176 5.038 45.810
Other 1.563 8.996 1.421 10.475 1.589 10.787 1.665 10.290
Total 18.443 100.459 20.237 144.155 20.930 150.663 14.448 95.528
*Includes all product types, whether live, whole chilled/ frozen, claws chilled/frozen, or meat chilled/frozen/processed.
** Due to rounding there might be small variations between the totals and the sum of data.
Source: EUMOFA elaboration of EUROSTAT, IHS MARKIT, and Statistics Norway
A clear seasonality can be seen in export patterns, with peak periods in the late part of the year, from
September to December. The peaks in exports reflect the seasonality of brown crab catches, with peak
fishing season from April/June to November, depending on fishing area.
Figure 4: Total exports of brown crab* by month and year (tonnes) from major catch nations
4.000
3.500
3.000
2.500
Tonnes
2.000
1.500
1.000
500
0
Jan
Jan
Jul
Sep
Jul
Sep
Jan
Jul
Sep
Jan
Jul
Sep
Mar
Nov
Mar
Nov
Mar
Nov
Mar
Nov
May
May
May
May
2017 2018 2019 2020
*Includes all product types, whether live, whole chilled/ frozen, claws chilled/frozen, or meat chilled/frozen/processed.
Source: EUMOFA elaboration of EUROSTAT, IHS MARKIT, and Statistics Norway
UK
France and Spain have traditionally been the largest export markets for UK brown crab. Exports to China
started to grow in 2016, reaching a peak of 4.187 tonnes in 2018 when they surpassed exports to all
15EUMOFA - European Market Observatory for Fisheries and Aquaculture Products
Brown crab: COVID-19 impact on the supply chain
other destinations. One year later, in 2019, exports to China dropped due to China’s tightening restrictions
on brown crab import41.
The majority (63% in 2020) of British exports are live crab and fresh/chilled crab both with shell and
without. Frozen crab, both whole and not in shell, made up 32% of British exports in 2020.
Following concerns about access to the EU market, of which the UK is no longer a part, many Scottish
exporters diversified into the Chinese market. However, following restricted market access to China, the
Scottish Government has introduced a support package for its crab exporters and measures such as
funding to attend international trade shows and facilitation of meet-the-buyer events in order to create
export opportunities to more countries42. If re-entry to China becomes possible, stakeholders reported
that they believed much of their exports would shift from Europe to China, where prices are higher.
Figure 5: UK exports of brown crab* to main destinations (volume in tonnes)
5.000
4.500
4.000
3.500
3.000
Tonnes
2.500
2.000
1.500
1.000
500
0
2011 2012 2013 2014 2015 2016 2017 2018 2019 2020
France Spain China Portugal Netherlands Other
*Includes all product types, whether live, whole frozen, claws, or meat
Source: EUMOFA elaboration of IHS Markit
Ireland
In 2020, Ireland reported 2.878 tonnes of brown crab exports. Both currently and historically, the majority
of Irish brown crab exports go to France. In 2020, Ireland reported brown crab exports of 1.508 tonnes
to France, representing 52% of the total export volume of this species. However, from the peak of 3.796
tonnes in 2016, this is a decline of 60%. Overall, the total export volume of brown crab from Ireland has
decreased by 60% since the peak of 7.266 tonnes in 2016. During the same time span, the value of
imports has decreased by 10%.
In 2020, 61% of brown crab exports from Ireland were frozen, either whole or processed. 27% of exports
were live or fresh/chilled either whole or meat, and the remaining 12% was crab of other preservation.
41
See chapter 3.3
42
https://www.seafoodsource.com/news/premium/food-safety-health/scottish-live-crab-exporters-feel-the-pinch-of-chinese-
cadmium-crackdown
16EUMOFA - European Market Observatory for Fisheries and Aquaculture Products
Brown crab: COVID-19 impact on the supply chain
Figure 6: Irish exports of brown crab* to main destinations (tonnes)
4.000
3.500
3.000
2.500
Tonnes
2.000
1.500
1.000
500
0
2011 2012 2013 2014 2015 2016 2017 2018 2019 2020
France Spain China Other
*Includes all product types, whether live, whole chilled/ frozen, claws chilled/frozen, or meat chilled/frozen/processed.
Source: EUMOFA elaboration of EUROSTAT
France
Almost all French brown crab exports were destined for European countries in 2020. Italy was the main
destination, accounting for 43% of export volume and 39% of export value in 2020. Spain followed,
receiving 21% of total export volume in 2020, but only 14% of value. On the other hand, exports to
Portugal made up 13% of the export volume, but 15% of the export value. In 2017, French exports of
brown crab to China plummeted as cadmium concentrations were found to be too high43.
The majority (85%) of French brown crab exports in 2020 were live or fresh/chilled whole or meat
followed by frozen crab, whole or meat at 11%, and the remaining 4% made up of other types of
preservation.
Figure 7: French exports of brown crab* to main destinations (tonnes)
700
600
500
400
Tonnes
300
200
100
0
2011 2012 2013 2014 2015 2016 2017 2018 2019 2020
Italy Portugal Spain China Other
*Includes all product types, whether live, whole chilled/ frozen, claws chilled/frozen, or meat chilled/frozen/processed.
Source: EUMOFA elaboration of EUROSTAT
43
See chapter 3.2
17EUMOFA - European Market Observatory for Fisheries and Aquaculture Products
Brown crab: COVID-19 impact on the supply chain
Norway
In 2020, Norway exported a total of 858 tonnes of brown crab. Of this, 26% of the total volume was
destined for Vietnam. According to stakeholders, brown crab exports to Vietnam are destined for
processing before being reimported to Norway, which explains the low value of these exports. 21% of
export volume went to France, covering 29% of total value, and 12% of export volume and value went
to the UK. Industry stakeholders estimated that 60-70% of the brown crab exports from Norway to
European countries goes to the HoReCa sector. Some of the volume going to HoReCa is also destined for
secondary processing before being sold. The remaining export goes to retail or is delivered to hubs
(e.g. the Netherlands) for further exports. Currently, Norway is banned from exporting brown crab to
China, but some crab from Norway is likely to end up in China, for example boiled crab exported through
the UK.
Figure 8: Norwegian exports of brown crab* to main destinations (tonnes)
400
350
300
250
Tonnes
200
150
100
50
0
2015 2016 2017 2018 2019 2020
Vietnam France United Kingdom Other
*Includes all product types, whether live, whole chilled/ frozen, claws chilled/frozen, or meat chilled/frozen/processed.
Source: Statistics Norway
2.5 Consumption
Brown crab is the most consumed crab species in Europe, where it is available as live, fresh, frozen, and
processed products44. Unfortunately, there is no available data for brown crab consumption. To determine
the main importing nations, export statistics for the major catch nations (the UK, Ireland, France, and
Norway) are used.
Looking at destination countries of the exports analysed above, it can be assumed that consumption of
brown crab is highest in France, Spain, Portugal, and China. France and Norway both have high catch
volumes, but exports are relatively low, pointing to high domestic consumption. Within the Norwegian
market, stakeholders estimate that 70% of crab products go to the domestic retail sector. In France, an
estimated 70% of catches are sold by direct contracts to retailers and wholesalers. The wholesalers may
then in turn sell the crab to HoReCa or fishmongers.
In 2020, the main destination for brown crab exports by the major catch nations was France, covering
38% of total export volume and 44% of total export value, followed by Spain and Portugal which received
44
https://www.cbi.eu/market-information/fish-seafood/crab/market-potential
18EUMOFA - European Market Observatory for Fisheries and Aquaculture Products
Brown crab: COVID-19 impact on the supply chain
17% and 10% of the export volume respectively, with values making up 16% and 9% of total value. 9%
of total export volume was destined for China, making up 8% of total export value.
Table 5: Main destinations for brown crab exports* by major catch nations (volume in
tonnes, value in EUR 1.000)
2017 2018 2019 2020
Volume Value Volume Value Volume Value Volume Value
France 5.950 34.548 6.166 47.969 6.236 52.058 5.531 41.663
Spain 3.659 15.555 3.189 19.215 3.320 20.276 2.426 14.824
Portugal 1.956 8.829 1.964 11.552 2.184 12.864 1.433 8.869
China 3.512 23.191 5.558 46.250 4.950 41.797 1.302 7.590
Other 3.367 18.335 3.360 19.169 4.240 23.669 3.756 22.582
Total 18.443 100.459 20.237 144.155 20.930 150.663 14.448 95.528
*Includes all product types, whether live, whole chilled/ frozen, claws chilled/frozen, or meat chilled/frozen/processed.
** Due to rounding there might be small variations between the totals and the sum of data.
Source: EUMOFA elaboration of EUROSTAT, IHS Markit, and Statistics Norway
French consumption of brown crab is seasonal with peak periods throughout June to December, usually
related to special occasions such as holidays, family gatherings, and Christmas45. Consumption habits
vary throughout the country and are more important in coastal areas and in northern France. In Norway,
brown crab is commonly enjoyed socially during the summer and autumn months, especially in costal
areas. No clear seasonality can be observed in the British consumption of brown crab.
Consumer perception of brown crab varies throughout countries. In nations such as Norway, France, and
Spain, crab is viewed as a fresh product and enjoyed socially. Although the brown crab is the most
consumed shellfish in the UK, the total consumption is low compared to other countries. As households
in the UK do not have the knowledge on acquiring, cooking or preparing live and whole crab; most at-
home consumption consists of prepared/preserved crab (e.g. crab meat, dressed crab, crab cakes, soups,
etc). Live crabs in the UK are usually sold to the HoReCa sector which cooks and prepare them for
customers. In France, brown crabs are typically sold live to be prepared at home, although cooked whole
or half crabs and claws are increasing in popularity. In Norway, brown crab can be purchased live from
fishmongers or prepared from retail.
According to stakeholders, during the COVID-19 pandemic consumers have become more aware of the
options available locally/domestically and, both in support of local businesses and to experiment with
diverse ingredients in home cooking, the domestic purchase of crabs increased. Whether this trend will
continue is uncertain. The greatest barrier in the UK for increased brown crab consumption, is the
availability of crab to the consumer. As fishmongers are becoming scarcer and retailers are closing fresh
fish counters, it is becoming difficult for the consumer to be aware of the product and even harder to
find it. Although several producers have begun online sales and provide home delivery, it is still difficult
to do this for live products. As access to the Chinese market for brown crab exports has become difficult
(see chapter 3.3), Dungeness crab (Metacarcinus magister/ Cancer magister) from Canada and mud crab
(Scylla serrata) from South Asian suppliers, including Bangladesh, have become alternative products in
China, although brown crab is still considered a more premium product compared to mud crab46. Chinese
consumers are said to favour female crabs.
45
https://www.seafish.org/document/?id=4B914136-D687-46A1-BD0D-A0BC1EA3E19E
46
https://www.seafoodsource.com/news/premium/food-safety-health/enhanced-food-safety-inspections-bite-into-market-for-
chinese-demand-for-irish-uk-sourced-brown-crab
19EUMOFA - European Market Observatory for Fisheries and Aquaculture Products
Brown crab: COVID-19 impact on the supply chain
3 MARKET CHANGES
3.1 COVID-19
COVID-19 is the name given to the infectious disease caused by the most recently discovered coronavirus
(SARS-CoV-2), unknown before its outbreak in Wuhan, China, in December 201947. During the first
months of 2020, the disease spread around the world, and it was classified as a pandemic by the World
Health Organization (WHO) on 11th March 2020.
In March and April 2020, the number of new COVID-19 infections rose in Europe, and lockdowns were
implemented with restrictions on travel, closing of restaurants, cafés, offices, and schools. The number
of infections in Europe declined between May and the beginning of July 2020 but began to rise again in
mid-July. Since then, the number of COVID-19 infections have risen and fallen and restrictions have been
adjusted accordingly. Near the end of 2020, vaccines against COVID-19 were ready for clinical trials,
and national vaccination programs began to be implemented.
The impact of COVID-19 was felt by all brown crab stakeholders, but the effect differed depending on
the business model. Industry stakeholders reported that the price dropped between 20%-40%.
Live and fresh crab to Asia is normally transported as belly freight48 , but as passenger planes were
grounded, the price of transport increased up to sixfold. Some exporters switched to transport by cargo
planes and did not experience major disruptions in their deliveries.
In several countries, processors began offering products online and home delivery services to directly
reach consumers. Stakeholders in the UK reported an increase in domestic sales during the pandemic
period as customers cooked more at home and became more interested in locally produced species. In
addition, several national communication campaigns promoted the purchase of domestic products,
including shellfish. Stakeholders have yet to determine whether increased domestic consumption will
continue as restrictions are lifted.
In the UK, restaurants were closed for most of 2020 and the initial months of 2021, and both sales of
live crab and processed crab suffered as demand from HoReCa disappeared. Many crabs destined for
the live market were processed and set in storage, although some were still exported to Europe as prices
remained stable.
3.1.1 Landings
Landing data on brown crab for 2020 are only available for the UK and Norway.
In the UK, many fishers refrained from fishing crab as prices were too low to cover costs. In addition,
weather conditions caused a poor fishing season. UK landings of brown crab49 were down by 20% in
2020, compared to 2019. During the fishing season from June to November, landings were down by
between 4% and 28% compared to the year before.
Overall in 2020, Norwegian landings of brown crab were down by 12%. During the main fishing season
(June to November), landings were on average lower than in previous years, with the exception of
September, where in 2020 landings were 1% higher than in 2019. November had the largest discrepancy,
with a 51% lower catch in 2020 than the previous year.
47
https://www.who.int/emergencies/diseases/novel-coronavirus-2019
48
Transportation of goods via passenger aircraft in the lower deck of the aircraft, the “belly” of the plane.
49
Data for UK brown crab landings may include some other crab species.
20You can also read