Towards better alcohol health information - 4.5 1.5 ABV - RSPH
←
→
Page content transcription
If your browser does not render page correctly, please read the page content below
Towards better alcohol health information

                                      4.5
                                      ABV
                  www.rsph.org.uk
                                      1.5
                                     UNITS
                                           /14
                                     110
                                      Kcal

           33cl                     Per bottle
Foreword

   In 2014, the Royal Society for Public Health (RSPH) published its first policy paper
   calling for the inclusion of calorie information on the labels of all alcoholic drinks.
   Unlike the majority of food and drink products, alcohol was and remains exempt from
   EU regulations requiring the provision of such nutritional information on the label.
   It appeared to us that the proposed removal of this exception provided an obvious
   opportunity to help kill two birds with one stone: to raise awareness of the under-
   appreciated contribution made by the ‘invisible calories’ in alcohol to Europe’s
   obesity epidemic, and at the same time utilise this lever in an attempt to encourage
   people to moderate their alcohol consumption and thereby lessen the strain of
   alcohol harm on the public’s health.                                                      Shirley Cramer CBE
                                                                                             Chief Executive, Royal
   Fast forward to March 2017, and the European Commission finally published its
                                                                                             Society for Public Health
   long-awaited report on the addition of nutritional information to alcohol labelling.
   The report made no legislative proposals; instead, it gave industry one year to
   present a self-regulatory solution, to be assessed by the Commission, who will then
   judge whether EU-wide regulation is necessary.
   It is against this backdrop, and against that of the UK’s preparations to leave the
   EU, that the following report is presented. In this arena at least, Brexit may present
   an opportunity – an opportunity to be an exemplar in the implementation of better
   alcohol labelling to inform and empower consumers to manage and moderate their
   alcohol consumption for the benefit of their health.
   This is why RSPH and the Portman Group agreed to collaborate on the specific
   issue of labelling – to produce research that could shape what best-practice
   alcohol labelling might look like in the future, and put forward recommendations
   that have the backing of the industry that would be asked to implement them.
   In the event, even in the limited arena of labelling, it proved too difficult to reach
   a consensus position between the agenda of public health and that of industry.
   And so, this final report and its recommendations are presented from RSPH,
   with reference to the initial research report commissioned from our independent
   research consultancy, BritainThinks.
   This report ranges far beyond RSPH’s initial interest in calorie information, and
   considers a number of other forms of health information that could be provided,
   and how this can be done in the most user-friendly format to optimise the benefit
   to the public’s health.
   We have made great strides in the improvement of food and tobacco labelling. It is
   time for alcohol to catch up.

   Shirley Cramer CBE
   Chief Executive, Royal Society for Public Health

Labelling the Point: towards better alcohol health information                                                           3
Contents

    1   Executive summary

    2   Background

    3   What works to moderate alcohol consumption and reduce alcohol harm?

    4   What’s on the label now (and what effect does it have)?

    5   What else could be on the label (and what effect could it have)?

    6   What do the public think?

        6.1   Knowledge and use of current alcohol labels

        6.2   Priorities and demand for health information

        6.3   Presentation (location and format) of health information

        6.4   The potential impact of calorie information

    7   Discussion and conclusions

    8   Recommendations for best practice alcohol labelling

4                                                       Labelling the Point: towards better alcohol health information
1. Executive Summary
1. Alcohol is the third biggest lifestyle risk factor for cancer to alcohol consumption, and 80% don’t
preventable disease in the UK (after smoking and know how many calories are in a glass of wine.
obesity), responsible for 10% of our total burden of The UK is facing an alcohol health awareness
disease and death. Although related deaths have vacuum, and poor labelling is partially to blame.
remained relatively stable in recent years, they
5. This report assesses the potential of better
are still significantly higher than they were two
labelling of off-trade (i.e. retail) alcohol to
decades ago: 14.8 deaths reported per 100,000
help raise awareness and moderate alcohol
population in 2016 compared to nine in 1994.
consumption and harm. This includes both
Meanwhile, more than 10 million people in the UK
better presentation of existing elements, and the
are drinking alcohol at levels that could be harmful
addition of new ones such as calorie content and
to their health, a problem that costs the NHS alone
explicit health warnings. This is done using pre-
around £3.5 billion every year.
existing literature, qualitative focus groups, and a
2. The most effective policy measures to reduce quantitative survey of 1,783 UK adults who drink
alcohol-related harm are those designed to reduce alcohol, which included a basic experiment to test
the affordability of alcohol. Targeted approaches the behavioural impact of calorie information. It
such as minimum unit pricing (MUP) in particular identified the following key messages:
reduce consumption among the most at-risk
a) Awareness and use of current health
drinkers by ensuring cost increases are passed on
information on alcohol labels is low. ABV is
to consumers.
the primary driver of purchasing and drinking
3. Although the potential contribution of alcohol decisions, with alcohol units insufficiently
labelling is modest in comparison, it provides understood to facilitate their practical use
an obvious opportunity to help reduce harm by – they are effectively useless without clear
influencing social norms around consumption linkage to CMO guidelines. Other health
– if harnessed correctly. Existing evidence for information elements, such as pregnancy
its efficacy is limited, but this may be because warnings, are rarely noticed. This is a result
previous initiatives have been hampered by poor of poor positioning, small size, and ineffective
implementation. use of colour and font.
4. The only health-related information currently b) Presenting health information on the front
mandated on alcohol labels by EU regulation of labels is critical to maximising exposure,
is alcohol by volume (ABV). Other information so elements with the greatest potential to
currently appearing on some labels in the UK influence behaviour must be identified and
– such as alcohol content in units, pregnancy presented here. However, presenting too
warnings, and the Government’s low risk drinking much information leads to counterproductive
guidelines – are provided voluntarily by industry. information overload, so we must prioritise.
However, industry has failed to update labels
in line with the new 14-unit low-risk guidelines
introduced in January 2016, leaving public
awareness of these guidelines at a stubbornly low
16%. Alongside this, only one in 10 people link
Labelling the Point: towards better alcohol health information 5c) The addition of calorie information to the On the basis of the above key messages, RSPH
front label of alcohol containers could lead recommends the following health information
to a modest but worthwhile in-category shift elements to be included on all alcohol products. These
towards lower calorie (and therefore typically elements have been selected on the basis of three
lower alcohol) products, across all drink criteria: public demand (especially key demographics),
types and socio-economic grades, with an need for improved awareness, and demonstrable
especially pronounced effect among young potential to positively influence behaviour. These
and female drinkers. The average predicted elements should be presented in font no smaller
swing from high to low ABV drinks is 9.5% (preferably bigger) than the main body text of the
(20% for young drinkers). label, with pictographic information in bright and
d) Explicit health warning elements, including clearly contrasting colours. A mock-up of how this
drink drive and pregnancy logos, and those labelling scheme could appear in practice is provided
warning of specific health conditions such as on page 27.
cancer, are particularly prioritised by young
drinkers and more deprived socio-economic ON THE FRONT LABEL:
groups. In order to address harm within • Alcohol by volume (ABV)
these priority groups and create labelling • Alcohol units (as a proportion of CMO’s weekly
schemes that do not exacerbate health guideline limit)
inequalities, RSPH considers that we should • Calorie content
be responsive to this demand. • Drink drive warning
e) Providing references to online information • Pregnancy warning
on labels has been demonstrated to be
an ineffective measure with little popular ON THE BACK LABEL:
demand, which is likely to engage only a • CMO’s low-risk drinking guidelines
small minority of consumers. (including warning of link to health conditions
f) Unit and calorie information will be most including cancer)
effective if presented in a way that reflects
how people drink in reality – preferably per
container, or per serving if the serving size is
made clear.
6 Labelling the Point: towards better alcohol health information2. Background
Alcohol is the third biggest lifestyle risk factor for This harm is distributed unevenly across demographic
preventable disease in the UK (after smoking and groups, reflecting socio-economic inequalities –
obesity), responsible for 10% of our total burden of alcohol-related mortality is 3.5 times higher for men
disease and death1. According to Office for National in the most disadvantaged socio-economic group than
Statistics (ONS) figures, there were 9,214 alcohol- for men in the least disadvantaged group, and at 5.7
related deaths in the UK in 2016 – a rate of 14.8 times is even higher for women6. These differences
deaths per 100,000 population2. across social groups are not correlated with alcohol
This rate has remained relatively stable in recent intake and have yet to be fully explained, which is why
years, but is still significantly higher than it was two they are described as ‘the alcohol harm paradox’.
decades ago, having gradually risen from nine deaths It is estimated that more than 10 million people in the
per 100,000 population in 19943. UK are drinking alcohol at levels that could be harmful
The ONS figures, which allow comparison across to their health7. This is not only a problem for them
the UK, are based primarily on chronic conditions personally, but creates a significant tab to be picked
associated with long-term alcohol abuse. However, up by the rest of society – alcohol harm costs the NHS
they do not include external causes of death related to alone around £3.5 billion per year8.
alcohol use, such as road traffic collisions. Nor do they With this in mind, we all – government, civil society
include deaths from diseases partially attributable to and industry alike – have a responsibility to work
alcohol, such as cancers of the mouth, oesophagus, together to lessen the burden of alcohol misuse.
liver, bowel and breast4. A definition that does include Alcohol product labelling – in so far as it has the
such factors, as used by Public Health England (PHE), potential to better inform consumers about the
suggests that there were 23,500 alcohol-related consequences for their health and nudge them
deaths in 2015 in England alone5. towards moderating their alcohol intake – presents
one obvious opportunity to do so.
Labelling the Point: towards better alcohol health information 73. What works to moderate alcohol
consumption and reduce alcohol harm?
Alcohol-related harm is strongly related to the Policies to reduce the ease of purchase of alcohol,
volume of alcohol consumed, although other factors such as reducing the hours in which it is available for
including frequency of drinking and a range of sale, have been found to substantially reduce harm in
social and environmental influences also intersect the night-time economy, as long as they are properly
to amplify or mitigate harm – notably the ‘alcohol enforced. Studies have consistently shown that
harm paradox’ whereby people in more deprived increasing opening by two or more hours increases
socio-economic groups suffer greater harm despite alcohol-related harm, especially through road
lower consumption. However, population-level alcohol crashes, accidental injury and violence14. Conversely,
consumption can be used as a general proxy for initiatives in Australia to restrict opening hours have
population-level alcohol harm, and measures aimed at demonstrated a significant reduction in alcohol-
reducing alcohol harm typically relate to one of three related violence15.
key influencers of alcohol consumption9: Social norms around the consumption of alcohol can
• Price (affordability); in part be shaped by policies on marketing, and there
• Ease of purchase (availability); is some evidence to suggest restrictions in this area
• Social norms around consumption may reduce consumption and harm. Longitudinal
(acceptability). and cohort studies of children and young people
have consistently demonstrated that exposure to
Policies designed to reduce the affordability of
alcohol marketing increases the chance they will start
alcohol, such as price regulation or increased
drinking and the quantities they consume when they
taxation, have been found to be the most effective
do16. Countries with stricter advertising restrictions
at reducing alcohol harm. It has been estimated that
have both lower alcohol use among adolescents17,
a 10% increase in price equates to a 5% reduction
and lower levels of hazardous drinking among older
in consumption, which in the UK could lead to 1,300
adults – 31% of those aged 50 to 64 drink at such
fewer alcohol-related deaths and 61,000 fewer
levels in countries with no restrictions, compared to
alcohol-related hospital admissions in the 20th year
only 14% in countries with the greatest restrictions18.
following implementation10.
However, there is not yet sufficient evidence to
In particular, targeted approaches such as minimum
establish the most effective form for such regulation.
unit pricing (MUP) ensure cost increases are passed
Modelling studies have suggested complete or partial
on to the consumer and reduce consumption amongst
marketing bans would be highly effective – for
the heaviest and most at-risk drinkers, who have
instance, a US study estimated a complete advertising
been shown to be more price-sensitive than moderate
ban would reduce alcohol-related years of life lost
drinkers. For instance, in the Canadian province of
by more than 16%19. Regulation in the UK has so far
Saskatchewan, a 10% increase in minimum prices
primarily taken the form of voluntary industry codes
reduced consumption by 8.4%11, while in British
of practice, which have limited effectiveness and have
Columbia, a 10% increase in minimum price was
been nullified by regular violations20.
associated with a 32% reduction in wholly alcohol-
related deaths within nine months12. England-specific
modelling predicts more than 400 fewer hospital
admissions per 100,000 population among high risk
drinkers in the 20th year following implementation13.
8 Labelling the Point: towards better alcohol health information4. What’s on the label now
(and what effect does it have)?
Alcohol labelling is an ever-present part of the industry signatories pledged would appear on at least
environment in which alcohol is purchased and 80% of alcohol products by 2013. This included three
consumed, at least in the off-trade. It therefore required elements23:
provides an obvious opportunity to influence the social • Alcohol content in units.
norms around the consumption of alcohol, provided it • The Government’s recommended low risk
is harnessed in the right way. drinking guidelines.
At present, legal regulation regarding alcohol labelling • A pregnancy warning, either in the form of
in the UK is primarily an EU competency, although a circular logo with an image of a pregnant
this situation is likely to change in the coming years woman, or the statement ‘avoid alcohol if
depending on the exact shape of the UK’s exit from pregnant or trying to conceive’.
the EU and the form of its new relationship with
And two further optional elements:
the European Single Market. Current EU regulation
• The Drinkaware website address.
mandates a set of information on alcohol labels that is
limited in terms of its relation to health21: • One of the following three responsibility
messages:
• Name under which the product is sold (brand
- ‘Know your limits’.
names must only be used in addition to the generic
- ‘Enjoy responsibly’.
name of the type of alcohol, not instead of).
- ‘Drink responsibly’.
• Net quantity in metric units (e.g. millilitres,
centilitres, litres). According to an industry-commissioned audit in
2014, 79% of alcohol products in the off-trade bore
• Alcohol by volume (ABV) (provided this is
the three required elements, falling to 70% when
over 1.2%).
the products are weighted by market share24. An
• Best before date.
independent academic study corroborated these
• Instructions for use, where appropriate.
findings, reporting 78% compliance in an unweighted
• Any special conditions for keeping or use. sample25.
• Name and address of the manufacturer,
However, the mere presence of the required elements
packager or importer in the EU.
is not the whole story. Only 57% of these labels met
• Place of origin. the Portman Group’s best practice guidance on how
• Lot marking, with the marking preceded by the these elements should be presented. This guidance
letter L. states that the health information should be in “a
While a number of EU member states have already font size no smaller than the main body of the label”,
introduced their own legal requirements for additional and yet 60% of products used a smaller font – the
health information on labels – such as a compulsory average of 8.2 points is well below the 10 or 11
pregnancy warning in France22 – the UK Government point size that is optimum for legibility. In most cases
has to date not opted to go down this route. Any (79%), the pregnancy warning appears on the back
additional information currently provided on alcohol label, and significantly smaller on wine bottles than
labels in the UK is provided voluntarily by industry. The on beer, even though the former is more likely to be
Portman Group’s previous best practice guidelines – consumed by women26.
as enshrined in the 2011 Public Health Responsibility
Deal with the UK Government – recommended a
standard set of health-related information which
Labelling the Point: towards better alcohol health information 9Regrettably, this situation now risks becoming Studies in France (where pregnancy warnings are
significantly worse, due to new labelling guidance mandatory) have suggested that this element at least
published by the Portman Group in September 2017 has contributed to heightened public awareness of the
which removed the Government’s recommended dangers of drinking alcohol while pregnant, and has
low-risk alcohol guidelines as a required element27. helped move the social norm towards not drinking at
This may be seen as an uncooperative reaction to all at this time – although this effect may be due as
the revising down of these guidelines, in January much to the publicity that surrounded the introduction
2016, to no more than 14 units per week for both of the measure as to the physical presence of the
men and women. Even before the Portman Group’s warnings themselves31. Similarly, studies in the US
new guidance was issued, a review by the Alcohol have found that recall of these warnings among
Health Alliance (AHA) earlier in 2017 found only one pregnant women is high32, and that women in their
label in 315 assessed carried the updated low risk first pregnancy were most likely to heed the warnings
guidelines28. Little wonder, then, that only 16% of and reduce their drinking accordingly33.
people in the UK are currently aware of the 14 unit Unit information, while well recognised by consumers,
guideline, two years after its introduction29. may be being used by some, especially young
Public Health England (PHE)’s recent evidence drinkers for the opposite of its intended purpose –
review stated that there is little evidence to suggest that is, to find the cheapest products containing the
that current alcohol labelling makes a significant greatest amount of alcohol34.
contribution to reducing alcohol harm. Despite this, Using labels to direct consumers to further health
PHE regards labelling as an important component information online – such as that on the Drinkaware
in any overall policy approach, as it fulfils the website – is widely thought to be of limited utility
consumer’s right to be properly informed about what compared to presenting information on the label itself,
they are drinking, and can increase public support for due to the conscious and proactive decision needed
other, more directly effective policy measures30. by each individual to access this information. An
Australian survey found that only 7% of respondents
followed the address on the label to their national
equivalent of the Drinkaware site35.
10 Labelling the Point: towards better alcohol health information5. What else could be on the label (and what
effect could it have)?
PHE’s evidence review suggests that the lack of At least a quarter of respondents in all four countries
existing evidence for the effectiveness of alcohol in the International Tobacco Control evaluation (the
labels in changing drinking behaviour may, in part, be UK, USA, Canada and Australia) reported that these
down to poor implementation such labels to date36. In warnings had made them more likely to quit39.
order to suggest how effectiveness may be improved, Such warnings are also thought to have indirectly
we may consider: influenced behaviour change by stimulating peer
• How existing labelling elements be better pressure from non-smokers40. Translating this to the
presented. alcohol context, a Cancer Research UK survey in 2015
• What other labelling elements could be found about 50% of people would find labels warning
added (informed in part by initiatives in other of the link between alcohol and cancer believable and
countries, and in different contexts such as food acceptable41. This could go some way to addressing
and tobacco labelling). a severe lack of awareness around this issue, with
only one in 10 people linking cancer to alcohol
In terms of the presentation of existing elements,
consumption42.
it has already been shown that there is room
for improvement in the placement and legibility There is also some evidence to suggest drink drive
of health information to at least meet industry warnings may be effective, with research indicating
minimum standards. A pan-European study that drinkers who have previously driven while under
has demonstrated strong consumer preference the influence of alcohol are significantly more likely
for pictograms alongside (46%) or instead of to deliberately avoid doing so after seeing these
(47%) written information alone (7%)37, while labels . US studies have suggested they may also help
an assessment of the use of pregnancy warning provoke a protective peer pressure effect from other
pictograms in France has highlighted poor adult consumers44.
placement and lack of colour contrast as constraints While there is currently limited direct evidence
on their effectiveness38. for the potential impact of calorie labelling on
Other labelling elements that have been suggested or drinking behaviour, the high level of awareness
trialled include: and understanding of calories among the UK public
makes this a worthwhile avenue for exploration. An
• List of ingredients.
RSPH survey in 2014 found that 80% of UK adults do
• Allergen information. not know or underestimate the number of calories
• Calorie content. in a large glass of wine, while more than 60% do
• O
ther nutritional information (e.g. sugar, fat, salt not know or underestimate the calories in a pint of
content, potentially in a format similar to the lager45. This represents a sizeable awareness gap
‘traffic light’ system on most food labels in the UK). which, if filled, may provide a moderating impact
• Health warnings (beyond those aimed on alcohol consumption – which accounts for an
specifically at pregnant women, and potentially average of 8.4% of the calorie intake of people who
with a pictorial element and/or related to drink46 – especially among more calorie-conscious
specific health conditions e.g. cancer). demographics such as women and more advantaged
socio-economic groups, who, research suggests,
• Drink drive warning.
are already susceptible to this approach on food
• Legal purchase age warning. packaging47. The same RSPH survey found more than
Experience from tobacco labelling strongly suggests two thirds (67%) of UK adults support the addition of
that explicit health warning labels, particularly calorie information to alcohol labels48.
pictorial labels, can be effective not only in raising
awareness but also in influencing behaviour change.
Labelling the Point: towards better alcohol health information 116. What do the public think?
In light of the patchy and inconsistent nature of the Insights from the focus groups were then used to
existing evidence on the potential of alcohol labelling shape the design of a quantitative survey, using a
to positively influence drinking behaviour, RSPH and representative UK-wide sample of 1,783 adults who
the Portman Group agreed to jointly commission drink alcohol (from an initial polling size of 2,107 –
a research project to help build a more complete non-drinkers were screened out at the first question).
picture. This included the following objectives: Roughly half the survey respondents were classified
• T o establish if and how current alcohol labelling as ‘lower risk’ drinkers and half as ‘increasing or
affects consumer behaviour. higher risk’ – although few statistically significant
differences were identified between their responses.
• T o investigate what other forms of information
The survey was carried out online in February 2017
could better influence behaviour.
by Populus Data Solutions on behalf of RSPH and the
• T o establish where and how information should
Portman Group.
be presented for optimal impact.
The full results of this research will be published
• T o explore how these effects vary across
independently by BritainThinks. They are re-presented
alcohol types and demographics.
below in line with RSPH’s interpretation of their utility.
The independent research organisation BritainThinks
was commissioned to conduct exploratory qualitative
“ I can’t even read this with my reading
glasses it’s so small!
research with the public exploring these themes. This
initial research took the form of four focus groups of
six people each, conducted in September 2016. These
”
Focus group participant (male, London)
were split demographically as follows:
• G
roup 1: London, male, age 25-50, social
grades A/B/C1, including two BAME.
• G
roup 2: London, female, age 25-50, social
grades C2/D, including two BAME.
• G
roup 3: Manchester, male, age 25-50, social
grades C2/D, including two BAME.
• G
roup 4: Manchester, female, age 25-50, social
grades A/B/C1, including two BAME.
All focus group participants consumed alcohol at
least once a month, while those whose attitudinal
responses indicated possible alcohol dependency
were screened out.
12 Labelling the Point: towards better alcohol health information6.1 Knowledge and use of current These insights were borne out by the survey, in
alcohol labels which respondents were asked what forms of
The focus groups suggested that awareness and information they think are currently found on a
use of current health information on alcohol labels normal alcohol container (free text responses were
is low, with participants struggling to spontaneously coded to a comprehensive list, including both health
identify what information is currently provided. and product/brand information). The top responses
were (for full breakdown see fig. 1):
“ I drink pints, so I never think in units,
I just think in pints.
1. ABV (75%)
”
2. Alcohol units (29%)
Focus group participant (male, Manchester)
3. Place of origin (27%)
4. Ingredients (26%)
Most participants did have some awareness of ABV, 5. Container size (25%)
which was seen as easy to understand, and this is This puts ABV, cited by three quarters of respondents,
the labelling element participants were most likely to far ahead of any other information in terms of current
report using to inform their purchasing and drinking consumer awareness. While a significant minority
decisions – be it to ensure they were not inadvertently (29%) also mentioned alcohol units, only a very small
drinking alcohol stronger than they expected, or, in fraction of respondents mentioned other forms of
a minority of cases, to guard against being “tricked” health information, such as the ‘drink responsibly’
into buying drinks of lower than expected strength. message (7%) and pregnancy warnings (4%).
However, while there was some awareness of the
“
presence of alcohol unit information, this was not
(I use ABV for) the opposite! If there are
generally well enough understood to facilitate its
new beers out and stuff you don’t want to
practical use. There was confusion regarding the
”
be tricked by 2.2%.
connection between units and individual alcohol
tolerance and over what a unit equated to in practice, Focus group participant (female, Manchester)
combined with a lack of knowledge of low risk
guidelines. It is notable that awareness of alcohol unit information
seems to increase significantly among younger
Participants were generally unaware of the CMO
drinkers, with 42% of 18-24 year olds and 37% of
unit guidelines typically provided on the back label
25-34 olds mentioning this, compared with only 24%
and how they could use this to contextualise the unit
of 55-64 year olds and 16% of those aged 65 or over.
information often provided on the front. When this
Awareness of other health information is heightened
information was pointed out, it was felt that it would
among younger drinkers too: 14% of 18-24 year olds
carry more weight if presented as from a medical
cited pregnancy warnings compared with 0% of those
professional or organisation with global credibility,
aged 55 or over.
rather than the UK Government.
“ No-one cares what the government
”
thinks, but they might listen to a doctor.
Focus group participant (male, Manchester)
Labelling the Point: towards better alcohol health information 13FIG. 1: Information believed to be on current alcohol containers.
0% 10% 20% 30% 40% 50% 60% 70% 80%
ABV
Alcohol units
Place of origin
Ingredients
Container size
Brand name/logo
Product description
Manufacturer
CMO guidelines
Calorie content
‘Drink responsibly’
message
Flavour/taste
Health warnings
(eg. cancer risk)
Pregnancy warning
Respondents were also asked when and where they look for information about the alcohol they are
purchasing. A full breakdown of responses is shown in fig. 2.
The majority (84%) look at the front label, and this is mostly done in the shop before purchase (70%). However,
three quarters (74%) also look at the back label, and for more than half (53%) this is before purchase. Only
35% of consumers ever look online, and this takes place before the purchasing decision for less than a quarter
(23%).
14 Labelling the Point: towards better alcohol health informationFIG. 2: Looking for alcohol information: time and place.
90%
80%
70%
60%
50%
40%
30%
20%
10%
0
The front label The back label Online
Total (any time) Before drinking the alcohol
In the shop before purchasing the alcohol After drinking the alcohol
Respondents were then asked what forms of information they look for in these locations and at these times
(free text responses were coded to a comprehensive list, including both health and product/brand information).
The top responses for those looking before purchase were:
1. ABV (58%)
2. Brand (19%)
3. Product description (18%)
4. Place of origin (15%)
5. Flavour/taste (11%)
Only a small minority (22%) of respondents look for information after the purchase but before consumption.
However, it is notable that alcohol unit information doubles in importance at this time, from 5% before purchase
to 11% before consumption. This shift is predominantly accounted for by younger drinkers, with one in five
18-24 year olds (20%) checking unit information at this time.
Labelling the Point: towards better alcohol health information 156.2
Priorities and demand for Although calorie content was not spontaneously
health information mentioned, it came to be regarded as increasingly
Focus group participants identified three clear important the more it was discussed – most
priorities for health information on alcohol labels, participants understood calories but were unaware of
which should be displayed in an eye-catching manner the calorie content of alcoholic drinks and thought this
on the front of the container to ensure quick and easy information would be useful, particularly for women
use in the purchasing environment: and those watching their weight. Additionally, an initial
1. ABV hostile reaction from some women to the potential
2. Alcohol units (as long as clearly contextualised ‘guilt’ factor suggests calorie information may indeed
by CMO guidelines – unit information was impact the drinking behaviour of such women.
judged to be incomprehensible and unusable
without these) 4.5 5 5.5 6 6.5 7 7.5 8 8.5
3. Calorie content
Alcohol volume
FIG. 3: Alcohol units
Alcohol label information
Brand name/logo
priorities, including 18-24
and D/E group detail. Best before date
Overall
Drink drive warning
18-24
Ingredients
D/E group
Place of origin
Pregnancy warning
Manufacturing information
Health warnings
(e.g. cancer risk)
Drink ‘responsibly’ message
Nutritional information
(e.g. fat/salt/sugar)
Traffic light-style labelling
Legal age warning
Calories content
CMO guidelines
Reference to online
health information
16 Labelling the Point: towards better alcohol health informationThe top two are confirmed by the survey, in which website or similar. This confirms insight from the
respondents were asked to score different forms focus groups, where it was felt such references were
of information on a scale of zero to 10 according unlikely to be effective. Most participants stated they
to how important it is that they appear on alcohol would not use them, with the active engagement
labels (non-health related information was included necessary deemed unlikely in a typical purchasing
to assess where health sits within overall information environment, as well as being less useful than being
priorities). The mean scores are shown in fig. 5 (health able to physically compare information on products
information highlighted). label-to-label.
Unlike the focus groups, here calorie content scores
relatively low at 5.36 – although it was rated as more
important by women (5.80) and those aged 35-44
“ If I were drinking a bottle of wine with
friends, I’m not going to get my phone and
say what’s that (the QR code). So I’d be
(5.84). Unlike in an extended discussion, survey
none the wiser, but if it’s on the bottle it
respondents are unlikely to have fully considered its
”
would make me aware.
potential efficacy.
Focus group participant (female, London)
Pregnancy warnings enjoyed higher prioritisation
among women (6.24), young drinkers (18-24: 6.80) Respondents were also asked how they felt about
and more deprived socio-economics groups (D/E: the current balance between health information and
6.28). Focus group participants has flagged these product/brand information on alcohol labels. The
as more important than age or drink drive warnings, majority (70%) felt the current balance is about right.
citing confusion over whether pregnant women can However, slightly more respondents (18%) felt there
drink a little or not at all. is too little health information compared to product/
Higher prioritisation was seen among the above three brand information than felt the opposite (12%).
“
groups across most forms of health information,
It’s designed to blend in. I don’t think
including drink drive warnings (women: 6.74, 18-24:
people like to be reminded how much they
6.98, D/E: 7.10), and health warnings for conditions are drinking.
such as heart disease, liver disease and cancer
(women: 5.83, 18-24: 6.11, D/E 6.02). Such health ”
Focus group participant (male, Manchester)
warning labels, similar to those provided on cigarette
6.3 Presentation (location and format) of
packaging, were spontaneously raised by participants
health information
in the Manchester group, who felt this would be an
effective way of encouraging people to moderate their During the focus groups, it was almost universally
drinking. In contrast, participants in the London group felt that current health information presentation
spontaneously suggested that “traffic light” labels is insufficiently attention-grabbing, with small font
similar to those on food would be an efficient and sizes and poor colour contrast making information
well-understood way of communicating alcohol by hard to read. Participants felt that consumers are
volume and calorie content. unlikely to look at the back of the container, and so
information presented there is unlikely to be noticed
The only suggested labelling element to receive a
by more than a small minority. Together, these
sub-5 prioritisation score (4.81) was references to
factors fuelled a perception among some participants
online health information, for instance a QR (Quick
that manufacturers are attempting to hide health
Response code) or URL linking to the Drinkaware
information from consumers.
Labelling the Point: towards better alcohol health information 17“ The minute you put the information on A majority of respondents said the following
the front, you start judging on whether it’s information should be on the front label:
a healthy or unhealthy product. 1. ABV (68%)
”
Focus group participant (female, London)
2. Alcohol units (51%)
3. Drink drive warning (41%)
A majority of respondents said the following
Subsequently, survey respondents were asked
information should be on the back label:
about where they thought different forms of health
information should be provided. For all forms of 1. Calorie content (70%)
information, respondents expressed a strong majority 2. CMO guidelines (59%)
preference for this to be on the label, rather than 3. Health warnings (e.g. cancer risk) (55%)
online, on the shelf or not at all. The only caveat to 4. Pregnancy warning (47%)
this is for legal age warnings, which a significant 5. Traffic light-style labelling (44%)
minority (20%) suggested should be on the shelf. A 6. ‘Drink responsibly’ message (42%)
full breakdown is shown in fig. 4.
7. Legal age warning (36%)
FIG. 4: Preferred location of alcohol health information.
0% 20% 40% 60% 80% 100%
Alcohol volume Front label
Back label
Alcohol units
Online
Drink drive warning Shop shelf
Not provided
Drink ‘responsibly’ message
Traffic light-style labelling
Legal age warning
Pregnancy warning
Health warnings
(e.g. cancer risk)
Calorie content
CMO guidelines
18 Labelling the Point: towards better alcohol health informationSince focus group participants also expressed a 6.4 The potential impact of calorie
desire that labels should not be overfilled, and that information
the provision of additional health information should The survey included a basic experiment designed
not come at the expense of branding, respondents to assess the potential impact of adding calorie
were then asked which they would find most helpful: information to the front label of alcohol containers on
a select amount of health information displayed in purchasing behaviour.
a large and clear format, or much information as
In this experiment, respondents were presented with
possible, even if this reduced visibility. Respondents
three successive images of a shop shelf containing
expressed a clear preference by 80% to 20% for the
three alcohol containers (all either beer, wine or
former. Too much information presented in a cluttered
spirits, depending on the respondents’ preference
fashion could lead to ‘information overload’ and none
expressed at the start of the survey), and asked to
of this information being communicated effectively.
imagine they were choosing which one of each set of
Finally, respondents were also asked what format three to purchase.
they would find most usable for calorie and alcohol
• On the first image, only ABV was provided on
unit information. ‘Per container’ was deemed the
the containers.
most helpful in both instances (46% for calories, 48%
• On the second image, only calorie content was
for units), followed by per serving (39% for both) (see
provided on the containers.
fig. 5). This partially reflects the focus groups, where it
was asserted that information should be presented in • On the third image, both ABV and calorie
a format that is relatable to people’s real life drinking content were provided.
behaviours – preferably ‘per container’, rather than
variable serving sizes or ‘per 100ml’.
FIG. 5: Alcohol unit and calorie content format preferences.
Per Container
Alcohol units Per serving
Per 100ml
Calorie content
0% 20% 40% 60% 80% 100%
Labelling the Point: towards better alcohol health information 19In each set, the ABV and/or calorie content varied by container – one with a low-range value, one with a mid-
range value, and one with a high-range value. When presented together, ABV and calorie content co-varied – as
a general rule, this is the case with most alcohol products (although the addition of flavourings and mixers
complicates the relationship for some drinks). All other details of the containers were the same, to ensure the
tested variables were the only basis for choice. An example of one of the images used is shown in fig. 6.
FIG. 6: Wine Abv and calorie shelf image used in survey.
Note: in this exercise all other variables (e.g. price, brand, taste) were controlled, in order to present
respondents with an ‘all other things being equal’ choice. As such the results do not necessarily reflect the
extent of behaviour change in a real world purchasing environment, and should be taken as an indicative
hypothesis for more in depth research.
For the respondents who saw beer containers, the This shift was particularly pronounced for women –
combination of calorie information with ABV led to a among whom the high-range choice fell from 20%
significant shift in hypothetical purchase choice from to 12%, and the low-range choice rose from 27% to
the high-range bottle (which fell from 21% to 15%) to 41% – and younger drinkers (aged 18-24) – among
the low-range bottle (which rose from 23% to 30%) whom the high-range choice fell from 27% to 10%,
when compared with the provision of ABV alone. and the low-range choice rose from 50% to 66%.
A full breakdown is shown in fig. 7.
20 Labelling the Point: towards better alcohol health informationFIG. 7: B
eer purchase choice by information provision.
0% 10% 20% 30% 40% 50% 60% 70% 80% 90% 100%
ABV
KCal
Both
High-range Mid-range Low-range
For the respondents who saw spirit containers, the This shift was again particularly strong among women
combination of calorie information with ABV led to and younger drinkers. High-range fell from 43% to
a similar shift in hypothetical purchase choice from 23% among women and from 65% to 38% among
the high-range bottle (which fell from 52% to 34%) 18-24 year olds, and low-range rose from 36% to
to the low-range bottle (which rose from 28% to 51% among women and from 14% to 33% among
40%), meaning low-range replaced high-range as the 18-24 year olds. A full breakdown is shown in fig. 8.
majority choice.
FIG. 8: S
pirit purchase choice by information provision.
0% 10% 20% 30% 40% 50% 60% 70% 80% 90% 100%
ABV
KCal
Both
High-range Mid-range Low-range
Labelling the Point: towards better alcohol health information 21For the respondents who saw wine containers, Once again, this shift was particularly pronounced for
the combination of calorie information with ABV younger drinkers, with the high-range choice falling
again caused those choosing the high-range bottle from 41% to 21% and the low-range choice rising
to fall, from 29% to 20%, while those choosing the from 12% to 33% among 18-24 year olds.
mid-range bottle rose from 36% to 39%, and the A full breakdown is shown in fig. 9.
low-range bottle rose from 35% to 41%. This meant
low-range replaced mid-range as the majority choice.
FIG. 9: Wine purchase choice by information provision.
0% 10% 20% 30% 40% 50% 60% 70% 80% 90% 100%
ABV
KCal
Both
High-range Mid-range Low-range
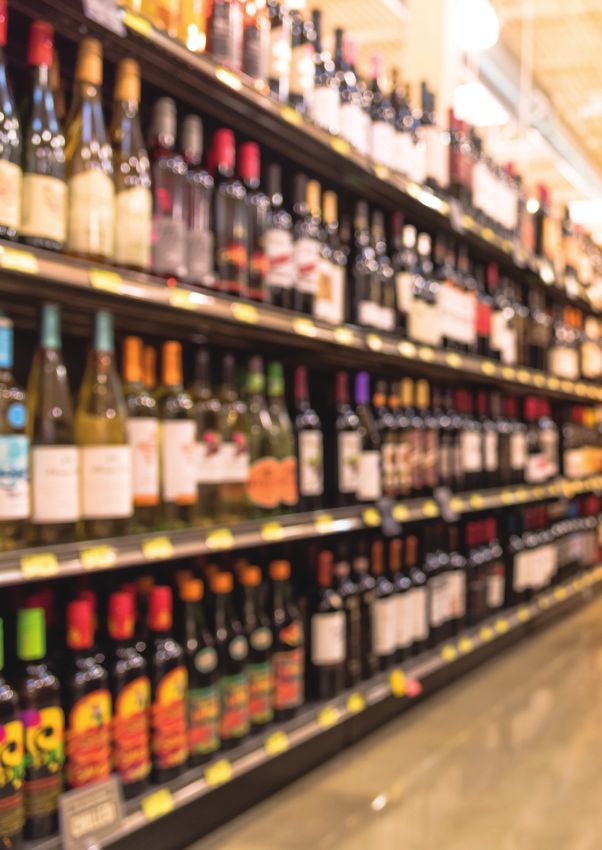
On average across the three drink categories, high-range ABV choices went down by 11% and low-range
ABV choices up by 8% when calorie information was added to the labels (down 21% and up 19% respectively
among young drinkers). This equates to a 9.5% swing from high to low (20% among young drinkers).
“ I think it’s individual choices really. But because of the problem of
”
obesity, calorie content should be on everything.
Focus group participant (female, Manchester)
22 Labelling the Point: towards better alcohol health informationFIG. 10: Experiment results: when calorie information is added to ABV
HIGH ABV LOW ABV SWING
6.5%
Down 6% Up 16% among
young drinkers
BEER
Down 17% among
young drinkers Up 7% LOW ABV 30% HIGH ABV 15%
15%
Down 18% Up 19% among
young drinkers
SPIRITS
Down 27% among
young drinkers Up 12% LOW ABV 40% HIGH ABV 34%
7.5%
Down 9% Up 21% among
young drinkers
WINE
Down 20% among
young drinkers Up 6% LOW ABV 41% HIGH ABV 20%
9.5%
AVERAGE OVERALL
Down 11% Up 19% among
young drinkers
Down 21% among
young drinkers Up 8% LOW ABV 37% HIGH ABV 23%
Labelling the Point: towards better alcohol health information 237. Discussions and conclusions
To date, the efficacy of alcohol labelling in influencing Since the results show that presenting health
change in drinking behaviour has not been proven, information on the front label would maximise
but nor has it been disproven. As has been suggested, exposure and given the limited space available
lack of evidence to this effect thus far may well be there, it is important that those elements with the
connected to poor implementation. A conclusive greatest potential to positively influence behaviour
judgement cannot be made until a methodically are identified and prioritised. The focus groups
highlighted the importance of not overfilling labels,
designed and rigorously implemented labelling
as this can lead to a counterproductive information
scheme has been trialled. In order to design such a
overload where by providing too much information, none
scheme we must answer the two questions posed in of it is communicated effectively. This was confirmed
section 5 of this report: in the survey by a clear majority (80%) in favour of
• How can health information labelling elements select information expressed clearly, as opposed to
be better presented? comprehensive information that may be less clear.
• Which health information labelling elements A clear majority of respondents (70%) also felt that
(current or proposed) should be used? the balance between health information and product
information on labels is currently about right, so the
The presentation of health information labelling public tolerance for health information expanding its
elements has been found by existing literature to physical label space footprint may be limited.
be too small to be easily legible or noticeable on
the majority of current alcohol labels. This helps As regards specific health information labelling
elements that have been proposed or are already in use:
explain the low awareness of existing health
information demonstrated in the focus groups, which • A
LCOHOL BY VOLUME (ABV) was the top
also asserted that factors such as small fonts and consumer priority identified by both the focus
poor colour contrast make current health labelling groups and survey respondents, including for
insufficiently attention-grabbing. presentation on the front label. It is widely
understood, and is the only form of information
It is no coincidence that the only form of health actively sought out by the majority (58%) of
information the overwhelming majority of both focus respondents – although there were suggestions
group participants and survey respondents are aware that it may sometimes be used for the opposite of
of being on labels (ABV, 75%) is typically presented moderating drinking behaviour.
on the front. Health information which is currently
presented on the back label, such as pregnancy • A
LCOHOL UNITS are the second consumer priority
warnings and CMO guidelines, was forgotten by all identified by both the focus groups and survey
but a small minority. respondents, including for presentation on the
front label. However, the focus groups made
Focus groups asserted that this was because, in clear that a lack of understanding means this
reality, very few consumers consulted back labels. information is unusable by many unless presented
This was confirmed to some degree by the survey in conjunction with CMO consumption guidelines,
data, which found that 84% of consumers look at the awareness of which is low. Survey respondents
front label, and 70% do so before purchase, making stated a preference for these guidelines to be
this the optimum place to present information to presented on the back, but given the lower
influence behaviour. As 74% stated that they also look visibility of back label information, the challenge is
at the back label, the value of information presented to find an effective way of connecting the two.
here cannot be entirely discounted. However, only A traffic-light style system, suggested unprompted
53% do so at the critical in-shop, pre-purchase stage. in some focus groups, may be one potential
mechanism for bridging this gap (with the caveat
that a green light could only ever be potentially
considered for a non-alcohol product).
24 Labelling the Point: towards better alcohol health information• CALORIE CONTENT was designated as the third HEALTH WARNINGS relating to specific
•
consumer priority by the focus groups, following risks – such as drink driving and pregnancy
discussion. However, this demand was not – although not prioritised by focus group
backed up by the survey, in which it achieved participants, were felt to be important by a
a relatively low prioritisation score of 5.36, and significant proportion of survey respondents.
a clear majority (70%) in favour of back, rather Both drink drive (6.53) and pregnancy
than front, label inclusion. However, higher warnings (6.03) achieved plus-6 prioritisation
prioritisation scores from women (5.80) and scores – significantly high given the tendency
35-44 year olds (5.84) back up experience from of survey respondents to gravitate towards the
food labelling suggesting calorie information may middle of rating scales. These warnings scored
influence behaviour in specific demographics. especially high among young drinkers (18-24)
The initial hostile reaction of some women in and more deprived socio-economic groups
the focus groups could potentially be interpreted (D/E). Given the priority of addressing alcohol
to suggest that it may help moderate alcohol harm within these groups, RSPH considers that
consumption via a ‘guilt’ mechanism. we should pay particular attention to these
Furthermore, the results of the purchasing results – especially if we are to avoid labelling
preference experiment carried out in question schemes that exacerbate existing health
13 of the survey suggest that the addition inequalities. More generalised health warnings
of calorie information to the front label of related to conditions such as heart disease,
alcohol containers could lead to a modest but liver disease and cancer – similar to those on
worthwhile in-category shift towards lower cigarette packets – which were suggested
calorie (and therefore typically lower alcohol) unprompted in some focus groups, also
products, across all drink types and all (not just achieved plus-6 prioritisation scores among
higher) socio-economic grades, although there these two demographic groups.
is an especially pronounced effect among young
and female drinkers. Although this exercise was • R
EFERENCES TO ONLINE INFORMATION
a basic experiment that could not fully replicate have been shown in existing literature to be
the real-world purchasing environment, its ineffective at achieving engagement. The
results represent a strong hypotheses for more focus groups backed this up, with participants
rigorous research exploration. If confirmed by stating they were unlikely to use them as it
further research, this effect could serve to spur required a level of active effort that few would
an enhanced industry focus on reformulation to make in a fast-paced, real life purchasing
produce lower alcohol/lower calorie products. environment. This was confirmed by the
It should also be caveated that the experiment survey, in which only 35% of respondents said
was not able to test whether the introduction they ever look online for information, and only
of calorie information would encourage cross- 23% do so before purchase. This was the only
category switching. suggested labelling element to receive a sub-5
prioritisation score (4.81).
The most widely understandable format for unit
and calorie information, as identified by both the
focus groups and the survey, is per container,
followed by per serving – although the latter
should only be used if the serving size is made
clear.
Labelling the Point: towards better alcohol health information 258. Recommendations for best practice
alcohol labelling
On the basis of the above findings, as well as the literature reviewed earlier in this report, RSPH recommends
that the following health information elements should be included on all alcohol containers. While these
recommendations draw on the levels of public demand for, and acceptance of, various forms of information
as set out above, they also balance this against the need to give consumers the information that is most
necessary to raising awareness (particularly low awareness of the CMO guidelines and the relationship
between alcohol and cancer), and that has demonstrable potential to positively influence behaviour (especially
calorie information).
While it is hoped that industry will show willing to make these improvements voluntarily, RSPH would, to ensure
consistency, urge the UK Government to legislate to make these elements mandatory. RSPH would welcome the
development of larger-scale academic research to further demonstrate the potential efficacy of these measures.
ON THE FRONT LABEL: (maximum exposure/utility)
• Alcohol by volume (ABV)
– WHY? Most widely understood, utilised and demanded piece of information by the public
(and already mandatory).
• Alcohol units (per container, or per serving if the serving size is made clear, and as a proportion
of the CMO’s weekly low-risk guideline limit - traffic light optional)
– WHY? Second most widely understood, utilised and demanded piece of information by the public,
necessary for quantifying/monitoring consumption.
• Calorie content (per container, or per serving if the serving size is made clear)
– WHY? Likely to nudge drinkers towards lower alcohol products, particularly young and female drinkers;
fulfil consumer right to be informed.
• Drink drive warning (in the form of a pictogram)
– WHY? Address lingering confusion/ignorance – particularly wanted by young drinkers and more
deprived socio-economic groups, tackling alcohol harm among whom is a priority.
• Pregnancy warning (in the form of a pictogram)
– WHY? Address lingering confusion/ignorance – particularly wanted by young drinkers and more
deprived socio-economic groups, tackling alcohol harm among whom is a priority.
ON THE BACK LABEL: (limited exposure/utility)
• CMO’s low-risk drinking guidelines (14 units weekly, phrased in line with the latest guidelines as “to
keep the risk of developing a range of health problems (including cancers of the mouth/throat, bowel
and breast) to a low level”, and cited as issuing from a medical professional rather than government)
– WHY? Unit information useless without their context; public awareness of guidelines and health risks,
especially cancer, still very low.
To ensure maximum exposure, written information should be presented, as per the Portman Group’s own
previous guidelines, in a font no smaller than the main body of the label, and pictographic information should
be presented in a bright colour that contrasts clearly with the background and surrounding text. Ultimately,
unless these presentational an graphic design considerations are got right, it will not matter which labelling
elements are included as none will be noticed with sufficient regularity by the consumer and they will be
rendered effectively useless – in implementing better health labelling, industry must demonstrate that
inconspicuousness is not its intention. An example of how this labelling scheme could appear in practice is
provided in fig. 11 opposite.
26 Labelling the Point: towards better alcohol health informationYou can also read