THE ECONOMIC EFFECTS OF THE GOVERNMENT'S PROPOSED BREXIT DEAL - Arno Hantzsche, Amit Kara and Garry Young
←
→
Page content transcription
If your browser does not render page correctly, please read the page content below
THE ECONOMIC EFFECTS OF
THE GOVERNMENT'S
PROPOSED BREXIT DEAL
Arno Hantzsche, Amit Kara and
Garry Young

                                26 November 2018
About the National Institute of Economic and Social Research The National Institute of Economic and Social Research is Britain's longest established independent research institute, founded in 1938. The vision of our founders was to carry out research to improve understanding of the economic and social forces that affect people’s lives, and the ways in which policy can bring about change. Seventy-five years later, this remains central to NIESR’s ethos. We continue to apply our expertise in both quantitative and qualitative methods and our understanding of economic and social issues to current debates and to influence policy. The Institute is independent of all party political interests. National Institute of Economic and Social Research 2 Dean Trench St London SW1P 3HE T: +44 (0)20 7222 7665 E: enquiries@niesr.ac.uk niesr.ac.uk Registered charity no. 306083 This paper was first published in November 2018. © National Institute of Economic and Social Research 2018.
The economic effects of the government’s proposed brexit deal   1

THE ECONOMIC EFFECTS OF THE GOVERNMENT’S
PROPOSED BREXIT DEAL*

Arno Hantzsche, Amit Kara and Garry Young

                                                EXECUTIVE SUMMARY
This report estimates the economic effects of the government’s proposed Brexit deal that was first published on
14 November 2018, and subsequently expanded.

The impact of any Brexit deal can be broken down into two key components: first, the economic impact of the
changes in the trading relationships between the UK, EU and other countries brought about by the deal: second,
the economic impact of how the deal affects uncertainty and confidence.

The main focus of our analysis is on how the government’s proposed Brexit deal is likely to affect the economy,
leaving aside the effect it might have on uncertainty. Our assessment is that trade with the EU, especially in
services, will be more costly after Brexit. This is likely to have an adverse effect on living standards in the UK.
Our central estimate is that if the government’s proposed Brexit deal is implemented, then GDP in the longer
term will be around 4 per cent lower than it would have been had the UK stayed in the EU. This is roughly
equivalent to losing the annual output of Wales or the output of the financial services industry in London. This
is equivalent to a loss of 3 per cent in GDP per head, worth around £1,000 per annum on average to people
in the UK. If the UK were to stay in a customs union with the EU, or if the Irish backstop position was to be
invoked, there would still be a hit to GDP per capita of 2 per cent.

In addition to the economic impact of the changes in the UK’s trading relationships brought about by the deal,
is the effect it has on uncertainty and confidence. So far at least, the government’s proposed Brexit deal has not
gained widespread political support and it is not clear that it will be implemented. Even if the deal is implemented,
there will continue to be uncertainty about the precise shape of the future relationship beyond the transition
period ending on 31 December 2020. Recent estimates, based on the UK’s performance relative to other similar
economies, suggest that Brexit uncertainty has already reduced UK GDP by about 2 per cent relative to what it
would have been if the UK had stayed in the EU. This uncertainty is a consequence of the 2016 referendum result.
We are not able to quantify explicitly the effect of the deal on uncertainty and confidence but to the extent that it
does not provide clarity about the UK’s future trading relationships then business investment and economic activity
in the UK is likely to continue to be lower than it would have been had the UK stayed in the EU, so that the figures
in the summary table below may be an underestimate of the economic cost of the government’s proposed deal.

The estimates presented represent our considered view of the economic impact of the government’s proposed
Brexit deal, but they are themselves uncertain as there is no historical precedent of a country leaving a major
trading block such as the EU.

Summary table: Long-run economic impact of different Brexit scenarios
Difference relative to Stay scenario in 2030
                                         GDP                        GDP                 GDP per head               GDP per head
                                      % difference               £2016 prices            % difference              £ 2016 prices
Deal + FTA (Proposed deal)                –3.9%                  –£100 bn                     –3.0%                   –£1,090
Deal + Backstop                           –2.8%                   –£70 bn                     –1.9%                    –£700
Orderly no deal                           –5.5%                  –£140 bn                     –3.7%                   –£1,330
Source: NIESR. The Stay scenario is an estimate of how the economy would develop if the UK were to stay in the EU.

*This report has been prepared for the People’s Vote campaign by the National Institute of Economic and Social Research (NIESR). NIESR is Britain’s
longest established independent research institute, founded in 1938. The scenarios reported represent NIESR’s assessment of the economic effects
of the UK’s withdrawal from the EU under the assumptions made. NIESR has no institutional position on how or whether the UK should exit the EU.
2 The economic effects of the government’s proposed brexit deal 1.Introduction The United Kingdom (UK) is due to leave the European Union (EU) on 29 March 2019. After a long period of doubt about whether a deal would be possible, it was announced on 13 November 2018 that the UK and EU negotiators had reached agreement on the terms of exit. These were then set out in the draft withdrawal agreement and the political declaration (PD) first published on 14 November 2018 and subsequently expanded. Our aim in this report is to quantify the economic impact of the United Kingdom leaving the EU under the terms of the government’s proposed Brexit deal compared to what would happen if the UK stayed in the EU. This is not a straightforward exercise and it is important to be clear why. When the British people voted in the 2016 referendum to leave the EU they did so without there being any clarity about what the new trading relationship with the EU would be or when it would be put in place. This introduced a period of intense uncertainty that has not yet been resolved and may not be resolved by the proposed deal. At present, it appears likely that the UK will agree a Brexit deal with the EU, such as the government’s proposed deal, that involves a transition period where the UK effectively stays in the EU until the end of 2020. But there are other plausible possibilities. A key low-probability but high-impact risk at present is that the UK leaves the EU in March 2019 and trades on World Trade Organisation (WTO) rules without a legal basis for many of the relationships that exist between the UK and the EU. This could involve severe congestion in the UK key trade route between Dover and Calais, disruption to air travel, and uncertainty about the status of EU citizens in the UK. This uncertainty matters because much economic activity is critically affected by what might happen in the future. There is clear evidence, to be discussed later, that economic activity in the UK in the past two years has been harmed by fears of adverse Brexit outcomes even though the UK has not yet left the EU. The effect of uncertainty on economic activity means that the impact of any deal in practice will be determined partly by how it affects hopes and fears about the future as well as the effect it would have if it was fully credible. So the impact of any Brexit deal can be broken down into two key components: first, the economic impact of the changes in the trading relationships between the UK, EU and other countries brought about by the deal; second, the economic impact of how the deal affects uncertainty and confidence. Our focus in this report is on the first key component. We analyse the effect of the government’s proposed deal on the assumption that it is agreed and credible by comparing it with an estimate of what would happen if the UK decided instead to stay in the EU, again under the assumption that this outcome is completely credible. We are not able to quantify explicitly the second key component, the effect of the deal on uncertainty and confidence, but to the extent that the deal does not provide clarity about the UK’s future trading relationships then business investment and economic activity is likely to continue to be even lower than it would have been had the UK stayed in the EU. We focus on the government’s preferred outcome where the UK leaves the EU in March 2019, enters a transition period lasting until December 2020 during which trading arrangements are broadly unchanged, and then leaves the EU Single Market and customs union and moves to a free trade agreement (FTA) with the EU leaving a relatively large degree of sovereignty about country-specific regulation (‘Deal + FTA’). We also assess the effect of the backstop case where the whole of the UK stays in a single customs territory with the EU for an extended period of time. In this case there would also be constraints on regulatory divergence set by the backstop of the Protocol on Ireland/Northern Ireland of the withdrawal agreement (‘Deal + Backstop’). There have already been a number of analyses of how different Brexit arrangements might affect the UK economy, clearly summarised by Tetlow and Stojanovic (2018). These analyses, carried out at various times, both before and after the 2016 referendum, have generally estimated the effect of different forms of Brexit compared to what would have happened had the UK stayed a member of the EU. For comparability with these other analyses, our ‘base case’ is also a scenario where the UK stays in the EU. This represents our estimate of how the economy would develop from 2019 onwards if the UK stayed thereafter in the EU and all uncertainty about the future relationship between the UK and EU was resolved.
The economic effects of the government’s proposed brexit deal   3

In addition to our analysis, HM Treasury and the Bank of England, as well as other commentators, will also
produce impact assessments of the government’s proposed Brexit deal.1 We understand that HM Treasury will
compare the long-term costs and benefits of a no deal scenario, a free trade agreement and the government’s
proposed deal with today’s institutional arrangements with the EU.2 The Bank of England will provide an
analysis of how the EU withdrawal agreement will affect its ability to deliver its statutory remits for monetary
and financial stability, including in a ‘no deal no transition’ scenario. This analysis will reflect the relatively
short-term horizons of the Bank’s remits and not represent a judgement on the long-term impact.3

For comparability, and in order to be as clear as possible, we will also compare the government’s proposed deal
to our assessment of an orderly no-deal scenario where the UK reverts to trade under WTO rules in March
2019 after the end of the Article 50 period, and emergency arrangements are put into place to avoid disruption
to trade and travel.

In setting out our analysis we aim to be as clear as possible about the assumptions that we make about
different aspects of the possible Brexit outcomes and why we have made them. As Tetlow and Stojanovic
(2018) emphasise, the answers from existing analyses of Brexit ‘vary hugely’, largely reflecting variation in
the assumptions fed into the models used.

As we emphasise further below, our assessment of how the UK economy will develop in the future under
the different Brexit scenarios is based on well-grounded, comprehensive analysis that is nevertheless subject to
significant uncertainty. This is largely because there is no precedent for any country leaving a major trading
block, such as the EU.

It should be stressed that this uncertainty about the impact of leaving the EU is not the same as the uncertainty
that typically surrounds forecasts. In particular, forecasts are produced by making judgements about the effects
of many possible events, and are known to be subject to wide margins of error often represented by forecast fan
charts that show the chances of different possible outcomes at different times. Long-term forecasts are especially
uncertain and can be likened to trying to forecast what the income of a school leaver will be in ten years’ time,
which is likely to be determined by a whole range of unpredictable factors. By contrast, the current exercise
aims to compare different scenarios on a consistent basis, holding constant many of the factors that affect the
development of the economy, and varying only the economic relationship between the EU and UK. This is more
akin to trying to assess how much higher a school leaver’s income would be in ten years’ time if they gained a
degree compared with if they did not. This calculation is much more precise than trying to forecast their income.

Similarly, we are more confident about the effect of different trading arrangements with the EU than we are
about the outlook for the economy. This is because we know that the terms on which the UK will trade with
the EU after Brexit in the different scenarios will not be as favourable to the UK as they are now. Over time, if
the UK was to leave the Irish backstop and the EU customs union, this worsening of the terms with which the
UK trades with the EU may be partially mitigated by improved trade arrangements elsewhere as the UK makes
new trade deals with other countries. But we do not think that better trade relations with distant economies can
make up for less access to the EU market.

Our key finding is that if the government’s proposed Brexit deal is implemented so that the UK leaves the EU
customs union and Single Market in 2021, then by 2030 GDP will be around 4 per cent lower than it would
have been had the UK stayed in the EU. This is largely because higher impediments to services trade make it
less attractive to sell services from the UK. This discourages investment in the UK and ultimately means that UK
workers are less productive than they would have been if the UK had stayed in the EU.

This report is organised as follows. In section 2, we describe the key economic aspects of the Brexit deal and our
assessment of how significant they are likely to be. In section 3, we describe how we have constructed our base
case scenario. In section 4, we describe how we model different aspects of the deal. In section 5, we describe
our estimates of the economic effects of the Brexit deal and how they compare with previous estimates of the
effects of Brexit.
4   The economic effects of the government’s proposed brexit deal

2. The key economic aspects of the government’s proposed Brexit deal
The key economic aspects of the Brexit deal covering both the withdrawal agreement and the PD guiding the
future relationship are:

• The UK will leave the EU on 29 March 2019, but there will be a transition period, during which the EU
  will treat the UK as if it were a Member State, with the exception of participation in the EU institutions and
  governance structures. The transition period is set to end on 31 December 2020, coinciding with the end of
  the current long-term EU budget.

• As part of the withdrawal agreement, there will be a financial settlement, provisionally estimated by HM
  Treasury at a value of £35 billion to £39 billion, that will honour all financial obligations undertaken while
  the UK was a member of the EU.4 The public accounts committee has suggested the financial settlement could
  be larger. The UK will not be required to pay sooner than if it had stayed a member of the EU.

• There is little clarity on the precise shape of the future relationship beyond the transition period ending on 31
  December 2020, though all of the agreed options involve a high degree of alignment between the EU and the UK.
  The three options are: (a) an extension of the transition period; (b) a free trade agreement; (c) the introduction
  of a single customs territory between the EU and the UK that would come into force if there was no deal by
  December 2020 and the transition period had not been extended. These are discussed in turn.

Arrangements beyond 31 December 2020
(a) Extension of the transition period. There is provision for the transition period to be extended, during which
    the UK would stay in the customs union and Single Market. The UK would continue to apply the entire body
    of EU law during the transition. Any trade agreements signed by the UK would not be able to enter into force
    until the transition ended. Extending the transition period would require a financial contribution from the
    UK to the EU budget, to be decided by the Joint Committee established by the withdrawal agreement. The
    European Commission has suggested December 2022 as the maximum possible extension.

(b) An agreed free trade deal where the UK leaves the EU Single Market and customs union. Beyond the transition
    period, the UK and EU intend to agree a deal that puts in place comprehensive arrangements that create a
    free-trade area combining deep regulatory and customs cooperation, underpinned by provisions ensuring a
    level playing field for open and fair competition.

    The free-trade area would include zero tariffs, no fees, charges or quantitative restrictions across all goods
    sectors.

    Alongside this arrangement for goods, there would be ‘ambitious, comprehesive and balanced arrangements’
    on trade in services and investment.

    On financial services, there would be commitments to preserve financial stability, while respecting either
    parties’ regulatory and decision-making autonomy, and their ability to take equivalence decisions in their
    own interest.

    On migration, there would be visa-free travel for tourists between the EU and UK, and arrangements on
    temporary entry for business travel. But free movement would end.

(c) A single customs territory to avoid the introduction of a hard border on the island of Ireland (the Irish
    backstop). This would mean that the UK would stay in a customs union with the EU, but not in the Single
    Market. Under this arrangement, there would be no tariffs or quotas for goods traded between the UK and
    EU, and no need for proof of origin. But to ensure a level-playing field, the UK would commit to maintaining
    similar taxation, environmental protection, labour and social standards, and state aid and competition policy
    as the EU. In order to avoid the need for regulatory checks in Ireland, Northern Ireland would have to stay
    in line with Single Market rules.

In table 1 we summarise our interpretation of the post-December 2020 arrangements to be negotiated in a free
trade agreement and in the backstop, and how that compares with existing trade arrangements between the EU
and Norway and Switzerland.
The economic effects of the government’s proposed brexit deal 5
Table 1. Interpretation of key parts of the government’s proposed Brexit deal and modelling assumptions
Part of deal Detail Economic effect
Goods trade
Tariffs and quotas Zero tariffs, fees and quantitative restrictions Comparable to EU membership.
on EU-UK goods trade in both FTA and
backstop.
Regulatory Deep but presumably not full regulatory Backstop: more impediments to trade than in EU and
alignment alignment as UK leaves Single Market. Norway as a consequence of being outside Single Market.
Minimum standards set out in Annex of WA
(environmental, labour, social, state aid). FTA: more impediments to trade than in backstop.
Rule making Only indirect influence through Joint Backstop: more frictions than EU membership but less
Committee, own preferences may be than Switzerland, Norway.
compromised.
FTA: more frictions than in backstop.
Own non-EU Cannot offer better conditions than EU 3rd Backstop: less benefit than Norway, Switzerland which are
trade deals country deals in backstop. not in EU customs union.
FTA: Can improve on EU trade deals.
Access to EU’s Not necessarily available in backstop or FTA. Backstop: more frictions than EU, less than Norway,
3rd country trade Rules of origins provisions would provide Switzerland.
deals frictions even if access ensured.
FTA: more frictions than backstop.
Services Good trade may be hindered by restrictions Backstop: More frictions than EU membership, Norway,
dependent goods on services. Switzerland.
trade FTA: More frictions than backstop.
Total goods Backstop: benefits from Customs Territory Backstop: On balance frictions similar to bilateral
trade and potential access to EU’s 3rd country agreements between EU and Switzerland.
trade deals likely offset by non-tariff barriers,
constraints to rule-making and own 3rd
country deals.
FTA: benefits from being in free trade area FTA: on balance more frictions than Norway (access
and ability to strike new trade deals, but to Single Market) and Switzerland (comprehensive
introduces frictions compared with being in regulatory alignment with Single Market through bilateral
Single Market. agreements).
Services trade
Regulatory No services-specific provisions in WA, PD Backstop: more frictions than Switzerland, Norway, EU
alignment ambitious regarding FTA in services but due to being outside Single Market.
lack of historical example, broad services
agreement likely to require substantial FTA more frictions than in backstop.
additional amount of alignment, incl. labour
mobility.
Rule making PD emphasises autonomy to de-align rules, Backstop: more freedom than Norway, Switzerland.
e.g. to reflect own preferences. FTA: more autonomy.
Total services Regulatory divergence likely offsets benefits Backstop: more frictions than Switzerland, Norway, EU
trade from autonomy in rule making. membership.
FTA: more frictions than under whole-UK backstop.6 The economic effects of the government’s proposed brexit deal
In our analysis, we contrast the Stay scenario with two scenarios that capture the range of possibilities that
could emerge under the withdrawal agreement and subsequent negotiations after the transition period. The first
scenario, called ‘Deal + backstop’ is a comprehensive trading relationship for goods with the UK in a single
customs territory for an extended period of time and alongside that an agreement in services trade with some
important restrictions. In this scenario, there are constraints on regulatory divergence between the EU and
the UK because of the backstop arrangement in the Protocol on Ireland/Northern Ireland of the withdrawal
agreement. In the other scenario (‘Deal + FTA’), the UK and the EU enter into a free trade agreement which
is largely related to goods trade. Trade in services is heavily restricted. Both scenarios assume that labour
movement will be curtailed and that the UK will make a smaller financial contribution.
The details of these deals are discussed below, but we can summarise the key economic features of the deal across
three dimensions: market access for goods and services, movement of people and financial contributions to the
EU. As a Member State, the UK has unfettered access to the EU, allows complete movement of people and the
country also makes a financial contribution to the EU. These three dimensions are represented in figure 1 below.
The black outer triangle represents the UK as a full member of the EU and the origin point represents a no deal
scenario where trading is based on WTO-rules, there are severe restrictions on the movement of people and the
UK does not make any fiscal contribution.
As discussed above, the difference between the Backstop and FTA scenarios primarily relates to market access
and, in particular, the service sector. We have assumed that labour movement will be heavily restricted under
both scenarios and that the financial contribution will also drop substantially from current levels.
Figure 1. The relationship between the UK and the EU
Access to
EU market
UK in EU
Deal + Backstop
Deal + FTA
Net financial Freedom of
contribution labour
(% of GNI) movementThe economic effects of the government’s proposed brexit deal 7
3. The base case scenario
In order to analyse the effects of the government’s proposed Brexit deal, we need to be clear about the alternative.
For the purposes of this analysis the main alternative considered is that the UK decides to stay in the EU. This
is different from the ‘soft-Brexit’ scenario shown in our latest forecast (Hantzsche, Kara and Young, 2018)
which assumes that much of the uncertainty associated with Brexit persists over the next two or three years.
By contrast, our ‘Stay’ scenario assumes that there is substantial political agreement not to leave the EU so that
the uncertainty is resolved. We also consider an orderly no-deal scenario, where the UK moves directly to WTO
rules in the second quarter of 2019 and emerging arrangements are put in place to avoid disruption to trade
and travel.
The Stay scenario
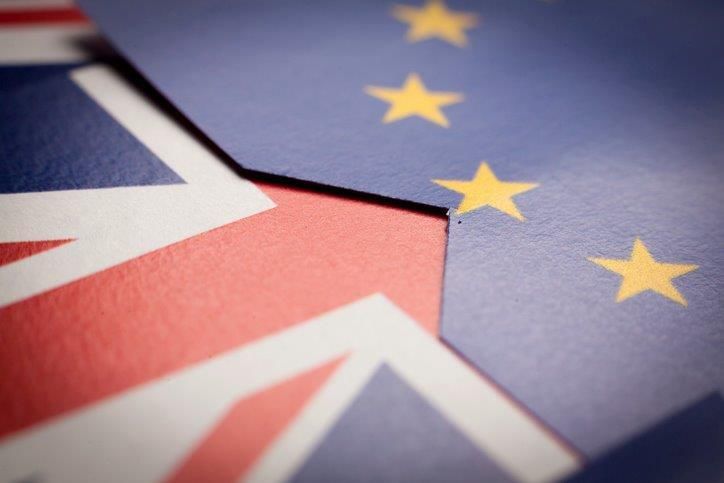
The economic performance of the UK economy since the EU referendum on 23 June 2016 has been fairly
lacklustre and there is evidence from a wide range of indicators that it has been worse than it would have been
had the referendum not taken place. This appears to reflect two key factors: the sudden depreciation of the
sterling exchange rate immediately after the referendum (figure 2) which affected import prices, and the effect
of Brexit-related uncertainty on business investment decisions. The Bank of England Decision Maker Panel
(DMP) survey of UK companies, indicates that by Autumn 2018, more than half of businesses reported Brexit
as among the top sources of uncertainty they faced. Bloom, Chen and Mizen (2018) estimate that Brexit-related
uncertainty was associated with “around 6 percentage points less investment growth (a 3 per cent reduction
per year)”.
Figure 2. Sterling effective exchange rate (January 2005=100)
100
Referendum Election
Referendum
Sterling Effective Exchange Rate
95 becomes law
PM's
90 conference
speech
85
80
75
70
Jan-15 Jun-15 Nov- Apr-16 Sep-16 Feb-17 Jul-17 Dec- May- Oct-
15 17 18 18
Source: ONS, NIESR. Sterling Effective Exchange Rate
A likely consequence of these developments is that UK economic growth has been weaker than it would
otherwise have been since the referendum, and UK inflation has been higher. Figure 3 shows that while UK
economic growth had been among the highest in the G7 prior to the referendum, it subsequently dipped below
the growth rate of other advanced economies. On the basis of similar evidence, Born, Muller, Schularick and
Sedlacek (2018), using synthetic control techniques, estimate that by the second quarter of 2018 the level of UK
GDP was 2 per cent lower than it would otherwise have been. They attribute this to the effects of heightened
uncertainty and downgrades of expected future output growth. Figure 4 shows that while UK CPI inflation
had been towards the bottom of the pack of other countries prior to the referendum, it subsequently rose
above that in other countries as the effect of sterling’s depreciation passed through to import and consumer
prices. One of the effects of higher prices is that household real incomes and consumer spending are also likely
to be weaker than they would have been had the referendum not taken place. The Governor of the Bank of
England estimated that by May 2018, UK household income was 4 per cent lower than it would otherwise have
been as a consequence of the referendum (Carney, 2018): “one third of the 4 per cent shortfall in real wages8 The economic effects of the government’s proposed brexit deal
Figure 3. UK economic growth relative to other G7 Figure 4. UK inflation relative to other G7
4 4
Referendum
Year on year inflation, %
2 2
Annual growth, %
0 Referendum 0
-2 -2
-4 -4
2012 2013 2014 2015 2016 2017 2018 2012 2013 2014 2015 2016 2017 2018
G7exUK UK (soft Brexit) HCP used for EU members, G7exUK UK
reflects stronger-than-projected inflation, which is almost entirely accounted for by the referendum-related fall
in sterling. The remainder reflects weaker-than-expected nominal wages, the majority of which can be accounted
for by weaker-than-anticipated productivity growth”.
It is possible that, should the UK decisively decide not to leave the EU after all, some of these negative effects
of the EU referendum would unwind. We therefore build a stay scenario that reverses some of these effects. We
assume that business investment rebounds from 2019 onwards, growing by 4 per cent per annum for two years
before reverting to its long-run growth rate of 1–2 per cent. The sterling-US dollar exchange rate appreciates to
$1.40 by 2020 while growth in trade steadies. Labour productivity growth picks up to just above 1.5 per cent
per year.
Fiscal policy assumptions
Each year, as a member state, the UK makes a financial contribution to fund the EU budget. The size of that
contribution depends on the annual expenditure plan of the EU as set out in the seven-year Multiannual
Financial Framework (MFF). The current MFF runs from 2014 to 2020, the end date of the current MFF is
also the termination date for the transition period that has been set in the withdrawal agreement. The financial
contribution is comprised of three categories:
The size of the economy: A uniform percentage of the Gross National Income (GNI) is applied to all EU Member
States. This is the largest category of funding with an estimated contribution of £11.8 billion in 2017–8.
Traditional own resource (TOR): Each Member State collects customs tariff and levies on behalf of the EU.
A proportion, 20 per cent, is retained by the country to cover the cost of collection. The UK transferred £3.4
billion to the EU for 2017–8.
VAT-based payment: This is set at 0.3 per cent of a ‘harmonised VAT base’ and was estimated to have been £3.0
billion in 2017–18.
These three contributions amounted to around £18 billion in 2017–18 (table 2). As it happens, a large portion
of this contribution returns to the UK, either directly to the government or to other agencies in the UK. The best
known of these is the rebate known as the ‘Fontainebleau abatement’ which was worth £4.5 billion in 2017–8
which returns to the government. The government also receives funds from the EU for onward payments under
the Common Agriculture Policy (CAP), listed as ‘Public sector receipts from the EU’ in table 2. This was worth
another £4.5 billion. The EU also directly funds a number of non-government entities such as universities,
research centres and others under Erasmus, Creative Europe and Horizon 2020 programme. This amounts to
around £2 billion and is not shown in the table.The economic effects of the government’s proposed brexit deal 9
Table 2. Transactions with the European Union on a ‘no Brexit’ counterfactual (£, billion)
2017–18 2018–19 2019–20 2020–21 2021–22 2022–23 2023–24
(outturn)
GNI based contribution 11.8 13.9 15.6 15.4 15.5 15.3 15.4
VAT payments to the EU 3.0 3.1 3.2 3.1 3.2 3.3 3.5
UK abatement –4.5 –4.6 –4.6 –4.4 –4.5 –4.5 –4.5
Receipts from the EU to cover the
costs of collecting Traditional Own
Resources –0.7 –0.7 –0.7 –0.7 –0.7 –0.7 –0.7
Total expenditure transfers
included in AME, TME and PSNB 9.5 11.7 13.5 13.5 13.6 13.5 13.6
Traditional Own Resources 3.4 3.3 3.3 3.4 3.4 3.5 3.5
Public sector receipts from the EU –4.5 –5.0 –5.3 –6.1 –6.0 –6.1 –6.2
Net contribution to the EU budget 8.4 10.0 11.6 10.8 11.0 10.8 10.9
Source: Office for Budget Responsibility, Supplementary Fiscal Tables October 2018, Table 2.25.
What matters for the fiscal arithmetic are the GNI-based contributions, the VAT-based payment and the rebate
and these together amounted to £9.5 billion in 2017. This is clear from table 2 which is the OBR’s latest forecast
of UK contributions to the EU under a counterfactual stay scenario. Under the baseline stay scenario, we assume
that the financial transactions with the EU will stay in line with current practice.
The table shows the other EU transactions that are below the line. Contributions that relate to customs tariffs
and levies (TOR) are excluded from government receipts because these are collected on behalf of the EU.
The UK Government and the EU reached an agreement on the financial settlement in December 2017 which
is estimated by HM Treasury to be around €42 billion or £37 billion. That settlement or ‘divorce bill’ is split
into three parts. The first part comprises commitments under the current MFF that ends in December 2020.
The second part relates to outstanding payments that remain at the end of the current MFF (‘reste à liquider’ or
RAL) and the third part is pension liabilities less assets returned to the UK. The table below, reproduced from
the latest Economic and Fiscal Outlook, shows the OBR’s assessment of the fiscal impact under stay and the
counterfactual scenario where the UK Government complies with the terms of the agreed financial settlement.
The table clearly shows that a large portion of the final £37 billion settlement is set to be completed by 2024.
Table 3. Forecast of expenditure transfers to the EU under different scenarios (£billion)
2017–18 outturn 2018–19 2019–20 2020–21 2021–22 2022–23 2023–24
No Referendum 9.5 11.7 13.5 13.5 13.6 13.5 13.6
Financial settlement 9.5 11.7 13.5 10.5 10.8 7.9 4.2
Assumed spending in UK
in lieu of EU transfers 0 0 3.0 2.8 5.6 9.4
Source: Economic and Fiscal Outlook, October 2018, Table 4.30.10 The economic effects of the government’s proposed brexit deal
4. Modelling the Brexit deal
We model the impact of leaving the EU on the UK economy using NiGEM, the National Institute Global
Econometric Model, an empirical multi-country economic model. NiGEM’s global nature and explicit trade
linkages make it particularly well-suited to modelling the impact on the UK economy and other countries of
shifts in trade policy. NiGEM is general equilibrium in nature, so that both prices and quantities adjust over
time. Moreover, it incorporates endogenous monetary and fiscal policy responses, which are clearly important
when dealing with the kinds of adjustments that leaving the EU might bring. It has also been used by the OECD
and HM Treasury in their analyses of Brexit.
Figure 5. Modelling assumptions underlying different Brexit scenarios
Disorderly No-deal FTA Backstop Stay
UK-EU goods trade volume
(relative to Stay)
40-50% 60% 75% 100%
No-deal
Disorderly FTA Backstop Stay
UK-EU services trade volume
(relative to Stay)
35% 40% 50% 100%
Disorderly No-deal FTA Backstop Stay
Foreign direct investment
76% 79% 82% 100% (relative to Stay)
FTA,
Disorderly No-deal Backstop Stay
Net migration
100,000 150,000 200,000 (Persons per year)
Disorderly No-deal FTA Backstop Stay
Labour productivity
-1.6% -1.3% -1% 0% (change relative to Stay)
FTA,
No-deal Backstop Stay
EU budget net contributions
50%
(relative to Stay)
100%
Disorderly: Disorderly exit, trade on WTO terms
No-deal: Orderly exit, trade on WTO terms
FTA: Nov 2018 deal, followed by UK-EU Free Trade Agreement
Backstop: Nov 2018 deal, followed by UK-wide backstop
Stay: UK stays in EUThe economic effects of the government’s proposed brexit deal 11
Our modelling approach builds on work published by NIESR prior to the referendum (Ebell et al., 2016) and
as an assessment of the proposals subsequently put forward by the British government (Hantzsche and Kara,
2018; Hantzsche et al., 2018). We model the economic impact of the Government’s proposed Brexit deal as
the combined result of different Brexit-related shocks to the economy, namely through trade, foreign direct
investment, net migration, productivity and contributions to the EU budget. Figure 5 provides an overview of
our modelling assumptions which are explained in detail in the remainder of this section.
Trade assumptions
Background
Trade liberalisation since the end of the Second World War has led to a reduction in both tariff and non-
tariff barriers to trade around the globe and resulted in a substantial increase in the volume of trade (see also
discussion in OBR, 2018), especially for countries that are geographically and culturally close. Membership in
the EU Customs Union means that goods trade between the UK and EU countries is not subject to tariffs and
quotas while the EU’s common external tariff is imposed on imports from non-EU countries that do not have a
free trade agreement with the EU. Currently, goods trade between the UK and the EU makes up 57 per cent of
total trade in goods the UK is engaged in, i.e. exports and imports. As the EU has struck trade deals with third
countries and WTO obligations eliminated several tariff barriers, average tariffs on goods trade have fallen.
Therefore, recent efforts to integrate markets have focused on removing non-tariff barriers such as regulatory
standards, rules of origin and administration costs. The EU’s Single Market is one of the most advanced regimes
globally in terms of reducing non-tariff barriers. By aligning standards, facilitating mutual recognition and
creating a level playing field in several areas such as competition, labour, tax and environmental policies, the
Single Market ensures goods can move without considerable friction across countries. Figure 6 shows the
existing pattern of UK trade with the EU and the rest of the world.
Figure 6. UK export and imports, EU and rest of the world, 2017
300 Goods Services
250
200
£ billions
150
100
50
0
EU & EFTA Rest of the World EU & EFTA Rest of the World
Exports Imports
Source: ONS, NIESR calculations.
While global goods trade is substantially liberalised, trade in services with countries outside of the EU continues
to face considerable frictions. Although tariffs and quotas are less relevant to global services trade, regulatory
burdens play an important role. The service sector accounts for approximately 80 per cent of the UK economy,
around 45 per cent of all exports and 40 per cent of all exports to the EU. The share of services trade in total EU
trade has grown substantially since 1999 partly because of proximity and also because of various EU agreements
that have reduced or eliminated barriers to services trade. The UK runs a trade surplus in services with the EU
which was worth £28 billion in 2017, helping offset some of the deficit in goods trade (figure 6).5
For services, the PD declares that both parties “should conclude ambitious, comprehensive and balanced
arrangements on trade in services and investment” and “aim to deliver a level of liberalisation in trade in services12 The economic effects of the government’s proposed brexit deal
Figure 7. Market access under CETA and GATS
100 CETA market access
GATS market access
90
80
70
%, market access
60
50
40
30
20
10
0
Distribution Travel Business servs Communciation Transport Financial
Source: Magntorn and Winters.
Note: Full market access represented by score of 100%.
well beyond the Parties’ WTO commitments, and building on recent Union Free Trade Agreements, the Parties
should aim at substantial sectoral coverage”.
The extent of service sector liberalisation under GATS is low. The number of sectors that the EU is prepared to
open to non-EU countries is small and as a result of that the arrangements that are likely to be negotiated for
services trade are likely to be less ambitious than the trade in goods. This is illustrated in figure 7, derived from
Magntorn and Winters (2018), showing how UK exporters’ access to EU markets would be affected if the UK
were to move to trading on either GATS terms or a deal like the Comprehensive Economic and Trade Agreement
(CETA) between the EU and Canada. While there would be little effect on exports of travel services, there would
be a significant loss of access by providers of financial services, transport and communications.
The sections in the PD that cover the service sector are imprecise and therefore open to interpretation, but there
is no doubt that the scope of any agreement on services trade is set to fall well short of current arrangements.
It is also worth emphasising that the new round of services negotiations will not force WTO member countries
to open all their services sectors to foreign competition, contrary to some claims. When this point was put to
the WTO, the response from them was that “There is no obligation on any WTO Member to allow foreign
supply of any particular service – nor even to guarantee domestic competition, since it is possible to maintain a
monopoly supplier, whether public or private, of any service. Governments are free to choose those services on
which they will make commitments guaranteeing access to foreign suppliers. Each Member must have a national
schedule of commitments, but there is no rule as to how extensive it should be. Some least-developed Members
have made commitments only on tourism, for example, and in general there is great variation in the coverage of
schedules, reflecting national policy objectives and levels of economic development. There is agreement among
all Governments that in the new round of negotiations the freedom to decide whether to liberalize any given
service and the principle of progressive liberalization will be maintained”.
Figure 8 shows the composition of UK service sector trade. The key categories of services exports are financial
services, covering mainly retail and investment banking services other than insurance, and ‘other business services’,
that covers a range of services including legal, accounting, management consulting and public relations. There
are also large contributions from transport, covering sea, air and other transport, and travel, which includes the
spending of foreign tourists in the UK.The economic effects of the government’s proposed brexit deal 13
Figure 8. UK services trade volumes by sector, 2017
120
Other business Financial
100
Travel Transport
Telecommunication and IT Insurance and pension services
£ billions, 2016 prices
80
60
40
20
0
Exports Imports
Source: ONS, NIESR.
The Single Market enables financial sector firms to carry out activities in other European Economic Area
countries by ‘passporting’. Passporting would be be withdrawn were the UK to leave the Single Market and
trade on GATS terms. The EU can offer similar access to countries outside the EU under EU equivalence, but
the certainty and scope of this regime is restricted because the equivalence arrangements are granted on a case-
by-case basis and subject to withdrawal by the EU at short notice.
Professional services are covered under the Mutual Recognition of Qualifications Directive and similar specific
arrangements cover legal services, telecoms and consumer-protection laws. There is an enormous amount
of uncertainty for sectors that rely on professional services because the PD seeks ‘appropriate arrangements
on professional qualifications’, without any assurance of the sectors, the overall objective, the regime or the
implementation period.
Leaving the European Union will therefore unambiguously result in higher frictions to trade between the UK
and the EU. In fact, there is evidence that uncertainty about future trading relationships has already deterred
exporters from entering into new trade contracts after the referendum (Crowley et al., 2018).
Long-run impact on UK-EU bilateral trade
In order to quantify the impact of different Brexit outcomes, we rely on estimates provided by the empirical
literature. More specifically, we use measures of the impact on goods and services trade of joining trade
arrangements with European countries and calculate the implied change in UK-EU trade from reversing
membership, accounting for the share of goods and services trade in total UK-EU trade, which in most recent
ONS data have been 68.3 per cent and 31.7 per cent, respectively. We therefore assume symmetry in the effects
of joining and leaving the EU. Empirical estimates are based on different periods and the average EU member
state. It is possible, given the UK’s particularly strong reliance on services, that the overall impact of trade
restrictions could be larger on the UK compared with other economies where services is less important. We
therefore apply judgement in our application of historical findings.
Deal + FTA. How would we expect the proposed deal to affect future trade between the EU and the UK if it
were to lead to a new free trade agreement between both trading partners? Based on our judgement of the
withdrawal agreement and PD (table 1), we would expect goods trade to face more severe frictions than trade
between Norway or Switzerland and the EU. While the PD stresses that no tariffs or quantitative restrictions
will be put in place, we would expect non-tariff barriers to be higher than between Norway and Switzerland,14 The economic effects of the government’s proposed brexit deal
Table 4. Impact of trade agreements on bilateral trade
Goods trade Services trade
% reduction in bilateral trade % reduction in bilateral trade
Norway 25–38 (BBEM08) 40 (MS13)
19–28 (C06)
Switzerland 25–38 (BBEM08) 40 (MS13)
45–54 (C06)
FTA 35–44 (E16) 61–65 (E16)
WTO 53 (BBEM08) 61–65 (E16)
58–65 (E116)
Notes: BBEMO8: Baier et al., 2008, E16: Ebell (2016), MS13: van der Marel and Shepherd (2013), CO6: Ceglowski (2006).
given that the former has full access to the EU’s Single Market through the European Economic Area and the
latter has adopted comprehensive regulatory alignment with the Single Market through bilateral agreements
in return for concessions on sovereignty on rule-making and free movement of labour. The empirical literature
suggests a reduction in bilateral goods trade under the average EU FTA with third countries of 35 to 44 per
cent (table 4). Given the commitment in the PD to “deep regulatory and customs cooperation, underpinned by
provisions ensuring a level playing field for open and fair competition” and the ambition to avoid border checks
between Northern Ireland and the rest of the UK, we adopt a midpoint assumption of 40 per cent. To date, the
global experience with free trade agreements in services is scarce because comprehensive liberalisation requires
regulatory alignment similar to that provided by the EU’s Single Market. CETA, the EU’s free trade agreement
with Canada, counts as the EU’s agreement with the most advanced commitment to services trade liberalisation,
for instance by binding domestic regulation of licensing and authorisation regimes and setting a framework for
the mutual recognition of professional qualifications. We therefore assume a reduction in services trade with the
EU of 60 per cent, at the lower bound of empirical estimates ranging from 61 to 65 per cent.
This is a substantial reduction, coming mainly from lower services. Using detailed estimates of sector-specific
market access under CETA and GATS from Magntorn and Winters (2018) weighted by the volume of UK
services exports to the EU by sector, a back-of-the-envelope calculation confirms that total services access to EU
markets would be reduced by between 40 per cent (CETA) to 55 per cent (GATS).
Accounting for current shares of goods and services trade, total trade between the UK and the EU is reduced by
46 per cent in the Deal and FTA scenario. We later check the sensitivity of our resuls to an alternative assumption
wich considers trade reductions of half that size.
Deal + Backstop. The backstop set up in the protocol on Ireland/Northern Ireland of the withdrawal
agreement would keep the whole of the UK in a single customs territory with the EU. It would also constrain
regulatory divergence between both parties in the areas of taxation, environmental, labour, social, state aid
and competition policy. As a result, we think that on balance frictions faced by goods exporters and importers
would be similar to goods trade between the EU and Switzerland. Using the midpoint between estimates
by Baier et al. (2008), we assume a reduction in bilateral goods trade of 25 per cent. Services trade is not
subject to tariffs and therefore does not benefit from tariff alignments under the backstop. In addition, most
of the regulation tied down by the backstop arrangement applies to goods trade. We assume that services
trade under an extended backstop, or similar arrangements, would be lower by 50 per cent compared to EU
membership. As a result, total bilateral trade with the EU is lower by around 30 per cent in the long run,
compared with EU membership in this scenario.
No-deal. We contrast our results with those obtained for an orderly No-deal scenario under which the UK
reverts to trade under WTO rules after 30 March 2019. Estimates by Baier et al. (2008) and Ebell (2016)
suggest that moving from full membership in the EU Customs Union and Single Market to a trade relationship
under WTO terms would reduce UK-EU trade in goods by between 53 and 65 per cent in the long run (table 4).
Services trade would fall by 43 to 65 per cent, according to estimates provided by Ceglowski (2006), van der
Marel and Shepherd (2013) and Ebell (2016). Our no-deal scenario assumes a reduction of 56 per cent in total
UK-EU trade using midpoint estimates.The economic effects of the government’s proposed brexit deal 15
We assume in all our scenarios that existing trade deals between the EU and non-EU countries either remain
accessible for the UK or can be negotiated within a relatively short period of time without substantial changes
to their quality. By contrast, our main analysis does not assume that comprehensive trade deals will be struck
between the UK and non-EU countries not currently covered by free trade agreements with the EU as negotiations
typically take a considerable amount of time. However, we later check the sensitivity of our results to a change
in this assumption.
Short-run impact on UK-EU bilateral trade
Most of the presented literature is based on static estimates of EU membership effects and at best apply to the
long run (some ten years after the change in the trading relationship). There is a large degree of uncertainty
about the transition to the long run. In what follows, we therefore focus predominantly on long-run effects. As
regards short-run dynamics, we make the following assumptions:
• Deal + FTA: During the transition period, we assume that companies and households expect the UK-wide
backstop to apply thereafter for as long as negotiations about the free trade agreement are under way. At
the end of the transition period, some share of bilateral trade can no longer take place, for instance because
licences for services no longer apply. The economy then gradually adjusts over ten years to trade under the
free trade agreement, ie 46 per cent less bilateral trade compared to staying in the EU.
• Deal + Backstop: During the transition period, UK-EU trade is lower by 10 per cent as expectations adjust.
At the end of the transition period trade is lower by another 10 per cent and then gradually adjusts to the
long-run equilibrium of 30 per cent less trade over the course of ten years.
• No-deal: We assume that half of the impact in UK-EU trade takes place in the second quarter of 2019 as
some goods and services can no longer be traded and others face severe barriers at the border. Trade then
adjusts over the course of ten years to reach the long-run trade relationship under WTO rules with bilateral
trade 56 per cent lower than under the status quo.
Assumptions about foreign direct investment
The future trading relationship between the UK and the EU will also determine the amount of foreign direct
investment the UK receives. While the PD commits to “ambitious, comprehensive and balanced arrangements”
also on investment, any barriers for UK-based companies to access the EU market would make the UK a less
attractive investment destination. This is because EU membership enables UK producers to be integrated in
EU supply chains. In addition, the opportunity to serve the EU market has in the past contributed to non-EU
companies choosing the UK as an investment destination, alongside other factors, such as language and the legal
and tax system. Serwicka and Tamberi (2018) find that since the Brexit referendum, the number of FDI projects
in the UK has fallen by 16–20 per cent.
Ramasamy and Yeung (2010) find that openness to trade benefits in particular FDI inflows to services sectors,
much more than to manufacturing. Ebell and Warren (2016) survey the empirical literature and calculate that
reverting to trade under trade arrangements similar to those between the EU and Norway would reduce FDI
into the UK by 8–11 per cent, and by 11–23 per cent under a Switzerland-type relationship (table 5). By their
estimates, trade under WTO rules would reduce inward FDI by 20–27 per cent, which is similar in magnitude
to estimates by Dhingra et al. (2017).
Table 5. Impact of trade agreements on FDI
FDI
% reduction in FDI
Norway 8–11 (EW16)
Switzerland 11–23 (EW16)
FTA
WTO 20–27 (EW16)
24 (DOSR17)
Notes: EW16: Ebell and Warren (2016), DOSR17: Dhingra et al. (2017).16 The economic effects of the government’s proposed brexit deal
Accounting for the importance of trade for FDI in services and the fact that around 36 per cent of all FDI inflows
into the UK end up in the services sector, we apply our judgement about the future trade relationship to construct
our assumptions about FDI inflows after Brexit. For the scenario in which a free trade agreement between the
UK and EU is struck, we assume FDI inflows fall by 21 per cent, relative to continued EU membership. The
assumed reduction under a permanent backstop arrangement is 18 per cent, and 24 per cent under ‘No-deal’.
We implement the change in FDI in NiGEM as a permanent reduction in the business capital stock and adjust
balance of payments transfers proportionally.
Assumptions about net migration
Since the EU referendum, net migration of EU citizens to the UK has fallen from around 200,000 to less than
100,000 per year (figure 9). The withdrawal agreement encompasses a range of provisions to ensure that EU
citizens currently living and working in the UK will be able to stay and enjoy similar rights as natives. Regarding
the mobility of people who enter the country after the end of the transition period, free movement ends and
the OPD hints at a more restrictive immigration system allowing for visa-free travel only for short-term visits.
While the recent fall in net migration from the EU was partly offset by a rise in non-EU net migration, the UK
may become a less attractive destination for workers from the rest of the world if ties with the EU are loosened.
Figure 9. Net migration and scenarios
Thousands per year
Total net migration British
EU Non-EU
Remain No-deal
Deal
350 Forecast
300
250
Thousands, per year
200
150
100
50
0
-50
-100
2008 2010 2012 2014 2016 2018 2020 2022 2024 2026 2028 2030
Source: NIESR.
We assume that total net migration evolves according to the ONS principal population projections under the Stay
scenario and stay around 200,000 per year. Under our deal scenarios, we assume that on balance 50,000 fewer
people enter the country, 75 per cent of whom are of working age. Our no-deal scenario follows the ONS low
migration variant in which net migration falls to around 100,000 per year as the rights of EU citizens currently
residing in the UK could be more affected than if the withdrawal agreement is implemented. We assume that
net migration that is foregone as a result of Brexit is instead directed to the country’s largest trading partners.
Productivity assumptions
Reductions in trade with the EU, foreign direct investment and migration as a result of Brexit have the potential
to worsen the outlook for productivity substantially. However, there is a large degree of uncertainty around the
impact. The reduction in trade is likely to reduce competition in the future and thus innovation (Impullitti and
Licandro, 2017). A reduction in foreign direct investment could inhibit the inflow of ideas from abroad. Weaker
productivity growth might also result from a lack of demand, particularly for exports (Oulton, 2018). A reduced
inflow or increased outflow of skilled migrants could lead to lower productivity. Vice versa, a post-Brexit
immigration system that favours high-skilled workers over low-skilled ones might increase average labour
productivity (OBR, 2018) but could lead to labour shortages in sectors that rely more strongly on less skilled
workers with the opposite effect (Rolfe et al., 2018).The economic effects of the government’s proposed brexit deal 17 We base our assumptions about productivity on Behrens and Mion (2017) who estimate that a no-deal Brexit would reduce labour productivity by 1.6 per cent in the long run. Given that the majority of this effect is due to lower productivity in services sectors, which would be disproportionally more affected by the Brexit deal, we assume that in our Deal + FTA scenario, labour productivity falls by 1.3 per cent, and by 1 per cent in our Deal + Backstop scenario. In NiGEM, we can calibrate a shock to total factor productivity that, all else equal, produces a productivity slowdown of that size. Fiscal policy assumptions As discussed above, our baseline Stay scenario assumes business as usual – the UK Government continues to make fiscal transfers as before. Under both deal scenarios (backstop and FTA) as well as the no deal scenario, we assume that the government complies with the terms of the settlement and that a reduction in transfers is recycled into additional government consumption. In the case of No Deal, we assume that around £8–10 billion is recycled each year after the bulk of the divorce settlement has been paid in 2024 whereas under the other two alternative scenarios, Deal with backstop and Deal with FTA, we assume that £4–5 billion is recycled into government spending each year. We further assume that the increase in government spending directed to the domestic economy is offset by a reduction in transfers abroad, and thus fiscally neutral. Monetary policy assumptions The path for monetary policy under the different scenarios is uncertain. Whereas in 2016 the MPC had room to stimulate the economy with a reduction in Bank Rate and quantitative easing, the case for another injection is less clear because the economy has less spare capacity now and CPI inflation is above the target level (Broadbent, 2017). As always, monetary policy will be set based on a judgement of the balance between demand and the supply capacity of the economy. Under a no-deal scenario, this may once again require the Bank to manage the trade- off between the speed with which inflation returns to target and the support that policy can offer to economic activity (Carney, 2018). Much hinges on the evolution of inflation expectations in the economy. The Monetary Policy Committee will have the space to accommodate any demand shock only if inflation expectations remain anchored at a level that is consistent with the target inflation rate. Our baseline Stay scenario assumes that the Bank of England raises Bank Rate every six months until the policy rate reaches 1.5 per cent by mid-2020. For the alternative scenarios, we allow the Bank Rate to evolve in line with a standard monetary policy rule that is embedded in NiGEM. Under that rule, the Bank Rate responds to the deviation of actual inflation from the 2 per cent target and the output gap.
You can also read