U-MOVE Dominique van Berkum
←
→
Page content transcription
If your browser does not render page correctly, please read the page content below
U-MOVE by
Dominique van Berkum
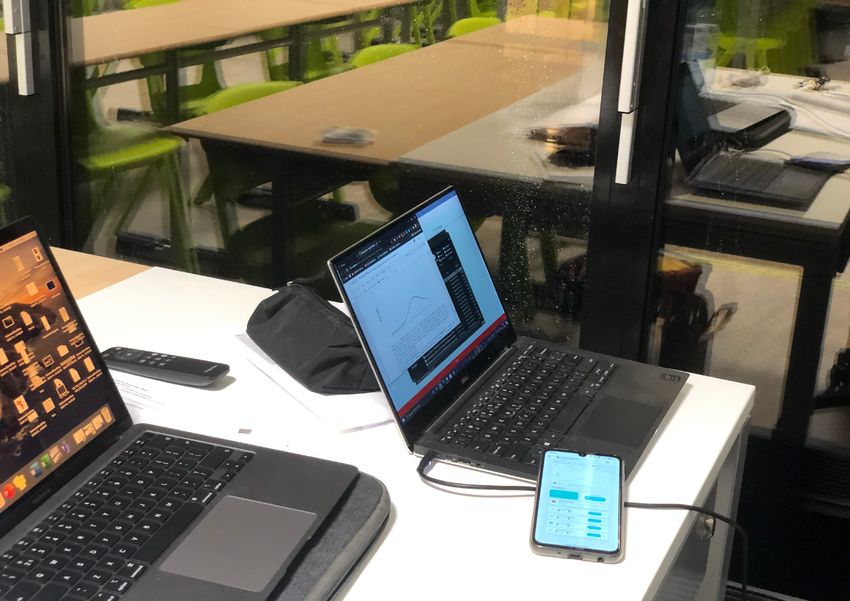
Final Bachelor Project
2020-2021
Coach: Daniel Tetteroo
Squad: Health
Student number: 1018227
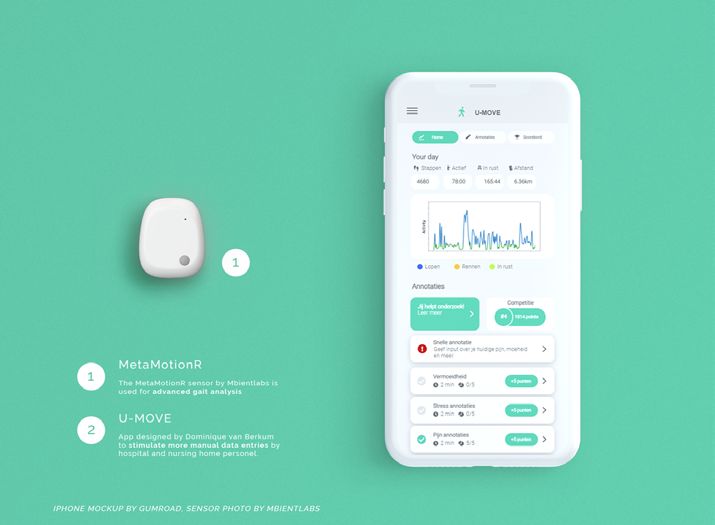
MOCKUP IPHONE BY GUMROAD
1
Final Bachelor
Project
Index

    Executive summary                     4
    Prologue                              6
    Introduction                          8
    Design process                        10
         Exploring the design context     10
         Ideation Design Opportunities    14
         Iteration 1                      18
         Iteration 2                      24
         Final iteration & Demonstrator   28
         Validation                       34
    Discussion                            38
    Conclusion                            39
    Reflection                            40
    References                            42
    Appendix                              46

2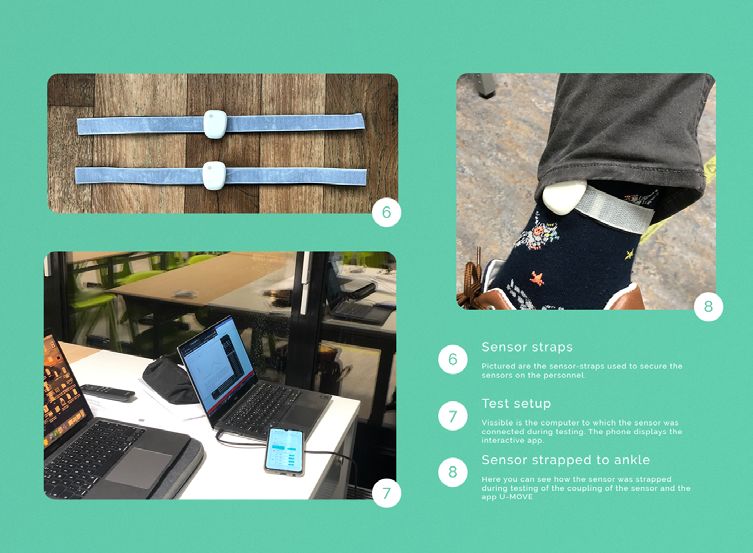
3
Final Bachelor
    Project
    Executive Summary.
                                                                          home workers and were the inspiration to make a persona.
                                                                          A literature review was also done to better understand the
                                                                          pain points of the target audience and get an insight into their
                                                                          wellbeing.

                                                                          A brainstorm session resulted in several concepts, which were
    This project was initially started in collaboration with the client
                                                                          reflected upon using a QOC analysis using the values of ECCO
    ECCO Innovation Lab. ECCO is a shoe brand who is currently
                                                                          and my own values. Three ideas were then further developed
    trying to innovate with a new sensor technology in their
                                                                          and proposed to ECCO, the experts of ECCO provided feedback,
    shoes. ECCO did not have a clear view on what they wanted to
                                                                          for which I then created an improved concept which ECCO
    achieve with the collaboration with the TU/e, so the first part
                                                                          agreed to work further on together. It was decided that I would
    of the project was mainly focussed on finding the right design
                                                                          further improve the ECCO sensor module app with added
    context and design direction which all stakeholders would be
                                                                          features to stimulate more manual data entries by hospital
    satisfied with.
                                                                          and nursing home personnel who are wearing shoes with the
                                                                          ECCO sensor module incorporated.
    Finding the right design context and direction consisted of a
    close collaboration with ECCO, with several different phone or
                                                                          Unfortunately in the middle of the project after the midterm
    in person meetings to discuss different directions. Eventually
                                                                          demoday ECCO decided to stop the collaboration completely,
    the target group ‘Hospital and nursing home personnel’
                                                                          no inputs would be given anymore and I was not able to use
    was decided upon. This fitted the best with ECCO’s current
                                                                          their technology or test the product with the test group of
    running projects, while also providing lots of different design
                                                                          OLVG. This meant that I needed to find a replacement for the
    opportunities. To deepen my knowledge of this target group I
                                                                          ECCO app, ECCO sensor module and a way to get into contact
    conducted a questionnaire with 16 nursing home and hospital
                                                                          with a new test group for my studies. After contacting several
    workers. Results from this questionnaire helped create a better
                                                                          sensor manufacturers and discussing options with a master
    understanding about the normal day of hospital and nursing

4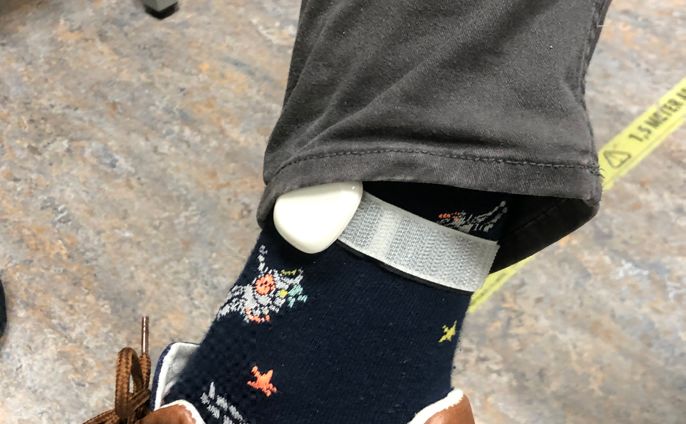
research student who conducted her research in the same
area, I found the MbientLab sensor was the best fit for quick
development and detailed gait-analysis.

To make the first interactive designs of the concept I used
Adobe XD. The interactive designs were used for usertesting
and gathering feedback from experts on the app experience.
The final prototype was programmed using HTML/CSS in
combination with Javascript, data analysis in Python and all
connected to a Restdb database for real time interactivity with
the Mbientlab sensors.

The validation was not able to be done with nursing home or
hospital workers despite several attempts to get into contact
to make appointments, the choice was made to instead test
the product with teachers of a highschool. Howevers, due to
the closing of schools due to Covid-19 not all testing could be
done with the teachers. The overall reception during testing
was positive, with some improvements suggested. Especially
the understandability of the personal data insights and the
context of the annotations were tested and positively received.
                                                                  Figure 1: The homescreen of the final proto-
                                                                  type

                                                                                                             5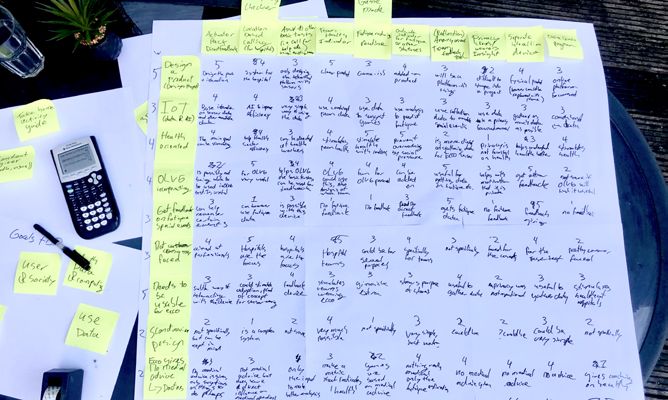
Final Bachelor
    Project
    Prologue.

    For my Final Bachelor Project I decided to go with the Health squad, this
    mainly because the expertise areas that I wanted to further develop (user
    and society, math data and computing and technology and realization) were
    possible to further develop in the squad. In the presentation of the squad
    they mentioned that they did projects with Artificial Intelligence, this got
    my attention since I have taken a special interest in Artificial Intelligence
    throughout my Industrial Design bachelor, but also outside my bachelor by
    following the Artificial Intelligence bachelor at the University of Utrecht and
    launching my own Artificial Intelligence app. Within the squad I wanted to
    work for the client ECCO, this was because I saw the possibility to work with
    large amounts of data and focus more on the Internet of Things. The internet
    of things has been one of my main focuses throughout my Industrial Design
    bachelor, since my vision is that this technology will be crucial in our daily
    lives in the future. data collection together with the client ECCO in the context
    of nursing homes and hospitals.

6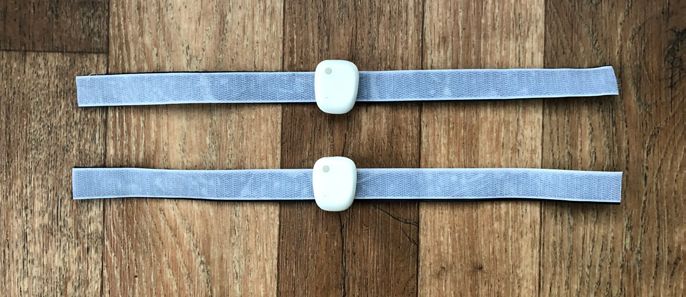
7
Final Bachelor
    Project
    Introduction.
                                                                     ECCO
                                                                     The client for this project, ECCO, is a shoe brand founded in
                                                                     1963. The brand takes pride in their premium materials and
                                                                     their ‘Scandinavian’ design [4]. With scandinavian design
                                                                     they mean design inspired by the svandinavian nature, but
                                                                     also designed for simplicity and everything should ‘just
                                                                     work’. ECCO has an Innovation Lab where they explore
    Data is getting more valuable than ever before, which is
                                                                     new innovations connected to their shoe brand, such as
    why companies start to gather as much data as they can.
                                                                     customized 3D-printed soles for their shoes [5]. This project
    Companies such as Facebook and Google already gather
                                                                     focuses on the Quant I/O project of ECCO, this is a direction
    large amounts of data for advertising purposes [1]. However,
                                                                     ECCO is researching together with their sensor module
    also gathering more health data is getting important. Health
                                                                     [6]. Their vision is that especially professionals will wear
    data is oftentimes difficult to collect, but when collected it
                                                                     sensors that track all their movements, this could help track
    can help with the assistance of machine learning diagnose
                                                                     efficiency, walking routes and gait-patterns [6]. The platform
    and predict diseases and unhealthy behavior early on [2].
                                                                     and the sensor of ECCO are still in their testing phase.
    The more data we can gather the more accurate prediction
    algorithms we can eventually make [3]. Artificial Intelligence
                                                                     Data collection for training of machine learning
    algorithms could possibly do things with that data that
                                                                     algorithms
    humans couldn’t even do themselves [1]. This project will
                                                                     Machine learning algorithms are getting more and more
    keep in mind this data collection together with the client
                                                                     integrated in our everyday lives [7]. However, to make well
    ECCO in the context of nursing homes and hospitals.
                                                                     working accurate models a lot of data is needed. This
                                                                     data collection is oftentimes difficult in contexts such as a

8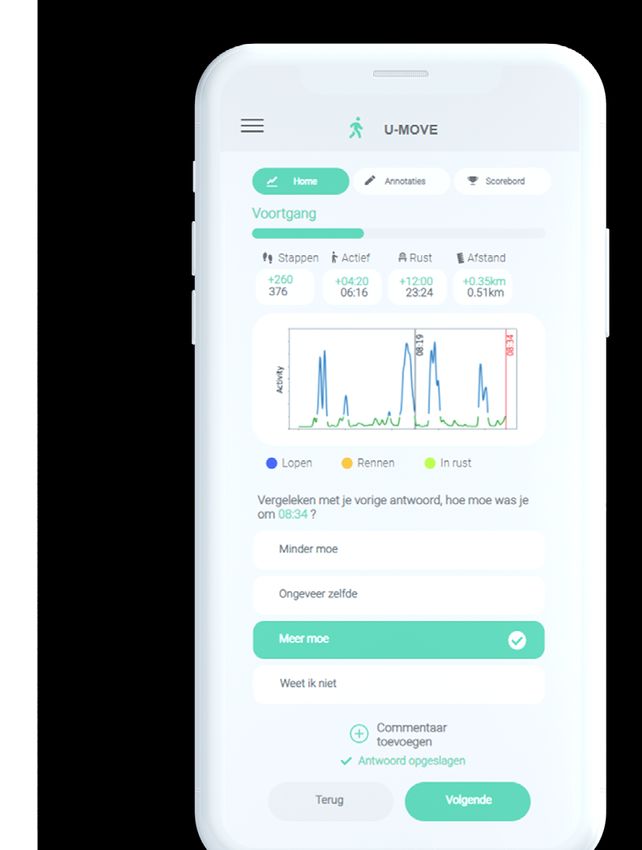
hospital, where the employees are most of the time busy
with their work. This project will focus on finding a well suited
manual data collection method for hospital and nursing
home personnel.

Societal relevance
At the time of this project the Covid-19 pandemic is causing
a lot of strain on the personnel of nursing homes and hospital
personnel. While they make sure that their clients are being
taken care of well it is also important to keep in mind the
health of the personnel, who are often more prone to stress,
fatigue and have a larger chance at several diseases [8]
[9]. This project researches ways to gather more data and
get more insights in the day of the personnel, using this
data we could possibly analyse and predict when someone
needs to take a day off or to optimize schedules. With these
optimizations the health and wellbeing of the hospital and
nursing home personnel could then be improved further
[10]. Also other occupations could benefit from early fatigue
detection, it is now estimated that 136.4 billion US dollars
of revenue is lost due to employee fatigue [11], which could
possibly be prevented or be detected early on by the smart
sensors. The market cap of health and wellness devices
is projected to be 657 billion US dollars [6], which is an
enormous market so for companies such as ECCO it is also
financially beneficial to research the possibilities further.

                                                                    9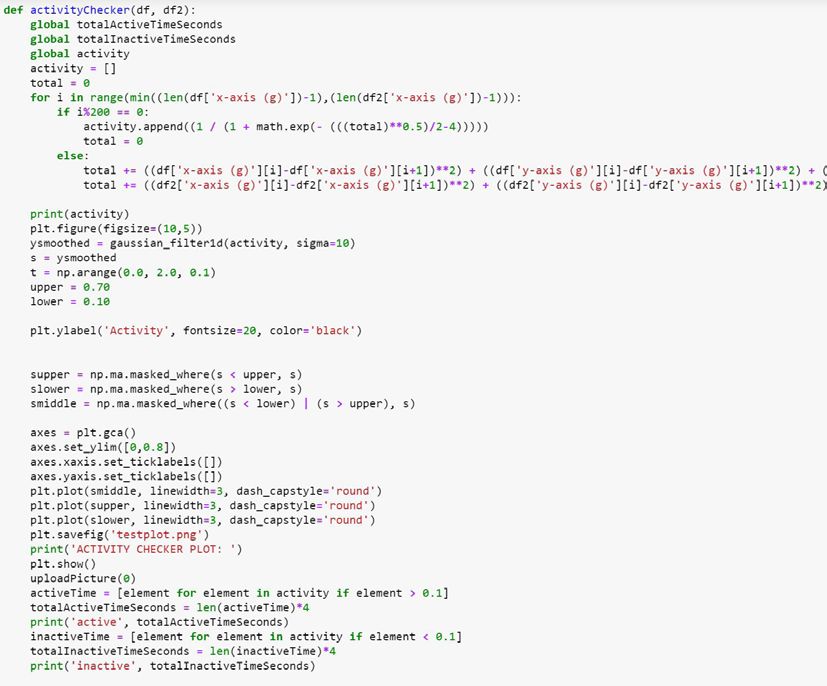
Design process                                                      track their stability and kick distance [14]. Implementation of

 Exploring the design
                                                                     smart shoes very daily regular use during work was actually
                                                                     very little products available in, so that was the perfect focus

 context                                                             for this project.

                                                                     Stakeholders
 One of the starting points of this project was to find the          Throughout the project it was crucial to have the stakeholders
 different design opportunities in the appropriate design            get involved closely with the project. Initially the project was in
 context to decide on a design direction. The goal was to find       collaboration with ECCO, a premium shoe brand closely tight
 something which would be closely connected to the current           with innovation. More specifically I worked together with the
 research and technologies on which ECCO was working. The            Innovation Lab of ECCO. This innovation lab was currently busy
 different directions were closely discussed with ECCO and           with exploring their new technology under the name ‘Quant-
 the Health Squad to help make the best fitting decisions for        IO’, a sensor which they were planning on testing with Hospital
 all stakeholders.                                                   and Nursing home employees. From contact with the head of
                                                                     design it became clear that ECCO was planning to enter the
 Trend analysis                                                      health market, but was still in their research fase. ECCO donated
 ECCO is far from the only company currently busy with               100 pairs of their shoes to OLVG hospitals in Amsterdam [15], for
 exploring the possibilities of ‘smart shoes’, meaning that a lot    which they will in return test their prototype innovations. Since
 of other shoe manufacturers are also developing shoes that are      ECCO already demonstrated an interest and market for applying
 incorporating sensors. By researching the trends in this market     the technology in a hospital environment I decided to further
 segment I came with an overview of all different sorts of smart     explore this design context by taking into account the hospital
 shoes. From this overview it became clear that most smart shoes     and nursing home employees as stakeholders. Furthermore it
 were developed for athletes, especially for running to make         was important to also take into account the researchers who
 analysis on your performance. While the sensors of most shoes       are busy with researching the new technology of ECCO, so they
 were all very similar, the implementation and actual use was all    could also benefit from the innovations.
 different. I have decided to not focus on the tracking of sports,
 since the field of smart shoes for athletes was very dominated      • ECCO
 by other sport brands such as Nike, Adidas and Asics [12][13]       To get a good understanding of the expectations and goals of
 [14]. Asics for example launched a shoe which helps runners         ECCO it was important to keep into close contact with different

10
experts of the ECCO innovation lab. There were three people
involved from ECCO during this project: The Head of Design,
the Head of Digital, and the Head of Research, each possible
opportunity was discussed with these three experts. The main
contact person for this project was the Head of Design, each
week we kept in contact to discuss the progress and possibilities
to make sure everybody was satisfied with the collaboration. I
have also visited the ECCO Innovation Lab, to meet and discuss
the expectations of everyone involved. After discussing with all
the experts involved at ECCO I made an overview for all the
important values which ECCO had mentioned in the discussions,
and also added the values I deemed were important for my
project.
Figure 2: Smart shoes presented at CES 2020 by Asics. Photo
• Hospital and nursing home employees by Sneakers Middle East [14]
In the collaboration with ECCO it became quickly clear that
ECCO wanted something to be designed for hospital and
nursing home personnel. This was due to their collaboration
with OLVG, a hospital group in Amsterdam. The current running
projects of the ECCO Innovation Lab were also very targeted
at the moment to that specific target group. I decided to also
focus on this target group, since I could then apply and test
my final product in the design context with the ECCO sensor
module while at the same time assisting ECCO in gathering
more data for their research.
• Researchers
To make sure that the final product I would make would also be Figure 3: Stakeholder map of the different stakeholders of
beneficial for the researchers behind the ECCO sensor I decided the project
11to also take into account the preferences of the researchers. were sent to ±100 hospital and nursing home workers, of
This is why I also talked with the head of Research at ECCO which 16 responded, the questions asked can be found in the
about what he thought was important and what directions he appendix. Beside that I decided to also use several literature
would benefit from. Also throughout the project I got input findings to get a better understanding of the target group.
from Lieke de Mare, a master Industrial Design student at the
TU/e. She was conducting a research project with the ECCO All questions were asked in dutch and all responses were in
sensor module data, which made her a great expert to get the dutch. The complete answers can be found in the appendix.
perspective from a researcher conducting a research project.to The table gives an overview of the participants.
also take into account the preferences of the researchers.
Findings
Technology The answers of the questions helped to get a great insight into
The Quant-IO sensor was initiated from the Quant-U project the normal day of the target audience. Most enjoyed their work
of ECCO innovation lab. The Quant-u project started with the and liked to help the patients, their days often were described as
focus on creating customizable soles of the shoe for improved very active days, with a lot of walking and standing. This is also
comfort when walking [5][6]. To achieve this they have a 3D-scan seen in the data where 68.8% describes themselves as standing
device which makes a detailed scan of the feet to create a most of the time. This might also explain why almost everyone
3D-model to print using a 3D-printer with a special silicone (15 out of the 16 participants) did feel some pain in their feet
material [5]. To test the efficiency of the customized shoes they or legs after a day of work. The focus of the participants was
developed a sensor module which provides data to be able mainly on their clients when describing their day. One thing that
to make a detailed gait-analysis. The ECCO sensor module stood out was that 11 out of 16 participants were not interested
for example can detect acceleration, rotation, temperature, to be more busy with their own health during their working day.
walking route and the pressure division of the feet [6]. Each The phone use of the participants was overall also very low.
sensor is either clipped on, or put into the sole of each shoe 46.7% of the participants use their phone less than 3 times an
and is then connected to the app developed by ECCO [6]. hour and 40% only 3 to 5 times an hour.
Hospital and Nursing Home Workers
To get a better understanding of the targeted users of the
product I decided to question multiple people who work in
either a hospital or nursing home environment. The questions
12Health Issues Hospital Workers
P Age Sex Function
Hospital workers are more prone to the stress than other
1 21 F Nurse
occupation groups. [8] This increased stress could cause mental
2 21 F Assisted care Helper impairments [10]. Decreasing the amount of stress factors could
3 21 F Intern Nurse then further help improve the wellbeing of the hospital workers
4 19 F Nurse Student [10]. Also the oftentimes irregular sleep schedule due to the
5 33 F Hospital Host shifts of the hospital workers can cause an unhealthy lifestyle
[16]. There can also be a relation found between shift workers
6 62 M Team Captain (hospital)
and several disorders such as compromised pregnancy and
7 41 M Hospital Security
heart diseases. [9] A product that could help detect and prevent
8 57 M Hospital Security these health issues could have a great possible impact on the
9 22 F Patient Transporter wellbeing of Hospital and nursing home workers.
10 18 F Patient Transporter
11 37 M Patient Transporter
12 39 M Captain Logististics (hospital)
13 39 F Patient Transporter
14 44 F Patient Transporter
15 21 F Nurse
16 24 M Patient Transporter
Table 1: List of participants of the questionaire
Figure 4: Location of the ECCO Sensor module in their
Quant I/O project. Graphic by ECCO [6]
13Design process Creativity Techniques
Ideation Design
My goal was to first come up with as many different concepts
in the direction which would suit ECCO and my project the best.
Opportunities Techniques such as brainwriting were used to come up with as
many ideas as possible. Also by mindmapping the notes from
the meeting with ECCO I was able to come up with several ideas.
By having defined the design context it was possible to
Throughout brainstorming ideas I was able to keep in mind the
further explore the different design opportunities with the
persona I created as the target user for the product I would
current technology ECCO was currently trying to innovate
then further develop, so all concepts kept in mind the target
with, these ideas were reflected upon together with the
user. From the different concepts I then picked my favorite 10
experts of ECCO.
concepts to further explore based on their uniqueness and
their connection to ECCO.
MoSCoW-Analysis
MoSCoW-Analysis is a method often used for digital projects
QOC Analysis
to make sure that the product will meet the demands of the
To make a decision on which concepts would be better to
stakeholders [17]. That is why I have made a short MoSCoW-
continue exploring I decided to go with a QOC Analysis. I picked
analysis to make sure I meet the demands of the project. The
the most important values and demands of ECCO which I had
specific criteria are based on the discussions with ECCO, but
mapped out and also picked the goals I had myself for my Final
also my own goals for this project.
Bachelor Project, I then transformed these to the criteria of
the QOC analysis, each with their own weight based on their
importance. At each concept I then gave a score based on each
criteria, with the reasoning behind the score to stimulate critical
thinking about each concept. The five highest scoring concepts
were then picked to be further worked out in more detail.
Poster session
From the five highest scoring concepts I decided to explore the
concepts more in depth by making a poster per concept. Each
poster included a drawing of the concept to visualize the idea,
Figure 6: MoSCoW-Analysis chart
14the goal of the design, I also listed the design challenges of
each design and listed the benefits for the stakeholder ECCO.
Since I considered ECCO my most important stakeholder in this
project I wanted to make sure that the concept would also be
connected with their running projects. I went through all these
posters and marked all the positive and negative aspects of the
design. After this session I reflected on the different concepts
based on the positives and negatives and adapted the concepts
which resulted in three different concepts.
Proposed design directions
Using the three concepts resulting from the previous poster
session I made a proposal for ECCO with a detailed description Figure 7: QOC analysis with the different values graded on
of each direction and a reasoning why I came up with that the criteria
certain concept. The full proposal with detailed explanations
can be found in the appendix.
Actuator pack
The goal of the actuator pack was to design the interaction
and a physical prototype of an actuator pack. ECCO currently
has a sensor module which can be used to gather a bunch of
data from within the shoe, however, this interaction is mostly
focussed on the collection of the data. Having an actuator pack
similar to the sensor module acts as a device that gives direct
feedback to the user. This can help stimulate healthy behavior
and prevent the user from unhealthy habits by alerting them.
The actuator pack can also help gather more accurate data by
directly requesting the users for more user input on specific
events.
Figure 8: Poster session with the different concepts
15that would cost a lot of time for development and costs. ECCO
Non intrusive user-input device first wanted to prove the benefits of their own sensor before
Another possible direction was to solely focus on the users making something else physical accompanying the sensor.
personal input to enrich the data. By designing a device (in-shoe After some talks with the Head of Design we came to the
or external) the user will be able to directly interact with the conclusion that ECCO would like to see an app worked out in
data by for example indicating that they are tired at that certain one of the directions I proposed.
moment or feel pain somewhere. This helps to personalize the
analysis model to each specific user, making the analysis more New proposed design direction
accurate while providing the researchers with more data. Based on the feedback on the previous concepts I decided to
make a new proposal, the complete proposal can be found in
Bringing the sensor-data to the next level the appendix.
The current sensor technology ECCO has developed opens the
door to an enormous amount of data. This data, however, has Health app data insights
many other different possible applications. OLVG, for example, For this new concept the focus will lay on three key points:
can use this data in a smart scheduling platform by using the health, data and user friendliness. Meaning that the goal will
location data and the fatigue data. This direction was focussed be to stimulate healthy behavior in a user friendly way, while
on finding new applications (either an online platform or a utilizing data from the sensor module and data from user
physical device) which utilize the large dataset ECCO creates annotations.
with its sensors.
The environment (a busy workplace) in which the app will be
Expert feedback on the directions used helps give a focus on how the user experience should
Using the proposal I decided to get feedback from the Head be. People in a busy workplace are very invested in their work,
of Research, Head of Digital and Head of Design of ECCO. The which results in that they can tend to forget their own health
Head of Design was mainly interested in the concept where the while working. Since most people spend most of their time
sensor-data would be brought to the next-level. ECCO wasn’t at work it is very important that even at work they are able to
interested in developing the actuator pack further, since they maintain a healthy lifestyle. The new app will act as a motivator
already had plans for a similar product in the pipeline. The Head for this. Instead of only giving insights into the data the app can
of Digital was interested in the collection of data, however, a act as a complete experience for the user.
physical product was not directly interesting for ECCO since
These added new features should then be an extra motivation
16for the user to annotate their actions more, resulting in a larger make sure that everybody is actually on the same page with
amount of data which can be used to train the personalized expectations of the project and help to make clear agreements.
data-analysis models. In this meeting we decided to solely focus on finding a way
to gather more data from hospital and nursing home workers
The seamless integration of the features within the app should in the form of an app. The app would then be made based
for example stimulate the target group to find the balance on the current ECCO app, I would then get the C# files and
between standing and sitting. The app could analyse the would further develop the app in Xamarin Forms, a program to
behavior of the user to make personalized suggestions, fitting develop Android, Windows and IOS apps [18].
within the schedule and health of the user. The user of the app
should be delighted to open the app, the app should not only
be opened solely for the novelty effect, but actually be used ECCO collaboration
consistently over a longer period of time. Unfortunately ECCO decided to end the collaboration with both
of their projects with the TU/e immediately (my project and
The goal is to further develop the accompanying app for the the research project also within the Health squad). Due to the
ECCO sensor module to be able to function well in a high Covid-19 circumstances their collaboration with the hospitals
pressure work environment to increase the health of the was put on hold, meaning they could not further their research
workers, while taking into consideration their busy environment. in the hospitals. The boss of the contact person with ECCO (The
Head of Design) then decided that all people who worked on any
Feedback stakeholders related projects should stop working on those projects, which
For this proposal I also decided to take into account the is why ECCO didn’t continue the collaboration. I attempted
stakeholders, I sent this proposal to ECCO which was then to find a compromise to still be able to use the ECCO sensor
discussed internally. For the feedback I discussed the proposal Module and the connected ECCO app, however, the decision
with the Head of Design, he was overall excited about the was final and there was no other collaboration possible. This
proposal and told me that the Head of Research was also raised three challenges for me: getting a replacement for the
very excited about the concept. We agreed upon that I would physical hardware as a sensor module, not being able to use
develop the App experience further with ECCO, however, with the existing app and app analysis of ECCO and finding the target
more focus on the data collection instead of the stimulation of audience (hospital/nursing home staff) for the user testing and
a healthy workstyle. To discuss the further steps of the project I collection of data to analyse.
planned a meeting together with the people involved at ECCO
and Daniel Tetteroo, my coach for this project. This was to
17Design process three elements are kept in mind in my iteration to stimulate the
Iteration 1
behavior of more data annotations by the hospital and nursing
home personnel.
This iteration was to start exploring the different possible Microtasks
methods to increase the app experience, since I had no Based on my initial research within the user group of hospital
available sensors to incorporate yet I decided to solely first and nursing home staff I found that the user group is very little
focus on the actual app experience and design without the on their phone, most people indicated that they are less than
input of data and direct feedback. This iteration is the result three times per hour on their phone. Beside that they are also
of the previous research together with the target group and very occupied when working, however, it is still necessary that
stakeholders. the user can manually input data themselves. For this manual
data input I decided to go with microtasks, microtasks are very
Theory of planned behavior small tasks which are relatively easy to do and don’t take a lot
During my iteration I used the theory of planned behavior to of time [21]. The collaborative effort of multiple people doing
guide myself in picking the correct methods for implementing microtasks could help gather accurate data [22]. Microtasks are
into this iteration. The theory of planned behavior helps to better ideal for interruption-driven work environments [22], making
understand how to influence certain specific behavior, so in my it a perfect fit for hospital and nursing home personnel, who
case help promote the behavior of performing annotation tasks might be interrupted at any time while performing a microtask.
for the research. The theory of planned behavior focuses on I decided to design a data annotation method that would
three key elements: attitude, subjective norms and observed then take two annotations: Something about how they felt,
behavioral control [19]. Attitude meaning that when the attitude i.e. when they were tired or not tired at a certain moment, and
about a certain task is positive then the person will also more how sure they were about that annotation to be able to filter
likely perform this action. The subjective norms indicate that out annotations where the users are unsure about their own
when the people around you perceive an action as normal annotation, and so decreasing the uncertainty of the data
then you would also be more likely to perform that action. predictions models [23].
The observed behavioral control is when a person actually
has the confidence that they can perform an action and have Gamification
the necessary capabilities to perform that action [20]. All these In this iteration I decided to implement several proven
gamification methods. The goal of the gamification was to make
18sure that the users would actually enjoy using the app and keep Data insights
returning to open the app. It is shown that gamification can To make sure that the users understand the annotations better
help deliver more accurate data annotations while also making it is also important that the data is understandable for the users,
the annotations more engaging and rewarding [24]. Other the data should not be demanding too much attention or look
papers show that gamification elements such as a competition too complicated to overwhelm the users, this could then hinder
lead to more self assessments with nurses [25]. So based on the Theory of Planned behavior element that the users would
that I decided to incorporate a leaderboard which shows the think the task is too complex for them to complete and so not
different people from the department and how much they have continue with doing the tasks [20]. Having this personal data
annotated. This is also then connected to the Theory of Planned also helps to humanize the insights, which makes the users feel
behavior, when seeing other people go up in the leaderboard a personal connection to the data [27]. During the annotations
and seeing other people being active with annotating it also the users are then reminded of certain activities they did during
stimulates the people to keep annotating. the period of what the annotation is referring to, assisting them
in reminding their stress/fatigue levels or other feelings.
Helping others
Another thing to help stimulate the prototypes is the indication UI Design
that they are helping with the research. This ties back to the To explore the UI Design I decided to sketch out several different
theory of planned behavior where the goal is that the attitude possible designs with inspiration of already existing health
is positive about the task [20]. From the survey that I conducted tracking apps. Inspiration from for example Apple Health and
it showed that a lot of the people who work in the hospitals and FitBit was used in the explorative sketches. Using exploratory
nursing homes enjoy their work because they have the feeling sketching I explored different layouts for the app. Eventually
that they are helping people. By giving them the notification the UI Design was made in a minimalistic style design, to make
that they are helping research they might be more included sure that it would not be too cluttered and minimize cognitive
to annotate more, because they associate the annotations with distractions while using the app [28].
a positive thought (helping others). This is often also seen in
volunteer work, where the motivation of volunteering is based
on that they feel like they are helping other people [26].
19User testing
Interactive prototype
In this iteration it was key that the users would be able to test Your day: The ‘your day’ functionality was mainly focussed on
the different features and got a good idea how the features the users getting an immediate overview of their current day
would work in the app so that they could give feedback on with simplified data gathered from the sensors. This would
which features they would see to be useful and which features help to get a better grasp and understanding of their overall
they would not see to be useful when they are working in their day to help understand the data better and so giving better
work environment. To make this interactive prototype I decided annotations. This feature also acts as a motivator for people to
to use Adobe XD, a program to make interactive prototypes open the app frequently to keep up to date with their walking
for apps and websites [29]. This interactive prototype was then patterns.
available for access in the browser of their mobile phone of You’re helping: This feature helps to give positive feedback, it
user testers to mimic the app experience. gives the users a sense of purpose on why they are doing this
and stimulates positive reinforcement which helps motivate
Method the users further [30].
The goal of the usertesting this iteration was to find out the Quick annotations tasks: This overview is a quick way to access
opinion of the target users to the different features that I came the annotation tasks, it is clear how long the tasks take and
up with based on the literature and questionnaire. The test was what your progress is already within those tasks.
sent to 13 hospital and nursing home personnel who indicated Reminders: The reminder feature helps the users set reminders
after the previous questionnaire that they would be interested to specific times to open the app when they for example have a
in helping with future tests, in total I got 3 responses. The break or set times when they won’t want to be bothered by the
interactive prototype was used as described. Each user tester notifications when they are busy.
was instructed to go through each feature, giving qualitative Leaderboard: The leaderboard is part of the competition
feedback on each feature (what they liked, what they thought feature where the user can get insight into how well they are
could be improved and what they think is missing). All users performing compared to other users.
were requested to first play around with the app prototype to Annotation Screen: This is where the users will actually perform
get familiar with the context of each feature. The goal of the the annotations. In this screen they get a graph with an overview
app was explained and each feature was highlighted where it of their activity. The annotation screen has two questions: one
was placed in the app. The features tested were: with how the user feels about a certain topic (fatigue, stress
etc.)
20Results using the annotation section. She recommended instead of
From testing within the usergroup I have received feedback. asking fatigue levels at each annotation to use comparative
One of the participants suggested that the reminder feature questions. So asking compared to one point of time, how tired
as it is now is not really applicable in her everyday work were you feeling. Her discussion with other experts and her
experience, since her days are often unpredictable and setting own experience showed that that is a more understandable
those reminders herself is then not really possible because she and trustworthy way to get detailed annotations, since people
doesn’t know when she has a small break. The graphs as insight are more likely to remember if they were more tired at a certain
were received positively and one participant mentioned that it moment compared to another than the exact level of tiredness
would help her pay attention more on her movement between they were experiencing. Other than that Lieke was positive
departments. Features that participants suggested to add were about the experience of the app and the annotation process.
a step counter, but also to get insight when you walk and when I also attempted to get insight from the Head of Research of
you take rests. The ‘you’re helping’ feature was also received ECCO, unfortunately, he did not respond to my inquiries.
okay, however, one participant suggested that you should also
see the papers that might have been published using your
data to make it more interesting. One thing that was missing
according to a participant was a feature to add a ‘comment’
option where the user would be able to leave a comment about
abnormalities of their day, for example when they have new
shoes or something similar. As overall feedback the participants
called the app ‘innovative’ and ‘user friendly’.
Reflecting with expert
Since I wanted to also involve the stakeholders and get expert
feedback I decided to also demonstrate the interactive design to
Lieke de Mare, she could provide the perspective of a researcher
gathering data from shoe sensors. Her current research was in
fatigue, which was also one of the annotation options in the
prototype. She played around with the app and mainly gave
feedback on the annotation section and the data collected
21Design process
Iteration 1
Iteration 1 was mainly to explore different
features and to usertest these features
with the target audience.
Try this iteration
out yourself here
Figure 9: The annotation overview where Figure 10: The annotation screen, here
the user can see all the annotations and the users perform the annotations and
their process get insight into their activity at that time
22Figure 12: The
homepage of the first
iteration. Here you
can see the ‘Your day’,
Figure 11: Overview of all the designed ‘You’re helping’ and the
screens for the interactive prototype ‘Reminders’ features.
23Design process to give alerts when they walk too much, this would then act as
Iteration 2
a motivator for the users to open the app more and be more
personally involved with the app.
Based on the previous testing with the users and the expert Color coded insights
I made a new iteration in the same general direction as the When getting to know the everyday working day of the hospital
previous iteration. The app overall was well received so there and nursing home staff I learned that most people are very
was no reason to make very large changes to the concept, so rarely on their phones, and it is not accepted to be on the
this iteration again was an interactive version of the design of phone when with clients. It is then important to utilize the
the app. moments well when they are on the phone by giving only the
necessary information quickly. During the usertesting one of
Layout the participants indicated that it would be useful to know when
I decided to make the layout more compact, since during they are walking and when they take rest, this is also the main
personal testing I noticed that due to all the features the actual graph that I decided to go with. The activity of the day gives
annotations were pushed down outside the first view of the a lot of insights and helps get a clear overview of the day, by
screen, meaning that the user was required to scroll to see the color coding the parts of the activity where someone is walking,
annotation task well. This requirement to scroll is oftentimes resting or standing it helps the user get a greater understanding.
considered as an unsatisfying user experience [31], which is why Using colors is an effective way to visualize data and help the
I decided to change it. Also one of the core goals of this project data to be understood quickly and easily [32]. I decided to pick
is to stimulate more manual data annotations, which is why contrasting colors which are easily distinguishable and so be
it was important to make the changes so that the annotation quickly looked at and understood [27].
tasks were more pushed up so they were more in the view of
the user. Annotation Buttons
Since the annotations are such a crucial part of the app it is
Alerts important that all the information about the annotations is
In the testing with the target group one of the things the people visible. So I improved the annotation buttons by adding an
really enjoyed was getting the personal insights of their day. estimated time for the annotations, since the hospital and
One of the participants requested that a feature might be useful nursing personnel are often very busy it helps to show them
that a task might take only very little time. Also I took the
24progress indicator and moved that to a seperate space, so it is Privacy
more clear that it is not part of the title. One of the issues with the leaderboard was that not all people
would like to be on there with their personal name. This was
Annotation Screen also noted during the testing. Since I consider privacy to be a
Based on the discussion with the expert on the data gathering very important right I decided to add a function that would hide
of the research I decided to change the annotation questions your personal information from the leaderboards. I decided to
to a comparative system instead of a per time based annotation still include the score of the user, since even in anonymous
system. This means that I will first ask a question on for example leaderboards their score can still be a motivator to not be the
how tired someone is, and then ask comparative questions to ‘lowest’ annotator and compare themselves to the other users
how tired they are compared to the previous question. I also [33].
decided to not include a ‘certainty’ question, since this is an extra
action the user would need to perform and with the workload Testing the usability
of the target users it is prefered to only ask what is really One of the main goals of this iteration was to test the usability
necessary. With the added optional ‘add comment’ feature the of the app, so again I made a prototype using Adobe XD which
users can always then indicate when they are uncertain about was accessible online by going to a provided link. Since I had a
something or when the circumstances were out of the ordinary. lot of trouble finding participants who were hospital or nursing
home staff I decided to test this outside the user group. The
test group (4 participants) had no prior experience with using
Research overview the app and had not seen any designs beforehand. They were
To give the users more the feeling that they are actually helping each provided a link and requested to go through each page
to contribute to research I have expanded the ‘You’re helping’ of the app on their phone, during the process I was in direct
section of the app, now users can also get detailed information contact for any questions they might have. Afterwards they
about the research in which their data is used. For each paper were requested to give feedback on the usability, what they
that is published they then can also read the abstract or find would change about the experience and what they possibly
ways to learn more about that certain research. This again didn’t understand.
helps with the ‘Theory of Planned Behavior’, since the users will
regard the tasks more positively as they are seeing how they Results:
are helping specific research [20]. The overall results of the usability test was that the usability
was good, with some small notes on what could change
25and what could become better. One of the things that could (alerts when you are standing too much), because improve was that it was not clear for everybody that when this was a feature that the hospital staff seemed to you are doing the annotation the questions are automatically appreciate. In this case I decided that the needs of saved, one participant was worried that if she would click away the hospital workers were then more important than her answers would then disappear, this is important to improve the demands of the ex-client. since one of the goals of the microtasks is that the hospital nurses can quit any time then need. Another thing one of the participants noted was that it had a bit more of a ‘cluttered’- feel compared to the FitBit app. One of the participants also asked a question on why the app is in English, when the target audience would first be dutch hospital and nursing home personnel. Another participant requested the annotations to be placed more in view, since then it would seem more like an app for the annotations instead of getting the insights of the day. Reflecting using the MoSCoW-analysis When reflecting upon this iteration using the MoSCoW-analysis that I made before the first iteration I found that the app is mostly inline with the MoSCoW-analysis. However, I made the MoSCoW-analysis when my client was still ECCO, before they quit the collaboration. This means that some of the demands, such as ‘Not making health recommendations’ are not as crucial anymore. I decided to have limited health recommendations 26
Try this iteration
                                                                       out yourself here

Figure 13: The updated annotation   Figure 14: The added details for
                                                                                      27
screen                              research who is using the data
about the same data as the ECCO sensor did. Some products
Design process were unfortunately too expensive and would not borrow their
Final iteration and wearables for a student project. Eventually the closest to the
ECCO sensor that I could find was RunScribe, a sensor that
prototype tracked almost everything the ECCO sensor also tracked. To
further explore the possibilities of RunScribe I decided to
The final iteration was the iteration as it was presented at the ask some more in depth questions about the details of doing
demo day. This iteration is functional in combination with a research with their raw data. However Tim Clark, the founder
complex sensor, the experience is interactive by going to the of RunScribe, explained to me that their sensor could be very
website. The demonstrator is coupled to a database where difficult to work with using the raw data, and that exporting 5
all the annotations get sent to, to mimic the experience of minutes worth of data could already take more than an hour of
gathering data. The sensor data is analysed with Python and exporting time due to the 500Hz frequency they were using.
also sent to the database. This would be way too long for my project for immediate
interactivity. After I listed my requirements for the sensor Tim
Integration with the sensor suggested the MbientLab sensors. These would be able to still
The final iteration is the first iteration where I was able to track some of the features which the ECCO sensor tracked and
integrate a sensor to communicate with the app. The original would be able to stream the data correctly immediately. The
goal was to use the sensor ECCO was developing for their shoes lack of some features was unfortunate, however, due to the
in combination with their own app. I would then be allowed to time constraints was the best option. Also during my iterations
use their sensors in combination with the app and add features I already focused on only the activity of a person as a starting
upon the app to test with their hospital partners. However, point for the data, this could still be done by the MbientLab
since the collaboration stopped between ECCO and the TU/e sensors.
I needed to find a way to replace this sensor and app, while
still being able to provide an interactive prototype experience Before deciding to go with the MbientLab sensors I discussed
for the demo day and to validate my product at the end of the whether this sensor would also be useful for Lieke de Mare,
project. since she was doing her research and the sensor also needed to
be usable from a researchers perspective. Together we agreed
To find a replacement for the sensor I contacted several different this sensor was the best option and bought it. Throughout the
companies that manufacture wearables which would track project we agreed on certain weeks when someone would
28have the sensors and when the other person should have the database, the code can be found in the appendix.
sensors. This collaboration went smoothly.
Database
Technology choice For the database I decided to go with restdb.io, this is a SQL-less
The possibilities of different technologies to use to connect database which can be connected to with all sorts of different
the sensor with were diverse. Each option I considered to programming languages. I also considered other options such
eventually find the best working approach to have a working as the Data foundry, however, restdb.io would work perfectly
prototype. One of the things I needed to decide upon was what in the scenario I was going for and had previous experience
programming language I wanted to use for the connection. The working with it so I decided to go with this database. During
main options I could pick between were to directly couple it my testing, however, I came across some issues with uploading
with Python, C# or Swift. Coupling it with Python or C# was a the plots of the Activity in Python. The instructions provided by
complex process with limited documentation. To get it working restb.io were not working and after several different attempts I
properly this method also needed a connection to a computer, decided to go with a different image hosting service to host the
or in the case with C# also possible in an app. Swift had some images, to prevent large time delays.
example projects, however, the projects did not compile or
function correctly when tested. With all these options the risk Image Hosting
was that I would need to spend a lot of time programming For the image hosting I decided to go with Imgur, Imgur
and bug fixing to get a stable version. That is why I decided to already had an API developed for uploading images directly
explore more options which were more certain to work in the from Python [34]. This made it very easy to upload images and
limited timeframe. The sensors already had an app which they then getting the URL of the uploaded image to upload to the
could be connected with, however I could not directly access Restdb.io database. The only limitation is that there is a limit
the data from this app. However, I discovered that the windows to how many images are being able to be uploaded a day,
version of the app stored the data in csv files and kept updating however, since I only have 2 sensors this limit would never be
these files when it was streaming data. The benefit of using the reached. However, during testing I discovered there was still
stock app was that I would easily be able to change the settings some limit which prevented some images from uploading and
of the sensors, without programming that myself. Which is why crashing the program. I prevented stumbling across this error
I decided to use the Metabase app with the local updated files by uploading the images less frequently, but also by adding
for getting the raw data. I picked Python as the programming code to prevent the program from crashing when the image
language to analyse the data, since this is the most used tool uploading failed.
for data analysis and was the easiest to implement with the
29The app amount of movement of the sensors. To make the computation To make the interactive version of the app I decided to make faster and filter out very small movements I decided to make it in HTML/CSS/Javascript jQuery. Unlike native options such a function which analyses each 4 seconds of activity and gives as Swift or Java, this option would be accessible for all types this a score. The function is a variant of a logistic function which of phones (IOS/Android/Windows phone), this was important maps all data points between 0 and 1, this helps to prevent for me because I did not want to be limited to a certain type of the graph from being influenced by very large peaks (when for phone. The usertesters could then use this app by accessing example something went wrong with the sensor). The complete the website, so they do not need to download anything to their Python code can be found in the appendix. To test if the method phone. The HTML/CSS was generated using Adobe XD, which worked I planned a 45 minute test, which included 4 different I could then adapt to make an interactive functioning app. levels of activity with 5 minutes rest in between, the results Javascript was used to make sure that the data was uploaded to from this test can be seen in figure 13. the database, but also so people could click easily on answers and get their most current activity graph and data. Hosting All the files were hosted online and accessed by a URL, the files were uploaded using FileZilla to the hosting and the hosting itself was done by Vimexx. Analysing and transforming data To make sure I could display an activity chart in the app of the final prototype I decided to use the acceleration data (settings: 50hz, 8g). The Mbientlab sensor however, only collects the raw data, which I needed to analyse to find a way to transform the raw data to activity data. I decided to test this by doing Figure 15: Activity chart for different levels some testing with the sensors, while observing changes in the of activity (green is considered as resting, raw data values. From these values I could then see that the blue as walking and orange as running) size of the difference between two values corresponds to the 30
Figure 16: The connection between the
different technologies                31
Figure 17: The
                               annotation data
                               collected on the restdb.
                               io database

     Figure 18: A Python
     code snippet of the
     transforming of the raw
     data to activity data
                               Figure 19: A Javascript
                               code snippet from the
                               gathering of data from
                               the restdb.io database

32
Figure 20: U-MOVE the final demonstrator
together with the sensor module Visit the online app Watch the video
demonstrator here
33
demo here
(MbientLabs sensor photo by MbientLabs)Design process Eventually I decided to go for teachers, since these were one
Validation
of the few occupations which were still available who shared
some of the key characteristics of hospital and nursing home
personnel. Teachers are also very little on their phone, since
it is not acceptable to use the phone when helping students.
The original plan for the validation of the final design was to test Helping students could be seen as a similar activity as helping
it together with the hospital partner of ECCO, OLVG Amsterdam. patients as the participants in my first survey described. Also
The product would then be tested for a week with ten user teachers walk and stand around a lot in their classes, which is
testers, five without the additions of the app I would make as similar to the nurses.
a control group and five with the additions. However, since the
collaboration with ECCO stopped this method of validation was The focus of the validation was mainly to test two key aspects
not possible anymore. A challenge was to find a way to still of the design: the moments the users would annotate the
test the final product with the target audience. I have reached process and the understandability of their own personal data
out to hospital personnel who participated in previous tests, to assist in the annotations. To test this the participants would
however, no one was able to test in the hospital environment. place the feet sensors around their ankles, this data would
Instead of hospital personnel I then decided to focus on nursing then be sent to a computer in the proximity of the sensors
home personnel, for this I contacted nursing homes such as which then transforms the data to more understandable data
Careyn, Bartholeus Gasthuist and AxionContinu. None of these for the user. The participant would then get an insight in their
nursing homes were interested in helping. As another solution data by checking the website (www.umove-app.nl) and filling
I contacted Adelante Zorggroep, which has worked together in the annotations. The participants would have the sensors
multiple times with the Health squad as a client, however I did around their ankles for half a day and were requested to do
not get a response from them. the annotations throughout their day. Each annotation would
be sent to the database with information about the annotation
For the validation I then considered different occupation (time, duration, choices, etc.). Afterwards a small interview
alternatives to nursing home and hospital personnel (teachers, would be conducted by asking the participant to describe their
supermarket personnel, small clothing shops personnel), day using the activity charts in the app, the participants would
because due to the Covid-19 situation it seemed very difficult also be asked to describe the moments when they were filling
to organize and test the product in a hospital environment. in the annotations.
34Unfortunately at the time of the validation period the schools adding the comments he would then wait till the end of the
were closed due to Covid-19, however before the closing I was day, instead of doing the tasks throughout the day.
able to test the product with one teacher. Due to the lockdown
I was not able to prepare and test the product at a different In home environment
occupation, which is why I decided to test the understandability The final product was also tested in the home environment due
of the personal activity charts. I tested with two other participants to Covid-19. With two participants (M, 63 & F, 65) the product
in a home environment. Since the context and activities in a was strapped for a few hours to the ankles, with an interview
home environment were too different compared to the activities afterwards. The first participant was able to describe all activities
of hospital and nursing home personnel, I decided to only focus well in the graph provided activity charts, especially the active
on the rememberbility of the activities using the activity charts activities were able to be clearly described. The second
and not on the context of the annotation times. participant was able to pinpoint the ‘rest’ moments and using
the moments of rest as a comparison point she was able to link
Findings other activities to the overview. Both participants were not able
In a teaching environment to give the time of certain activities, however, they were able
After the testing the participant (M, 22, Teacher Highschool) to point to the activities on the chart. While the participants did
the participant was able to describe his day using the activity not need to know the exact times to know what activities they
chart in great detail (when he was walking to somewhere did indicate that it would give them more confidence when
else), however, he was not able to describe all the peaks in the time is more clearly shown. The difference in the amount
activities. The annotation process was easy to understand, of steps and distance were especially useful for participant 2,
the only suggested improvement was the sometimes long it helped her get a clear insight into how active she was. For
loading times (±5 seconds). The participant annotated at three the first participant these extra insights were not used. Both
different moments of the day, the first moment was after the participants would like to see more added insights, the first
participant instructed the students to do something on their participant suggested adding heart rate and maybe breathing
own, the second moment was when the participant had a and the second participant would like to see the location, since
break between classes and the third moment was when he had some locations were ‘rest locations’ and others were ‘active
2 minutes of time in between explaining things to individual locations’, this would then help to couple certain activities and
students. In all annotations the participant decided to not add help assist in the annotations.
extra comments, since that would, according to him, feel too
much ‘as a chore’. He indicated that with larger tasks such as
35You can also read