Online urban-waterlogging monitoring based on a recurrent neural network for classification of microblogging text - Natural Hazards and Earth ...
←
→
Page content transcription
If your browser does not render page correctly, please read the page content below
Nat. Hazards Earth Syst. Sci., 21, 1179–1194, 2021
https://doi.org/10.5194/nhess-21-1179-2021
© Author(s) 2021. This work is distributed under
the Creative Commons Attribution 4.0 License.

Online urban-waterlogging monitoring based on a recurrent
neural network for classification of microblogging text
Hui Liu, Ya Hao, Wenhao Zhang, Hanyue Zhang, Fei Gao, and Jinping Tong
Business School, Changzhou University, Changzhou, 213159, China

Correspondence: Jinping Tong (tjp@cczu.edu.cn)

Received: 11 October 2020 – Discussion started: 16 November 2020
Revised: 2 March 2021 – Accepted: 2 March 2021 – Published: 6 April 2021

Abstract. With the global climate change and rapid urban-         prediction model. Take flooding as an example: we expect
ization, urban flood disasters spread and become increas-         that the model can integrate various data resources, includ-
ingly serious in China. Urban rainstorms and waterlogging         ing weather forecasting, historical waterlogging events, and
have become an urgent challenge that needs to be moni-            hydrogeological data, to predict the occurrence of flooding
tored in real time and further predicted for the improvement      and timely remind the residents to prepare for the disaster,
of urbanization construction. We trained a recurrent neural       thereby reducing the loss and achieving the early warning
network (RNN) model to classify microblogging posts re-           function.
lated to urban waterlogging and establish an online moni-            Existing methods for early warning of flood disasters gen-
toring system of urban waterlogging caused by flood dis-          erally use meteorological and hydrological data as the basis
asters. We manually curated more than 4400 waterlogging           of construction of forecasting models. Researchers build hy-
posts to train the RNN model so that it can precisely iden-       drological models that take into account various factors and
tify waterlogging-related posts of Sina Weibo to timely de-       simulate the occurrence, progression, and consequence of
termine urban waterlogging. The RNN model has been thor-          flood disasters (Tawatchai and Mohammed, 2005; Yu et al.,
oughly evaluated, and our experimental results showed that        2015; Anselmo et al., 1996; Lima et al., 2015). Subsequently,
it achieved higher accuracy than traditional machine learning     multilevel thresholds corresponding to different warning lev-
methods, such as the support vector machine (SVM) and gra-        els are determined based on the simulation result of the
dient boosting decision tree (GBDT). Furthermore, we build        hydrological models. Also, some scholars have developed
a nationwide map of urban waterlogging based on recent 2-         methods for early warning of flood disasters. For example,
year microblogging data.                                          Xiao et al. (2019) developed a flood forecasting and early-
                                                                  warning method based on similarity theory and a hydro-
                                                                  logical model to extend the lead time and achieve dynamic
                                                                  rolling forecasting (Xiao et al., 2019). Kang et al. (2019)
1   Introduction                                                  proposed a flood warning method based on dynamic critical
                                                                  precipitation (Kang et al., 2019). In order to meet the actual
Due to climate change and rapid urbanization, global flood        need of early flood warning, Liang et al. (2019) constructed
disasters have become increasingly frequent and serious,          a new “grade-reliability” comprehensive evaluation of the
leading to traffic jams, environmental pollution, travel and      accuracy of early flood warning. The method combines the
health risks for residents, etc. (Wheater and Evans, 2009;        grade prediction accuracy evaluation criteria and uncertainly
Kuklicke and Demeritt, 2016; Sofia et al., 2017). Therefore,      analysis method to evaluate the reliability of the predicted re-
it is crucial to address the problem of early warning and         sults (Liang et al., 2019). Also, Liang (2019) discussed how
monitoring of flood disasters for the sake of life and prop-      to determine the early flood warning and forecasting time by
erty safety. However, it is difficult to predict natural disas-   use of rising-rate analysis on the basis of the flood rising rate
ters and emergencies, such as earthquakes and flooding, as        changing over time in historical data (Liang, 2019).
we usually do not have enough data to train an effective

Published by Copernicus Publications on behalf of the European Geosciences Union.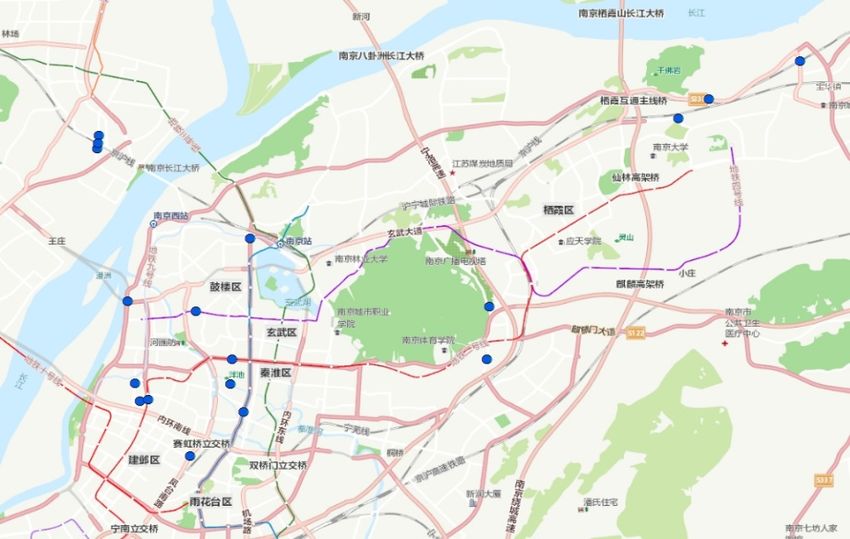
1180                               H. Liu et al.: Online urban-waterlogging monitoring based on recurrent neural network

    The rapid development of mobile internet and smart-               ing method for effective classification of flood-related feeds
phones has boosted various social media, such as Weibo and            in new locations (Singh et al., 2020).
Twitter. Weibo is run by the Sina Corporation in China, and              In this paper, we employ text classification of Weibo posts
it is similar to Twitter. A Weibo post contains the fields such       to identify urban waterlogging caused by flood. By manu-
as user ID, user name, microblog content, posted time, etc.           ally collecting more than 4400 waterlogging-related Weibo
Some posts also include pictures and video. In fact, Weibo            posts from 2017 to 2018, we built a gold-standard data set
has become very popular among Chinese people, and ac-                 to train a text classification model. We tested three popular
cordingly it has become an important information source of            models, including a recurrent neural network (RNN), sup-
flooding and natural disasters (Robinson et al., 2014). Some          port vector machine (SVM), and gradient boosting decision
researchers have explored social media to extract information         tree (GBDT), and found that the RNN achieved the best
about disasters. For example, de Bruijn et al. (2019) proposed        performance, evaluated on an independent test set that con-
a database for detecting floods in real-time on a global scale        tains 400 Weibo posts (positive and negative) of 2019. Fur-
using Twitter. This database was developed using 88 million           thermore, we built a nationwide map of urban waterlogging
tweets, from which they derived over 10 000 flood events              based on recent 2-year microblogging data and a monitoring
(de Bruijn et al., 2019). Cheng et al. (2019) used Sina Weibo         system based on the WeChat applet that will alert the user via
data to reveal the public sentiments to natural disasters on          voice alarm when he or she approaches a waterlogging point.
social media in the context of East Asian culture. The Pear-             To the best of our knowledge, this is the first manually val-
son correlation between information dissemination and pre-            idated and the largest data set of Weibo posts related to urban
cipitation was analyzed, and important accounts and their in-         flood deposits, which is ready for building a text classifica-
formation in social networks were determined through visual           tion model to identify Weibo posts that truly report water-
analysis (Cheng et al., 2019). Barker et al. (2019) developed a       logging events. Also, we are the first to build a nationwide
prototype of a national-scale Twitter data mining pipeline for        map with more than 6000 waterlogging points, which covers
improved stakeholder situational awareness during flooding            most cities in China. Furthermore, the RNN model trained
events across Great Britain by retrieving relevant social geo-        in our data set can precisely identify flood deposits via on-
data, grounded in environment data sources (flood warnings            line Weibo classification, and our monitoring system based
and river levels) (Barker et al., 2019). Wang et al. (2012) ana-      on the WeChat applet would effectively benefit users by re-
lyzed the subject words and user sentiments of the earthquake         ducing the risk and loss caused by flood.
events based on the week-long discussion on Sina Weibo af-
ter the earthquake in Japan (Wang et al., 2012). Zhang and
Wang (2015) used the Shanghai Bund stampede incident as               2     Materials and methods
an example, according to the response time, response speed,
                                                                      The overall framework of our method is shown in Fig. 1.
microblog contents, and microblog interaction of the govern-
                                                                      There are four steps to build the RNN-based text classifica-
ment microblog after the emergency, to analyze and evaluate
                                                                      tion model of Weibo posts for monitoring urban flood wa-
the information release and response ability of the govern-
                                                                      terlogging. First, we collect 2017–2018 Weibo posts and get
ment in an emergency. Some concrete ways and suggestions
                                                                      more than 70 000 posts after deduplication. After Chinese-
for the government to make information release more effec-
                                                                      word segmentation and removal of stop words, we build fea-
tive were put forward (Zhang and Wang, 2015).
                                                                      ture representations of each Weibo post based on word vec-
    Text classification is a hot topic in the field of natural lan-
                                                                      tor space and the word2vector model. Next, three popular
guage processing (NLP) (Hu et al., 2018; Kim, 2014) and
                                                                      text classification models are trained and tuned for their re-
has been widely used to identify important information of
                                                                      spective parameters, and their performances are evaluated on
interest from social media. For example, Wadawadagi and
                                                                      an independent test data set that is manually collected from
Pagi (2020) investigated the severity of disaster events from
                                                                      2019 Weibo posts.
microblog messages during natural calamities and emergen-
cies using convolutional neural networks (CNNs) and recur-            2.1     Data sets
rent neural networks (RNNs). Their work employed a joint
model to combine the features of CNNs with RNNs, taking               2.1.1    Data sources
account of the coarse-grained local features generated via
CNNs and long-range dependencies learned through RNNs                 The Weibo posts were obtained using Sina Weibo applica-
for analysis of small text messages (Wadawadagi and Pagi,             tion programming interface (API). To exclude completely ir-
2020). Also, Singh et al. (2020) investigated the problem of          relevant posts, we downloaded only the Weibo posts includ-
localization using the social sensing model (Twitter) to pro-         ing the keywords “ ” or “        ” (drowning or waterlogging
vide an efficient, reliable, and accurate flood text classifica-      in Chinese). All microblogging text was saved in a comma-
tion model with minimal labeled data. They proposed per-              separated values (CSV) file to form a data table, including the
forming text classification using the inductive-transfer learn-       issuer, microblogging text, post time, etc. We found that there
                                                                      were some posts with attached coordinates. However, not ev-

Nat. Hazards Earth Syst. Sci., 21, 1179–1194, 2021                                    https://doi.org/10.5194/nhess-21-1179-2021
H. Liu et al.: Online urban-waterlogging monitoring based on recurrent neural network                                      1181

Figure 1. Illustrative diagram of our method framework.

ery post had attached coordinates because the GPS function        2.1.3   Localization of flood deposits
is often turned off by users (de Bruijn et al., 2018).
   For the sake of geographical localization of urban-            First, the Weibo posts that contained words like “certain
waterlogging points from the content of Weibo posts, we           community” and “highland” were excluded as the location
also downloaded the catalog of nationwide communities of          of the flood deposits mentioned in these posts was difficult to
307 cities in China, including community name, geographi-         determine.
cal location, floor area ratio, greening rate, and other infor-      Second, most posts have no attached coordinates, and
mation, from a famous housing website https://www.anjuke.         some posts related to urban waterlogging actually specified
com/ (last access: 1 February 2020) in China. Each city in-       the locations of the flood deposits in the text instead of the
cludes an average of 1500 communities.                            coordinates attached to the posts. For example, the post “In,
                                                                  Xingqing District, in Yinchuan city, on a section of Shanghai
2.1.2   Data cleaning                                             Road (Jinning Street to Fenghuang Street) the road surface
                                                                  water was more serious because of the heavy rain” speci-
Weibo posts have a large number of repetitions due to its
                                                                  fied that the waterlogging occurred on Shanghai Road in the
commenting function with the forward of original text and
                                                                  text of this post. We extracted the terms about communities,
image content. A hot post may have been commented many
                                                                  roads, and orientation from the posts. Subsequently, we used
times, but the main body of these Weibo posts is the same.
                                                                  the catalog of communities of 307 cities in China to match
Another case is that the “@” (retweet) function also leads to
                                                                  these terms so that we could determine the geographic lo-
many duplicates. We removed duplicates by using a string
                                                                  cation of the flood deposits reported via these Weibo posts.
match pattern that compared a number of leading characters
                                                                  As a result, we cannot determine the location of the flood de-
of two posts. For example, if the first 15 characters of two
                                                                  posit using coordinates attached to the post. The localizations
posts were same, they were considered to be duplicates, and
                                                                  of the waterlogging were done based on the textual content.
kept only one.
                                                                  For this purpose, we have not dealt with two problems: one
   We supposed that downloaded posts stated the fact that
                                                                  was that a community name contained the microblog over-
waterlogging events occurred in some places. However, in
                                                                  lapped with other communities; namely, two or more com-
real life, more complex situations do occur, such as some
                                                                  munities had the same name but were located in different
places with heavy rainfall but not flooding, indicating that
                                                                  cities. The other was that the communities mentioned were
local drainage infrastructure and dewatering facilities work
                                                                  not included in the catalog. For both cases, we resorted to
well, and the residents were not threatened by flooding. On
                                                                  manual matching and deduplication. We manually checked
the other hand, many Weibo posts were actually irrelevant
                                                                  the communities with duplicate names in different cities to
to flooding and waterlogging. For example, many posts con-
                                                                  ensure that the flood deposits were accurately located. Also,
tained the Chinese keywords for drowning or waterlogging
                                                                  if a post referred to a certain city not included in the cat-
mentioned above but discussed some diseases such as “hy-
                                                                  alog, we manually identified the waterlogging locations by
drocephalus”, “knee dropsy”, and so on. Such Weibo posts
                                                                  exploiting the community names or the coordinates attached
had nothing to do with our task. To exclude these specious
                                                                  to the post.
posts, we manually marked each post with a positive or neg-
                                                                     Finally, we deleted duplicate posts that had the same text
ative label based on whether the content of the posts was re-
                                                                  and same location. If their content was different, we would
lated to urban waterlogging.
                                                                  keep all, even if their location was same. For example, we
                                                                  have two posts: (i) on the morning of 12 May, the reporter

https://doi.org/10.5194/nhess-21-1179-2021                                Nat. Hazards Earth Syst. Sci., 21, 1179–1194, 2021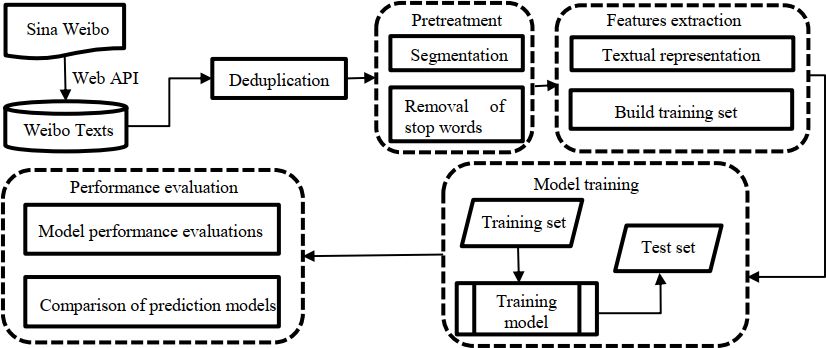
1182                                    H. Liu et al.: Online urban-waterlogging monitoring based on recurrent neural network

Table 1. Examples of Weibo posts related to urban flood deposits.

 Weibo content                                                  Time       Province   City       Location
 #Community Work# Yesterday’s heavy rain caused               5 May 2017   Jiangsu    Nanjing    No. 317, Gongnong new village
 water accumulation around no. 317 in Gongnong new
 village, causing inconvenience for residents wanting
 to travel. We asked the dredge personnel to go to the
 residence to help solve the waterlogging. Today, we will
 return to visit the ground again, and there is no water
 on the ground. Nanjing, Jianning Road. Note: Nanjing,
 Jianning Road, is the location of the Weibo user.
 #Nanyun side things# At about 07:00 LT on 3 May, a           5 May 2017   Sichuan    Nanyun     Gaodu Road, Gaoping District
 bus carrying about 30 passengers was trapped by water
 on Gaodu Road in Gaoping District. The situation was
 very critical. The city’s public security fire detachment
 special duty squadron dispatched immediately after
 receiving the alarm, only taking a dozen minutes to
 rescue all the passengers trapped in the car. At 07:46 LT,
 as usual, the driver, Li Lin (pseudonym), was driving
 the no. 32 bus along Gaodu Road in Gaoping District.
 It was raining heavily, and because it was time for
 work and school, there were more people on the bus,
 about 30 people. When the car reached the middle of
 Gaodu Road, it suddenly broke down and was trapped
 in water. Li Lin made a quick decision to dial “110” for
 help. The city public security fire detachment special
 duty squadron, after receiving the alarm, quickly sent
 a rescue fire truck, and seven officers and men rushed
 to the scene. After the scene investigation, the bus was
 trapped in 60 cm of water; the passengers could not get
 off, although the rain persisted, and rescue was urgent.
 The scene commander immediately ordered the rescue
 of the elderly and children as a priority. Officers and
 men put up a rescue channel with their own bodies from
 the door to the roadside flower place. After more than
 10 min of tense rescue, the 30 people trapped in the car
 were safely transferred.
 #Jiujiang side things# [In Jiujiang Balihu new district,     5 May 2017   Jiangxi    Jiujiang   Jiujiang Bali Lake new district Tonghu Road railway
 on Tonghu Road, after rain water more than 100 m
 long, two vehicles in the water broke down.] On the
 night of 3 May, rainfall caused different degrees of
 water to appear in some sections of Jiujiang city. At
 about 08:00 LT on the 4th, a reporter passed under the
 Tonghu Road railway bridge in the Balihu new district
 of Jiujiang and found more than 100 m of water in the
 section and two cars stalled in the water. The reporter
 saw a small white car with a non-local license plate and
 a tricycle stalled in the water. A lot of passing vehicles
 turned around to drive, and an off-road vehicle with a
 higher chassis and a bus were wading through the water.
 #Live broadcast of Putian# An internet user in Hanjiang      6 May 2017   Fujian     Putian     Hanjiang Walmart at the gate of the red street lamp
 who slept late revealed that at the traffic light of the
 Walmart gate of Putian Hanjiang, near the Minzhong
 aquatic products, there was water as soon as it rained.
 This does not affect driving, but it affects nearby stores
 and pedestrians. Finding Dakang is the best solution.
 What do you think, Yuanfang? #Life in China#

Nat. Hazards Earth Syst. Sci., 21, 1179–1194, 2021                                               https://doi.org/10.5194/nhess-21-1179-2021
H. Liu et al.: Online urban-waterlogging monitoring based on recurrent neural network                                                                          1183

Table 1. Continued.

         Weibo content                                                                 Time       Province    City      Location
         [In Fuzhou Jinshan, nine “gold” word roads collapsed                        6 May 2017   Fujian      Fuzhou    Jinrong North Road, Marong community
         in many places.] On 28 November, Ms. Lin, who lives
         in the Ma Rong community of Jinrong North Road,
         Fuzhou, reported that the area from Jinrong North Road
         to Jinzhen Road was seriously damaged, and many
         places collapsed. The rain in Fuzhou in the past 2 d
         has caused serious water accumulation on the ground,
         creating difficulties for pedestrians and vehicles. She
         called on the relevant departments to repair the roads
         as soon as possible.
         #Today morning# [Heavy rain in Nanning. These places                        7 May 2017   Nanning     Nanning   Under Wuyi railway bridge
         can “see the sea”! Warning: the rain will continue.]
         This afternoon at about 13:00 LT, it rained heavily in
         Nanning. I do not know whether there are partners who
         are drenched. This rain is really capricious. It will rain
         as soon as I say. At 14:00 LT in the afternoonyesterday,
         an unexpected thunderstorm disrupted the pace of life
         of the people of Nanning. Affected by the heavy rain,
         some sections of Nanning’s urban areas have become
         waterlogged. There is deep water accumulation at the
         bottom of the Wuyi railway bridge, the bottom of
         Shajing railway bridge, and the bottom of Yonghe
         bridge on Jiangnan Avenue, reaching 30, 30, and 40 cm
         respectively. After emergency drainage, normal traffic
         was basically resumed at 18:00 LT.
        Note: original Chinese version of the text can be found in the Supplement.

learned from the Nanning traffic police detachment that be-                                       cludes 4451 positive samples (labeled as 1) and 246 341 neg-
cause of the rainy day, surrounding roads leading to Pingle                                       ative samples (labeled as 0).
Avenue were partially flooded, and (ii) at present, there has
been water accumulation in some sections of Yinhai Avenue,                                        2.2     Extract feature vectors and construct training set
Ruihe Jiayuan, and Pingle Avenue; pedestrians and vehicles
are requested to please pass carefully. We kept both posts. If                                    To train a text classifier, it is necessary to transform a Weibo
the content of two or more posts was the same, we kept only                                       post, which typically is strings of words, into a feature vector
one post. In total, we obtained 4451 Weibo posts that were                                        suitable for classification tasks. The first step of preprocess-
successfully attributed to urban flood deposits. Some exam-                                       ing Weibo posts included Chinese-word segmentation and
ples are shown in Table 1.                                                                        removal of stop words. Thereafter, we constructed a bag of
                                                                                                  words by extracting unique words in the training set and then
2.1.4      Selection of negative samples                                                          built feature representations of each Weibo post based on
                                                                                                  word vector space and word2vector model.
The positive samples were exactly those posts that included
both locations and waterlogging. The negative samples con-                                        2.2.1    Data preprocessing
sisted of all remaining posts, including those irrelevant to wa-
terlogging keywords as well as the posts with waterlogging                                        Because the Sina Weibo posts are written in Chinese, the
keywords but without specific locations in the text. For exam-                                    text does not have a natural separator between words. There-
ple, the posts that actually discussed diseases, such as hydro-                                   fore, it is necessary to perform Chinese-word segmentation
cephalus, knee dropsy, and so on, were regarded as negative                                       on Weibo posts, which is actually a basic process in Chinese
samples.                                                                                          natural language processing. We used the Jieba tool to seg-
   In addition, it is worth noting that a huge number of posts                                    ment words of Weibo posts.
irrelevant to waterlogging actually included a lot of location                                       There were many common auxiliary words, prepositions,
names, and these posts were used as negative samples to train                                     and so on in Chinese, such as “ ” (of) and “ ” (in),
the classifier. So, we believed that the classifier could actu-                                   which should be removed with the help of a dictionary
ally learned the waterlogging-related features of posts. Dur-                                     of stop words. In the word-base retrieval system, words
ing the selection of negative samples, the positive samples                                       with high frequency but without retrieval significance
were excluded. Finally, we built a training data set that in-                                     are determined as stop words. We completed this task

https://doi.org/10.5194/nhess-21-1179-2021                                                                 Nat. Hazards Earth Syst. Sci., 21, 1179–1194, 2021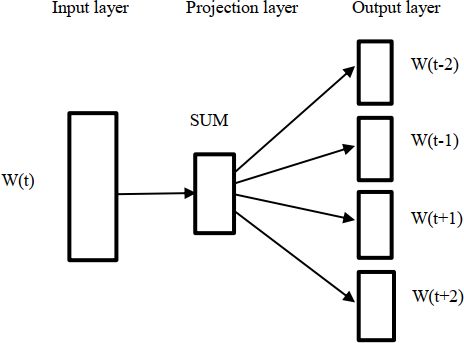
1184                             H. Liu et al.: Online urban-waterlogging monitoring based on recurrent neural network

by exploiting the stop word list released by the Harbin
Institute of Technology (Guan et al., 2017), which is a
widely used stop word catalogue. Also, many words were
useless to our task but appeared in the Weibo posts, such
as “ ” (video), “ ” (Weibo), etc. These words were
also added to the stop word dictionary so as to remove
such words from the Weibo posts. For example, for the sen-
tence “                                                   ”
(There was heavy rain in Kunshan yesterday; the new
city domain was flooded, and the house prices were more
expensive than the surrounding flooded communities. It
is really naked irony!). After Chinese-word segmentation
and removal of stop words, the result was as follows:
“                                                 ” (Kun-         Figure 2. Skip-gram model.
shan | Yesterday | Heavy rain | New city | Domain | Flooded
| House price | Than | Surrounding | Flooded | Community |
Expensive | Naked | Irony).                                       vector representation of this post. This paper uses the Tfid-
                                                                  fVectorizer in the scikit-learn Python package to calculate the
2.2.2   Feature representation                                    TF–IDF value of each word of Weibo posts. According to the
                                                                  TF–IDF value of words, the first 5000 words were selected
The purpose of feature representation is to encode a nu-          to construct the dictionary, and subsequently each post was
meric vector that represents the content of a Weibo post.         converted into a 5000-dimensional vector.
We considered the two most popular methods, TF–IDF (term             The word2vec model exploits the idea of deep neural net-
frequency–inverse document frequency) and word2vector.            works to simplify the processing of text content into vector
TF–IDF is the most popular term-weighting scheme for              representation in a K-dimensional space, and the similarity
information retrieval and data mining. The word2vector            in a vector space can be used to represent the semantic asso-
models the context of words and the semantic relation-            ciation between words (Mikolov et al., 2013). The word2vec
ship between words and context and maps words to a low-           model takes as its input a large corpus of text to produce a
dimensional real-number space to generate the correspond-         vector space and assigns each unique word a distributed rep-
ing word vectors (Wang et al., 2018). This paper uses both        resentation in the space.
TF–IDF and word2vector methods for feature representa-               We used the Gensim library (Gensim, 2020), which takes
tions of Weibo posts. TF–IDF was used to build feature vec-       as input the urban-waterlogging-related Weibo posts, to train
tors prepared for input into the SVM and GBDT classifiers,        a 100-dimensional word2vector model with the skip-gram to
while word2vector was used for the RNN, SVM, and GBDT             obtain the vector representation of each word. The structure
classifiers.                                                      of the skip-gram model is shown in Fig. 2. Its underlying
   The TF–IDF scheme is a statistical method employed to          rationale is to predict the context given a certain word. The
evaluate the importance of a word in a document. TF is the        specific calculation method is
word frequency, formally written as tf(t, d), which means
the frequency of the term t appears in the document d and         Wt = Wt−c , . . ., Wt−1 Wt+1 , . . ., Wt+c ,                (2)
reflects the correlation between t and d. IDF is the inverse
document frequency, formally written as idf(t), which repre-      where Wt is the current word, and c is the size of the win-
sents the quantification of the term distributions in a collec-   dow. After learning with a large corpus of Weibo posts,
tion of documents. The commonly used calculation method           the weights were the corresponding vector representation for
is log( nNt + 0.01), in which N represents the total number of    each word to train the RNN model (Feng and Sester, 2018).
documents, and nt represents the number of documents in
                                                                  2.2.3   Undersampling
which term t appears (Xiong et al., 2008). TF–IDF represents
the importance of relevant terms in the document space. The       Our whole data set contains 246 341 negative samples and
calculation method is as follows (Salton and Buckley, 1998):      4451 positive samples. As the number of negative samples

                           N
                                                                 intensively surpasses that of positive samples in the training
w(t, d) = tf(t, d) · log      + 0.01 ,                      (1)   data set, the imbalance often leads to an ill-structured deci-
                           nt
                                                                  sion boundary of classification that is overwhelmed by the
where w(t, d) represents the weight of term t in document d.      majority class and ignores the minority class (Chawla et al.,
   The larger the TF–IDF of a term, the higher the impor-         2004). For example, in a case of an imbalance level of 99, a
tance in the document. By calculating the TF–IDF value of         classifier that minimizes the error rate would decide to clas-
each word in a Weibo post, we can construct a real-value          sify all examples into the majority class to achieve a low error

Nat. Hazards Earth Syst. Sci., 21, 1179–1194, 2021                                https://doi.org/10.5194/nhess-21-1179-2021
H. Liu et al.: Online urban-waterlogging monitoring based on recurrent neural network 1185
rate of 1 %, but in fact all minority examples are misclassi- In this way, the current hidden-layer calculation results and
fied. Therefore, the imbalance problem must be handled care- the current input are related to the previous hidden-layer cal-
fully to build a robust classifier in a problem with a large culation results, and the purpose of the memory function is
degree of imbalance (Liu et al., 2008). achieved.
We adopted the undersampling technique to reduce the Unfortunately, it is difficult for the RNN model to learn
number of examples belonging to the majority class with long-distance correlation information in a sequence, which
the objective of equalizing the number of examples of each will affect the classification effect. Therefore, this pa-
class (García and Herrera, 2009). The undersampling is done per adopts the improved RNN model by the long short-
by using a third-party Python package imblearn. The Ran- term memory (LSTM) network. The LSTM (Hochreiter
domUnderSampler function in the imblearn package imple- and Schmidhuber, 1997) is a special RNN that can learn
ments bootstrap sampling by setting the parameter replace- long-distance-dependent information. The key design of the
ment to true. This function randomly removes samples in the LSTM is the “gate” structure, through which information
original data set with multiple classes to build a balanced is removed or added to the cell state, thereby updating the
subset of the whole samples. In particular, we considered the hidden-layer state of each layer. In this paper, we use the
negative samples to be the majority class and the positive improved RNN model by the LSTM to replace each hidden
samples to be the minority class. We used the undersampling layer with a cell that has a memory function. The LSTM has
method to resample the same number of negative samples great advantages in processing time series and language text
as positive samples and then combined them to create a bal- sequences (Niu et al., 2018). The network structure of the
anced data set to train the classification model. The under- LSTM is shown in Fig. 4.
sampling process was repeated enough times to ensure that Each unit of the LSTM model is composed of the input
every sample would be seen by the classifier. gate i, the output gate o, the forget gate f , and the internal-
memory unit c. Through these three thresholds, the inter-
2.3 Training of classifiers nal memory can be selectively input, passed, and forgot-
ten, which can effectively overcome the problem of gradi-
We tested three popular models, including the recurrent neu- ent disappearance (Li and Chen, 2018). Intuitively, the for-
ral network (RNN), support vector machine (SVM), and get gate controls the amount of each unit of the memory cell
gradient boosting decision tree (GBDT), using both TF– that is erased, the input gate controls how much each unit
IDF features and distributed representation derived from the is updated, and the output gate controls the exposure of the
word2vector algorithm. internal-memory state (Liu et al., 2016). The hidden state of
the LSTM model at time t is as follows:
2.3.1 Recurrent neural network (RNN)
it = σ xt Ui + ht−1 Wi + bi
In natural language processing, the recurrent neural network
is the most commonly used method. A recurrent neural net-
ft = σ xt Uf + ht−1 Wf + bf
work (RNN) is used to process sequential data, which takes
ot = σ xt Uo + ht−1 Wo + bo
sequence data as input and performs recursion in the evolu-
tion direction of the sequence, and all nodes (recurrent units) gt = tanh xt Ug + ht−1 Wg + bg
are connected by chain. The recurrent neural network and its
ct = ct−1 ⊗ ft + gt ⊗ it
unfolding structure are shown in Fig. 3 (LeCun et al., 2015).
The RNN introduces a directional loop to pass down the pa- ht = tanh (ct ) ⊗ ot , (4)
rameters of the hidden-layer state St−1 at the previous mo-
ment and calculate the hidden state St at the next moment where σ (·) denotes the sigmoid activation function; ⊗ de-
so as to achieve the persistence of information and solve the notes element-wise multiplication; W∗ and U∗ are the weight
problem of association between the input information before matrix in the network; b∗ is the bias term; and it , ot , and ft
and after (Liu et al., 2018). are the values of the input gate, output gate, and forget gate
As shown in Fig. 3, X is the input layer, O is the output at time t, respectively (Li and Chen, 2018).
layer, and S is the hidden layer. V , W , and U are the weights During the experiments, the input layer of the RNN model
of the input layer, hidden layer, and output layer, respectively, imported the word vector representation matrix of the words
and t is the number of calculations for the tth time. Calculat- in the sentence. For example, there are n words in a mi-
ing the hidden state for the tth time is done as follows: croblog post, the dimension of the word vectors is k, and
the size of the input matrix is n × k. Then the “gate” struc-
ture of the LSTM model removes or adds information to the
St = f (U · Xt + W · St−1 ) . (3) cell state of the network to update the hidden state of each
layer. The hidden state is input to the softmax layer, and next
to output the final classification results are output, thereby
realizing text classification.
https://doi.org/10.5194/nhess-21-1179-2021 Nat. Hazards Earth Syst. Sci., 21, 1179–1194, 20211186 H. Liu et al.: Online urban-waterlogging monitoring based on recurrent neural network
Figure 3. The RNN and its unfolding structure.
Figure 4. The structure of the LSTM.
2.3.2 Support vector machine 2.3.3 Gradient boosting decision tree
The support vector machine (SVM) classifier is widely used The gradient boosting decision tree (GBDT) is a boosting al-
to solve two-category problems. The SVM model is defined gorithm proposed by Friedman (2000) in 2001. The GBDT
as a linear classifier with the largest interval in the feature is an iterative decision tree algorithm, which is composed of
space. Its basic idea is to find the classification hyperplane multiple decision trees, and the answers of all trees are added
that can divide the training data set correctly and has the up to make the final decision. The model established each
largest geometric interval (Tan and Ding, 2008). The SVM time is in the gradient descent direction of the previously es-
model is suitable for classification in high-dimensional space tablished model loss function so that it performs better than
and has a good performance on small-size data sets. traditional boosting algorithms, which reweight the correct
and wrong samples after each round of training (Feng et al.,
2017).
Nat. Hazards Earth Syst. Sci., 21, 1179–1194, 2021 https://doi.org/10.5194/nhess-21-1179-2021H. Liu et al.: Online urban-waterlogging monitoring based on recurrent neural network 1187
Table 2. The structure of the confusion matrix.
Confusion matrix Actual classes
Positive TP FP
Negative FN TN
3 Experiment
3.1 Confusion matrix
The confusion matrix, also known as the possibility table or
error matrix, is a specific matrix used to present the visual
effect map of the classifier performance. The rows represent
the predicted values, whereas the columns represent the ac-
tual values. The categories used in analysis are false positive,
true positive, false negative, and true negative. The structure
of the confusion matrix is shown in Table 2.
For example, a post reads as follows: “in the early hours
of this morning, there was a heavy rain in Shenzhen. Many
roads were flooded, and only the top of cars could be
seen. Among them, the water at the bottom of the Hezhou
bridge was serious, which caused the road to be interrupted.”
TP means true positive: the truth is positive, and the classifier
predicts a positive. For example, the bottom of the Hezhou
bridge is flooded, and the classifier accurately reports this.
TN means true negative: the truth is negative, and the clas-
sifier predicts a negative. For instance, the bottom of the
Hezhou bridge is not flooded, and the classifier accurately
reports this. FP means false positive: the truth is negative,
but the classifier predicts a positive. For example, the bottom
of the Hezhou bridge is not flooded, but the classifier inaccu-
rately reports that it is. FN means false negative: the truth is
positive, but the classifier predicts a negative. For example,
the bottom of the Hezhou bridge is flooded, but the classifier Figure 5. Hyperparameter selection based on grid search: optimiza-
inaccurately reports that it is not. tion function selection image (a), batch_size selection image (b),
keep_probs selection image (c).
3.2 Hyperparameter optimization
When building a deep learning model, the selection of hyper- Batch size represents the number of samples captured in
parameters is very important. This paper uses a grid search one training round, and its value affects the training speed
to find the optimal hyperparameters of the RNN. The grid and model optimization. As shown in Fig. 5b, the accuracy
search is an optimization strategy by specifying parameter of the RNN model is reduced but still remains above 0.76,
values of exhaustive enumerations to select optimal param- with the batch size value ranging from 16 to 128. When the
eters. The hyperparameters to be selected include optimizer, batch size is 16, the accuracy reaches the highest, at 0.7857.
batch size, keep probability, and so on. To reduce the com- Therefore, the batch size is set to 16.
putational overhead, we chose to fix other parameters and We adjusted the size of keep probability to prevent overfit-
changed the parameter value for experimentation. ting and improve the generalization ability of the model. As
The optimizer is used to update weights when training a can be seen from Fig. 5c, when keep probability is equal to
deep neural network. We tested several adaptive optimizers, 0.5, the RNN model reaches the highest accuracy, at 0.7854.
including SGD, Adagrad, Adadelta, and Adam. As can be Therefore, the size of keep probability is set to 0.5.
seen from Fig. 5a, the Adam optimizer achieved the high- In addition, the learning rate and epoch are tuned to 0.001
est accuracy, at 77 %. Therefore, we select Adam as the opti- and 5, respectively. The selection of important parameters is
mizer in the subsequent performance evaluation experiments. shown in Table 3.
https://doi.org/10.5194/nhess-21-1179-2021 Nat. Hazards Earth Syst. Sci., 21, 1179–1194, 20211188 H. Liu et al.: Online urban-waterlogging monitoring based on recurrent neural network
Table 3. Parameter settings of the RNN model. Table 4. Validation set results of the SVM, GBDT, and RNN mod-
els.
Parameters Value
Method ACC R P F1 AUC
Optimizer Adam
Batch size 16 GBDT + TF–IDF 0.86 0.73 0.98 0.83 0.96
Keep probability 0.5 GBDT + word2vec 0.81 0.63 0.98 0.76 0.91
Learning rate 0.001 SVM + TF–IDF 0.88 0.80 0.96 0.87 0.96
Epoch 5 SVM + word2vec 0.87 0.77 0.96 0.85 0.95
RNN + word2vec 0.96 0.99 0.93 0.96 0.99
3.3 Verification of flood deposits based on an AutoNavi
waterlogging map
ACC = (TP + TN)/(TP + FN + FP + TN), (5)
In cooperation with the Public Meteorological Service Cen- P = TP/(TP + FP), (6)
ter of the China Meteorological Administration, AutoNavi, a
R = TP/(TP + FN), (7)
famous online map service provider in China, has released a
nationwide map of urban waterlogging based on AutoNavi- F1 = 2 · (P · R)/(P + R). (8)
inherent road and traffic data, and historical flood deposits
4.2 Performance evaluation
reported by traffic police. The AutoNavi app visualizes the
urban flood deposits that can be retrieved by users. 4.2.1 Performance evaluation of validation set
We collected the flood deposits on an AutoNavi waterlog-
ging map, including the degree of floods and the latitude and We tested two types of feature representations, TF–IDF and
longitude of each flood deposit. Next, we selected the flood word2vec, on three classifiers, including the SVM, GBDT,
deposits in Nanjing city on an AutoNavi waterlogging map to and RNN. Note that the RNN model cannot be applied to TF–
check how many of the flood deposits identified from Weibo IDF feature representation as its input requires sequences. A
posts overlapped. total of 200 samples were randomly selected from the posi-
tive and negative sample sets, respectively, as the validation
set (400 samples in total), and the remaining samples were
4 Experiment
used as the training set. The performance measures were
4.1 Performance measures computed based on the predicted result of the validation set
by learned models. The process was repeated 50 times, and
We adopted a variety of measures to evaluate the perfor- the averages were reported as the final performance mea-
mance of our proposed method, including accuracy (ACC), sures.
precision (P ), recall (R), and F1 measure (F1). The receiver As shown in Table 4, the RNN classifier based on
operating characteristic (ROC) curves and area under curve word2vec feature representation achieved the best perfor-
(AUC) were also used as criteria for performance evalua- mance. The accuracy, recall, and F1 value of this model
tion. The accuracy (ACC) is defined as the ratio of the cor- reach above 96 %, and the AUC value also achieves 0.99,
rectly classified samples to the total number of samples as in indicating that the RNN is an effective model for online
Eq. (4). The precision (P ) represents the proportion of posi- classification of waterlogging-related posts. According
tive samples that are correctly classified to the total number to the experimental results, it is found that the RNN
of positive samples as in Eq. (5). The recall (R) is expressed model based on word2vec features performs generally
as the ratio of the correctly classified negative samples to the better than traditional classifiers, such as GBDT + TF–
total number of negative samples as in Eq. (6). F1 measure IDF (ACC = 0.86), GBDT + word2vec (ACC = 0.81),
(F1), also referred to as F1 score, represents the harmonic SVM + TF–IDF (ACC = 0.88), and SVM + word2vec
mean of precision and recall as in Eq. (7) (Tharwat, 2018). (ACC = 0.87).
The higher the value of F1, the better the performance of the
method. The ROC curve is a graphical plot that illustrates the 4.2.2 Performance evaluation of independent set
diagnostic ability of a binary classifier system as its discrimi-
To further verify the effectiveness of the RNN model, we
nation threshold is varied. The curve is created by plotting the
built an independent test set to evaluate the model. The
true-positive rate (TPR) against the false-positive rate (FPR)
independent test set contains 400 Weibo posts (200 posi-
at various threshold settings (Receiver, 2020). The AUC met-
tive and negative, respectively) of 2019. These posts were
ric calculates the area under the ROC curve (Tharwat, 2018).
downloaded using the keywords “ ” or “ ” (drowning
The higher the AUC value, the better the performance (Yu
and waterlogging in Chinese) and then manually checked.
and Zhai, 2014).
Each trained model was performed on the certain indepen-
Nat. Hazards Earth Syst. Sci., 21, 1179–1194, 2021 https://doi.org/10.5194/nhess-21-1179-2021H. Liu et al.: Online urban-waterlogging monitoring based on recurrent neural network 1189
Table 5. Test set results of the SVM, GBDT, and RNN models. 4.3 Verification based on an AutoNavi waterlogging
map
Method ACC R P F1 AUC
GBDT + TF–IDF 0.77 0.62 0.89 0.73 0.83 We collected 1660 flood deposits from an AutoNavi water-
GBDT + word2vec 0.83 0.69 0.97 0.81 0.93 logging map and found 75 flood deposits located in Nanjing
SVM + TF–IDF 0.81 0.72 0.88 0.79 0.90 city. Among the 165 flood deposits in Nanjing derived from
SVM + word2vec 0.86 0.88 0.84 0.86 0.95 Weibo posts of 2017–2018, there were 18 overlapped points
RNN + word2vec 0.90 0.97 0.85 0.91 0.95 on the AutoNavi waterlogging map. Figure 7 shows these
overlapped flood deposits.
To verify the effectiveness of our RNN model, we used
the locations of these 18 overlapped flood deposits as key-
words, such as “ ” (Bisheng Road), to retrieve posts
from Sina Weibo and obtained more than 800 microblogging
posts, among which only 29 posts were really related to these
flood deposits. Taking all these posts as input, the trained
RNN model achieved 0.836 accuracy. This experiment con-
firmed that the RNN model proposed in this paper can be
applicable for online monitoring of urban waterlogging. It is
especially worth noting that the AutoNavi waterlogging map
is no longer updated. There is a pressing demand to propose
a new monitoring system for urban waterlogging.
4.4 Nationwide map of urban waterlogging
We built a nationwide waterlogging map with more than
6000 flood deposits based on microblogging data from 2017
to 2018, as shown in Fig. 8. The locations of these flood de-
posits were manually located. The map was generated by
ArcGIS 10.6 software. The small black dots represent the
flood deposits (as shown in Fig 8a), and orange dots rep-
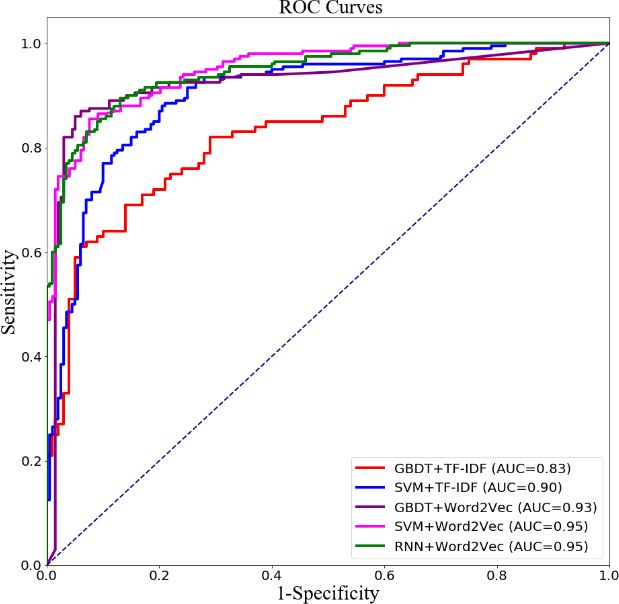
Figure 6. ROC curves of the three models. resent the number of flood deposits within the province (as
shown in Fig. 8b). For example, the more flood deposits
in the province, the larger the orange points. We notice an
dent test set, and the performance measures were computed,
overall correlation between the economic development and
as shown in Table 5 and Fig. 6. The RNN model based on
the number of urban flood deposits. We used the GDP of
word2vec features significantly outperforms all other models
each province as its background color on the map; i.e., the
and achieves the highest accuracy, recall, and F1 values. It
higher the GDP, the darker the color. It can be seen that the
also has achieved the largest AUC value, at 0.95.
provinces located in eastern and central regions are more de-
Furthermore, it can also be seen that the word2vec fea-
veloped than northeastern and western regions in China, as
ture representation effectively improves the performance of
shown in Fig. 8b. Also, these regions have a higher pop-
text classification models in the independent test data set.
ulation and higher internet penetration rates than other re-
This shows that the word vectors generated by the word2vec
gions. Accordingly, we found that the number of flood de-
model are more informative than traditional TF–IDF in ex-
posits in the eastern and central provinces is larger than in
pressing the features of microblogging posts related to ur-
northeastern and western provinces. This phenomenon may
ban waterlogging. For both the GBDT and SVM, the mod-
be caused by the rapid urbanization and ground hardening
els trained on word2vec features obtained better performance
so that the water permeability is greatly reduced. The poten-
in the independent test data set compared to those trained
tial economic loss in developed areas is larger, and the real-
on TF–IDF. In fact, we find similar results in Table 4;
time monitoring system for urban-waterlogging disasters is
RNN + word2vec obtained the best performance, followed
more important in developed areas. On the other hand, the
by SVM + word2vec.
new technology adoption is also a factor related to the size
of the orange dot. For example, Nanjing, Jiangsu Province,
has more than 200 posts every day, while Lhasa, Tibet Au-
tonomous Region, has about 40 posts per day. When a flood
occurs, people discuss more waterlogging-related content on
Weibo, and we will collect more posts related to the wa-
https://doi.org/10.5194/nhess-21-1179-2021 Nat. Hazards Earth Syst. Sci., 21, 1179–1194, 20211190 H. Liu et al.: Online urban-waterlogging monitoring based on recurrent neural network
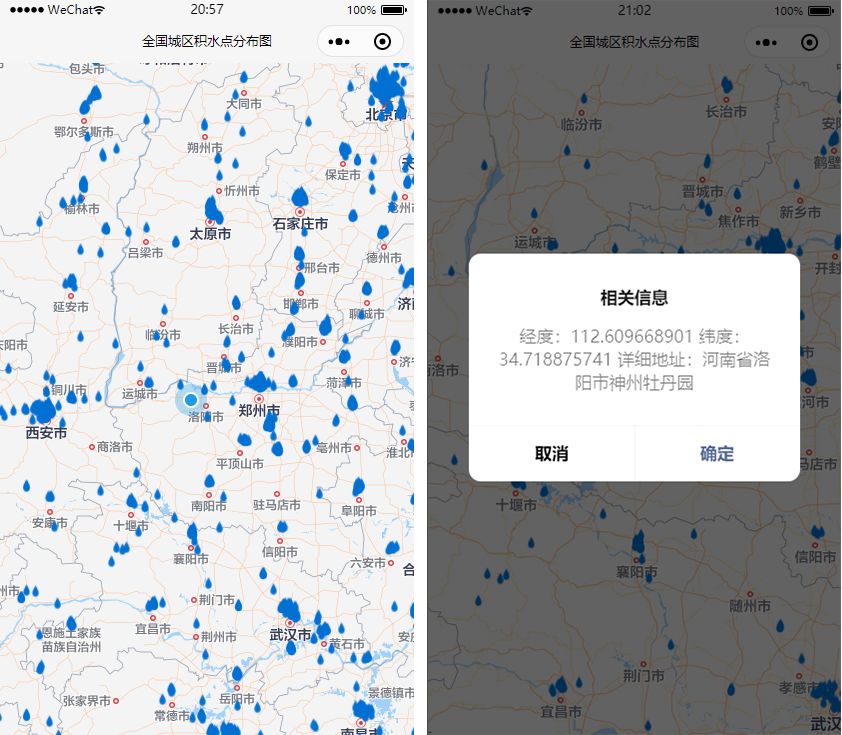
Figure 7. Overlapping flood deposits in Nanjing (© Google Maps 2019).
terlogging, which will lead to the orange dot being bigger. 5 Discussion
Therefore, the residents of the Nanjing area that discussed
waterlogging via Weibo may make the orange dot bigger. We trained text classification models to identify microblog-
However, it is worth noting that the new technology adop- ging text related to urban waterlogging caused by flood dis-
tion itself is correlated to GDP. asters. By manually collecting more than 4400 waterlogging-
related Weibo posts from 2017 to 2018, we built a gold-
4.5 Monitoring system based on the WeChat applet standard data set to evaluate three text classification models,
including the RNN, SVM, and GBDT. Our empirical exper-
To facilitate the usage of the nationwide map of urban water- imental results showed that the RNN model achieves higher
logging, we developed an applet based on WeChat, a popular accuracy than the other two classifiers in an independent
mobile social app in China. With the help of WeChat’s pow- test set. Also, we found that the feature representation ex-
erful web service capability and wide application, it is helpful tracted by word2vec could improve performance compared
for people to monitor the flood deposits. The applet visual- to traditional TF–IDF features. Furthermore, we built a na-
izes all urban-waterlogging points on the map of China, as tionwide map of urban waterlogging based on recent 2-year
shown in Fig. 9. By clicking on a waterlogging icon, a pop-up microblogging data and a monitoring system based on the
dialog will display detail information on this urban waterlog- WeChat applet that will alert the user via voice alarm when
ging, such as the location description, longitude, and latitude. he or she approaches a waterlogging point.
The applet runs a daemon monitoring process that computes The limitation of our study lies in the fact that the number
the distance of the current position to waterlogging points of positive samples in the data set is relatively small. In fu-
nearby. In rainstorm weather, the applet would greatly ben- ture study, we will set about to extend the scale of the data set
efit taxis and bus drivers. When a driver approaches a flood to build a predictive model with better performance. Mean-
deposit, the applet will make a voice alarm, such as “warn- while, we will consider other deep learning models, such as
ing, warning, waterlogging ahead”, to remind the driver that convolutional neural networks (CNNs), to further integrate
there is a flood deposit ahead to drive carefully. remote sensing images and social media to improve the pre-
diction of urban flood deposits and develop a more powerful
monitoring system of urban waterlogging.
Nat. Hazards Earth Syst. Sci., 21, 1179–1194, 2021 https://doi.org/10.5194/nhess-21-1179-2021H. Liu et al.: Online urban-waterlogging monitoring based on recurrent neural network 1191 Figure 8. Nationwide map of waterlogging: flood deposit image (a), image of the number of flood deposits (b). https://doi.org/10.5194/nhess-21-1179-2021 Nat. Hazards Earth Syst. Sci., 21, 1179–1194, 2021
1192                               H. Liu et al.: Online urban-waterlogging monitoring based on recurrent neural network

Figure 9. Screenshots of the monitoring system based on the WeChat applet. (a) Nationwide map of urban waterlogging (© Tencent Maps)
and (b) detailed information of one waterlogging point.

Data availability. The source code and manually collected             Review statement. This paper was edited by Philip Ward and re-
Weibo posts that report flood deposits can be download from           viewed by Jens de Bruijn and Valerio Lorini.
https://doi.org/10.5281/zenodo.4646972 (Liu, 2021).

Supplement. The supplement related to this article is available on-
                                                                      References
line at: https://doi.org/10.5194/nhess-21-1179-2021-supplement.
                                                                      Anselmo, V., Galeati, G., Palmieri, S., Rossi, U., and Todini, E.:
                                                                        Flood risk assessment using an integrated hydrological and hy-
Author contributions. HL proposed the original idea. HL and             draulic modelling approach: a case study, J. Hydrol., 175, 533–
YH designed and performed the experiments. WZ and HZ helped             554, https://doi.org/10.1016/S0022-1694(96)80023-0, 1996.
to process data sets. YH drafted the manuscript, and HL revised       Barker, J., Barker, J. L. P., and Macleod, C. J. A.: Devel-
the manuscript. JT supervised this work. All authors have read and      opment of a national-scale real-time Twitter data mining
agreed to publish the paper.                                            pipeline for social geodata on the potential impacts of flood-
                                                                        ing on communities, Environ. Model. Softw., 115, 213–227,
                                                                        https://doi.org/10.1016/j.envsoft.2018.11.013, 2019.
Competing interests. The authors declare that they have no conflict   Chawla, N., Japkowicz, N., and Kolcz, A.: Editorial: Special issue
of interest.                                                            on learning from imbalanced data sets, ACM SIGKDD Explor.,
                                                                        6, 1–6, https://doi.org/10.1145/1007730.1007733, 2004.
                                                                      Cheng, X., Han, G. F., Zhao, Y. F., and Li, L.: Evaluating so-
Financial support. This research has been supported by the Na-          cial media response to urban flood disaster: Case study on
tional Natural Science Foundation of China (grant no. 91846203)         an East Asian City (Wuhan, China), Sustainability, 11, 1–18,
and the Graduate Research and Innovation Projects of Jiangsu            https://doi.org/10.3390/su11195330, 2019.
Province (grant nos. KYCX20_2619 and KYCX20_2620).                    de Bruijn, J. A., de Model, H., Jongman, B., Wagemaker, J., and
                                                                        Aerts, J. C. J. H.: TAGGS: Grouping tweets to improve global
                                                                        geoparsing for disaster response, J. Geovisual. Spat. Anal., 2, 2,
                                                                        https://doi.org/10.1007/s41651-017-0010-6, 2018.

Nat. Hazards Earth Syst. Sci., 21, 1179–1194, 2021                                    https://doi.org/10.5194/nhess-21-1179-2021
H. Liu et al.: Online urban-waterlogging monitoring based on recurrent neural network 1193 de Bruijn, J. A., de Model, H., Jongman, B., de Ruiter, M. C., Wage- Lima, C., Lall, U., Troy, T. J., and Devineni, N.: A climate in- maker, J., and Aerts, J. C. J. H.: A global database of historic and formed model for nonstationary flood risk prediction: Applica- real-time flood events based on social media, Sci. Data, 6, 311, tion to Negro River at Manaus, Amazonia, J. Hydrol., 522, 594– https://doi.org/10.1038/s41597-019-0326-9, 2019. 602, https://doi.org/10.1016/j.jhydrol.2015.01.009, 2015. Feng, H., Li, M., Hou, X., and Xu, Z.: Study of network intru- Liu, P., Qiu, X., and Huang, X.: Recurrent neural network for text sion detection method based on SMOTE and GBDT, Appl. Res. classification with multi-task learning, Computer Science, arxiv: Comput., 34, 3745–3748, https://doi.org/10.3969/j.issn.1001- preprint, available at: https://arxiv.org/abs/1605.05101 (last ac- 3695.2017.12.051, 2017. cess: 29 July 2020), 2016. Feng, Y. and Sester, M.: Extraction of pluvial flood relevant vol- Liu, T., Zhu, W., and Liu, G.: Advances in deep learn- unteered geographic information (VGI) by deep learning from ing based on text classification, Elect. Power Inform. user generated texts and photos, ISPRS Int. J. Geo-Inf., 7, 39– Commun. Tech., 16, 1–7, https://doi.org/10.16543/j.2095- 64, https://doi.org/10.3390/ijgi7020039, 2018. 641x.electric.power.ict.2018.03.000, 2018. Friedman, J. H.: Greedy function approximation a gradient boosting Liu, X. Y., Wu, J., and Zhou, Z. H.: Exploratory undersampling for machine, Ann. Stat., 29, 1189–1232, 2000. class-imbalance learning, IEEE T. Syst. Man Cybernet. Pt. B, 39, García, S. and Herrera, F.: Evolutionary undersampling 539–550, https://doi.org/10.1109/TSMCB.2008.2007853, 2008. for classification with imbalanced datasets: Propos- Mikolov, T., Chen, K., Corrado, G.,and Dean, J.: Efficient estima- als and taxonomy, Evolution. Comput., 17, 275–306, tion of word representations in vector space, Computer Science, https://doi.org/10.1162/evco.2009.17.3.275, 2009. arxiv: preprint, available at: https://arxiv.org/abs/1301.3781 (last Gensim: Gensim topic modelling for humans: Word2vec em- access: 13 May 2020), 2013. beddings, available at: https://radimrehurek.com/gensim/models/ Niu, C., Zhan, G., and Li, Z.: Chinese Weibo sentiment analysis word2vec.html, last access: 4 September 2020. based on deep neural network, Comput. Syst. Appl., 27, 205– Guan, Q., Deng, S., and Wang, H.: Chinese stopwords for text clus- 210, https://doi.org/10.15888/j.cnki.csa.006645, 2018. tering: A comparative study, Data Anal. Knowled. Discov., 1, Receiver: Receiver operating characteristic: Receiver operat- 72–80, 2017. ing characteristic, available at: https://en.wikipedia.org/wiki/ Hochreiter, S. and Schmidhuber, J.: Long short- Receiver_operating_characteristic/, last access: 21 August 2020. term memory, Neural Comput., 9, 1735–1780, Robinson, B., Bai, H., Power, R., and Lin, X. G.: Research on social https://doi.org/10.1162/neco.1997.9.8.1735, 1997. media disaster detection for Sina Weibo, in: International Sym- Hu, X., Liu, L., and Qiu, N.: A novel spam categoriza- posium on Emergency Management 2014, 25 November 2014, tion algorithm based on active learning method and nega- Shenzhen, China, 2014. tive selection algorithm, Acta Electron. Sin., 46, 203–209, Salton, G. and Buckley, B.: Term-weighting approaches in au- https://doi.org/10.3969/j.issn.0372-2112.2018.01.028, 2018. tomatic text retrieval, Inform. Process. Manage., 24, 513–523, Kang, A., Zhang, K., Liang, J., and Yan, B.: Apply- https://doi.org/10.1016/0306-4573(88)90021-0, 1998. ing the dynamic critical precipitation method for flash Singh, N., Roy, N., and Gangopadhyay, A.: Localized flood de- flood early warning, J. Environ. Stud., 28, 1727–1733, tection with minimal labeled social media data using transfer https://doi.org/10.15244/pjoes/83731, 2019. learning, arXiv: preprint, available at: https://arxiv.org/abs/2003. Kim, Y.: Convolutional neural networks for sentence classification, 04973, last access: 15 June 2020. in: Conference on Empirical Methods in Natural Language Pro- Sofia, G., Roder, G., Dalla Fontana, G., and Tarolli, P.: cessing, Doha, Qatar, 2014. Flood dynamics in urbanised landscapes: 100 years of Kuklicke, C. and Demeritt, D.: Adaptive and risk-based ap- climate and humans’ interaction, Sci. Rep., 7, 40527, proaches to climate change and the management of un- https://doi.org/10.1038/srep40527, 2017. certainly and institutional risk: The case of future flood- Tan, G. and Ding, H.: Improvement of SVM method in text catego- ing in England, Global Environ. Change, 37, 56–68, rization, Inform. Technol., 1, 83–85, 2008. https://doi.org/10.1016/j.gloenvcha.2016.01.007, 2016. Tawatchai, T. and Mohammed, F. K.: Flood hazard and risk analy- LeCun, Y., Bengio, Y., and Hinton, G.: Deep learning, Nature, 521, sis in the southwest region of Bangladesh, Hydrol. Process., 19, 436–444, 2015. 2055–2069, https://doi.org/10.1002/hyp.5666, 2005. Li, S. and Chen, D.: Recurrent neural network using attention Tharwat, A.: Classification assessment methods, Appl. Comput. model for sentiment analysis, J. Huaqiao Univers. (Nat. Sci.), 39, Inform., 17, 168–192, https://doi.org/10.1016/j.aci.2018.08.003, 252–255, https://doi.org/10.11830/ISSN.1000-5013.201606123, 2018. 2018. Wadawadagi, R. and Pagi, V.: Disaster severity analysis from Liu, H.: hliu2016/waterlogging: urban waterlogging (Version v1.0), micro-blog texts using Deep-NN, Evolution in Compu- Zenodo, https://doi.org/10.5281/zenodo.4646972, 2021. tational Intelligence, Springer, Singapore, 1176, 145–157, Liang, L.: Application of rising rate analysis method in flood warn- https://doi.org/10.1007/978-981-15-5788-0_14, 2020. ing and forecast, Guangxi Water Resour. Hydropow. Eng., 2, Wang, H., Yang, L., and Lin, H. F.: Hot event analysis of Japan 29–32, https://doi.org/10.16014/j.cnki.1003-1510.2019.02.008, earthquake on microblog, J. Chinese Inform. Process., 26, 7–14, 2019. 2012. Liang, Z., Tang, T., Li, B., Wang, J., and Hu, Y.: Research and appli- cation of comprehensive evaluation method for flood early warn- ing, Yellow River, 41, 82–86, 2019. https://doi.org/10.5194/nhess-21-1179-2021 Nat. Hazards Earth Syst. Sci., 21, 1179–1194, 2021
You can also read