Capability-building Programme in Subseasonal-to-Seasonal Prediction for Southeast Asia (S2S-SEA) - Meeting Report for the Third Workshop (S2S-SEA III)
←
→
Page content transcription
If your browser does not render page correctly, please read the page content below
Capability-building Programme in
Subseasonal-to-Seasonal Prediction
for Southeast Asia (S2S-SEA)
Meeting Report for the Third Workshop (S2S-SEA III)
Singapore, 22 – 26 July 2019

ASEAN Specialised Meteorological Centre (ASMC)
                                                      0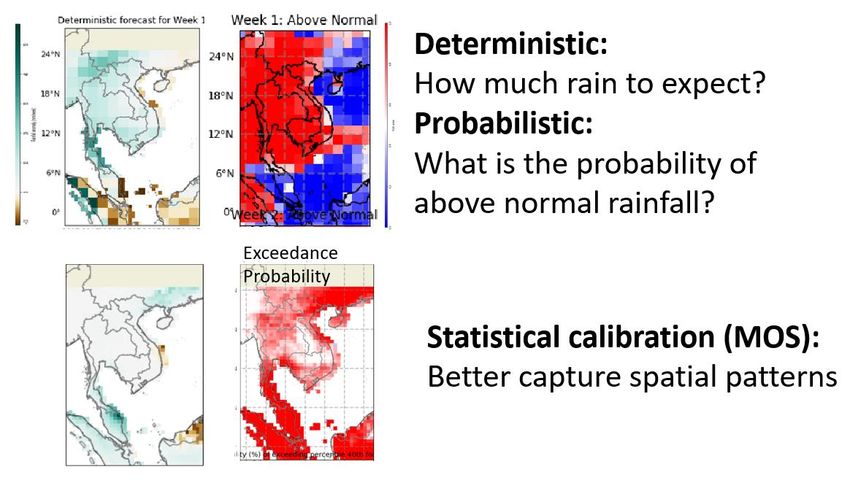
Acknowledgements
     The ASMC would like to thank the WMO S2S Prediction Project and its co-chairs
for their support of the S2S-SEA Programme and providing technical and administrative
guidance. We would also like to thank the United Nations Economic and Social
Commission for Asia and the Pacific (ESCAP) for their contributions and co-funding the
workshop with ASMC. We are also grateful for the contributions from the International
Research Institute for Climate and Society (IRI), the European Centre for Medium-Range
Weather Forecasts (ECMWF), and the Regional Integrated Multi-Hazard Early Warning
System for Africa and Asia (RIMES).

                                                                                     i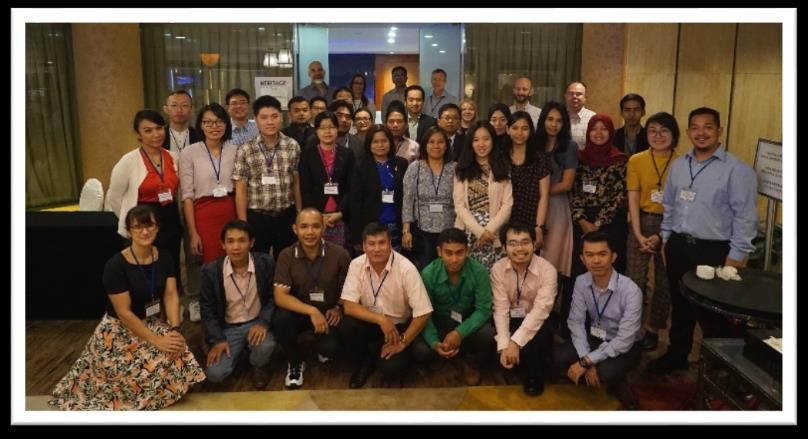
Contents
   Acknowledgements ..................................................................................................... i

   Executive Summary .................................................................................................. 1

   Introduction ............................................................................................................... 4

      S2S Prediction Project Model Database ................................................................ 4

   Day 1: 22nd Jul 2019, Monday ................................................................................... 6

      Introductions .......................................................................................................... 6

      Getting practical .................................................................................................... 7

   Day 2: 23rd Jul 2019, Tuesday ................................................................................... 9

      Gridded products and introduction to forecast verification .................................. 9

      Probabilistic predictions ...................................................................................... 11

      Guest Presentation: MJO-ENSO/IOD interactions ............................................ 12

   Day 3: 24th Jul 2019, Wednesday ............................................................................ 13

      Model Output Statistics ....................................................................................... 13

      Forecasting in relation to drivers ........................................................................ 13

   Practical sessions and case studies ......................................................................... 14

      PyCPT wish list.................................................................................................... 14

   Day 4: 25th Jul 2019, Thursday ............................................................................... 15

      S2S introduction to end-users ............................................................................. 15

      Disaster risk reduction ........................................................................................ 15

      Vulnerability profiles of case study locations ...................................................... 16

      MJO Task Force: An introduction ....................................................................... 16

      Serious Games ..................................................................................................... 17

   Case study discussions ............................................................................................ 18

   Day 5: 26th Jul 2019, Friday .................................................................................... 19

      Case studies presentations .................................................................................. 19

         February 2016: flash floods in Malaysia and Indonesia .................................. 19

                                                                                                                                i
May 2016: drought over the Philippines and Myanmar .................................. 20

      12-18 December 2016: Heavy rainfall over Vietnam ....................................... 20

      2-8 January 2017: Floods in southern Thailand .............................................. 21

      6-19 August 2018: Drought related haze in Indonesia and Malaysia ............. 22

   Breakout Session: S2S predictions in various sectors ........................................ 23

      Water resources ................................................................................................ 23

      Agriculture management ................................................................................. 24

      Public health management (heatwave, air quality, and diseases) .................. 24

      Disaster risk reduction (on flooding and landslides) ....................................... 25

   Real-time pilot project.......................................................................................... 26

References ................................................................................................................ 28

Annex A – List of Participants ................................................................................ 29

                                                                                                                            ii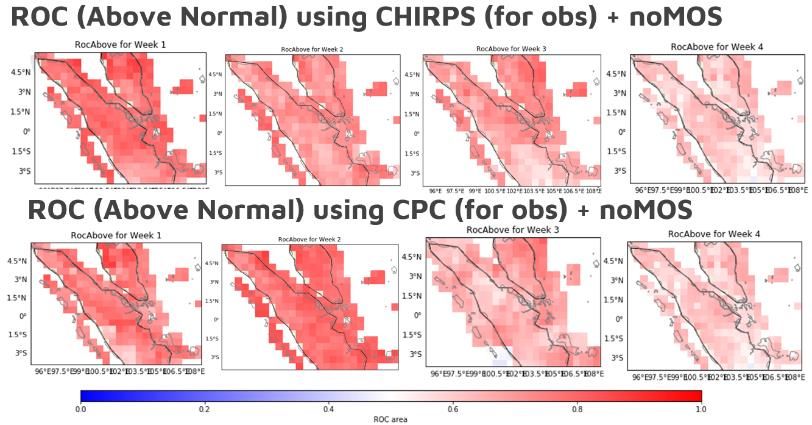
Executive Summary
      The S2S-SEA III workshop, which was held from 22-26 July 2019, marked the start
of the second phase of the Capability-building Programme in Subseasonal-To-Seasonal
Prediction for Southeast Asia (S2S-SEA). The programme was initiated in 2017 by the
Meteorological Service Singapore (MSS), host of the ASEAN Specialised Meteorological
Centre (ASMC; asmc.asean.org). S2S-SEA was conducted in collaboration with the
WMO’s S2S Prediction Project (s2sprediction.net). It is a multi-year series of workshops
comprising two phases. The first two workshops in the first phase (S2S-SEA I and II,
2017-18) focused on assessing model skill for Southeast Asia (Rahmat, et al., 2018), while
the ongoing second phase of workshops (S2S-SEA III and IV, 2019-2020) explore product
development for risk- and impact-based predictions on the S2S timescale with the
overarching aim of disaster risk reduction. This aim is to be achieved by engaging end-
users in different applications.

Participants of the S2S-SEA III workshop: NMHS representatives, end-user from disaster management
agencies and trainers from IRI, ECMWF, RIMES and ESCAP.

Workshop objectives

      The third workshop aimed to bring together ASEAN National Meteorological and
Hydrological Services (NMHSs) and National Disaster Management Authorities
(NDMAs) to promote the development and uptake of subseasonal products in Southeast
Asia (list of participants in Annex A). To achieve this objective, the workshop was split
into two parts. The first three days involved only the NMHSs, focusing on assessing skill
and exploring probabilistic products. Following the first three days, the NMHSs in their

                                                                                               1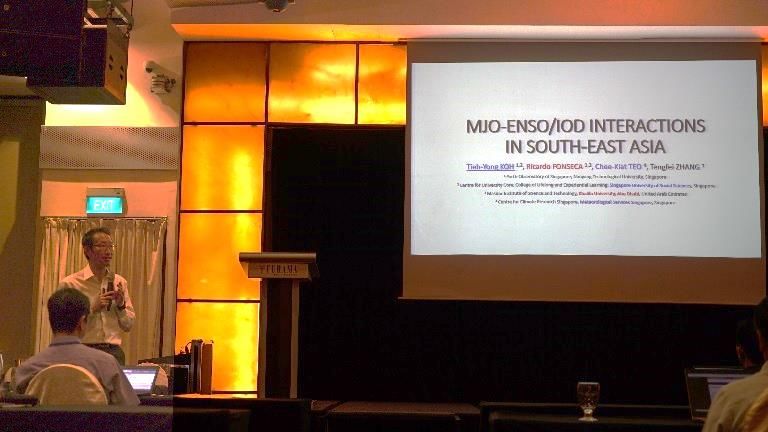
small groups were required to produce a one-page showcase, which was used to explain to
the end-users the potential and limitations of S2S products. The NDMA participants then
joined in the last two days to discuss the case studies and potentially useful subseasonal
products.

NMHS Sessions: Days 1 - 3

      The first three days involved recapping concepts in previous workshops, introducing
participants to probabilistic ensemble forecasts, and preparing for case studies. During
the workshop, participants made use of the IRI data library: both an online analyses tool
and a data repository for many atmospheric products. IRI also introduced the use of
PyCPT (Python interface to Climate Predictability Tool) for assessing the skill and
forecasts for weekly rainfall anomalies and percentiles with and without Model Output
Statistics (MOS) calibration. For the case studies, most groups focused on the first two
weeks of lead time, for which the ECMWF model successfully captured the rainfall
anomalies for the case studies, as well as was generally more skilful.

      During the first three days, the facilitators emphasised that it is crucial for product
development to be backed by robust scientific research. Through analysing model skill
(verification) and understanding the relevant regional climate drivers on the S2S
timescale (attribution of skill), NMHSs will be able to advise end-users better on the
potential and limitations of prediction products.

Bringing together NMHSs and End-Users: Days 4 and 5

      After a brief introduction to the NDMA participants, the NMHSs had their work
cut out for them to explain the various products they perceive to be useful for the end-
users. Following presentations on disaster risk reduction and vulnerability profiles of
regions in Southeast Asia, the groups then brainstormed about ways in which subseasonal
forecasts could benefit the NDMA users. A key finding from this activity was that end-
users consider 1-2 weeks’ lead time sufficient (varies depending on application) to prepare
for any extreme weather conditions, thus broadly matching the skill of the model’s
variables analysed during the first three days of the workshop.

      Two ‘serious games’ were also held, where participants worked in teams simulating
roles as water resource managers. Participants noted that a seemingly simple decision-
making activity could get complicated when multiple forecasts information and different
lead times are available. However, they acknowledged that the expertise of NMHSs

                                                                                           2
helped in the decision-making process and that they were able to appreciate the benefits
of additional information provided by probabilistic forecast over only deterministic
forecast. A post-workshop output which is a primer document on S2S, led by ESCAP and
with contributions from ASMC and RIMES, was published (ESCAP, ASMC, and RIMES,
2019). The report is meant to educate on and promote the use of S2S prediction output for
disaster risk reduction in Southeast Asia.

Future plans

      Going forward, the SEA-S2S Pilot project was introduced on the last day of the
workshop. The Pilot Project was scheduled to begin in November 2019. This project, along
with the outcomes from this third S2S-SEA workshop, will form the basis of the final S2S-
SEA workshop to be conducted by 2021.

                                                                                       3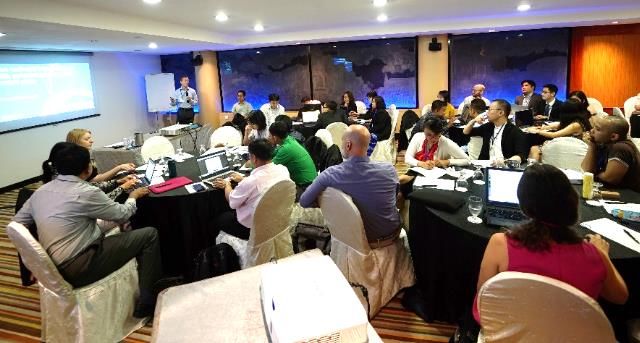
Introduction
The Capability-building Programme in Subseasonal-To-Seasonal Prediction for
Southeast Asia (S2S-SEA) was initiated in 2017 by the Meteorological Service Singapore
(MSS), host of the ASEAN Specialised Meteorological Centre (ASMC; asmc.asean.org),
and in collaboration with the WMO’s S2S Prediction Project (s2sprediction.net) and other
partners at different stages. The Programme is a multi-year series of workshops split into
two phases. In the first phase, the workshops (S2S-SEA I and II, 2017-18) focused on
assessing model skill for Southeast Asia, while the ongoing second phase of workshops
(S2S-SEA III and IV, 2019-2020) explore developing products for risk- and impact-based
assessments on the S2S timescale through engagement with end-users in different
applications. Given the relatively good skill of subseasonal forecasts for the region (e.g. Li
& Robertson, 2015), there is potential to maximise the benefits of S2S predictions for
Southeast Asia.
S2S Prediction Project Model Database
From the WMO’s S2S Prediction Project, an S2S Multi-model Ensemble Prediction
System (MEPS) database was set up to host the model outputs from the WMO’s Global
Producing Centres (GPCs). The MEPS comprises ensembles of subseasonal forecasts up
to 60 days. The database is accessible from (1) ECMWF database
(apps.ecmwf.int/datasets/data/s2s-reforecasts), (2) the IRI Data Library
(iridl.ldeo.columbia.edu/SOURCES/.ECMWF/.S2S), and (3) from a site hosted by CMA
(s2s.cma.cn). The MEPS provides an extensive set of reforecasts (hindcasts) dataset from
several modelling centres. At the moment, the forecast products lag by three weeks and
cannot yet be used operationally.
However, access to the reforecasts dataset will allow ASEAN’s National
Meteorological and Hydrological Services (NMHSs) to preview and assess as a region the
S2S dataset’s potential benefits and limitations ahead of the real-time products’ being
made operational. To prepare for the operational products being eventually released
either provisionally through the real-time pilot project (2019-2020), or operationally
through the WMO Lead Centre platform (Robertson, 2018), S2S-SEA aims to:
Familiarise the participants with the MEPS database.
Improve regional understanding of the mechanisms of subseasonal-to-seasonal
predictability (for e.g. the Madden-Julian Oscillation).
4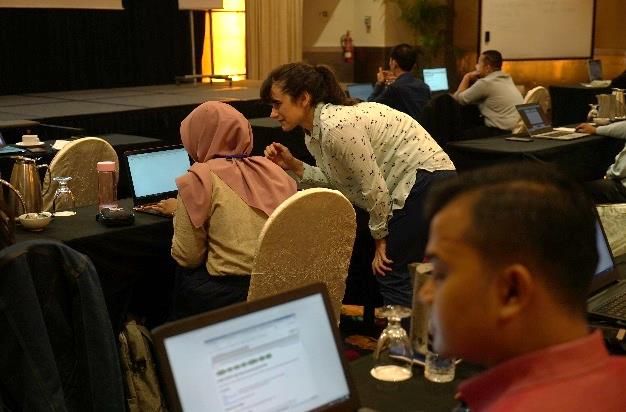
Equip the participants with the knowledge to investigate the skill and usefulness
of the subseasonal forecasts in applications.
Provide training to participants in generating products tailored for risk- and
impact-based predictions on the S2S timescale.
Hence, S2S-SEA activities aim to build capacity and enhance collaboration among
the NMHSs in the region to tackle the predictability of the weather and climate on this
timescale. This report summarises the proceedings at the Third Workshop (S2S-SEA III).
A summary of activities during the First and Second Workshop (S2S-SEA I & II) is
available in the S2S News Letter 10 (Rahmat, et al., 2018).
5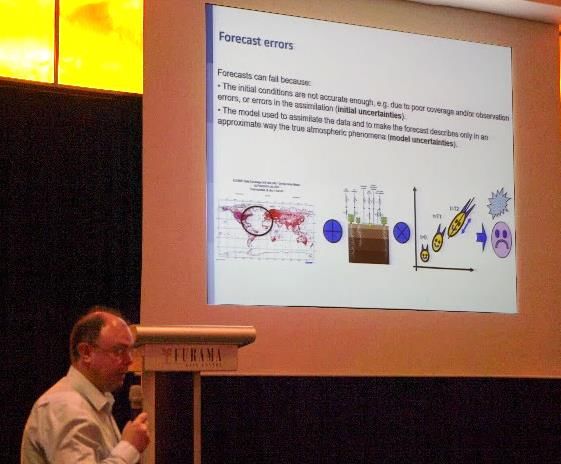
Day 1: 22nd Jul 2019, Monday
Introductions Highlights
The workshop started with a welcome Introduction to S2S
address from Prof Erland Källén, who Prediction Project
highlighted the importance of thinking Review of past workshops
about the end-users when developing Introduction to IRI Data
prediction products. He also emphasised the Library, CPT, and PyCPT
research that needs to be done before issuing Setting up and introduction
these products. The welcome address was to Jupyter Notebook
followed by a round-table introduction by all
of the 5-day participants, who came from various backgrounds: forecasters for short-term
weather forecasts, staff who were working already on subseasonal predictions, and also
weather and hydrological modellers.
Updates on the S2S Prediction Project
Dr Frédéric Vitart from the European Centre for Medium-range Weather Forecasts
(ECMWF) then gave an introduction on S2S and the S2S Prediction Project. S2S forecasts
are a mix of initial-value problem for the atmosphere (for example, forecasting the
Madden Julian Oscillation, MJO) and boundary-value problem (for example soil moisture,
snow cover, sea ice, and sea-surface temperatures). However, there are some atmosphere-
only (by persisting the boundary values) models that have reasonable skill, indicating
that at the S2S timescale, the primary issue is initial-value, followed by boundary values
for additional skill.
Since the inception of the S2S Prediction Project, the S2S community and data have
grown. As of the start of this workshop, more than 100 TB of data is available from the
database, the number of users of the database has increased, and more than 70 articles
using the S2S database have been published. Dr Vitart also provided an overview of the
S2S Prediction Project Phase 2 (2019-2023) including the various science questions to be
tackled (e.g. how might anomalies in land surface states contribute to extremes?) and the
increasing focus in providing service to users of the products (e.g. the Real-time Pilot for
S2S Applications research & demonstrations).
6Overview of the S2S-SEA Capability Building Programme
Focusing next on the regional
level, Mr Raizan Rahmat provided an
overview of the S2S-SEA Capability
Building Programme and reviewed the
outcomes from the first two workshops
of the series. The first workshop
assessed model skill for weekly rainfall
and temperature anomalies, while the
second workshop assessed various
Mr Raizan Rahmat introducing the role of the S2S-SEA
indices, such as the number of wet or dry Capability Building Programme in bridging the S2S
Prediction Project to Southeast Asia’s NMHSs.
days in a week. Recapping the examples
from the earlier workshops, he demonstrated the potential skill of S2S forecasts, which
provided motivation for the Third Workshop. Mr Rahmat also covered essential concepts
for the rest of the workshop, including deterministic forecasts (“spot” forecasts of actual
rainfall amount) and probabilistic forecasts (which capture the uncertainty). The concept
of lead times, or how far ahead the forecast is produced from the event, within the
modelling system and workshop convention was also introduced.
Getting practical
Linux, Virtual Machines, and Jupyter Notebook
The rest of Day 1 focused on the practical matters of installing the required software
on the participants’ laptops and familiarising them with the technical concepts covered
during the workshop. Each participant installed a virtual machine on their laptops, which
allowed all the necessary tools to be pre-
installed. This approach is useful when the
tool that is being used depends on specific
packages/dependencies. Otherwise, these
dependencies can lead to installation
challenges with participants using different
operating systems.
In between these activities, Dr Vitart During the afternoon Mr Ryan Kang and Ms Regine
elaborated on the S2S models and the S2S Ho led the group in exploring the basics of Linux
(the OS of the virtual machine) and Python.
Database, with a focus on the ECMWF model
7used during the workshop. He also highlighted sources for up-to-date information on S2S
models (necessary as many of the S2S models are regularly updated) as well as S2S
products, such as the MJO RMM index, available through the ECMWF research page and
the S2S Museum respectively.
Introducing IRI Data Library
Dr Ángel Muñoz from the
International Research Institute for
Climate and Society (IRI) introduced
the IRI Data Library: a web browser
interface that allows users a central
access point for many environmental
datasets, as well as users to perform
Hands on experience using IRI Data Library for plotting. various mathematical operations for
analysis, and a ‘Map Room’ to visualise the output and data. Participants tested out
locating data, analysing this data and created short animations of climate plots.
Introducing PyCPT
The final activity of the day was the introduction of PyCPT by Dr Muñoz. PyCPT is
a Python interface for the Climate Predictability Tool (CPT). The CPT is designed to
produce statistical forecasts using model output, including training the model, validation
and verification at the seasonal timescale. As statistical techniques in CPT require
significant amounts of training data, PyCPT helps by downloading sufficient S2S data for
training, formatting the data for input into CPT, as well as visualising the output. Going
forward, Dr Muñoz noted that IRI wanted to build a community for the development of
PyCPT. Before ending the day, the participants had the opportunity to make their first
trial runs of PyCPT.
8Day 2: 23rd Jul 2019, Tuesday
Gridded products and introduction Highlights
to forecast verification Data sources for model
Dr Ángel Muñoz from IRI introduced verification
to participants forecast verification Ensemble predictions
techniques and gridded products used for systems
verification. He emphasised that the Assessing probabilistic
verification has to be done before the forecast performance
forecast is being used as one needs to be PyCPT detailed
aware of its performance and limitations. walkthrough
There are various methods to verify the
model forecast, and the specific application of the forecasts is used to determine the
appropriate verification method.
(Left) Dr Muñoz giving an introductory lecture on forecast verification. (Right) Dr Turkington assisting the
participants in the practical session on IRI Data Library.
Types of verification scores
Dr Muñoz referred to the WMO’s Guideline on Verification of Operational Seasonal
Climate Forecasts (2018) by Dr Simon Mason for the list of attributes and metrics for
verification. As there are multiple ways to assess model forecast, Dr Muñoz covered
several different methods, which are Pearson’s, Spearman’s and Kendall’s correlations,
Two-Alternative Forced Choice (2AFC), Generalized Relative Operating Characteristic
(GROC), and Relative Operating Characteristic (ROC). He showed an example of the
association between model and observation, which demonstrates strong Pearson
correlation. Pearson’s and Spearman’s correlation were compared, with the former
requiring linear relationships between variables, while the latter does not require that
9assumption. Both methods are sensitive to outlier data. Dr Muñoz also mentioned that
both GROC and ROC fall under 2AFC, and they measure discrimination.
More on IRI Data Library
Following the introduction to the IRI Data Library’s (IRIDL) basic features on Day
1, Dr Muñoz further shared on ways to download gridded observation products. Through
the practical sessions, the participants were taught to use IRIDL for data selection,
visualisation, downloading, as well as filtering and interpolation of the data for display,
using CHIRPS v2.0 as an example observation dataset. He also showed how the Expert
Mode (Ingrid) tool on IRIDL could be used to generate climatology, time series, and spatial
plots of averages. To modify and match the resolutions between the model forecasts and
observations, participants were taught interpolation techniques through the Expert
Mode. The appropriate interpolation technique is necessary when comparing model
forecasts with observations. For example, it has to be done at the coarser resolution of the
two to avoid introducing artificial features that may arise when data is processed to match
the higher resolution dataset.
More on PyCPT
Dr Muñoz also went through the
PyCPT scripts with the participants,
describing the verification parts of the code in
detail. To improve the verification’s statistical
significance in the example used for the
workshop (ECMWF forecast and CHIRPS),
PyCPT increases the number of verification
samples by including data in the proximity
PyCPT script and sample outputs. Participants were
shown how to run the scripts and check their outputs. (before and after) of the period of interest.
10Probabilistic predictions
Ensemble predictions
Dr Frédéric Vitart from ECMWF gave an
introductory lecture on ensemble predictions. He
mentioned that while ensemble prediction is more
complicated than a simple value from the
deterministic forecast, forecast errors can
proliferate in a chaotic system and an ensemble
prediction can help to capture uncertainty in the
forecast.
Dr Vitart explaining ensemble forecast. He
Dr Vitart then touched on how an ensemble is explained the possible forecast errors in the
produced and the need for a multi-model approach ensemble system.
to capture differences between models (such as differences in model physics and data
used). The various strategies to generate the different ensembles have their advantages
and disadvantages and it is not clear yet which approach is more optimal for S2S, and
more research on this is needed.
Probabilistic forecast verification
Dr Thea Turkington from the Centre for
Climate Research Singapore introduced the
concept of probabilistic forecast verification to
ensure a good foundation for subsequent activities.
Dr Turkington compared and contrasted the two
different types of forecasts, deterministic and
probabilistic. She also covered basics such as
probabilistic distribution function, cumulative
A screenshot showing model skill at a lead distribution function, probabilities of exceedance,
time of three weeks based on the ROC score
from an introductory lecture probabilistic tercile forecasts, and probabilistic threshold
forecast verification by Dr Turkington.
forecast. The attributes of a ‘good’ probabilistic
forecast were covered, such as discrimination, sharpness, resolution, reliability and skill,
but of course, the usefulness of the forecast is also essential.
To test participants’ understanding of the concepts of probabilistic forecast and
verification, Dr Turkington led a practical session using Microsoft Excel adapted from a
11similar exercise conducted by Dr Richard Graham from the UK Met Office. The
participants were provided ensemble hindcast S2S data to assess the skill of tercile
predictions and use this to evaluate the confidence to attach to the predictions.
Participants compared model performance over lead times of one week and three weeks
using ROC scores for different terciles.
Guest Presentation: MJO-ENSO/IOD interactions
Dr Koh Tieh Yong from the
Singapore University of Social
Science (SUSS) and who is a member
of the Madden-Julian Oscillation
(MJO) Task Force presented on the
MJO-El Niño Southern Oscillation/
Indian Ocean Dipole (ENSO/IOD)
interactions in Southeast Asia region Dr Koh on MJO-ENSO/IOD interactions.
and provided the modelling
perspectives regarding these interactions. Dr Koh mentioned that while observations can
be coherently assimilated into and consequently improve simulations in dynamical
models, we have yet to develop a regional model well adapted to the tropical weather and
climate, especially on convection which is vital for MJO simulations.
Results that Dr Koh shared included his team exploration of a model that was
adjusted to be sensitive to convection. The model’s modifications sufficiently improved
common model biases for Southeast Asia/the Maritime Continent, but the model still
lacked in many areas. Other study results shared in the presentation included the effect
of ENSO and IOD on the MJO RMM amplitude, which depends both on the time of year
and the phases of both ENSO and IOD. Overall Dr Koh highlighted the importance of
convection in models for Southeast Asia, as well as understanding the interplay between
subseasonal and seasonal drivers.
12Day 3: 24th Jul 2019,
Wednesday
Highlights
Model Output Statistics Advanced techniques in
Dr Ángel Muñoz started the third day PyCPT (MOS)
by describing the calibration techniques in Forecast products in PyCPT
PyCPT called Model Output Statistics Forecast skill and
(MOS). He emphasised that due to confidence in relation to
uncertainties in (1) initial/boundary climate drivers
conditions, (2) unknown or unresolved Practical sessions in PyCPT
physical processes, and (3) the chaotic Preparation for case studies
nature of the climate system, models will
always contain errors. If these errors are systematic, these can be corrected using MOS.
Otherwise, the errors are managed by capturing the uncertainty using probabilistic
predictions. MOS correction is a technique commonly used for removing mean, amplitude
and conditional biases in seasonal forecasts, but in subseasonal forecasts the method has
not been as elaborately tested. Therefore, testing the technique for the subseasonal
timescale was a key outcome of this workshop.
Forecasting in relation to drivers
Dr Andrew Robertson gave a lecture on the predictability behind the S2S timescale
which is linked to the climate drivers, for example, MJO, ENSO and other slowly-varying
surface boundary conditions such as sea-surface temperatures, soil moisture, and snow
and ice. He noted that the skill of subseasonal predictions tends to cover larger areas of
the globe compared to seasonal timescale, but the skill maximum in subseasonal
predictions tends to be lower in these areas. Thus the prediction skill in both timescales
can complement in line with the “Seamless Predictability” concept. For Southeast Asia,
for example, he quoted a study by Li & Robertson, 2015 which demonstrated the influence
of both ENSO and MJO on rainfall predictability in the region. Focusing on a case study
over Borneo in June - July 2002, he showed how the forecasts from ECMWF model for
both positive and negative rainfall anomalies, as observed in CMAP observations,
performed well in the presence of MJO propagating through the Maritime Continent.
13Practical sessions and case studies
Participants spent the rest of Day 3 delving deeper into PyCPT’s features and
running PyCPT in full, which includes configuring and generating specific products of
interest. They have flexibility in choosing between deterministic (anomalies) or
probabilistic forecasts (terciles, above/below thresholds), and calibrated (MOS) or non-
calibrated forecasts (no MOS). Participants explored a variety of skill score maps which
helps them to interpret forecasts confidence. To prepare for the end-user sessions on Day
4 and Day 5, the NMHS participants also discussed which products among those available
in PyCPT that they considered to be useful for the case studies.
One of their tasks for the case studies
was to explain simply the potential and
limitations of the products of their choice.
Another task is to understand the needs of
the end-users better and consider other
possible products not already available. In
short, they were to come up with ways in
which subseasonal forecasts could be
Mr Raizan Rahmat discussing with the practically used, using the case studies as
participants investigating the Viet Nam 2018 case
study. examples. To this end, they produced 1-page
case study ‘brochures’ to share with end-users and prepared a 15-min presentation for
Day 5 incorporating inputs from end-users. The five case studies covered significant
drought and heavy rainfall conditions in different parts of Southeast Asia in 2016-2018.
PyCPT wish list
Dr Muñoz also led a discussion on improving the PyCPT. It was time to get feedback
from the participants, having being exposed to the tool for a few days, on how PyCPT
could be further improved in terms of the products, features and interface. Some
participants suggested simple look-and-feel improvements such as changes in the labels
and sizes on the maps, visual feedback to alert users of errors or completed runs, and the
ability to save plots. Other changes required more effort, for example, in adding start
dates for model data being downloaded and processed, allowing OPeNDAP access CPT
datasets, running and processing multiple models and ensemble members. It was also
suggested to have more detailed documentation for PyCPT. Dr Muñoz informed that IRI
would be incorporating these changes through partners’ contributions.
14Day 4: 25th Jul 2019,
Thursday
Highlights
S2S introduction to end-users
Introduction to S2S to end-
The last two days of S2S-SEA III were users
dedicated to end-users to discuss how S2S Application of S2S in
prediction could potentially be useful for disaster-risk reduction
different applications. Dr Robertson started Case studies and
Day 4 by giving an introductory talk on S2S. vulnerability profiles
The S2S Prediction Project aims to bring
MJO Task Force activities
together weather and climate communities,
“Serious Games”: decision-
including researchers, forecasters, and end-
making simulation
users, toward more “seamless” prediction
activities
across scales. For the second 5-year phase of
the project from 2019 to 2023, it will focus on
various research questions, including a new
S2S Research-to-Operations (R2O) focus to
develop forecast and verification products. An
S2S “real-time pilot” project would start in
November 2019 to demonstrate real-time use
of S2S predictions across a spectrum of
applications & Global Framework for Climate Services (GFCS) sectors.
Dr Robertson giving an introductory talk on S2S
Disaster risk reduction predictions to end-users from different sectors.
Ms Kareff Rafisura from the ESCAP gave
an introduction on how weather and climate
predictions could be useful for disaster risk
reduction. She shared that products from S2S
predictions can potentially be used as one of the
tools to reverse the trend of the poverty trap in
this region when applied to various sectors. But
Ms Rafisura (UN ESCAP) sharing with for S2S predictions to be useful, we have to
participants the potential use of S2S predictions in
disaster-risk reduction. bring in end-users early to co-design forecasts
products. Ms Rafisura also highlighted some challenges such where end-users tend to look
15at more localised scales than models can possibly inform, and there is institution inertia
among agencies in some countries to act on available prediction information. Agencies
also need to formulate decision-trees to respond to prediction information and manage
disaster risk, and decision-linked processes need to be specific for each sector.
Ms Rafisura also shared four strategies to promote S2S products for disaster risk
reduction and encourage uptake.
These are user-needs assessment,
product co-development, pilot
testing, and co-integration into
decision-making. Participants were
then instructed to use this
framework to guide their within-
group discussions on the case
Recommended strategies, for promoting S2S products for
studies. disaster risk reduction under S2S-SEA, which are being
incorporated into the fourth and fifth workshop.
Vulnerability profiles of case study locations
Ms Laura Hendy covered impacts on the region by the five case studies that the
NMHSs participants had prepared materials for on Day 3. These events were high impact
events that affected various sectors in each country.
Using the Sub-National Human Development Index’s (SHDI) database, Ms Hendy
identified the exposure and vulnerability of the populations for each of the regions. SHDI
is a proxy index that measures the reverse of
vulnerability, i.e. high SHDI means less
vulnerable. However, it should be noted that
an extreme event could severely impact a
Ms Hendy shared on the vulnerability profiles of
region with high SHDI. Thus, information
different regions for five case studies that would be on vulnerability is combined with the
co-analysed by the NMHS and end-users.
likelihood of events to generate risk maps for
various categories of extreme events. Subsequently, the costs of action have to be weighed
against the costs of inactions for each town or city.
MJO Task Force: An introduction
An expert from the MJO scientific community, Assoc Prof Koh Tieh Yong (Singapore
University of Social Sciences), was invited to share with participants the upstream
16scientific activities related to S2S Predictions, particularly the MJO research activities of
the WMO’s Working Group on Numerical Experimentation (WGNE) MJO Task Force
(MJO-TF). He shared the goal of the MJO-TF is to facilitate improvements in the
representation of the MJO in weather and climate models. The other aim is to increase
the predictive skill of the MJO and related weather and climate phenomena. Assoc Prof
Koh also broadly highlighted the plans for future activities in the MJO-TF which may be
of interest to S2S-SEA. These include ongoing analyses of how well key physical processes
are represented in simulations of MJO propagating through Maritime Continent, and the
enhanced observations and modelling efforts from the Year of Maritime Continent (YMC;
https://www.pmel.noaa.gov/ymc/).
Serious Games
Two “serious games”, adapted from the Hydrologic Ensemble Prediction
Experiment (HEPEX), were conducted during the workshop to simulate decision-making
with forecast products. The first activity tested the concepts and applications of
deterministic forecast vs probabilistic forecast, while the second activity simulated
decision-making using forecasts with various lead times.
For the first activity, the participants were provided with forecasts and had to
decide whether to open a flood gate (anticipating heavy rainfall) to divert water away from
the city or not, a decision that cost less than the city flooding. In the first round,
participants used both deterministic and probabilistic forecasts, while in the second they
only used deterministic forecast. Comparing
the two rounds, the participants shared that
the additional spread provided by probabilistic
forecast was valuable information crucial to
their decision-making. Consequently, the
participants were able to appreciate the
benefits of additional information provided by Example of single-day outlook information
provided in the first activity to help participants
probabilistic forecast over just deterministic simulate making decisions.
forecast alone.
The second activity used weekly (subseasonal) forecast products for the upcoming
five weeks. The participants had to decide on the amount of water to be discharged from
a reservoir to ensure enough water after the rainy season while not overflowing the dam.
The forecast products included rainfall tercile forecasts, MJO forecast, and boxplots of
17consequent water inflow to the reservoir. Even with additional information, three groups
(out of five) were unable to keep the water level in the safe region and overflowed the dam
by the fourth round. Participants noted that multiple forecasts information at different
lead times could complicate a seemingly simple decision-making activity. However, they
acknowledged that the expertise of NMHSs helped in the decision-making process.
Overall, the decision-making games received positive feedback from the participants with
some of the NMHSs interested in conducting similar activities in their training
workshops.
(Left) Forecast provided for the second activity was rainfall terciles, MJO, and inflow amount. The participants
had to plan the discharge amounts with the information provided. (Right) The reservoir amounts for each
group after each forecast periods.
Case study discussions
The NMHS and end-user participants were split into five groups on Day 4 to
analyse five different extreme weather events (case studies) in recent years. The
objectives were to study if such S2S predictions were able to predict such events, as well
as what type of derived forecast products were more skilful and, at the same time, useful
for the different sectors. Based on the group discussions and information from the
preceding four days, each group produced a short presentation to highlight their results.
18Day 5: 26th Jul 2019, Friday
Case studies presentations Highlights
Day 5 started with presentations on each of Case studies presentations
the five case studies. These case studies were Breakout Session: S2S
selected because of their severity and predictions in various
significant impacts on the affected sectors
communities. Real-time pilot project
February 2016: flash floods in Malaysia
and Indonesia
The year 2016 experienced a strong El Niño, which usually leads to drier conditions
in February over large parts of Maritime Continent. It was, however, unusually wet
during this period. The heavy rain
events were due to the combined
effects of a Northeast Monsoon
Surge and the MJO in Phase 4,
which typically brings wetter
weather over the Maritime
Continent.
For the flooding event which
occurred in the week of 4-10 February 2016, there was a lead time up to two weeks where
“No MOS” predictions indicated higher probabilities of above-normal rainfall occurring.
As for the skill score, higher ROC scores for lead times of one and two weeks ahead were
observed. MOS techniques of PCR and CCA were able to improve the probabilities of
above-normal rainfall up to a lead time of two weeks.
For this case, the end-users found deterministic forecasts to be more useful. They
Participants’ slide showing high ROC Skill Score (Above-
Normal Tercile category) for lead times of one or two weeks ahead
also requested for higher spatial
for the area of interest. resolution forecasts but would be
content with a minimum lead time of one week. In terms of tailored probabilistic forecast
products, they preferred absolute thresholds over percentile thresholds for rainfall
amount exceedance because absolute thresholds were simpler to interpret.
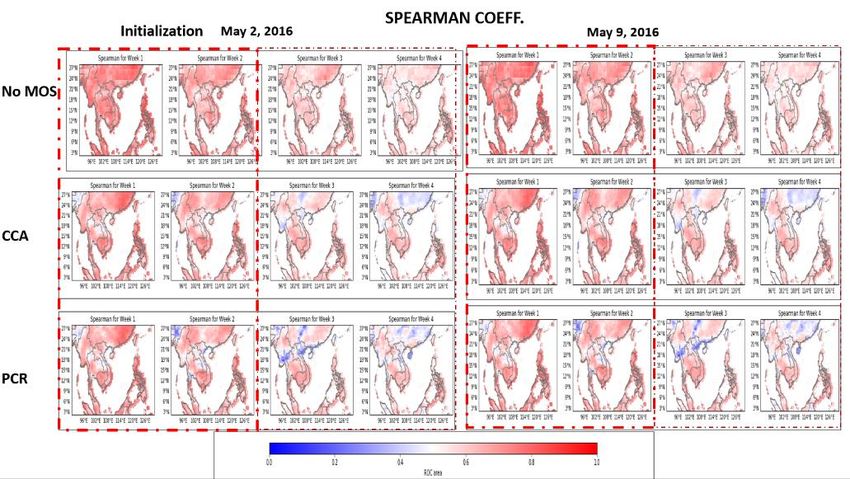
19May 2016: drought over the Philippines and Myanmar
The model’s forecast of anomalies from ECMWF for the drought event in May 2016
(model initialisation dates May 2 and May 9, 2016) shows good skill in forecasting the
event with a correlation score of 0.7 for “No MOS” configuration in PyCPT. The skill
decreased when CCA and PCR were applied but still showed relatively good skill when
forecasting one or two weeks ahead. For three or four weeks ahead, the skill diminishes
but still significant in most of the areas in the Philippines and Myanmar.
Participants’ slide showing high Spearman coefficient for Week 1 and Week 2 for predictions with “No MOS”
compared to predictions with CCA or PCR applied.
End-users generally commented that forecasts should be simple to understand, and
be ‘as accurate as possible’. They also noted that for some end-users, for example, military
users, qualitative assessments and text messages of forecast information are preferred as
such users do not understand forecast maps and therefore are unable to interpret the
maps themselves.
12-18 December 2016: Heavy rainfall over Vietnam
Using tercile probabilities of above-normal precipitation (“No MOS”), the heavy
rainfall conditions over Vietnam was detected up to a lead time of two weeks. However,
the prediction signal in two weeks’ lead time was much weaker than one week’s lead time.
A forecast produced using PCR, however, degraded the result. The NMHS participants in
the group postulated that it could be due to the choice of predictor domain that could have
the wrong large-scale physical factors. The group also suggested for a synoptic map-room
to be made available with mean sea level pressure and wind fields, for example, combined
with S2S predictions. Such a setup would be instrumental in providing better
20understanding of large-scale background factors and consequently better forecasts during
the Northeast Monsoon season during which this event took place.
(Left) Heavy rain could be detected with a lead time of up to two weeks (forecast in Week 3) using “No MOS”
configuration. (Right) Observed rainfall total amount for the period 12-18 December 2016.
From the end-user perspectives, they noted that frequent forecast updates would
be useful following the first detection of heavy rainfall signal (two weeks in advance). They
also requested for NMHSs to provide historical information of similar rainfall events
which also led to flooding. This accompanying information would be useful to make
comparisons with impending events, i.e. if they would lead to similar consequences and
which would help decision-makers direct resources to more flood-prone areas.
2-8 January 2017: Floods in southern Thailand
For this case study, MOS was better at capturing spatial patterns of the flooding in
southern Thailand. The skill of the model was observed up to a lead time of two weeks.
End-users had expressed that they would need up to two or three weeks of lead time. Thus
the model in this instance was able to provide useful information for decision-makers to
plan for the extreme event.
21Participants’ slide showing MOS-applied prediction (bottom row) was better than no MOS configuration (top
row) in capturing the spatial pattern of the flooding in southern Thailand for both the deterministic (left
column) and probabilistic (right column) predictions.
6-19 August 2018: Drought related haze in Indonesia and Malaysia
For this case study, the participants used the products: the probability of rainfall
exceeding 10 mm/week and weekly rainfall anomalies. The PyCPT’s MOS configuration
of PCR provided a better estimation of more severe drought conditions. A lead time of up
to three weeks could be observed using this approach.
A lead time of three weeks to detect the drought conditions using PyCPT’s MOS configuration.
Rainfall anomaly forecasted one week before the haze event. Week 2 and week 3 correspond to the period of the haze event
(at a lead time of 2 and 3 weeks, respectively).
22End-users required the risk for haze-conducive conditions to be predicted two weeks
in advance so that more effective pre-emptive measures could be taken, for example, to
distribute face masks to the most vulnerable communities. They also suggested for such
forecasts capabilities to be institutionalised through inter-agency cooperation to allow for
faster response time to impending disasters. These entities would be provided with, for
example, risk maps accompanied by S2S predictions.
Breakout Session: S2S predictions in various sectors
A breakout session was organised for participants to come together to discuss
emergencies caused by weather and climate and how S2S products can potentially be
applied. Participants were split into four groups: water resources, agriculture, public
health management (focusing on heatwave, air quality, and climate-related diseases), and
disaster risk reduction (flooding and landslides). Each group was allocated thirty minutes
to brainstorm and five minutes to present their ideas.
Participants were given discussion questions asking: (1) what specific S2S products
would be useful to the relevant applications, including minimum spatial resolution
required (e.g. provincial or national level), (2) the minimum length of lead-time desired,
(3) rainfall or temperature thresholds that the application would be sensitive to, and (4)
platforms (modes of delivery) and level of information that might be useful for different
types of end-users.
Water resources
Participants focused on hydrological droughts arising from shortfalls in
groundwater, reservoirs and lakes. Problems on water availability (and conservation)
were also discussed regarding the sufficiency for the whole population, specific population
or city area, for consumption, irrigation and ecology purposes. Local-scale resolution
information for monitoring water levels of river basins would be useful to detect
impending droughts. Also, drought-related indices such as the Standard Precipitation
Evaporation Index (SPEI) and soil moisture would be helpful to monitor drought cases.
For prediction purposes, tercile probabilities for above-, below- and near-normal rainfall
categories were mentioned as potential useful S2S products, as well as the outlook on the
number of dry days, with lead times between two weeks to less than three months.
During the Q&A session, the difficulty in translating S2S products was brought up.
It was suggested that more efforts were needed to explain the basis of the products at the
23national level. An example of such activities is climate or monsoon forums held at local
levels that include training for the community to read maps and interpret weather
forecasts from the available weather and climate information portals. It was also shared
that among variables linked to drought, temperature was also closely monitored apart
from rainfall.
Agriculture management
The key challenges identified in agriculture management were the need for
strategic planning and timing for ploughing (or tillage), sowing, transplanting of
seedlings, harvesting and post-harvesting, irrigation and treatments of crops.
Deterministic forecasts (with uncertainty bars to show the forecast spread) and tercile
probabilities (with thresholds of below- and above-normal) were the S2S products
mentioned that could be useful for agricultural applications. A lead time of two to three
weeks was also suggested to be enough for forecasting rainfall amount and temperature.
The timeliness of forecasts is necessary for both dry spells and wet conditions. It was also
shared that different spatial resolutions could be useful for various applications, in the
sense that institutes and agencies could benefit differently from the provincial, national
and transnational (regional) levels of information provided.
During the Q&A session, the example of the Australia 2018 heatwave, fire and
drought (which occurred mainly in the central, eastern and south-eastern regions of
Australia) was highlighted. In anticipation of such events, changes in local practices of
agriculture in Australia were necessary, such as farmers having to adjust timings for
treatment of crops to minimise losses due to fire and drought. Experienced farming
practices and seasonal predictions of the climate would help alleviate the problem of crop
losses, with farmers being mindful of the variability and changes in the climate from time
to time. In applying S2S products, the use of lead-times shorter than that of seasonal
prediction can be useful to prepare farmers for harvesting. For example, if rainfall is
forecasted to be consecutive for 15 to 20 days, it could help with initial harvesting for
specific crops.
Public health management (heatwave, air quality, and diseases)
Extreme temperatures (or dry weathers) in the region could lead to forest fires,
leading to haze and deterioration of air quality, affecting public health. Participants
discussed that predictions with a lead time of three months would benefit the government
24and community to prepare for risks of extreme temperatures and low rainfall. While
indices such as the Pollutant Standards Index (PSI) have been useful in providing health
advisories for the public, participants also discussed the feasibility of “age-dependent”
thresholds for the tolerance of air pollution.
During the Q&A session, various thresholds for warm temperatures was discussed,
for notifications of risks of extreme temperatures. In some countries, 40°C was the
threshold over which schools would be closed. Participants also mentioned the use of the
Heat Index provided by the World Meteorological Organization (WMO) to indicate the
risk of extreme temperatures and humidity levels. For S2S predictions of such events,
participants acknowledged the potential usefulness of S2S predictions but wondered if
they would end up with more false alarms than correct forecasts.
Disaster risk reduction (on flooding and landslides)
Participants discussed that municipal and communal (~1 to 2 km) resolutions
information are necessary for forecasting floods and landslides respectively. Information
required is the total amount of rainfall in flood- or landslide-prone areas, as well as the
duration and intensity of the rain. Other key inputs necessary for predicting the risk of
flooding or landslides are topography, slope, soil type, irrigation activities, water levels in
reservoirs or dams, and vegetation cover of the prone areas. Given the complexity of
landslides occurrences, and they could occur during rainy or non-rainy seasons,
participants questioned if S2S predictions could be effective. For flooding, the challenges
come more from downstream issues, for example, properly working drainage system that
can ensure smooth water flow out of the city.
In summary, participants highlighted that while S2S predictions can help inform
decisions to minimise the impact of exigencies, other downstream factors in the different
sectors can make the problems difficult to solve. Nevertheless, these problems present
opportunities to strengthen the links between the information providers (NMHSs) and
consumers (end-users).
25Real-time pilot project
As part of the second phase of the S2S Prediction Project, a real-time pilot initiative
has been developed with the WWRP’s Societal and Economic Research Applications
(SERA) group. The main goals include demonstrating the value of S2S forecasts in various
applications, promote the interdisciplinary research for the development of S2S
applications, as well as to reach more potential users of S2S forecasts. One of the 16
accepted application projects was submitted by ASMC, in collaboration with UNESCAP,
and RIMES for the development of S2S forecasts for disaster risk management in selected
Southeast Asia countries. With the
presence of NMHS representatives,
end-users, and the co-chairs of the
S2S Prediction Project, the last day
of the Workshop provided an
excellent opportunity for feedback
from the participants regarding the
workplan for the S2S-SEA real-time
Origins of the ASMC, UNESCAP, RIMES application for S2S
Real-time Pilot Project pilot project.
A draft workflow was presented to the participants to elicit feedback. The
preliminary plan for the pilot project was for ASMC to provide plots to NMHSs who would
then translate these for the NDMA participants (the end-users). To close the
communication loop, end-users will give regular feedback on how the information was
used, suggest what modifications are needed for the plots or assessments, and highlight
any weather- and climate-related disasters encountered. When discussing the feasibility
of this workflow, most participants thought the weekly cycles of information provided
would be too frequent to process, preferring instead every fortnight.
With regards to potential end-users to engage with, many of the countries identified
the national disaster risk management agencies (or national equivalent) in their country.
Some less commonly identified potential users were agriculture groups, water resources,
and public health. When asked about products of interests, most groups identified broad
categories (rainfall, temperature, wind, and SST). However, for participants who gave
specific examples, these varied widely between scales (weekly, 10-day, monthly), as well
as variables (rainfall anomalies, number of dry days, probability of heavy rainfall). The
discussions showed that while there is potential to use S2S information in Southeast Asia,
26narrowing down to the products relevant to particular end-users requires further in-depth
investigation.
Mr Randy Adrian from the ASEAN Secretariat closed this session by highlighting
the importance of such pilot projects to understand how to apply subseasonal forecast
information. He mentioned that there was potential for some regional support for such
projects and that regional agencies like ASMC and AHA Centre, NMHSs, and end-users
should work together to utilise the subseasonal forecast information and therefore better
prepare the region to mitigate against climate- and weather-related disasters.
27References
ESCAP, ASMC, and RIMES, 2019. Applying subseasonal-to-seasonal predictions to
improve disaster risk reduction in South-East Asia. [Online]
Available at: https://www.unescap.org/sites/default/files/Applying subseasonal-to-
seasonal predictions to improve disaster risk reduction in South-East Asia.pdf
[Accessed 1 January 2019].
Li, S. & Robertson, A. W., 2015. Evaluation of Submonthly Precipitation Forecast Skill
from Global Ensemble Prediction Systems. Monthly Weather Review, Volume 143, pp.
2871-2889.
Rahmat, R., Turkington, T., Kang, R. & Tan, W. L., 2018. Capability-Building
Programme in Sub-seasonal to Seasonal Prediction for Southeast Asia (S2S-SEA) - First
and Second Workshop. [Online]
Available at: http://www.s2sprediction.net/static/newsletter
Robertson, A. D., 2018. WWRP/WCRP Sub-seasonal to Seasonal Prediction Project
(S2S). [Online]
Available at: https://www.wcrp-climate.org/news/wcrp-newsletter/wcrp-news-
articles/1373-s2s-phase-ii
[Accessed 23 September 2019].
28Annex A – List of Participants
Facilitators and resource persons
Name Organisation
Dr. Frederic Vitart European Centre for Medium-Range Weather Forecasts
(ECMWF)
Dr. Andrew Robertson International Research Institute for Climate and Society (IRI)
Dr. Angel Munoz International Research Institute for Climate and Society (IRI)
Mr. Raizan Rahmat Meteorological Service Singapore
Dr. Thea Turkington Meteorological Service Singapore
Mr. Ryan Kang Meteorological Service Singapore
Mr. Tan Wee Leng Meteorological Service Singapore
Dr. Govindarajalu Srinivasan Regional Integrated Multi-Hazard Early Warning System for
Africa and Asia (RIMES)
Assoc. Prof. Koh Tieh Yong Singapore University of Social Sciences
Ms. Kareff May Rafisura United Nations Economic and Social Commission for Asia
and the Pacific (ESCAP)
Ms. Laura Hendy United Nations Economic and Social Commission for Asia
and the Pacific (ESCAP)
End-user participants
Name Organisation
Mr. Randy Adrain ASEAN Secretariat
Mr. Than Naing Soe Department of Disaster Management, Myanmar
Mr. Kritanai Torsri Hydro-Informatics Institute, Thailand
Ms. Siti Nooraznie Binti Abdul Ministry of Energy, Science, Technology, Environment and
Rahim Climate Change
Mr. Saysompheng Phonesavanh Ministry of Labour and Social Welfare, Lao PDR
Mr. Jeff Lim Chee Wei Singapore Food Agency
Mr. Pham Doan Khanh Viet Nam Disaster Management Authority
Mr. Mohamad Noor'Arifin bin Haji Brunei Darussalam Meteorological Department
Awang Yussof
National Meteorological and Hydrological Services participants
Name Organisation
Mr. Mohammad Affindi bin Haji Brunei Darussalam Meteorological Department
Sabli
Mr. Mayphou Mahachaleun Department of Meteorology and Hydrology, Lao PDR
Mr. Phapasit Khamphoumy Department of Meteorology and Hydrology, Lao PDR
Ms. Khin Win Maw Department of Meteorology and Hydrology, Myanmar
Ms. Myint Myint Aye Department of Meteorology and Hydrology, Myanmar
Mr. Rafizam Bin Ramli Malaysian Meteorological Department
Ms. Noor Azura Binti Ismail Malaysian Meteorological Department
29You can also read