European Road Safety Observatory - Road Safety Thematic Report - Pedestrians - European ...
←
→
Page content transcription
If your browser does not render page correctly, please read the page content below

European Road Safety Observatory

 Road Safety Thematic Report - Pedestrians
This document is part of a series of 20 thematic reports on road safety. The purpose is to give
road safety practitioners an overview of the most important research questions and results on
the topic in question. The level of detail is intermediate, with more detailed papers or reports
suggested for further reading. Each report has a 1-page summary.

The topic “pedestrians” is also addressed in the “Facts and Figures - Pedestrians”, presenting
more detailed and up-to-date European data in addition to this qualitative analysis.

Contract         This document has been prepared in the framework of the EC Service Contract
                 MOVE/C2/SER/2019-100/SI2.822066 with Vias institute (BE) and SWOV Institute
                 for Road Safety Research (NL).
Version          Version 1.3, March 2021
Author           Atze Dijkstra (SWOV)
Internal review Nina Nuyttens (Vias institute)
External review Victoria Gitelman (Technion)
Editor           Heike Martensen (Vias institute)
Referencing      Reproduction of this document is allowed with due acknowledgement. Please
                 refer to the document as follows:
                 European Commission (2021) Road safety thematic report – Pedestrians. Euro-
                 pean Road Safety Observatory. Brussels, European Commission, Directorate
                 General for Transport.
Source           The document is based on and partly cites SWOV fact sheet Pedestrians of July
                 2020: https://www.swov.nl/en/facts-figures/factsheet/pedestrians

Disclaimer
Whilst every effort has been made to ensure that the material presented in this document is rele-
vant, accurate and up-to-date, the (sub)contractors cannot accept any liability for any error or
omission, or reliance on part or all of the content in another context.
Any information and views set out in this document are those of the author(s) and do not neces-
sarily reflect the official opinion of the European Commission. The Commission does not guaran-
tee the accuracy of the data included in this study. Neither the Commission nor any person acting
on the Commission’s behalf may be held responsible for the use that may be made of the infor-
mation contained herein.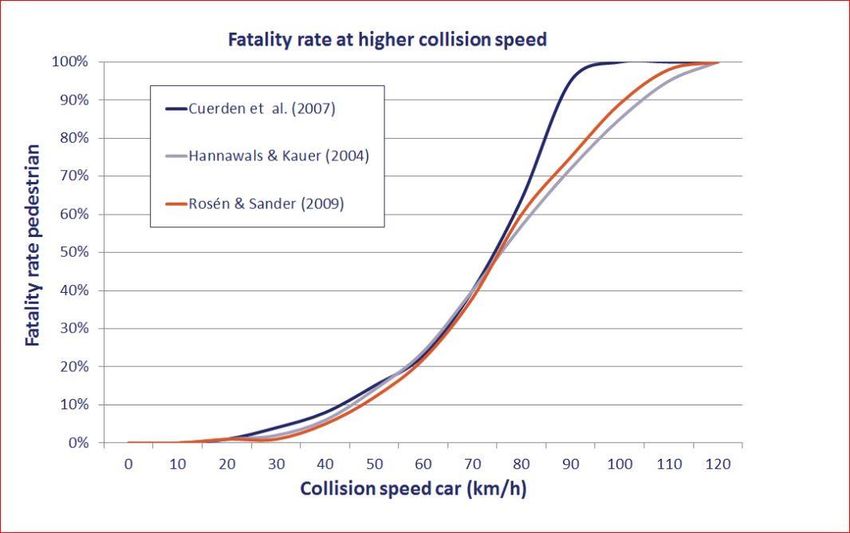
Road safety thematic report                                                      Pedestrians

                                    Contents
Summary ________________________________________________________________ 2
1   Highlights ____________________________________________________________ 3
2   What is the problem? ______________________________________________ 3
    2.1 Safety issues for pedestrians ___________________________________________________ 3
    2.2 How do pedestrians participate in traffic? ______________________________________ 3
         2.2.1 Age and gender __________________________________________________________4

3   Pedestrians and Road Safety______________________________________ 5
    3.1 Definition of a traffic-related crash _____________________________________________ 5
    3.2 Crash and injury risk____________________________________________________________ 5
    3.3 General trends in number of fatalities __________________________________________ 5
         3.3.1 Parties involved in crashes and their location ____________________________6
         3.3.2 Age and gender of pedestrian casualties _________________________________6
    3.4 Crash factors ___________________________________________________________________ 6
         3.4.1 Crash factors with older pedestrians _____________________________________7
         3.4.2 Crash factors with young pedestrians ____________________________________8

4   Countermeasures __________________________________________________ 8
    4.1 Land use planning ______________________________________________________________ 8
         4.1.1 Speed Management (area-wide) _________________________________________9
         4.1.2 Safe walking routes ______________________________________________________9
    4.2 Road design ____________________________________________________________________ 9
         4.2.1 Footpaths ________________________________________________________________9
         4.2.2 Crossing facilities ______________________________________________________ 10
    4.3 Visibility: lighting and reflecting devices ______________________________________ 12
    4.4 Vehicle design of crash opponents ___________________________________________ 12
    4.5 Education and training _______________________________________________________ 12
    4.6 Legal Framework and Enforcement __________________________________________ 13

5   Further reading ____________________________________________________ 13
6   References __________________________________________________________ 13

                                                1
Road safety thematic report                                                       Pedestrians

Summary
Pedestrians are vulnerable road users and suffer the most severe consequences in colli-
sions with other road users, because they are unprotected against the speed and mass of
the crash opponent. Collisions in which pedestrians cause injury to others are very rare.
About 15 - 25% of all journeys are undertaken on foot. Some groups walk more than oth-
ers, which is also reflected in their involvement in crashes. Age groups for which walking
is particularly common are children and seniors .
Half of all pedestrian fatalities in Europe are aged 65 or over. In particular, from 70 years
on, the number of pedestrian fatalities increases significantly.
Pedestrians comprise around 20% of all road deaths in the EU, a proportion that has re-
mained stable over the last decade. The proportion of fatalities who are pedestrians is
much higher for females compared to males. The number of pedestrians killed declined
by around 20% between 2010 and 2018.
Most pedestrian injuries occur in urban areas and indeed pedestrians account for 38% of
all road deaths in such areas. Cars account for over 70% of vehicles hitting pedestrians.
Most crashes involving pedestrians occur while crossing the road and frequently at pe-
destrian crossings which are usually the location at which roads are most often crossed.
This indicates that more care is needed when designing these crossings.
The factors identified as contributing to pedestrian crashes are: the road environment;
lack or design of crossing facilities; speed of motorised vehicles; their weight and design;
the unprotectedness of pedestrians; their (lack of) visibility; and finally the attitudes and
behaviours (including intoxication) of all road users.

Countermeasures
•   Land-use planning assigning space for pedestrians and physically separating them
    from motor traffic.
•   Good speed management and a default speed limit of 30 km/h in urban areas, since
    high speed is the most important causal and aggravating factor in pedestrian crashes.
•   Implementing safe walking routes, area-wide traffic calming, and improved crossing
    facilities.
•   Street lighting and the promotion of reflective devices for pedestrians to improve their
    visibility.
•   Vehicle design of crash opponents, with a pedestrian-friendly car front and and intelli-
    gent speed adaption to enforce low speeds. The new EU Regulation on type approval
    requirements for motor vehicles makes pedestrian detection linked to automatic
    emergency breaking mandatory for cars and vans. Moreover side and front detection
    of vulnerable road users and improved viewing conditions for the driver become man-
    datory for trucks and buses.
•   Education and training for motorists as well as ample opportunities for children to
    safely practice their pedestrian skills.
•   Legal framework and enforcement, to ensure safe behaviour by motorists and pedes-
    trians.

                                                2
Road safety thematic report Pedestrians
1 Highlights
• The age groups for which walking is particularly common are children and sen-
iors.
• Pedestrians account for 20% of all road deaths, but this rises to 38% in urban
areas.
• Pedestrians are particularly vulnerable in crashes with other road users.
• Half of the pedestrians killed in road crashes were 65 and over.
• Speed is the key factor in serious and fatal crashes involving pedestrians.
2 What is the problem?
2.1 Safety issues for pedestrians
In the traffic and transport system, pedestrians play a specific role. Walking is the begin-
ning and end of each journey (walking to a car, walking to public transport), and walking
can be the sole transport mode for the journey. Despite the clearly important role of
walking, little attention is paid to pedestrians and facilities for them. Moreover, pedestri-
ans are particularly vulnerable in crashes with other road users. Walking is not safe in
an environment with many motorised vehicles driving at high speeds and motorised ve-
hicles that are dangerous for pedestrians in crashes (Figure 1). The higher the speed of
the vehicle, the higher the percentage of pedestrians that are killed in road crashes.
Young and older pedestrians particularly are prone to danger from traffic.
Figure 1. Risk of pedestrian fatality for different impact speeds (fatality rate is the percentage of pedestrians
that are killed in a collision with a motorised vehicle) Source: Rosén et al. (2011)
2.2 How do pedestrians participate in traffic?
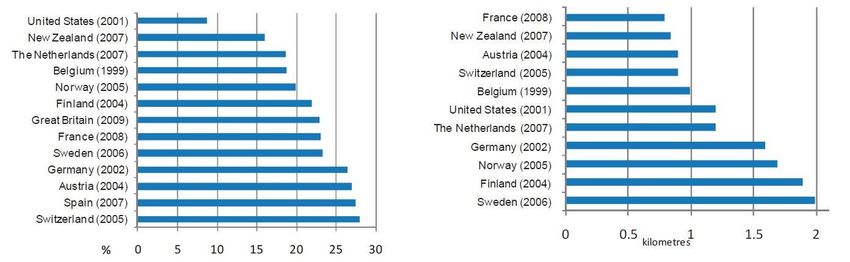
The incidence of walking relative to other modes of transport is documented in travel
surveys in various countries. For a number of countries, Figure 2 (left-hand side) shows
that the proportion of trips on foot varies between 8% and 27%. The distance travelled
on foot also varies (Figure 2, right-hand side) between 0.8 and 2 kilometres a day.
3Road safety thematic report Pedestrians
Figure 2 Proportion and average length of a walking trip in various OECD countries (OECD, 2010)
These differences in share and distance travelled reflect the way people travel in the
countries mentioned in Figure 2: in some countries, car use is high, in others bicycle use
is high. This in turn reflects traditions, distances between origins and destinations, road
networks, and the availability of public transport.
Figure 3 shows the frequency of walking trips for a number of European cities. This fig-
ure also shows differences between cities. The differences between these cities are
smaller than in Figure 2 above for countries.
How often do you walk on foot 10 minutes or more?
% responses Ghent Liège Tilburg Groningen Düsseldorf Dortmund Berlin Bergen Trondheim Total
Never 2.7 0.9 3.0 3.7 2.5 3.2 1.6 3.0 1.7 2.5
Once to a few 6.9 6.5 4.4 4.4 4.1 5.7 3.1 4.1 7.6 5.2
days a year
Once to a few 15.2 12.9 11.0 10.8 11.9 11.8 7.1 13.4 10.0 11.6
days a month
Once to a few 33.1 31.1 35.4 34.2 24.4 27.9 18.9 24.9 40.0 30.0
days a week
At least five 42.0 48.7 46.2 46.9 57.1 51.3 69.3 54.7 40.8 50.8
days a week
Figure 3 Frequency of trips on foot in some European cities (ISAAC, 2019)
2.2.1 Age and gender
Some groups of traffic participants walk more than others. These differences are also
reflected in their involvement in crashes. Age groups among which walking is particu-
larly common are children and seniors. Data from the Netherlands illustrate this: people
aged 75 or over make one-third of their journeys on foot. They use the car slightly more
often (38%), but considerably less often than younger adults aged 25 to 74, who drive
for more than half of their journeys. Children aged 0 to 11 make 29% of their journeys
on foot. The modal split for young adults (aged 18 to 24) is walking (20%), cycling (23%),
and public transport (18%). For young people in secondary school (aged 12 to 17), the
bicycle is by far the most important mode of transport: they use their bicycles for no
less than 52% of all trips.
4Road safety thematic report Pedestrians
Although few countries have as high a proportion of bicycle trips as the Netherlands,
data from other (European) countries show generally the same pattern: children and
older adults walk most, whereas teenagers cycle most (OECD, 2010).
Women tend to walk more than men. For instance, in Germany on an average day, 37%
of the women walk while 32% of the men do so. Women have access to a motor vehicle
to a lesser extent than men and they make more use of public transport (which involves
walking to and from the station for example). Among older people, where the share of
kilometres travelled on foot is higher than for other age-groups, women constitute a
larger part of the population because they live longer (Nobis & Kuhnimhof, 2018).
3 Pedestrians and Road Safety
3.1 Definition of a traffic-related crash
Not all incidents involving pedestrians are considered to be traffic-related. According to
the UNECE definition, road crashes must include at least one moving vehicle (UNECE,
Eurostat & ITF , 2019). Consequently, a pedestrian fall as a result, for example, of loose
paving stones is not regarded as a road crash. The same applies when a pedestrian falls
while boarding or alighting from a bus.
As a result of the above definition, incidents involving pedestrian falls are not included
in crash statistics, and very little is known about them. The few available studies in
OECD countries show that up to one third of pedestrian fatalities and three quarters of
injuries are due to falls in public spaces (Methorst, 2021). Even pedestrian crashes with
other vehicles – which do fall under the definition of a road crash - are disproportionally
under-reported in police crash statistics compared to what hospital records and other
studies show (WHO, 2013).
3.2 Crash and injury risk
For a pedestrian, the risk of getting killed in a road crash is approximately the same as
that for a car driver if it is calculated per minute spent travelling. However, because cars
travel much further in the same amount of time, the risk per kilometre travelled is more
than nine times higher for a pedestrian than for a car driver (Haddak, 2016).
3.3 General trends in number of fatalities
Between 2010 and 2018 pedestrian fatalities in the EU fell by around 20%, while the to-
tal number of fatalities decreased by 21%. In almost all countries of the EU, the number
of pedestrian fatalities has decreased over the past decade. (Facts and Figures Pedestri-
ans EC, 2021). Although data on this are less reliable, it seems that the number of pe-
destrians who were seriously injured in road crashes has declined much less (by only 6%;
ETSC, 2020).
5Road safety thematic report Pedestrians
It should be noted, however, that country-by-country reductions in the number of fatali-
ties cannot be assessed without also looking at trends in mobility. The numbers of pe-
destrian fatalities are affected both by the number of pedestrians and the number of
motorised vehicles with which crashes can occur.
3.3.1 Parties involved in crashes and their location
The fatalities in crashes involving pedestrians are virtually always the pedestrians them-
selves (98%). More than 70% of these crashes involved cars. Vans, motorcycles, and cy-
clists are each involved in 3% of the crashes in which pedestrians were fatally injured
(Facts and Figures Pedestrians EC, 2021; CARE, 2020).
Most pedestrian injuries (of whatever severity) are sustained in urban areas. In Euro-
pean countries, 73% of all pedestrian fatalities occur in urban areas where also most pe-
destrian traffic takes place. While pedestrians account for 20% of all road deaths, this
rises to 38% in urban areas (Facts and Figures Pedestrians EC, 2021).
However, in rural areas, crash severity is higher (OECD, 2010). Higher vehicle speed in
such areas is a key factor. Other contributing factors are the absence of pedestrian foot-
paths and street lighting (ECMT, 2000).
3.3.2 Age and gender of pedestrian casualties
In the EU, the number of pedestrian fatalities increases with age, and very dramatically
so from the age of 70 years on. Almost half of the pedestrians (50%) who died in a road
crash in 2018 were seniors of 65 years or over (see Facts and Figures Pedestrians, 2021, EC
2021).
For most age-groups, only a relatively small share of road-crash fatalities were pedestri-
ans. There are two exceptions to this (CARE 2020):
• Among senior fatalities, pedestrians form an ever-larger share: from just about
one quarter of fatalities among the 60 to 64 year-olds to more than half the fatal-
ities among the oldest seniors of 90 or over.
• Among children (aged 0-15), about one third of fatalities (35% in 2018) are pedes-
trians. Although the proportion is high, children nevertheless only account for a
small share of pedestrian fatalities (4%).
The proportion of fatalities who are pedestrians is much higher for females (32%) com-
pared to males (17%). Nevertheless men – who are more often involved in fatal crashes
than women – account for 63% of the fatally injured pedestrians.
3.4 Crash factors
About two thirds of pedestrians in severe road crashes were crossing the road (e.g., Car-
pentier et al, 2014; Hesjesvol & Hoye, 2019). Yue and colleagues (2020) identified the
main scenarios in fatal pedestrian crashes in Florida (listed below with the most fre-
quent contributing factors for each scenario):
6Road safety thematic report Pedestrians
• Vehicle going straight and pedestrian crossing the road (51%). Drivers distracted or
did not expect pedestrian to suddenly turn into their lane. View obstructed by
(parking) vehicle. Difficult viewing conditions: darkness or low sun.
• Vehicle turning left and pedestrian crossing the road at the exit (17%) or the entry
(3%) of the crossing. Often at signalised intersection when left turn was not pro-
tected by the signal. Driver was distracted by oncoming traffic. Pedestrian was
obstructed by other vehicles.
• Vehicle turning right and pedestrian crossing the road at the exit (12%) or the entry
(4%) of the crossing. Often at non-signalized intersections. Drivers focussed on
traffic coming from the left.
• Vehicle going straight and pedestrian in (3%) or adjacent to (6%) the road. Difficult
lighting conditions. Unexpected manoeuvre of pedestrian. Driver fails to leave
enough lateral space.
In two studies in Brussels, identifying the most frequent scenarios for pedestrian cross-
ing crashes, the main contributing factors for signal-regulated crossings were non-com-
pliance by the pedestrian (50%) and conflicting green-phases for pedestrians and turn-
ing motorists (25%) (Populer et al., 2018). For non-signalised crossings, the main factors
were obstructions of view due to other traffic participants or parked vehicles. Crashes
took place more often in the far lane than in the lane closest to the pedestrians’ point of
departure (Dupriez & Houdmont, 2009).
3.4.1 Crash factors with older pedestrians
Older pedestrians have a higher chance of being injured in a crash because of their
greater physical vulnerability, but also because locomotive functions deteriorate with
increasing age. As people age, functional limitations and disorders occur, such as re-
duced visual or auditory abilities, increased reaction times, difficulties with dividing at-
tention, and dementia. The decline of motor functions in particular can increase the
crash rate. In general terms, this decline consists of a slowing down of movement, a de-
cline in muscle strength, a decline in fine motor skills, and a particularly strong decline
in the ability to adapt to sudden changes in bodily position (SWOV, 2015).
An important cause of the high fatality rate among older pedestrians is the physical vul-
nerability of elderly people. Since their bones are more brittle and their soft tissue less
elastic, they run a higher risk of severe injury, compared with younger road users in-
jured with the same crash force (Ang et al., 2017).
Older pedestrians are over-represented in crashes at intersections, particularly at those
without traffic signals, and in crashes involving a turning vehicle. They have greater diffi-
culties in estimating the speed and distance of oncoming vehicles and tend to overesti-
mate their own walking speed. Like children, they have the tendency to look out for traf-
fic only in the near lane and ignore possible traffic in the far lane (Tournier et al., 2016).
Consequently, older pedestrians are also over-represented in crashes involving the
crossing of midblock road sections, particularly on wide multi-lane roads in heavy bi-di-
rectional traffic (Oxley et al., 2004, 2016). Although these are not road crashes according
to the common definition (see Section 3.1), pedestrian falls also occur more frequently
among older pedestrians, e.g. when boarding or exiting public transport, falls on foot-
paths, when stepping off kerbs, and while crossing the road (without being struck by a
7Road safety thematic report Pedestrians
vehicle). Although injuries resulting from pedestrian falls and other non-collision events
are generally not as severe as those where a vehicle is involved, they nevertheless rep-
resent a significant cause of trauma for older pedestrians (Oxley et al., 2004, 2016). See
also Thematic Report Seniors, EC, 2021.
3.4.2 Crash factors with young pedestrians
Most crashes involving children occur in the late afternoon, when they are either walk-
ing back home or playing outside. Several British studies have shown that most of the
child-pedestrian fatalities featured running or not paying attention at the time of the ac-
cident (Sentinella & Keigan, 2005; Carole Miller Research, 1998; Tight et al., 1996).
Variations between countries in the proportion of child fatalities that were travelling as
pedestrians reflect the country’s residential and traffic infrastructure and, not least, typi-
cal national habits such as children walking to school on their own or adults accompa-
nying or driving children to school (OECD, 2012).
4 Countermeasures
Long-term planning is needed to produce the fundamental changes that would improve
the safety and mobility of vulnerable road users. Measures require a framework that
takes the various needs of vulnerable road users into account, as set out in Sustainably
Safe Traffic (SWOV, 2018), Safe Systems (ITF, 2016) or the EU Road Safety Policy Frame-
work 2021-2030 (EC, 2019a). Road traffic casualties are no longer defined as a negative
but as a largely accepted side-effect of the road transport system. However, road fatali-
ties and severe injuries can and should be avoided. Where crashes still occur, the cir-
cumstances which determine the severity of these crashes should be addressed so that
in time the possibility of severe injury is virtually eliminated. In the framework of Sus-
tainable Safety (SWOV, 2018) a safe system is characterised by:
• A road structure that is adapted to the limitations of human capacity through proper
design, and in which roads have a clearly appointed function, as a result of which im-
proper use is prevented.
• Vehicles which are fitted with facilities to simplify the driver’s tasks and which are de-
signed to protect the vulnerable human being as effectively as possible.
• Road users who are adequately educated, informed and, where necessary, guided
and restricted.
4.1 Land use planning
In the 20th century, cities were designed and constructed to allow vehicular access and
encourage mobility. Initially, this implied access and mobility involving horses and carts,
then omnibuses, ‘horseless carriages’, and finally motor cars.
In more recent times, however, there has been a shift back from motorised vehicles to
vulnerable road users who are becoming a priority in the transport system. With the
road network legacy, designed primarily for motor vehicles, it is not always easy to cre-
ate room for pedestrians, but more and more cities are focussing on reducing motor
8Road safety thematic report Pedestrians
traffic and increasing the active transport modes (e.g., Vean, 2018; London; Kiviet, 2018;
Amsterdam; Kvashilava, 2018; Tblisi; ITF 2020; Fortaleza & Buenos Aires).
The pedestrian safety measures which are most comprehensive and most closely asso-
ciated with urban planning and policy philosophies include area-wide speed reduction or
traffic calming schemes, and integrated walking networks.
4.1.1 Speed Management (area-wide)
Speed is the key factor in serious and fatal crashes involving pedestrians. Speed also af-
fects injury severity, particularly for vulnerable road users such as pedestrians. A pedes-
trian who is hit by a car travelling at 65km/h is four times more likely to be killed com-
pared with a car travelling at 50km/h (cf. Thematic Report Speed, EC 2021). At collision
speeds below 30 km/h, collisions between motorised vehicles and pedestrians are much
less likely and if they do happen, they do not usually result in a fatality.
Physical measures such as speed humps can force speed reduction (Schoon, 2004), but
may meet with opposition from bus and emergency vehicle drivers as well as from resi-
dents if extensive ground vibrations occur. Speed reduction can also be achieved (alt-
hough to a lesser extent than by speed humps) by narrowing the carriageway or by a
raised crossing.
More and more cities in Europe have implemented a 30km/h zone in the city centre (in-
cluding Munich, Helsinki, Bilbao, Brussels, Madrid and Grenoble). There is a trend for
cities to extend these zones, with a 30km/h limit envisaged for all urban roads (cf. The-
matic Report Speed, EC 2021). The benefits are well proven: several systematic reviews
have looked at the effects of traffic calming and found that it reduces traffic collisions,
(Elvik et al. , 2009), road injuries and fatalities (Quigley, 2017; Aarts & Dijkstra, 2018).
4.1.2 Safe walking routes
To encourage walking among children, many municipalities are acting to introduce safer
schoolways (e.g., https://sicherzurschule.berlin/). In the Netherlands, many municipali-
ties have implemented 'Kid routes', child-friendly routes with a playful layout and easily
recognisable markings and signs leading children to their destination (De Jager et al.,
2005; Wassenberg & Milner, 2008).
4.2 Road design
Area-wide traffic calming, reduction of motor traffic, and lowering of speed are arguably
the measures which most increase pedestrian comfort and safety. The design of fea-
tures such as footpaths and crossing facilities should ideally be integrated in these
measures.
4.2.1 Footpaths
Footpaths must be physically separated from both motor and bicycle traffic. To ensure
their useability, also to people with reduced walking abilities or vision, they must be well
maintained without potholes and uneven paving stones to prevent falls and allow walk-
9Road safety thematic report Pedestrians
ers to focus on the traffic rather than on the ground. Crossing facilities should have lev-
elled access to the street rather than a high kerb which can pose an important obstacle
(Fournier et al., 2016).
4.2.2 Crossing facilities
In principle, there are four types of provisions for pedestrian crossings:
• Lowering the speed of motor vehicles; e.g., raised junctions, speed humps, axis off-
sets and 30 km/h zones.
• Separating motor vehicles and pedestrians in time; i.e., different kinds of traffic light
control: reduced waiting time or a longer green phase, green phases for pedestrians
separated from left- or right-turning vehicles.
• Physically separating motor vehicles and pedestrians; e.g., bridges, tunnels, viaducts,
pavements and centre islands.
• Increasing visibility and conspicuousness: lighting, markings, signage, and relocation
of lay-bys, parking spaces, and bus stops and other sight obstructions.
Not all these provisions are equally effective. By and large, provisions that lower driving
speeds or physically separate transport modes are most effective (Retting et al., 2003).
Pedestrian bridges and underpasses (the most ideal solution in terms of road safety)
are, however, not very popular. English pedestrians would prefer walking an extra two
and a half minutes to the next signalled crossing rather than use a pedestrian-bridge
and more than 5 extra minutes to avoid using an underpass (Anciaes & Jones, 2018).
4.2.2.1 Non-signalled crossing facilities
In terms of the effectiveness of marked pedestrian crossings (zebra paths), studies do
not all point in the same direction (Turner et al., 2006; Havard et al., 2012 and Gitelman
et al., 2017). A decrease in crash risk has been established in particular for marked cross-
ings on smaller roads with no more than two lanes, but for busy roads with more than
two lanes risk has been found to increase after implementation of marked crossings
(Hesjesvol & Hoye, 2019). Studies looking into the severity of pedestrian crashes at
marked crosswalks have, however, consistently found a significant reduction in the sever-
ity of pedestrian injuries (De Ceunynck & Focant, 2017). The following are the measures
that improve the safety of marked crossroads (Hesjesvol & Hoye, 2019):
• Elevated walkway (or speedbump): recommended where speed levels are too
high and on roads with a speed limit of 40 km/h or more.
• A centre island (refuge) in the middle of the road can make it easier for pedes-
trians to cross. Shorter stretches that must be crossed one by one and where
attention need only be directed to traffic from one direction at a time. At the
same time, a refuge can make motorists more aware and mean a narrowing
of the lane, thereby having a speed-reducing effect.
• Extension of sidewalks: Extensions of sidewalks (bulb-outs) reduce the dis-
tance that pedestrians have to travel, prevent parking cars and thus improve
visibility conditions, and can also function as a speed-reducing measure.
• Illumination of pedestrian crossings draws the attention of the motorists and
makes it easier for them to detect pedestrians in the dark.
10Road safety thematic report Pedestrians
• Automatic warning signs that are activated when a pedestrian approaches has
been shown to increase compliance by motorists.
• Guide fences : Fences that lead pedestrians to crossings are suggested by
Hesjesvol & Hoye (2019) because large numbers of pedestrians cross near
but not with the street markings. In combination with moving the stopping
line for motorists further away from where pedestrians cross, fences have
been shown to reduce the number of serious conflicts (De Ceunynck et al.,
2020, see Figure 2).
Figure 2 Moving the stopping line upstream in combination with guiding fences has been shown to reduce
the number of serious conflicts (De Ceunynck et al., 2020)
Studies focussing on risky crossings by pedestrians did not find any indication that pe-
destrians are less careful when the crossing facilities are better (De Langen, 2003; Fu et
al., 2018; Pulugurtha et al.; 2012). Fu et al., however, did show that pedestrians do not
always fully take into account the speed and the distance of oncoming vehicles.
At locations with many pedestrians, motorists pay more attention to them. This effect is
called “safety in numbers”: when more pedestrians cross the road the number of pedes-
trian crashes increases, but not proportionately to the number of pedestrians (Elvik,
2013). This is also true for other vulnerable road users: combining crossing facilities for
pedestrians and cyclists can be effective in increasing protection in numbers (Ryley, Hal-
liday & Emmerson, 1998). The advantage of a combined crossing is that it is more visible
for fast-moving traffic travelling on the major road.
4.2.2.2 Signal-regulated crossing facilities
For signal-regulated crossing facilities, the two largest problems are pedestrians failing
to obey the traffic lights (50%) and conflicting traffic light phases for turning vehicles and
pedestrians at their exit approach (25%; Populer, et al., 2018). Smart signalisation, that
can count the numbers of pedestrians and cyclists crossing, can achieve a fairer distri-
bution of waiting times for fast and slow traffic, and they often produce shorter waiting
cycles, which increases compliance and ultimately safety (Ryley, Halliday & Emmerson,
1998). Increasing crossing times for pedestrian or increasing the phase lengths has
been shown to reduce the crash risk for pedestrians (Chen 2012, Retting, 2002).
11Road safety thematic report Pedestrians
The design of signalised pedestrian crossings should follow the following principles
(Populer, 2018; SWOV, 2020):
• setting traffic light intervals to accommodate the walking speed of older pedestrians;
• setting traffic lights differently to avoid conflicts between turning cars and pedestri-
ans.
4.3 Visibility: lighting and reflecting devices
20% of crossing accidents happened in the dark (Ewert, 2012). While many actions are
being taken to improve young people’s visibility, this is not yet really the case with older
people. The Swiss BFU recommends the use of reflective gear, especially applied to the
legs, because this is where motor vehicle light beams are most concentrated and where
reflective gear is most noticeable due to leg movement (Ewert, 2012).
4.4 Vehicle design of crash opponents
The new EU Regulation on type approval requirements for motor vehicles (EC 2019)
makes Automatic Emergency Breaking (AEB) mandatory for cars and vans. Chauvel and
colleagues (2013) estimate that the number of pedestrians killed could be reduced by
15% and the number of pedestrian injuries by 38% if all passenger cars were equipped
with Automatic Emergency Breaking for Pedestrians (AEBP).
Moreover, vulnerable road user detection and warnings on the front and side will be
mandatory for busses and lorries, because these vehicles have large blind angles (EC
2019b). The problem with these systems is a relatively high rate of false alarms. There-
fore, they must be combined them with improved vision from the driver’s position (EC,
2019b). This can be realized with lowered windows that allow the driver to check visually
when there is a warning (e.g., Edwards et al., 2018 for busses) or with artificial intelli-
gence that can predict pedestrian behaviour (e.g., Ruf et al, 2019 for lorries).
For active protection systems for pedestrians like pop up bonnets and pedestrian airbags it
is expected that these can reduce can severe pedestrian head injuries at speeds up to
60 km/h (Reed, 2017).
Intelligent Speed Assistance (ISA) can effectively contribute to the safety of pedestrians
and cyclists by limiting drivers’ speed, particularly in zones with 30 km/h speed limits.
4.5 Education and training
Automobilists and other drivers have to learn how they can safely interact with pedestri-
ans, for example by incorporating hazard anticipation training with an emphasis on vul-
nerable road users in basic driver training and testing (Vlakveld, 2011).
Pedestrians need to learn by formal and informal education how to walk safely. Hoeks-
tra & Meskens (2010) have suggested giving more information to parents and carers
that emphasize the importance of walking in traffic together with children and setting a
good example rather than only explaining what the correct behaviour should be.
12Road safety thematic report Pedestrians
4.6 Legal Framework and Enforcement
Laws and – where necessary - penalties are important in providing protection for vul-
nerable road users and influencing driver behaviour. They also indicate government
commitment to road safety and show that the government is taking pains to balance
road safety, mobility and freedom. Laws that are particularly relevant to the safety of
pedestrians are those governing speeding, compliance at pedestrian crossings, and
dangerous driving.
5 Further reading
Pedestrian safety, urban space and health. Organisation for Economic Co-operation and
Development OECD, Paris, 2010.
Pedestrian safety; A road safety manual for decision-makers and practitioners. World
Health Organization, Geneva, Switzerland, 2013.
Exploring the Pedestrians Realm; An overview of insights needed for developing a gen-
erative system approach to walkability. TRAIL Thesis Series no. T2021/6, the Neth-
erlands Research School TRAIL. Delft University of Technology, 2021.
6 References
Aarts, L. & Dijkstra, A. (2018). DV3 – Achtergronden en uitwerking van de verkeersveilig-
heidsvisie; De visie Duurzaam Veilig Wegverkeer voor de periode 2018-2030 onder-
bouwd. SWOV, Den Haag.
Anciaes, P.R. and Jones, P. (2018). Estimating preferences for different types of pedes-
trian crossing facilities. In: Transportation Research Part F, Voume 52, pp. 222–237.
Ang, B. H., Chen, W. S., & Lee, S. W. H. (2017). Global burden of road traffic accidents in
older adults: A systematic review and meta-regression analysis. Archives of Geron-
tology and Geriatrics, 72, 32–38.
Bly, P., Dix, M. & Stephenson, C. (1999). Comparative study of European child pedestrian
exposure and accidents. MVA Ltd., London.
Carole Miller Research (1998). The older child pedestrian casualty. Central research unit,
Edinburgh.
CARE (2020). Community database on Accidents on the Roads in Europe. Data extracted
27 December 2020. https://ec.europa.eu/transport/road_safety/specialist/statis-
tics_en#
Chauvel, C., Page, Y., Fildes, B., & Lahause, J. (2013). Automatic emergency braking for
pedestrians effective target population and expected safety benefits. 1–9.
Chen, L., C. Chen, R. Ewing, C. McKnight, R. Srinivasan, and M. Roe (2012). Safety Coun-
termeasures and Crash Reduction in New York City—Experience and Lessons
13Road safety thematic report Pedestrians
Learned. Accident Analysis and Prevention.
http://dx.doi.org/10.1016/j.aap.2012.05.009
De Ceunynck, T., Focant, N. (2017), Implementation of marked crosswalks, European
Road Safety Decision Support System, developed by the H2020 project SafetyCube.
Dupriez, B., & Houdmont, A. (2009). Gedetailleerde analyse van ongevallen in het Brus-
sels Hoofdstedelijk Gewest (2000-2005). Brussels Mobility D/2009/0779/87.
ECMT (2000). Safety in traffic for vulnerable users. European conference of ministers of
transport.
EC (2019a) EU Road Safety Policy Framework 2021-2030 - Next steps towards "Vision
Zero". Commission staff working document, European Commission Brussels, Bel-
gium. https://ec.europa.eu/transport/road_safety/sites/roadsafety/files/move-
2019-01178-01-00-en-tra-00_3.pdf
EC (2019b). Regulation (EU) 2019/2144 of the European Parliament and of the Council.
https://eur-lex.europa.eu/eli/reg/2019/2144/oj
Edwards, A.; Barrow, A; O’Connell, S; Krishnamurthy, V.; Khatry, R.; Hylands, N.; Mc Car-
thy, M.; Helman, S. & Knight, I. (2018). Analysis of bus collisions and identification of
countermeasures. Published project report PPR819. Transport Research Laborato-
ries, Berks. http://content.tfl.gov.uk/analysis-of-bus-collisions-and-identification-of-
countermeasures.pdf
Elvik, R. Hoye, A. Vaa, T. & Sorensen, M. (2009). The handbook of road safety measures.
Second edition. Emerald Group Publishing Ltd, Bingley, UK. Elvik, R. (2013). Safety-
in-numbers: Estimates based on a sample of pedestrian crossings in Norway. Acci-
dent Analysis & Prevention, 91, 175-182.
ETSC (2016). Revision of the regulation on protection of pedestrians and other vulnera-
ble road users; Position paper. European Transport Safety Council ETSC, Brussels.
ETSC (2020). How safe is walking and cycling in Europe? Pin Flash Report 38. European
Transport Safety Council ETSC, Brussels.
Ewert, U. (2012). Senioren als Fussgänger bfu-Faktenblatt Nr 8. Beratungsstelle für Un-
fallverhütung, Bern.
Fu, T., Miranda-Moreno, L. & Saunier, N. (2018). A novel framework to evaluate pedes-
trian safety at non-signalized locations. In: Accident Analysis & Prevention, vol. 111,
pp. 23-33.
Gitelman V., Carmel R., Pesahov F., Hakkert S. An examination of the influence of cross-
walk marking removal on pedestrian safety as reflected in road user behaviours.
Transportation Research Part F 46 (2017), 342-355.
Haddak, M.M. ( 2016 ). Exposure-based road traffic fatality rates by mode of travel in
France. In: Transportation Research Procedia, 14, pp. 2025 – 2034.
Havard, C., & Willis, A. (2012). Effects of installing a marked crosswalk on road crossing
behaviour and perceptions of the environment. Transportation Research Part F, 15,
249–260.
14Road safety thematic report Pedestrians
Hesjesvol, I. & Hoye, A. (2019) Pedestrian crossing options. Chapter 3.14 of the Hand-
book of Road Safety Measures. Downloaded 15/02/2021 from: https://trans-
late.google.com/translate?sl=auto&tl=en&u=https://www.tshandbok.no/del-2/3-
trafikkregulering/doc663/.
Hoekstra, A.T.G. & Mesken, J. (2010). De rol van ouders bij informele verkeerseducatie;
Vragenlijststudie naar kennis, behoeften en motieven van ouders. Publication R-
2010-31. SWOV, Leidschendam.
ITF (2016), Zero Road Deaths and Serious Injuries: Leading a Paradigm Shift to a Safe
System, OECD Publishing, Paris. http://dx.doi.org/10.1787/9789282108055-en
ITF (2020), Best Practice for Urban Road Safety. https://www.itf-oecd.org/best-practice-
urban-road-safety.
ISAAC (2019). Determinants and barriers of walking, cycling and using Personal e-Trans-
porters: a survey in nine European cities. ISAAC project, Brussels.
Jager, D. de, Torenstra, J., Haas, J. de & Spapé, I. (2006). Veilige kindcorridor in steden;
Kindlint zet dit jaar eerste stapjes in Amsterdam en Delft. Verkeerskunde, 57(4), pp.
34-39.
Kvashilava, G. (2018), Walkable and Bike-Friendly Tbilisi. Presentation at ITF Safer City
Streets, 28 November, 2018. https://www.itf-oecd.org/walkable-and-bike-friendly-
tbilisi.
Kievit, E. de; (2018) Walkability in Amsterdam: More space for the mother of all modes
of transport. Presentation at ITF Safer City Streets, 28 November, 2018.
https://www.itf-oecd.org/walkability-amsterdam-more-space-mother-all-modes-
transport.
Langen, de, A.C.B. (2003). Veiligheid van enkele typen oversteekvoorzieningen in stede-
lijke gebieden. Analyse van ongevallengegevens en gedragswaarnemingen. Publica-
tion R-2003-23. SWOV, Leidschendam.
McVean, B. (2018), Prioritising walking to create a safe and accessible city. Presentation
at ITF Safer City Streets, 28 November, 2018. https://www.itf-oecd.org/prioritising-
walking-create-safe-and-accessible-city.
Mead, J., Zegeer, C., & Bushell, M. (2014). Evaluation of pedestrian-related roadway
measures: A summary of available research, Report DTFH61-11-H-00024. Federal
Highway Administration.
Methorst (2021). Exploring the Pedestrians Realm; An overview of insights needed for
developing a generative system approach to walkability. TRAIL Thesis Series no.
T2021/6, the Netherlands Research School TRAIL. Delft University of Technology,
The Netherlands.
OECD (1998). Safety of vulnerable road users. Organisation for Economic Co-operation
and Development OECD, Paris.
OECD (2004). Keeping children safe in traffic. Organisation for Economic Co-operation
and Development OECD, Paris.
15Road safety thematic report Pedestrians
OECD (2010). Pedestrian safety, urban space and health. Organisation for Economic Co-
operation and Development OECD, Paris.
Oxley, J., Corben, B., Fildes, B., O'Hare, M. & Rothengatter, T. (2004). Older vulnerable
road users: measures to reduce crash and injury risk. MUARC Report No. 218. Acci-
dent Research Centre MUARC, Monash University, Clayton, Victoria.
Oxley, J., O'Hern, S., Burtt, D., Rossiter, B. (2016). Fall-Related Injuries While Walking in
Victoria, Victoria Walks, Melbourne.
Populer, M.; Chalanton, I. & Focant, N. (2018). Ongevallen met voetgangers op of in de
buurt van lichtengeregelde voetgangersoversteekplaatsen. VIAS Institute, Brussels.
Pulugurtha, S.S., Vasudevan, V., Nambisan, S.S. & Dangeti, M.R. (2012). Evaluating effec-
tiveness of infrastructure-based countermeasures for pedestrian safety. In: Trans-
portation Research Record, Vol. 2299, Nr. 1, pp. 100-109.
Reed, S. (2017), Active Technology for Pedestrian Protection, European Road Safety De-
cision Support System, developed by the H2020 project SafetyCube. Retrieved from
www.roadsafety-dss.eu on 05/22/2020
Retting, RA, Chapline, JF, & Williams, AF (2002). Changes in crash risk following re-timing
of traffic signal change intervals. Accident Analysis & Prevention, 34 (2), 215-220.
Retting, R.A., Ferguson, S.A. & Hakkert, A.S. (2003). Effects of red light cameras on viola-
tions and crashes: a review of the international literature. In: Traffic Injury Preven-
tion, Vol. 4, Nr. 1, p. 17-23.
Ruf, M.; Neumann, C.; Lützner, J.; Eilers, C. (2019). Digital Guardian Angels - Right-turn
Assistants for Commercial Vehicles. ATZ worldwide, 121(1), 16–21.
Quigley, C (2017), Implementation of 30-Zones, European Road Safety Decision Support
System, developed by the H2020 project SafetyCube.
Rosén, E., Stigson, H. & Sander, U. (2011). Literature review of pedestrian fatality risk as
a function of car impact speed. Accident Analysis and Prevention, 43, pp. 25-33.
Ryley, T., Halliday, M. & Emmerson, P. (1998). Toucan crossings; Trials of nearside equip-
ment. TRL Report No. 331. Transport Research Laboratory TRL, Crowthorne, Berk-
shire.
Schoon, C.C. (2004). Botsingen van het type 'fietser - autofront'; Factoren die het on-
tstaan en de letselernst beïnvloeden [Cyclist- car front collisions; Factors that influ-
ence occurrence and injury severity]. R-2003-33. SWOV Institute for Road Safety Re-
search, Leidschendam.
Sentinella, J., & Keigan, M. (2005). Young adolescent pedestrians' and cyclists' road
deaths: analysis of police accident files. Prepared for the Department for Transport,
Road Safety Division. TRL Report; No. 620 Transport Research Laboratory TRL,
Crowthorne, Berkshire.
Stoker, P., Garfinkel-Castro, A., Khayesi, M., Odero, W., Mwangi, M. N., Peden, M., &
Ewing, R. (2015). Pedestrian safety and the built environment: A review of the risk
factors. Journal of Planning Literature, 30(4), 377–392.
16Road safety thematic report Pedestrians
SWOV (2015). The elderly in traffic. SWOV Fact sheet. SWOV Institute for Road Safety Re-
search, The Hague.
SWOV (2018). Sustainable Safety 3rd edition – The advanced vision for 2018-2030; Prin-
ciples for design and organization of a casualty-free road traffic system. SWOV, The
Hague
SWOV (2020). Pedestrians. SWOV Fact sheet. SWOV Institute for Road Safety Research,
The Hague.
Tight, M.R., Carsten, O.M.J., Kirby, H.R., Southwell, M.T. & Leake, G.R. (1996). A review of
road safety research on children as pedestrians: How far can we go towards im-
proving their safety? IATSS Research, 20(2), pp. 69 74.
Tournier, I.; Dommes, A. & Cavallo, V. (2016). Review of safety and mobility issues
among older pedestrians. Accident Analysis and Prevention 91 (2016) 24–35 Con-
tents.
Turner, S., Fitzpatrick, K., Brewer, M., Park, E.S., 2006. Motorist yielding to pedestrians at
unsignalized intersections: findings from a national study on improving pedestrian
safety. Transportation Research Record 1982, 1–12.
UNECE, Eurostat & ITF (2019). Glossary for transport statistics. European Union, United
Nations, ITF and OECD. Publications office of the European Union, Luxembourg.
Verkeersnet (2013). Verkeersbrigadiers naar VVN. Verkeersnet.
Vlakveld, W.P. (2011). Hazard anticipation of young novice drivers; Assessing and en-
hancing the capabilities of young novice drivers to anticipate latent hazards in road
and traffic situations. PhD Thesis, University of Groningen. SWOV dissertation se-
ries. Leidschendam, the Netherlands: SWOV Institute for Road Safety Research.
Ward, H.J. et al. (1994). Pedestrian activity and accident risk. AA Foundation for Road
Safety Research, Basingstoke, Hampshire.
Wassenberg, F. & Milder, J. (2008). Evaluatie van het project Kindlint in Amsterdam.
Onderzoeksinstituut OTB, Delft.
Webster, D., and R. Layfield (2007). Review of 20 mph zones in London Boroughs, TRL.
PPR243.
WHO (2013). Pedestrian safety; A road safety manual for decision-makers and practi-
tioners. World Health Organization, Geneva, Switzerland.
Yue, L.; Abdel-Aty, M.; Wu, Y.; Zheng, O.; Yuan, J. (2020). In-depth approach for identify-
ing crash causation patterns and its implications for pedestrian crash prevention.
Journal of Safety Research, 73(), 119–132. doi:10.1016/j.jsr.2020.02.020
Zegeer, C.V., Richard, S.J., Huang, H. & Lagerwey, P. (2001). Safety effects of marked ver-
sus unmarked crosswalks at uncontrolled locations: Analysis of pedestrian crashes
in 30 cities. In: Transportation Research Record, vol. 1773, nr. 1, pp. 56-68.
Zegeer, C. V., & Bushell, M. (2012). Pedestrian crash trends and potential countermeas-
ures from around the world. Accident Analysis and Prevention, 44, 3–11.
17You can also read