Detailed analysis of ports and shipping operations - Annex to Motorways of the Sea Detailed Implementation Plan April 2018
←
→
Page content transcription
If your browser does not render page correctly, please read the page content below
Detailed analysis of ports and
     shipping operations

 Annex to Motorways of the Sea
  Detailed Implementation Plan
            April 2018

            Mobility
            and Transport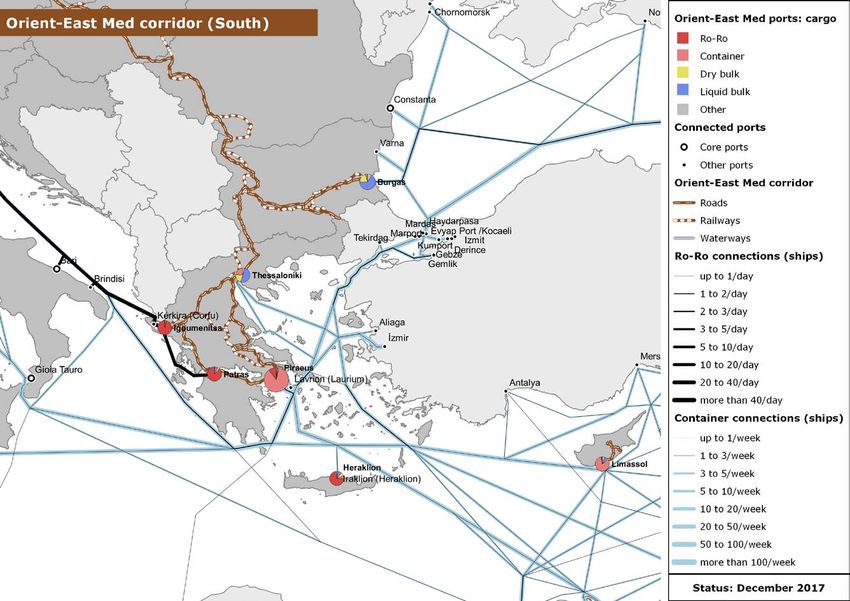
MOVE/B1/2015-2018 STUDY ON THE TEN-T MOTORWAYS OF THE SEA HORIZONTAL PRIORITY
of the EUROPEAN COMMISSION DIRECTORATE-GENERAL FOR MOBILITY AND TRANSPORT
Directorate B – European mobility network
TABLE OF CONTENTS
Introduction ........................................................................................ 4
1. Detailed analysis of TEN-T ports .................................................... 6
1.1. The TEN-T core and comprehensive network ports ..................... 7
1.2. The Core Network Ports .......................................................... 8
1.3. The network of intra-European Motorways of the Sea ............... 11
2. Bottlenecks and investment needs .............................................. 13
2.1. Port investment needs including sea-side and land-side
infrastructure ...................................................................... 19
2.2. MoS links and investment needs in the European short sea
fleet ................................................................................... 26
2.3. Needs with regard to wider benefit projects ............................ 32
3. Estimating total costs per pillar of the Detailed Implementation
Plan ............................................................................................. 35
3.1. Environment ....................................................................... 35
3.2. Maritime transport integration in the logistics chain ................. 37
3.3. Safety, Traffic Management, and the Human Element .............. 38
3.4. Conclusion: Total MoS investment needs and timeline .............. 39
4. Summary ..................................................................................... 42
Annex 1: List of ports in the comprehensive network........................ 43
Annex 2: Comprehensive network ports’ cargo traffic ....................... 51
Annex 3: CNC ports and their regular container connections 2017 .... 62
4.1. Baltic-Adriatic Corridor ......................................................... 63
4.2. North Sea-Baltic Corridor ...................................................... 66
4.3. Mediterranean Corridor ........................................................ 71
4.4. Orient-East Med Corridor ...................................................... 75
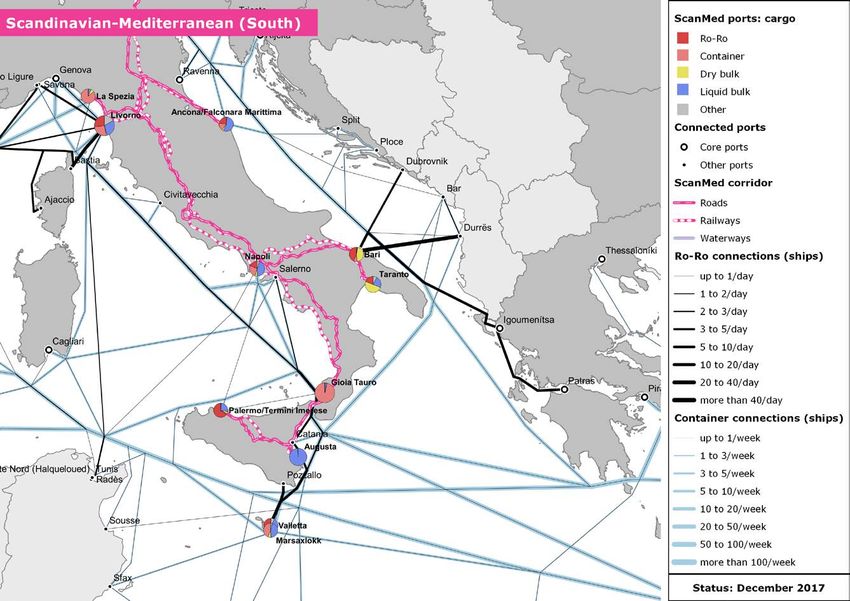
4.5. Scandinavian-Mediterranean Corridor ..................................... 79
4.6. hine-Alpine Corridor ............................................................. 85
4.7. Atlantic Corridor .................................................................. 89
4.8. North Sea-Mediterranean Corridor ......................................... 92
4.9. Rhine-Danube Corridor ......................................................... 98
MoS DIP 2nd progress report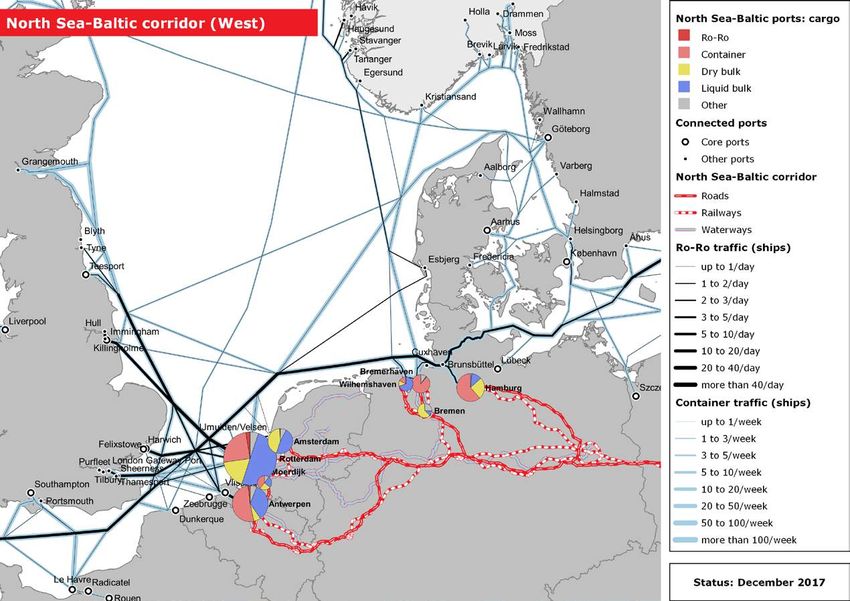
MOVE/B1/2015-2018 STUDY ON THE TEN-T MOTORWAYS OF THE SEA HORIZONTAL PRIORITY
       of the EUROPEAN COMMISSION DIRECTORATE-GENERAL FOR MOBILITY AND TRANSPORT
                                              Directorate B – European mobility network

Introduction

This document (known as the MoS Study) analyses in detail the TEN-T
core and comprehensive seaports in order to identify and define horizontal
priorities aiming at a better integration of seaports in the TEN-T network.
The market-based findings of the study provide a supplementary basis for
the MoS Coordinator, in synergy with the Detailed Implementation Plan
(DIP) for developing his recommendations. Chapter 1 of the study
presents an overview of cargo traffic per segment in core and
comprehensive ports in 2016. This is intended to provide an overall
picture of maritime traffic in the EU, with a focus on seaports as entry
points to the Core Network Corridors (CNCs). The chapter is
complemented by extensive annexes with tables and maps on the
maritime connectivity of the European core and comprehensive network
seaports.

Following this analysis, the study identifies in Chapter 2 the main
bottlenecks and investment needs in the European port landscape related
to Motorways of the Sea based on a survey of ship operators and ports as
well as on data analysis and desk research. The analysis is crucial for
prioritising the most urgent lines of development for the future Motorways
of the Sea programme as well as for serving as a basis for estimating the
overall costs per pillar as presented in Chapter 3.

To recall, the MoS Coordinator’s DIP presented a number of
recommendations for the further development of the EU short sea
shipping sector through the Motorways of the Sea funding programme
under three pillars: Environment; Integration of maritime transport in the
logistics chain; and Safety, Traffic Management and Human Element.

The identification of investment needs and related cost estimations based
on solid and verifiable data are of utmost importance for supporting the
recommendations formulated by the MoS Coordinator in his Detailed
Implementation Plan. 1

1
  It is worth mentioning that in March 2018, the European Seaports Organisation published a study
with the title ‘The infrastructure investment needs and financing challenge of European Ports’.
While overlaps in results with the present MoS study could be expected, a comparison with the
ESPO study is not feasible as the study does not provide figures for all the investment categories
found in the MoS study. In addition, the ESPO study includes large investment projects for deep
sea traffic which are not within the scope of the present study.

                                                       MoS · Study on ports and shipping operations   4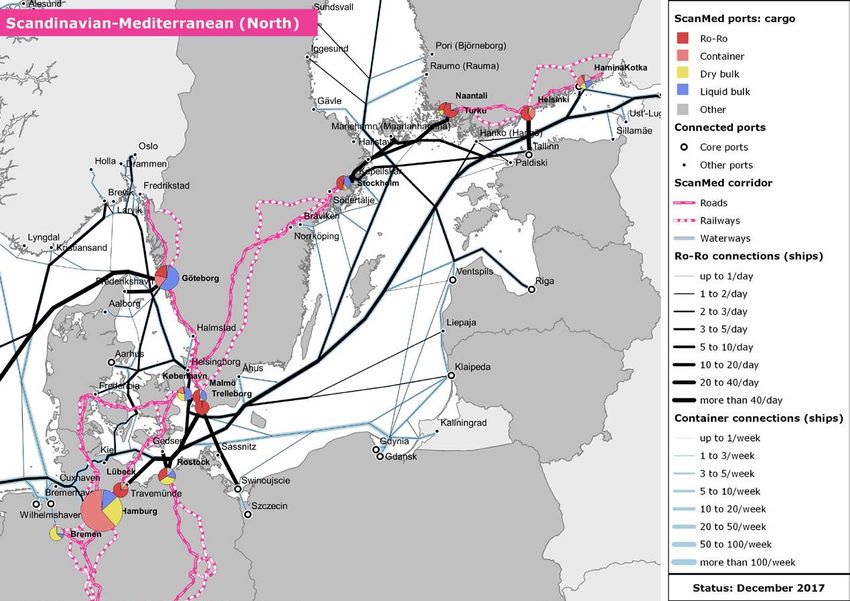
MOVE/B1/2015-2018 STUDY ON THE TEN-T MOTORWAYS OF THE SEA HORIZONTAL PRIORITY
     of the EUROPEAN COMMISSION DIRECTORATE-GENERAL FOR MOBILITY AND TRANSPORT
                                            Directorate B – European mobility network

The following diagram illustrates the two parallel processes of the DIP and
the MoS study.

                                                 MoS · Study on ports and shipping operations   5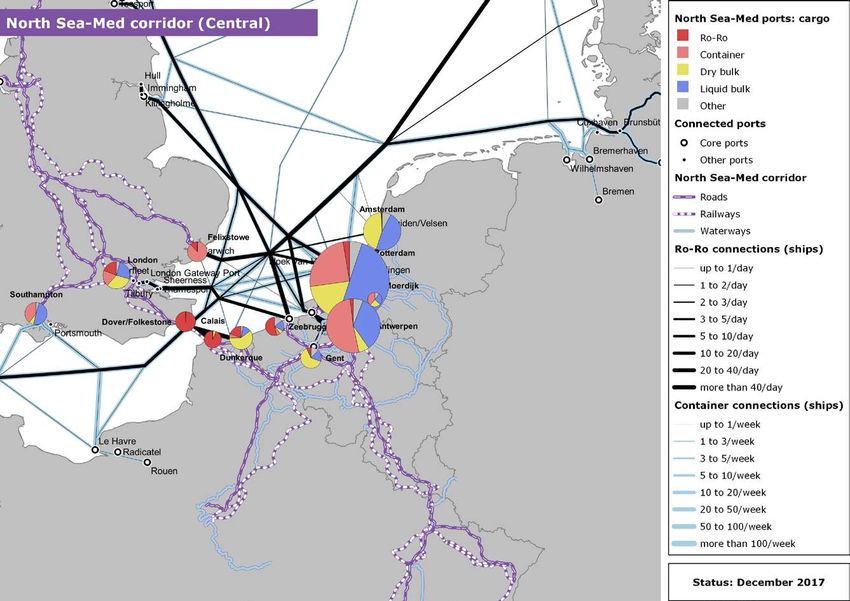
MOVE/B1/2015-2018 STUDY ON THE TEN-T MOTORWAYS OF THE SEA HORIZONTAL PRIORITY
        of the EUROPEAN COMMISSION DIRECTORATE-GENERAL FOR MOBILITY AND TRANSPORT
                                               Directorate B – European mobility network

      1. Detailed analysis of TEN-T ports 2

There are 331 seaports in the TEN-T core and comprehensive network and
these handled 3.5 billion tonnes in 2016, of which 2.6 billion tonnes were
handled in the 84 ports situated on the Core Network Corridors (CNCs).

There are further 22 core network ports that are not part of the Core
Network Corridors. Most of these ports lie far away from the main land-
based corridors so their integration into the CNC network would involve a
considerable amount of additional infrastructure. Eight ports in the UK
located off the London-Manchester-Glasgow axis are included in this
group. Spain counts six such ports – two in North Spain and three on the
Canary and Balearic Islands. In general, these ports play an important
role for serving their regional markets, but they are not part of major
international transit routes in the hinterland.

Figure 1:       Core Network Corridor ports and Comprehensive Network ports

Source: ISL based on Eurostat

2
    covering Tasks 2.1 and 3.1

                                                       MoS · Study on ports and shipping operations   6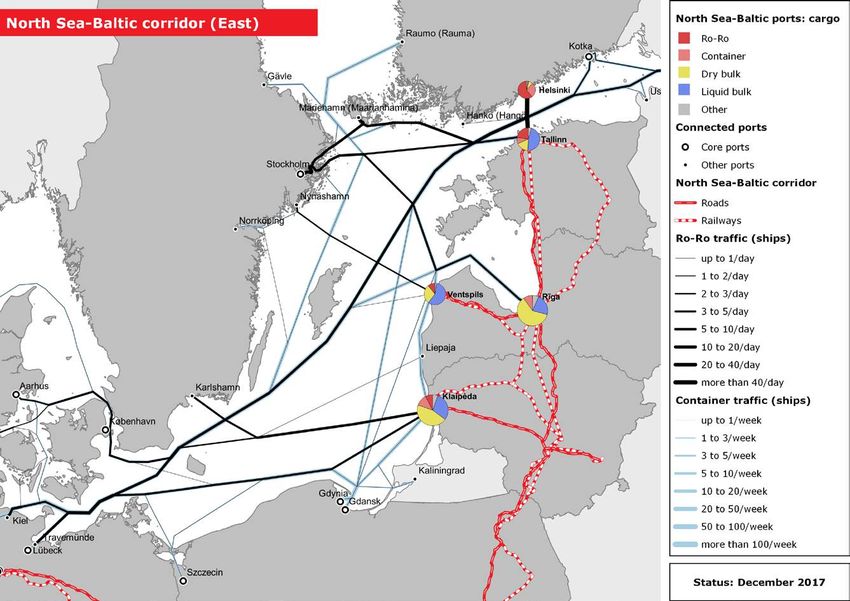
MOVE/B1/2015-2018 STUDY ON THE TEN-T MOTORWAYS OF THE SEA HORIZONTAL PRIORITY
     of the EUROPEAN COMMISSION DIRECTORATE-GENERAL FOR MOBILITY AND TRANSPORT
                                            Directorate B – European mobility network

The traffic profile and main characteristics of the core and comprehensive
network ports are outlined below.

1.1. The TEN-T core and comprehensive network ports

The full list of maritime ports included in the core and comprehensive
network (see Annex 1) spans 23 EU Member States. In total, 3.5 billion
tonnes were handled in 2016. While the vast majority of bulk traffic is
subject to tramp shipping without regular schedules, container and ro-ro
traffic are almost exclusively transported on regular shipping services. Out
of the total 3.5 billion tonnes, 1.2 billion tonnes were generated by these
regular shipping services, namely 0.8 billion tonnes of container traffic and
0.4 billion tonnes of ro-ro traffic.

Figure 2:     Total cargo traffic of core and comprehensive network ports by type 2016 (billion
              tonnes)

                       Other       Ro-Ro
                        0,2       freight
                                    0,4

       Liquid bulk                          Container
           1,3                                 0,8

                                Dry bulk
                                  0,8

Source: ISL based on Eurostat

The network of regular shipping services to and from EU ports is large and
very diverse. Early in 2017, 408 regular container shipping services and
450 ro-ro services were identified.

The container services included 150 deep sea services and 15 services
within one Member State only. The remaining 243 services were
connecting at least two Member States or one Member State with a

                                                        MoS · Study on ports and shipping operations   7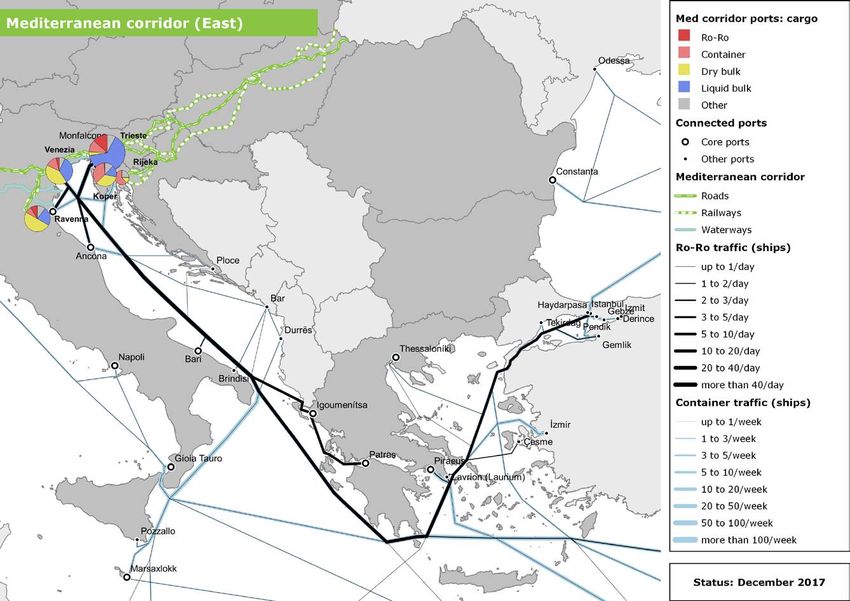
MOVE/B1/2015-2018 STUDY ON THE TEN-T MOTORWAYS OF THE SEA HORIZONTAL PRIORITY
     of the EUROPEAN COMMISSION DIRECTORATE-GENERAL FOR MOBILITY AND TRANSPORT
                                            Directorate B – European mobility network

neighbouring country. In terms of volume, around half of the container
traffic of the comprehensive network ports was short sea traffic and half of
it was deep sea traffic.

The deep sea container traffic is concentrated in a number of hub ports.
Only 36 out of 331 ports reported more than one million tonnes of
containerised cargo directly coming from or going to ports outside Europe.
The top 10 European ports handled 80 % of this cargo. Short sea traffic
(including feeder traffic) is much more dispersed: 63 ports handled more
than one million tonnes and the top 10 ports only accounted for little more
than half of the total short sea container volume.

Overall, almost half of the 331 core and comprehensive network ports
reported container traffic. Out of these 161 ports, container traffic
exceeded one million tonnes in 70 ports (see Annex 2).

For ro-ro shipping (excluding traded vehicles), regular deep sea services
are the exception (12 services). Indeed, there are many more connections
between ports within one Member State (179 services). The number of
services connecting (at least) two Member States or one Member State
with a neighbouring country hence reaches 259 services. The network
comprises 185 ports having reported ro-ro cargo traffic in 2016, of which
86 have handled more than one million tonnes. Less than 2% of the total
ro-ro volume has its origin or destination overseas.

1.2. The Core Network Ports

The 84 Core Network Ports situated on one of the Core Network Corridors
2.6 billion tonnes of cargo in 2016. Their traffic profile is similar to the
profile of the full set of ports, with one notable difference: the share of
container traffic is considerably higher. This is due to the fact that the CNC
ports cover 93% of the total container traffic, while their share ranges
between 62% and 73% in the other cargo segments.

                                                 MoS · Study on ports and shipping operations   8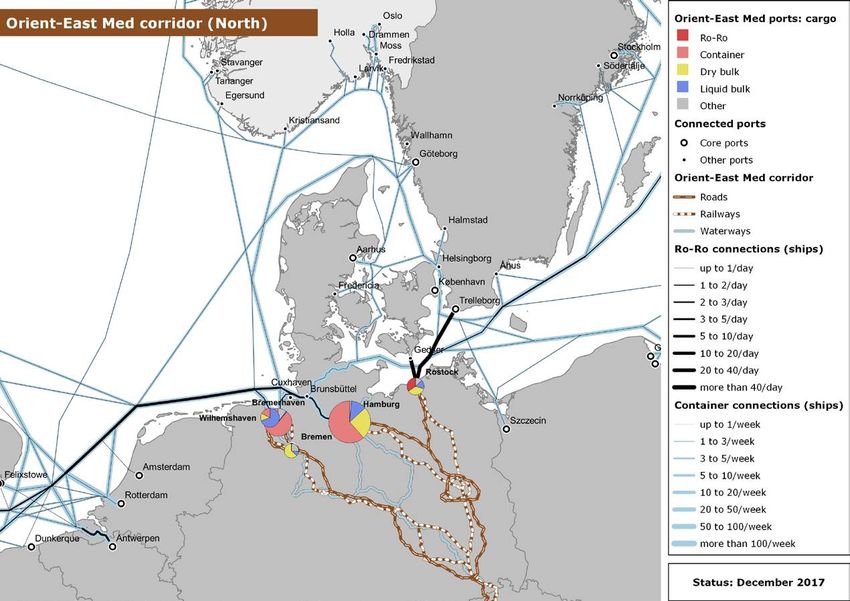
MOVE/B1/2015-2018 STUDY ON THE TEN-T MOTORWAYS OF THE SEA HORIZONTAL PRIORITY
     of the EUROPEAN COMMISSION DIRECTORATE-GENERAL FOR MOBILITY AND TRANSPORT
                                            Directorate B – European mobility network

Figure 3:     Total cargo traffic of Core Network Corridor ports by type 2016
              (billion tonnes)

                       Other     Ro-Ro
                        0,1     freight
                                  0,3

       Liquid bulk
                                           Container
           0,9
                                              0,8

                           Dry bulk
                             0,5

Source: ISL based on Eurostat

The Core Network Corridor ports link the Core Network Corridors to each
other; and they link the Core Network Corridors with the comprehensive
network ports and third countries.

                                                        MoS · Study on ports and shipping operations   9
MOVE/B1/2015-2018 STUDY ON THE TEN-T MOTORWAYS OF THE SEA HORIZONTAL PRIORITY
         of the EUROPEAN COMMISSION DIRECTORATE-GENERAL FOR MOBILITY AND TRANSPORT
                                                Directorate B – European mobility network

Figure 4:       Core Network Corridors and CNC ports’ cargo traffic by type 2016

Source: ISL (cargo traffic based on Eurostat)

Out of the 84 CNC ports, 71 possess regular container services (see Annex
3 for a list of connections by corridor). However, only 41 CNC ports had
regular deep sea services, the remainder being connected either to pure
short sea services (door-to-door) or to short sea feeder services, connecting
them to intercontinental trade via hub ports.

A similar number of CNC ports possess regular ro-ro services. Out of 72
such ports, only 20 are however connected to deep sea services (including
con-ro). Virtually all of these ports have international short sea connections
with other Member States or with third countries.

The European Motorways of the Sea network hence complements the land-
based network, providing links between the different corridors, but also
between the CNC ports and ports of the comprehensive networks as well as
ports in neighbouring countries and the rest of the world.3

3
    see Annex 3 for detail per corridor and per port

                                                        MoS · Study on ports and shipping operations   10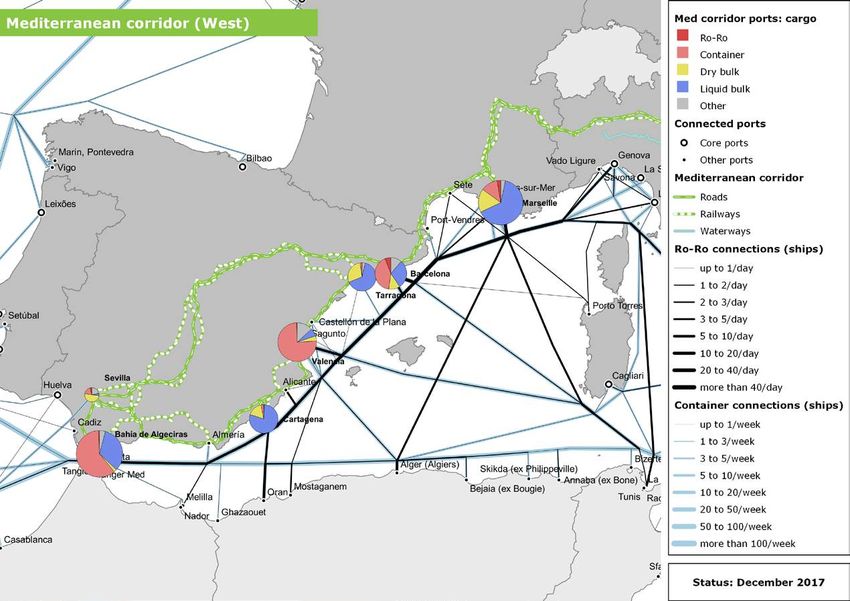
MOVE/B1/2015-2018 STUDY ON THE TEN-T MOTORWAYS OF THE SEA HORIZONTAL PRIORITY
       of the EUROPEAN COMMISSION DIRECTORATE-GENERAL FOR MOBILITY AND TRANSPORT
                                              Directorate B – European mobility network

The 21 Core Network ports that are not part of a Core Network Corridor
handled a combined volume of approximately 320 million tonnes. The
shares of liquid bulk (53 %) and dry bulk (24 %) are higher than on
average. Container traffic, by contrast, only had a share of 8 %.

1.3.   The network of intra-European Motorways of the Sea

Maritime transport plays an important role in interconnecting the European
ports and their hinterlands. According to recent figures,4 37.7 million TEU
equalling roughly 400 million tonnes of short sea combined transport cargo
(container and ro-ro) were moved between ports within the EU or between
ports in the EU and neighbouring third countries.

As the above analysis has shown, the network of European short sea
services is vast and diverse. There are high-frequent ferry services bridging
small distances, e.g. across the English Channel, the Fehmarn belt, or the
Strait of Gibraltar. On longer sea distances, unaccompanied trailers and
containers are shipped and often combined with rail or barge hinterland
transport.

Most of the links have been developed decades ago and successfully
operated by private ferry and container liner operators. For traffic across
straits, competition is mostly between liner operators and ports, but not
between modes – except where tunnels/bridges are an economically viable
alternative. Improving the efficiency and extending the capacity of such
links makes transport cheaper and helps promoting the single market.

On coastal routes, where modal shift from road or rail to sea is possible,
there is direct competition by land-based modes of transport. The
commercial operation of coastal short sea routes hence depends much more
on the competitiveness of seaborne transport vis-à-vis other modes of
transport. In general, the longer the distance, the more attractive short sea
transport becomes because the cost per kilometre and unit is particularly
low. Supporting the efficiency of short sea transport may hence also
promote a modal shift towards maritime transport.

Apart from efficiency gains, improving the environmental performance of
shipping is certainly an overarching goal for all types of short sea transport.
Here, the Motorways of the Sea programme may support shipowners in

4
  ISL, KombiConsult (2017): Updating EU combined transport data, study for the European
Commission, DG MOVE

                                                 MoS · Study on ports and shipping operations   11
MOVE/B1/2015-2018 STUDY ON THE TEN-T MOTORWAYS OF THE SEA HORIZONTAL PRIORITY
of the EUROPEAN COMMISSION DIRECTORATE-GENERAL FOR MOBILITY AND TRANSPORT
Directorate B – European mobility network
being ahead of ever-stricter regulations and piloting alternative fuels, new
propulsion types and other solutions that help the shipping sector to
undermine its reputation as an environmentally friendly mode of transport.
MoS · Study on ports and shipping operations 12MOVE/B1/2015-2018 STUDY ON THE TEN-T MOTORWAYS OF THE SEA HORIZONTAL PRIORITY
of the EUROPEAN COMMISSION DIRECTORATE-GENERAL FOR MOBILITY AND TRANSPORT
Directorate B – European mobility network
2. Bottlenecks and investment needs 5
In order to fulfil their role as facilitators of intra-European transport,
seaports have to provide the necessary infrastructure to guarantee
smooth transfers between sea transport and land-based transport. An
analysis of the adequacy of ports with regard to their role in combined
transport operations can therefore not be limited to the analysis of the
seaside access and quayside facilities, but needs to take into account also
the connection with other modes of transport, i.e. road, rail and inland
waterway.
When it comes to promoting “green shipping”, the focus naturally lies on
the fleet trading in European waters. However, many potential measures
with regard to vessels also have an impact on ports, e.g. LNG-fuelled
vessels need economically viable LNG supply in the ports or closed-loop
scrubbers need adequate sludge reception facilities.
Based on a survey of ship operators and ports as well as on data analysis
and desk research, the main bottleneck issues and investment needs in
the European port landscape were identified.
The concept of adequacy:
The requirements of the 331 ports in the core and comprehensive network
differ from one port to another due to the different cargo types and ship
sizes on the relevant trades. Setting meaningful common European
standards with regard to ship sizes, for example, is impossible. In
addition, despite the importance of a modal shift from truck to rail, many
ports do not need a rail connection because intermodal services are not
viable (e.g. ports on smaller- to medium-sized islands). Consequently,
‘compliance’ with European-wide standards is not a useful concept when it
comes to developing Motorways of the Sea. Instead, an analysis of the
needs of each port, its integration into maritime and hinterland transport
chains is a prerequisite for efficiently developing the Motorways of the Sea
network.
In the present study, the notion ‘adequacy’ is introduced in order to take
into account the diverse needs of the European seaports. It entails the
5
covering Tasks 2.2, 2.3, 3.2 and 3.3
MoS · Study on ports and shipping operations 13MOVE/B1/2015-2018 STUDY ON THE TEN-T MOTORWAYS OF THE SEA HORIZONTAL PRIORITY
of the EUROPEAN COMMISSION DIRECTORATE-GENERAL FOR MOBILITY AND TRANSPORT
Directorate B – European mobility network
definition of concrete objectives, e.g. determining the total number of
ports that should have a rail connection or that should be able to handle a
certain ship type. In this context, the ‘degree of adequacy’ describes the
share of ports in each sub-sample that meet this objective.
In order to define the objectives, an analysis of regular shortsea ro-ro and
container services was performed. This analysis indicates the needs for
physical infrastructure in a certain port or port range for Motorways of the
Sea. This status-quo analysis is complemented by a survey of shortsea
ship operators (users of the seaports’ maritime infrastructure) and an
analysis of investment needs as perceived by the seaports.
The port survey:
The aim of the port survey was to get an indication of the investment
needs and future requirements as perceived by the ports. The survey thus
took a broader perspective, asking about the requirements to prepare the
ports for the challenges of the future in the context of Motorways of the
Sea.
In order to provide a broad perspective, a representative sample of 39
ports defined covering all Member States and the different port categories
(core and comprehensive ports, ports in outermost regions, different size
categories, deep sea/short sea ports, etc.).
Below is the list of ports covered by the survey.
MoS · Study on ports and shipping operations 14MOVE/B1/2015-2018 STUDY ON THE TEN-T MOTORWAYS OF THE SEA HORIZONTAL PRIORITY
of the EUROPEAN COMMISSION DIRECTORATE-GENERAL FOR MOBILITY AND TRANSPORT
Directorate B – European mobility network
Table 1: Sample ports for survey
Source: ISL
In order to understand the needs in the different ports, port development
plans, port strategies and annual reports published by the ports were
analysed. Using a content analysis software tool, the priorities for future
development contained in the documents were extracted.
The analysis was complemented by a qualitative survey among the 39
ports with open questions. Thirteen ports responded to the survey and the
responses were analysed using the same software tool. The responses
cover all port types (container, ro-ro, container & ro-ro), traffic profiles
(deep sea/short sea and short sea only), core and comprehensive ports,
five of the nine corridors and include two ports engaged in two different
port co-operations.
MoS · Study on ports and shipping operations 15MOVE/B1/2015-2018 STUDY ON THE TEN-T MOTORWAYS OF THE SEA HORIZONTAL PRIORITY
of the EUROPEAN COMMISSION DIRECTORATE-GENERAL FOR MOBILITY AND TRANSPORT
Directorate B – European mobility network
Most of the investment needs indicated by the ports (both sources
combined) concern the construction of new terminals and the expansion of
road and rail infrastructure.
Below is a tag cloud showing their key concerns.
Figure 5: Areas of investment needs and further requirements mentioned by the port
authorities (tag cloud)
Source: ISL based on port operator survey and publicly available information on port development
plans
Moreover, there are a number of port projects listed in the nine CNC work
plans that are relevant to the MoS objectives.
A list of the relevant “port projects” has therefore been compiled and
includes 407 projects that have been selected from the Core Network
Corridors project lists 6 (the complete list can be found in the Annex).
6
including more than 2,300 projects
MoS · Study on ports and shipping operations 16MOVE/B1/2015-2018 STUDY ON THE TEN-T MOTORWAYS OF THE SEA HORIZONTAL PRIORITY
of the EUROPEAN COMMISSION DIRECTORATE-GENERAL FOR MOBILITY AND TRANSPORT
Directorate B – European mobility network
These projects have been categorised according to the following
parameters:
• “Port Dimension”. The port dimension comprises projects regarding
works, studies carried out within the port, aimed at improving the
port from several point of views (e.g. new LNG bunkering facilities;
new platforms; dredging works, etc.) for a total of 283 projects;
• “Network Connection”. This parameter includes projects regarding
works, studies and actions aiming at improving the connection of
the port “on/from the outside” in a broad sense. Therefore, the list
comprises not only projects that better link ports to corridors but
also projects aimed at enhancing ports’ accessibility in other ways
(e.g. road, rail connections better linking the port with its
hinterland; rail entry processes etc.), for a total of 36 projects;
• “Port dimension + network connection”. 52 projects which presents
elements from both the above-mentioned dimensions;
• “Mixed”. This category contains 62 projects of two kinds: projects
with a strong ICT dimension (e.g. Port Community Systems - PCS)
and projects covering a wider range of ports and /or actions (e.g.
Widermos).
Most of these projects could potentially be included in a MoS link project
while many others could be part of a MoS wider benefit action.
The ship operator survey:
The ship operator survey focussed on liner operators offering regular short
sea connections. This includes pure short sea door-to-door operators, but
also operators mixing door-to-door volumes with feeder traffic. The idea
behind this survey was threefold.
First, the operators are the customers of the ports. They are the
beneficiaries of many port development measures such as on-shore power
supply installations, LNG bunker facilities, deepening of port approaches,
etc. In many cases, the operators also provide door-to-door services so
they can also evaluate requirements regarding the ports’ hinterland
MoS · Study on ports and shipping operations 17MOVE/B1/2015-2018 STUDY ON THE TEN-T MOTORWAYS OF THE SEA HORIZONTAL PRIORITY
of the EUROPEAN COMMISSION DIRECTORATE-GENERAL FOR MOBILITY AND TRANSPORT
Directorate B – European mobility network
connections. Therefore, the most direct and efficient way to find out about
the future needs from an external perspective is to ask the operators. 7
Second, most ports handle different types of traffic (short sea and deep
sea traffic). Some projects may be urgent for the ports, but not for short
sea operators and hence not within the scope of Motorways of the Sea as
defined here. By directly asking the short sea operator, the needs of this
traffic segment can be filtered out.
Third, while each port is planning its own development, the short sea
operators have a comparative perspective. They may be very satisfied
with some ports while pointing at problems in other ports. This
comparative approach is useful in providing a more balanced perspective
regarding the urgency of certain aspects or projects, which cannot be
achieved by asking single individual ports.
For the present study, eight operators’ replies including ro-ro operators as
well as container door-to-door and container short sea/feeder carriers
have been taken into account. Together, they represent a fleet of more
than 100 vessels operating on intra-European short sea services
connecting at least two member-states. The major issues raised were the
needs for new vessels, specialised short sea terminals (in order to lower
port costs) and easier customs procedures.
7
see “Why Port User’s Perception” in Port user perceptions measurement and indicators,
PORTOPIA Deliverable 6.1, page 11
MoS · Study on ports and shipping operations 18MOVE/B1/2015-2018 STUDY ON THE TEN-T MOTORWAYS OF THE SEA HORIZONTAL PRIORITY
of the EUROPEAN COMMISSION DIRECTORATE-GENERAL FOR MOBILITY AND TRANSPORT
Directorate B – European mobility network
Figure 6 below illustrates the operators’ replies in a tag cloud.
Figure 6: Areas of investment needs and further requirements mentioned by the short sea
operators (tag cloud)
Source: ISL based on ship operator survey
By approaching the sample ports and port operators directly, the survey
provides a candid, unconstrained angle to the analysis of bottlenecks and
investment needs. It complements the desk research that looked into the
achievements/conclusions and further research needs identified by the
previous MoS projects. The MoS projects are, by definition, set within a
pre-defined set of eligibility criteria and thus the results from that analysis
are more limited in scope.
Together, the survey and the projects analysis draw an extensive picture
of the priorities perceived by the main Motorways of the Sea actors,
namely liner operators, seaports and public authorities. The related
investment needs can be classified into port-related needs (sub-chapter
2.1) and needs related to the MoS links and the shortsea fleet (sub-
chapter 2.2).
2.1. Port investment needs including sea-side and land-side
infrastructure
Seaports serve as interfaces between maritime and hinterland traffic.
Therefore, in order to guarantee a smooth flow of traffic, it is not sufficient
MoS · Study on ports and shipping operations 19MOVE/B1/2015-2018 STUDY ON THE TEN-T MOTORWAYS OF THE SEA HORIZONTAL PRIORITY
of the EUROPEAN COMMISSION DIRECTORATE-GENERAL FOR MOBILITY AND TRANSPORT
Directorate B – European mobility network
to have efficiently operating terminals with adequate handling capacity.
Both the sea-side accessibility and the land-side infrastructure must live
up to the transport flows transiting a port.
The following analysis of MoS investment needs regarding ports take this
broader perspective and are grouped into four categories:
• ‘Sea-side and quay-side access’ covering the maritime
infrastructure, i.e. the waterways between the main sea routes and
the terminals, including the mooring basins
• ‘Cargo handling infrastructure and superstructure’ including the
terminal area, cargo handling equipment both at the quay and on
the terminal
• ‘Quay-side services’ that are not related to cargo handling, e.g.
bunkering, waste reception, shore-side electricity, etc.
• ‘Hinterland access’ encompassing the connection between the
terminal gates and the main inland network including – where
relevant – intermodal terminal facilities in the port area.
For each category, the degree of adequacy is analysed with regard to
different objectives.
2.1.1. Sea-side and quay-side access
While sea-side accessibility is heatedly debated in the context of mega-
carriers on the main intercontinental East-West container trades, 8 it is
hardly an issue for intra-European short sea services. The reason is
straightforward: the ships sailing on intra-European services are much
smaller than those employed by the ocean carriers. Of course, operators
take into account the physical restrictions when deploying their vessels on
certain routes, but most often the maximum possible ship size is not used
for short sea shipping.
While draught restrictions are not an issue for any of the regular ro-ro
services in Europe, some ports are not able to handle the container
vessels regularly calling in the port when they are fully loaded. This does
not necessarily have to be an issue as most container services are multi-
8
see, e.g., Olaf Merk et al.: The Impact of Mega-Ships: Case-Specific Policy Analysis, OECD, 2015
(www.itf-oecd.org/sites/default/files/docs/15cspa_mega-ships.pdf)
MoS · Study on ports and shipping operations 20MOVE/B1/2015-2018 STUDY ON THE TEN-T MOTORWAYS OF THE SEA HORIZONTAL PRIORITY
of the EUROPEAN COMMISSION DIRECTORATE-GENERAL FOR MOBILITY AND TRANSPORT
Directorate B – European mobility network
stop services so only the first or last port in a range needs to be able to
handle these vessels at their full load line.
Figure 7: Share of comprehensive ports able to handle vessels regularly calling in the port
when fully loaded (spring 2017)
Source: ISL
It may seem surprising that there is also a non-negligible number of ports
that could face draught restrictions for short sea container services. This is
due to two factors. On the one hand, larger Panamax and post-Panamax
vessels are increasingly used on certain intra-European routes as charter
rates for these vessel types have been very low recently. On the other
hand, compared with deep sea traffic, a much higher number of ports –
including many smaller regional ports – is handling short sea traffic.
The short sea container operators’ survey reveals that the existing
theoretical restrictions are not an issue for their business. None of the
participants mentioned draught restrictions.
Besides the physical dimensions of the sea-side access – mostly an issue
for deep sea traffic and hence not the focus of MoS – the efficient
management of the access canals is of high importance in many ports
with high-frequency short sea connections. This aspect is analysed in
more detail in chapter 2.3.2 on vessel traffic management.
2.1.2. Cargo handling infrastructure and superstructure
The technical adequacy of terminal infrastructure and cargo-handling
superstructure is hardly mentioned by short sea shipping operators as a
bottleneck. For intra-European container shipping, this is easily explained:
MoS · Study on ports and shipping operations 21MOVE/B1/2015-2018 STUDY ON THE TEN-T MOTORWAYS OF THE SEA HORIZONTAL PRIORITY
of the EUROPEAN COMMISSION DIRECTORATE-GENERAL FOR MOBILITY AND TRANSPORT
Directorate B – European mobility network
most of the ports handling short sea traffic also handle deep sea traffic
and are hence prepared for larger ships, but also for higher numbers of
containers handled per ship call.
While container short sea operations are comparatively modest with
regard to infrastructure and superstructure (no latest-generation gantry
cranes needed, volumes handled per call comparatively small), several
operators insist that their business is much more cost-sensitive than the
deep sea business, particularly on coastal routes where it has to compete
with land transport. High terminal handling charges make short sea
shipping on shorter coastal distances impossible, hence limiting the
potential for a shift from road to sea.
Short sea shipping is also more time-sensitive when it comes to port
operations. Due to the shorter sea distances, delays cannot easily be
compensated by increasing the vessel’s speed. Here, it is not the speed of
terminal operations creating an issue, 9 but rather waiting times. Where
short sea vessels are using the same terminals as the deep sea vessels,
the latter are normally given higher priority by the terminal operator.
Creating more dedicated short sea berth capacity could help relieve both
the cost and the capacity issues. In many ports, older terminals that are
no longer able to handle the latest generation of ocean-going vessels may
be reconverted into short sea terminals. The lower infrastructure costs
and possible savings on terminal equipment compared with modern deep-
sea terminals can then be translated into lower terminal handling
charges. 10
For ro-ro traffic, liner operators see a need for faster and more efficient
handling procedures. Given the often rather short sea distances for ro-ro
traffic, the time at berth may have a relatively high share in the ship's
total round trip duration. Therefore, faster handling procedures would not
only contribute to shorter waiting times, but also to the cost effectiveness
of short sea shipping vis-à-vis land transport. The actual scope of
investment needs (new ro-ro ramps, more space for cargo operations,
etc.) depends on the local situation in each port. While the minimum
requirements for funding of maritime links according to the current
9
except in special cases such as strike situations
10
Other ways of reducing the costs of short sea shipping are measures concerning the vessels,
e.g. developing and testing more fuel-efficient pilot vessels or new, more economic propulsion
systems and the like (see chapter 2.2.2).
MoS · Study on ports and shipping operations 22MOVE/B1/2015-2018 STUDY ON THE TEN-T MOTORWAYS OF THE SEA HORIZONTAL PRIORITY
of the EUROPEAN COMMISSION DIRECTORATE-GENERAL FOR MOBILITY AND TRANSPORT
Directorate B – European mobility network
regulation (at least two ports from two Member States, involvement of
ship operator) is open to measures concerning one link only, priority
should be given to investments benefitting several players in a range,
including the definition and achievement of common standards regarding
loading operations.
When it comes to operational efficiency, improving the environmental
performance of port equipment can contribute to the overall performance
of MoS in terms of environmental impact. Electrification or alternative fuel
use can improve the carbon footprint and hence contribute to transport’s
overall performance with regard to the Paris Agreement goals.
However, there is also a concern for pollution. Reducing the emissions of
sulphur, particulate matter, and noise, all contribute to improving the local
air quality and quality of life. Such improvements are particularly valuable
in the case of ports situated in densely populated areas.
2.1.3. Quay-side services
The “greening” of the fleet (see 2.2.3) needs to go hand in hand with
investments in the ports. In the ro-ro sector, ships are often designed
specifically for one route or area and tend to serve on the same route for
a long time. Therefore, operators of ro-ro vessels are willing to invest in
their fleet if a sufficient number of ports (in some cases one is sufficient)
provides the necessary infrastructure. Container vessels, by contrast, are
often chartered in and are regularly changing not only the route, but also
the trading area. Ship owners will therefore only inclined to invest in
upgrades of their vessels if they can be sure that the necessary
infrastructure will be available. If anything, this can only be guaranteed
for ships owned by the operators themselves or in a long-term charter.
This is currently rather the exception than the rule.
When it comes to LNG bunkering, there are still quite a few blank spots on
the map where there is obvious need. In principle, LNG bunkering is
possible in any port through the use of LNG bunkering vessels or trucks.
However, the cost of such solutions increases with distance to the LNG
terminal and LNG trucks are really only adequate for smaller volumes. If
the use of LNG becomes more widespread in the future, the construction
of additional fixed or floating LNG terminals may be necessary. Before
each investment in new terminals, the demand potential must be
estimated answering the following questions:
MoS · Study on ports and shipping operations 23MOVE/B1/2015-2018 STUDY ON THE TEN-T MOTORWAYS OF THE SEA HORIZONTAL PRIORITY
of the EUROPEAN COMMISSION DIRECTORATE-GENERAL FOR MOBILITY AND TRANSPORT
Directorate B – European mobility network
• Are there regular shipping lines calling in the port or the outreach
area?
• Are the services prone to using LNG (e.g. ro-ro services or short sea
container services)?
• What is the demand potential from these services?
• Given the demand potential, is an investment in a terminal justified?
If yes, which size?
Figure 8: LNG terminals in the European Union 2016
Source: ISL
Similar questions apply to onshore power supply. Here, the cruise sector
is leading since the time in port and the electricity demand result in a high
total demand per port call. Ferry services spending less than an hour in
one port, by contrast, will at most use onshore power supply when idle.
On-shore power supply is a local solution, i.e. the terminal which is used
for operations must provide the access. Due to a lack of standards,
cooperation between port authorities, terminal operators and ship
operators is necessary.
MoS · Study on ports and shipping operations 24MOVE/B1/2015-2018 STUDY ON THE TEN-T MOTORWAYS OF THE SEA HORIZONTAL PRIORITY
of the EUROPEAN COMMISSION DIRECTORATE-GENERAL FOR MOBILITY AND TRANSPORT
Directorate B – European mobility network
Finally, EU ports must provide reception facilities for various types of
waste and residues from maritime shipping. When installing closed-loop
scrubbers, ship operators depend on ports to dispose of the sludge. In
general, discharge of waste at sea, as well as the management and
handling of different waste steams (i.a. scrubber washwater and residues)
is increasingly seen as a problematic issue. Ports play an active role in
developing reception facilities and services in view of compliance with
international and European legislation. This is in particular also relevant in
the light of the entry into force, between 2019 and 2021, of the Baltic Sea
special area 11 for sewage discharges from passenger ships 12 , which will
require all IMO-registered passenger vessels operating in the area to
discharge all waste in port reception facilities. A review of the EU Port
Reception Facilities Directive is also pending.
2.1.4. Hinterland access
Hinterland access – defined here as the connection between the terminal
gate and the main network – is an issue in many European ports,
particularly those situated in densely populated areas. In many cases, the
connecting infrastructure is used for various cargo types and in some
cases also passenger traffic. Wherever bottlenecks hinder the smooth
connection of seaports with the land-based transport infrastructure,
solutions should be developed and included in the Motorways of the Sea
programme. Relevant bottlenecks mentioned in the port survey and in
port development plans include:
• Rail infrastructure within port area (rail connection to main
network, construction/extension of rail terminals and shunting
yards)
• Road infrastructure in port area and access to port area
(construction of new roads, bridges and tunnels)
• Road traffic management (including driver information systems,
pre-gate parking, etc.)
• Rail operations and the related processes (e.g. shunting) within
port area (mostly concerning large CNC ports)
11
HELCOM: http://www.helcom.fi/news/Pages/Passenger-ship-sewage-discharges-into-the-Baltic-
Sea-will-be-banned.aspx
12
Under Annex IV or the MARPOL Convention
MoS · Study on ports and shipping operations 25MOVE/B1/2015-2018 STUDY ON THE TEN-T MOTORWAYS OF THE SEA HORIZONTAL PRIORITY
of the EUROPEAN COMMISSION DIRECTORATE-GENERAL FOR MOBILITY AND TRANSPORT
Directorate B – European mobility network
During the interviews of short sea operators with door-to-door services,
hinterland connections were only mentioned sporadically and in the
examples of single ports (road congestion). Where short sea shipping
competes with direct land transport, road congestion in the port area
hinders the shift from road to sea as it adds both time and costs to the
short sea transport chain. The solutions to congestion issues must be
developed in the ports and may include infrastructure upgrades, but also
modal shift incentives and measures for port-internal traffic or intelligent
road traffic management.
2.2. MoS links and investment needs in the European short sea fleet
Next to investments in ports, developing the European Motorways of the
Sea network is a key priority. Motorways of the Sea are indispensable for
connecting many European regions to the core network and hence for the
functioning of the common market.
As illustrated in chapter 1, there is an extensive network of container and
ro-ro services linking European ports among each other as well as with
third countries. The connections with the highest frequency – Puttgarden-
Rødby and Calais-Dover – are also the ones that are part of an existing
core network corridor. They are complemented by parallel links. The high-
frequency Rostock-Gedser link or the numerous links between South
Sweden and the southern Baltic Sea coast complement the Puttgarden-
Rødby service. Calais-Dover has even more parallel links with eight ro-ro
services connecting France and Great Britain and further connections
between Great Britain on the one hand and Belgium and the Netherlands
on the other hand.
In the Mediterranean, the connections with highest frequency are those
across the Strait of Gibraltar with the ports of Tarifa, Algeciras and
Gibraltar on the northern side and Tanger, Tanger Med and Ceuta on the
southern side. A considerable share of ro-ro connections in the
Mediterranean connects islands such as the Balearic Islands, Corsica,
Sardinia, Sicily, Malta, Crete and Cyprus with the mainland. In the Black
Sea, ro-ro services connect Bulgaria and Romania with third countries in
the Black Sea.
Given the high number of successful services, there is no doubt that these
links can be operated commercially. However, the high concentration of
traffic makes the ports and connecting infrastructure of these links an
MoS · Study on ports and shipping operations 26MOVE/B1/2015-2018 STUDY ON THE TEN-T MOTORWAYS OF THE SEA HORIZONTAL PRIORITY
of the EUROPEAN COMMISSION DIRECTORATE-GENERAL FOR MOBILITY AND TRANSPORT
Directorate B – European mobility network
important bottleneck in intra-European transport. The use of alternative
fuels or fuel-saving technologies would have a particularly high impact
here due to the sheer volume of traffic.
However, these high-frequency ro-ro links are only a tiny fraction of intra-
European short sea services. Container services are mostly running on a
weekly basis and are using multi-stop strategies to connect different ports
within a range to each other or to other ranges. There are also many
services (container and ro-ro) connecting islands or remote territories with
the mainland. The vast majority of these services are connecting two or
more ports of the same Member State. In the Mediterranean and in the
Black Sea, connections with third countries are of particular importance –
just as the connections between the EU mainland and Norway in the
North.
While private commercial operators have been assuring the links on the
major corridors for many years now, the volume of cargo on links towards
remote and outermost regions as well as to neighbouring countries are
generally much lower, making commercial operations more difficult and
limiting possibilities for competition (bundling of total volume on one
service in many cases). In order to promote territorial cohesion in the EU
and close economic links with neighbouring countries, the focus on
supporting new links should be on these peripheral axes.
As regards the existing links, ‘greening’ the fleet and making short sea
shipping as safe as possible will be the most important tasks.
2.2.1. New Motorways of the Sea links
The identification of new Motorways of the Sea links that would be
worthwhile exploring is one of the most challenging issues in the MoS
context. The analysis must comprise at least an estimate of the total
volume of intra-European trade for which this link would be competitive as
well as a realistic estimate of the market share. In order to appraise the
latter, the routes currently used and their costs must be analysed. With
regard to fair competition, it must be made sure that the new links are not
deviating considerable amounts of cargo from existing MoS links.
During the interviews, several short sea operators insisted on the fact that
no support is required for establishing new routes or services. The reason
for that is that if a route is economically viable in the long run, it is the
role of the market to realise any such link. According to several operators,
EU support could end up subsidising a new route which is not sustainable
MoS · Study on ports and shipping operations 27MOVE/B1/2015-2018 STUDY ON THE TEN-T MOTORWAYS OF THE SEA HORIZONTAL PRIORITY
of the EUROPEAN COMMISSION DIRECTORATE-GENERAL FOR MOBILITY AND TRANSPORT
Directorate B – European mobility network
in the long run or a link which is deviating volumes from other, non-
subsidised routes. In general, a negative impact of subsidies on
competition is perceived. In this context also the former Marco Polo
programme was mentioned as a negative example for financial EU
support.
Instead of directly subsidising or promoting new routes, operators propose
to focus more on the most pressing horizontal issues, namely simplifying
and streamlining customs and administrative procedures and contributing
– if possible – to a more generalised reduction of costs for all players (e.g.
simplifying terminal handlings for short sea container operations). In
addition, most players agree that the European Commission can play an
important role in promoting the greening of the fleet (see 2.2.3).
2.2.2. Motorways of the Sea links with peripheral or outermost regions
One aspect being put forth in the context of financing conditions is the
non-eligibility of many maritime links connecting peripheral or outermost
regions. While cohesion is an important objective of the European
transport policy and is named first in Article 4 of the TEN-T regulation, the
contribution of Motorways of the Sea towards the achievement of this goal
has therefore been limited in the past.
Two conditions currently impede the inclusion of many such links in the
Motorways of the Sea policy. First, many of the existing and possible
future links do not involve core ports as they are situated in the
geographical periphery. Second, the connection of outermost regions e.g.
Ceuta or Melilla, the Canary Islands or the Azores) is traditionally provided
by regular ship services between these regions and ports on the mainland
of the respective ports. This is for a good reason: the exchange between
the outermost regions is traditionally most intense with the respective
national mainland so transport chains are optimised by using national
ports. Therefore, the requirement to cover ports in two different Member
States to be eligible for MoS funding cannot be met.
The major issue raised by survey respondents concerning the creation of
new links is that EU support for certain routes introduces a competition
bias and that these routes inevitably deviate cargo from existing routes. If
peripheral and outermost regions do not have more connections,
operators argue, it is because of a lack of demand. Part of the low
demand, in turn, may be due to the high transport costs related to the low
connectivity. Subsidies may hence be necessary to lower transport costs.
MoS · Study on ports and shipping operations 28MOVE/B1/2015-2018 STUDY ON THE TEN-T MOTORWAYS OF THE SEA HORIZONTAL PRIORITY
of the EUROPEAN COMMISSION DIRECTORATE-GENERAL FOR MOBILITY AND TRANSPORT
Directorate B – European mobility network
While subsidising ship operating costs is not possible in the MoS
programme, an alternative might be to support the adaptation of vessels
to the needs of a route. If ports and ship operators prepare a joint
proposal, the competition bias remains an issue. Alternatively, ports in
peripheral regions could initiate calls for proposals as part of a MoS
project indicating the desired link (e.g. by providing a certain range of
relevant corresponding ports), necessary infrastructure adaptation and
minimum requirements for vessels with a maximum subsidy on the vessel
investment costs – which are included in the MoS project. In this way,
several operators could compete for this link under the same conditions
without any severe distortions of competition, which was another essential
criticism of the Marco Polo programme. This policy could help establishing
new links that are less attractive from a commercial point of view, but
desirable from a political point of view.
2.2.3. Investment needs concerning the European short sea fleet
In order to assess the investment needs with regard to the European
short sea fleet, one has to keep in mind that operators regularly renew
their fleets as older units drop out of the market and need to be replaced
by younger tonnage. Looking at the age structure of the fleet engaged in
regular European short sea services, it is striking that there are only a few
units that have been built during the past five years.
In the container sector, this is because there were very few new buildings
in the lower size segments and, at the same time, many smaller units
were replaced by larger tonnage However, these larger vessels are
generally not adapted to the current state of the art of intra-European
container shipping. In general, these vessels are not operated by their
owners, so investments in retrofitting for cell guides for European 45-foot
containers would need to involve both owner and operator and a long-
term commitment. On the charter market, such a long-term commitment
is difficult to achieve. Therefore, the sulphur cap issue is generally likely to
be solved by using low-sulphur fuel. There has been a lot of ship-breaking
in the container sector recently so few units older than 25 years are still in
service.
In the ro-ro sector, many operators also own the vessels, so investments
into the greening of the fleet can be organised more easily. While some
players have been very active in the past most notably in the existing
SECA areas, there are further investment needs particularly in the
Mediterranean. More than one third of ro-ro vessels currently in service on
MoS · Study on ports and shipping operations 29MOVE/B1/2015-2018 STUDY ON THE TEN-T MOTORWAYS OF THE SEA HORIZONTAL PRIORITY
of the EUROPEAN COMMISSION DIRECTORATE-GENERAL FOR MOBILITY AND TRANSPORT
Directorate B – European mobility network
regular European short sea services are older than 25 years so there is a
need for investments in new-buildings in this segment in the years to
come.
Figure 9: Age structure of the ro-ro and container fleet employed on regular European short
sea services (spring 2017)
The replacement of older tonnage by newer, more efficient tonnage is
done by the market and does not need interference. However, the
replacement can of course be an opportunity to introduce more
environmentally friendly ships. In some cases, it may also be worthwhile
to make younger vessels LNG-ready or install scrubbers.
When it comes to improving the environmental performance of the fleet,
there is still a lot of potential for improvement. In the short term,
preparing for the global sulphur cap of 0.50 % entering into force in 2020,
investments in the fleet (scrubbers, alternative fuels) may be an
alternative to using the more expensive low-sulphur fuel.
As regards the use of alternative fuels, operators are still hesitant to
invest in new technologies. If LNG or other alternative fuels can prove to
be cost-competitive, the market will adopt these technologies in the long
run. By contrast, if the new technologies fail to be competitive in day-to-
day business, they will become extinct.
MoS · Study on ports and shipping operations 30MOVE/B1/2015-2018 STUDY ON THE TEN-T MOTORWAYS OF THE SEA HORIZONTAL PRIORITY
of the EUROPEAN COMMISSION DIRECTORATE-GENERAL FOR MOBILITY AND TRANSPORT
Directorate B – European mobility network
Table 2: LNG-ready ro-ro and container vessels mid-2017
Ro-Ro services
Total number of analysed services 493 services
(regularly calling in European ports) (868 vessels)
- Deepsea services 27 services
(55 vessels)
- National services 189 services
(351 vessels)
Relevant Ro-Ro services 277 services
(462 vessels)
LNG ready/electric 2 services
(3 vessels)
Adequacy ratio (vessels) 1%
Container services
Total number of analysed services 471 services
(regularly calling in European ports) (1572 vessels)
- Deepsea services 177 services
(1047 vessels)
- National services 19 services
(20 vessels)
Relevant container services 275 services
(505 vessels)
LNG ready/electric 1 service
(1 vessel)
Adequacy ratio (vessels)MOVE/B1/2015-2018 STUDY ON THE TEN-T MOTORWAYS OF THE SEA HORIZONTAL PRIORITY
of the EUROPEAN COMMISSION DIRECTORATE-GENERAL FOR MOBILITY AND TRANSPORT
Directorate B – European mobility network
Commission can play an important role as a promoter of new technologies
by supporting the development of pilots and prototypes. Co-financing the
efficiency improvement of single ships or services, by contrast, is indeed
controversial. A level playing field could be reached by reducing the
administrative complexity and clarifying the conditions for applying for
funding. This could, for instance, include introducing a 2-step procedure
for MOS-funding applications, and revising the call documents.
2.3. Needs with regard to wider benefit projects
Wider benefit actions relate to projects that are not related or limited to a
certain port or shipping line, but benefitting the sector as a whole. Next to
pilot actions regarding port installations or the fleet, this includes e.g.
simplifying administrative procedures, developing transferable ICT
solutions or providing open training seminars or training material. In
many cases, the benefits will also extend beyond the European Motorways
of the Sea, even if the initiative comes from short sea shipping.
2.3.1. Streamlining of administrative procedures
One of the most recurring topics emerging from the operator interviews is
the need for simplification of administrative procedures. The need of short
sea operators to do customs declarations for intra-EU traffic is
acknowledged as a competitive disadvantage vis-à-vis land transport.
Moreover, customs procedures are additionally complicated by the
presence of various national systems and no European-wide solution.
Although exploring the possibility of adapting customs regulations in
compliance with the new EU Customs Code (e.g. by providing certified
secure transport corridors through international waters) should continue,
solutions that reduce the workload of market players seem to be most
promising in the short run. Specifically, a harmonised approach to
international fast trade lanes (where logistics and customs information are
simplified and digitalised across corridors) should be encouraged, i.a. by
supporting the harmonisation of the e-manifest (in cooperation with DG
TAXUD).
As regards fulfilling the maritime reporting requirements, the national
single window initiative is welcome by the operators, but the phased
introduction of the national single windows instead of a common start date
as well as different reporting formats and procedures are mentioned as
problems, such as the interface between the national single windows and
the Port Community Systems.
MoS · Study on ports and shipping operations 32You can also read