Finding farms YEAR 5 Design and Technologies, Mathematics and Geography - AN EDUCATIONAL UNIT FOR PRIMARY SCHOOLS - Cotton Australia
←
→
Page content transcription
If your browser does not render page correctly, please read the page content below
AN EDUCATIONAL UNIT FOR PRIMARY SCHOOLS

Finding farms

YEAR 5
Design and Technologies,
Mathematics and Geography
Contents

    Introduction.......................................................................................................... 3
    About the approach............................................................................................. 4
    Teacher notes....................................................................................................... 5
            Australian Curriculum content descriptions............................................. 6
            Implementing the unit and activities in the classroom............................ 7
            Some questions and possible answers..................................................... 9
    Fast facts about Australian agriculture............................................................... 10
            National Farmers’ Federation Farm Facts 2012...................................... 10
            Meat and Livestock Industry ................................................................. 11
            Fishing and Aquaculture Industry .......................................................... 11
            Cotton Industry ...................................................................................... 12
            Pork Industry ......................................................................................... 13
            Forestry Industry.................................................................................... 14
    Step 1: Engage with the topic ............................................................................ 15
            Getting started....................................................................................... 15
    Step 2: Explore the topic.................................................................................... 19
            Explore maps and some primary industry sectors................................. 19
    Step 3: Explain understandings.......................................................................... 24
    Step 4: Elaborate on concepts and ideas............................................................ 25
            Presentation planning............................................................................ 25
    Step 5: Evaluating............................................................................................... 26
            Think back and evaluate......................................................................... 26
    References.......................................................................................................... 27
    Resources .......................................................................................................... 29
            Resource 1.1 .......................................................................................... 29         Cover illustration:
                                                                                                                               Liz Grant, Designgrant

Acknowledgements                                                   Copyright information
The Primary Industries Education                                   © Primary Industries Education Foundation 2015, except where indicated otherwise.
Foundation Australia in conjunction with                           This work by the Primary Industries Education Foundation is licensed under a Creative
the Australian Government produced this                            Commons Attribution 3.0 Australia license http://creativecommons.org/licenses/by/3.0/au/
educational resource for the Agriculture
                                                                   deed.en Under this license the material is available for free use and adaption. Educators
in Education Initiative. This resource is
                                                                   may use, adapt, communicate and re-publish material from the resource.
designed to introduce young people to
food and fibre production and primary                              You must include this statement on any copy or adaption of the material:
industries in Australia.                                           © Primary Industries Education Foundation 2015, except where indicated otherwise.
The Primary Industries Education                                   This work is licensed under a Creative Commons Attribution 3.0 Australia license
Foundation Australia would like to                                 (see http://creativecommons.org/licenses/by/3.0/au/deed.en)
acknowledge and sincerely thank the                                The material in this Unit of Work is made available for the purpose of providing access to
education program reference group                                  general information about food and fibre production and primary industries in Australia.
for offering comments on the drafts of
materials in this educational resource.
The education resource has been
developed by Angela Colliver from
Angela Colliver Consulting Services Pty
Ltd and designed by Liese Howard from                              As content of the websites used in this unit is updated or moved,
Modo Pty Ltd.                                                      hyperlinks may not always function.

2    I   FINDING FARMS     I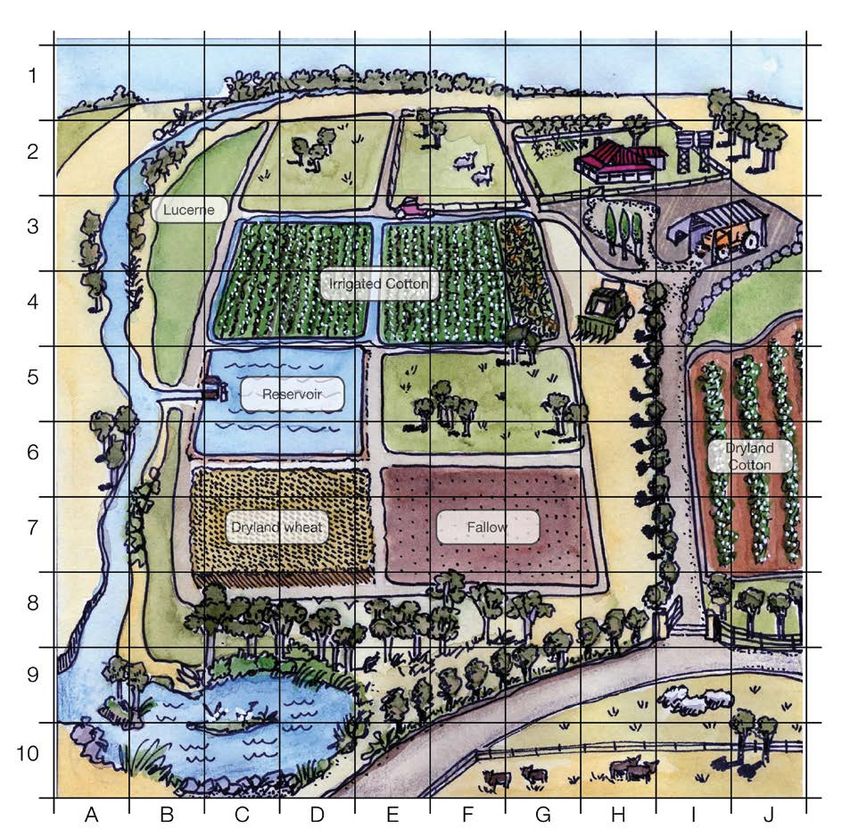
Introduction

Rationale
This resource material aims to help teachers and students in primary schools
investigate and understand more about primary industries in Australia.

The objectives of the educational resources are to:

•   Support Primary Industries Education Foundation Australia and its members
    in expanding awareness about primary industries in Australia by engaging and
    informing teachers and students about the role and importance of primary
    industries in the Australian economy, environment and wider community.

•   Provide resources which help build leadership skills amongst teachers and students
    in communicating about food and fibre production and primary industries in           An integrated
    Australia.

•   Develop educational resources that can be used across Australia to provide
                                                                                         primary industries
    encouragement, information and practical teaching advice that will support efforts   education program
    to teach about food and fibre production and the primary industries sector.

•   Educate school students on ways food and animals are raised and grown.
                                                                                         that emphasises
•   Demonstrate to students that everyone can consider careers in primary industries     the relationship
    and along the supply chain of food and fibre products.
                                                                                         between food and
•   Assist school students to spread this message to their families and the broader
    community.                                                                           fibre industries,
•   Develop engaging learning programs using an inquiry process aligned with the         individuals,
    Australian Curriculum.

•   Develop in school communities, an integrated primary industries education
                                                                                         communities, the
    program that emphasises the relationship between food and fibre industries,          environment and our
    individuals, communities, the environment and our economy.

These educational resources are an effort to provide practical support to teachers and
                                                                                         economy.
students learning about food and fibre production and primary industries in schools.

                                                                                                  I   FINDING FARMS   I   3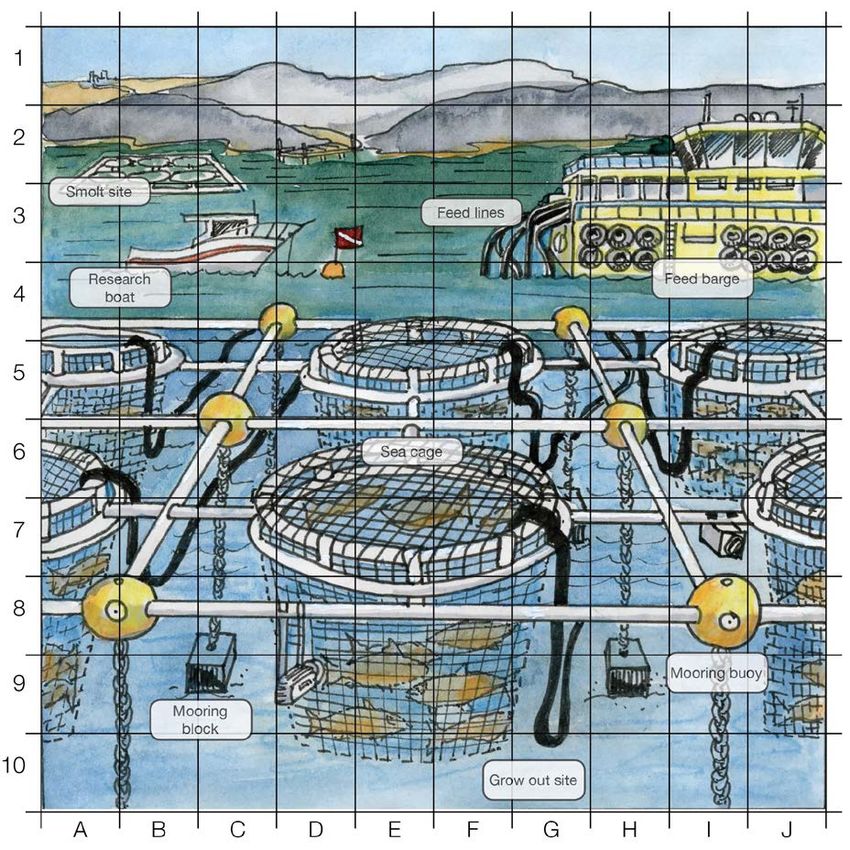
About the approach

                            Several key principles underpin the theoretical and practical application to this unit.

                            In providing an integrated framework for inquiry, complemented by rich explorations
                            of texts that are, in turn, supported by an emphasis on undertaking a challenge or
                            task, the unit requires students to:

                            •   Search for information using both digital and non-digital means

                            •   Use research techniques and strategies

                            •   Use thinking and analysis techniques
The approach                •   Present findings to a real audience, and

used, is the inquiry        •   Reflect both on the product created and the process undertaken.

approach through            Rather than seeing knowledge as something that is taught the emphasis in this unit
                            is on knowledge and understanding that is learned.
five phases:                The unit involves students in:

Engage, Explore,            •   Working from a basis of their prior knowledge and experience

Explain, Elaborate          •   Seeing a real task or purpose for their learning

                            •   Being directly involved in gathering information firsthand
and Evaluate.
                            •   Constructing their knowledge in different ways

                            •   Presenting their learning to a real audience

                            •   Reflecting on their learning.

                            The approach used, is the inquiry approach through five phases: Engage, Explore,
                            Explain, Elaborate and Evaluate. The phases of the model are based on the 5Es
                            instructional model (Bybee, 1997). This unit of work containing student activities
                            assists students to raise questions, gather and process data, make conclusions and
                            take action. These phases are:

                            •   Engage: The ‘Engage’ phase begins with lessons that mentally engage students
                                with an activity or question. It captures their interest, provides an opportunity for
                                them to express what they know about the concept or skill being developed, and
                                helps them to make connections between what they know and the new ideas.

                            •   Explore: The ‘Explore’ phase includes activities in which they can explore the
                                concept or skill. They grapple with the problem or phenomenon and describe it in
                                their own words. This phase allows students to acquire a common set of experiences
                                that they can use to help each other make sense of the new concept or skill.

                            •   Explain: The ‘Explain’ phase enables students to develop explanations for the
                                phenomenon they have experienced. The significant aspect of this phase is that
                                explanation follows experience.

                            •   Elaborate: The ‘Elaborate’ phase provides opportunities for students to apply what
                                they have learned to new situations and so develop a deeper understanding of
                                the concept or greater use of the skill. It is important for students to discuss and
                                compare their ideas with each other during this phase.

                            •   Evaluate: The ‘Evaluate’ phase provides an opportunity for students to review and
                                reflect on their own learning and new understanding and skills. It is also when
                                students provide evidence for changes to their understanding, beliefs and skills.
                            Source: Primary Connections http://www.primaryconnections.org.au/about/teaching

4   I   FINDING FARMS   I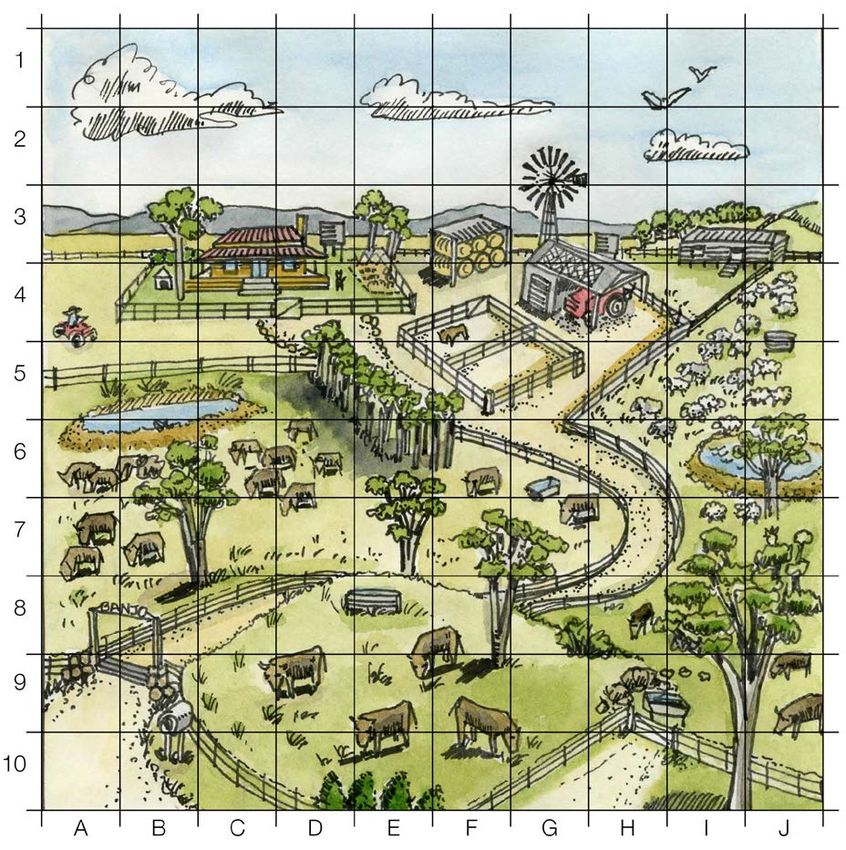
Teacher notes
Resource description
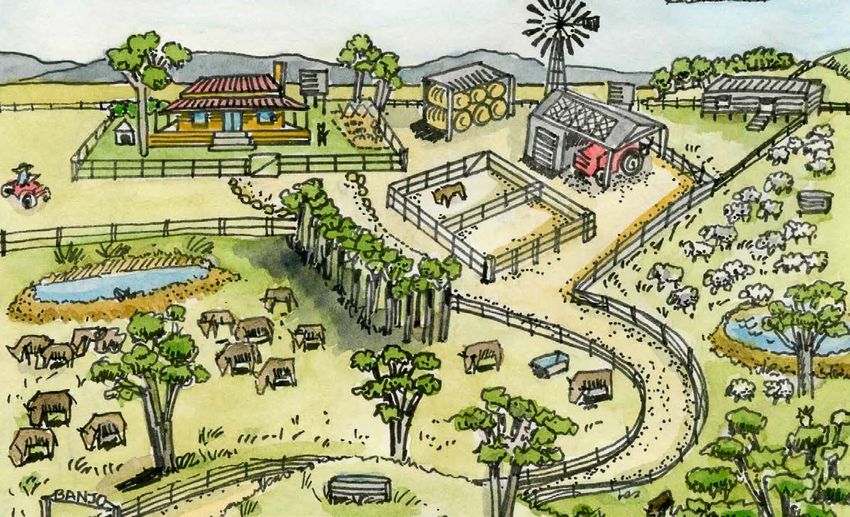
This is a unit with five inquiry teaching sequences about exploring life on farms
through the use of grid references to describe five primary industry sectors that
produce food and fibres.
This unit encourages students to examine illustrated maps with grid references for
five primary industry sectors that produce food and fibres and the natural or managed
environment in which the food and fibres are grown.
As the unit progresses, the emphasis shifts to choosing a primary industry sector to
research and create a grid reference system for others to use to locate objects and
Examine maps with
describe routes from one object to another. grid references
Having explored maps and grid references and a primary industries sector, students
then consolidate and present these understandings to an audience following the
about five primary
study.
industry sectors
At each stage in the investigations, the students are encouraged to share their findings
about maps, grid lines and grid references, and farms that produce food or fibres and that produce food
the products produced from them.
and fibres and the
Year level: 5
natural or managed
Curriculum focus environment in which
In this unit, students:
the food and fibres
• Explore life on farms through digital resources
• Explore a range of maps
are grown.
• Examine illustrated maps of farms using grid references to describe five primary
industry sectors that produce food and fibres
• Investigate five primary industry sectors that produce food and fibres and the
natural or managed environment in which the food and fibres are grown.
• Research a primary industry sector and create a grid reference system for others to
use to locate objects and describe routes from one object to another
• Plan and conduct an investigation using maps and grid references and a primary
industries sector
• Present these understandings to an audience following the study inviting them to
use a grid reference system to locate objects and follow routes from one object to
another
• Reflect and evaluate what they have learned about maps, grid lines and grid
references, and farms that produce food or fibres and the products produced from
them.
Based on Australian Curriculum, Assessment and Reporting Authority (ACARA) materials
downloaded from the Australian Curriculum website in February 2015. ACARA does not endorse
any changes that have been made to the Australian Curriculum.
I FINDING FARMS I 5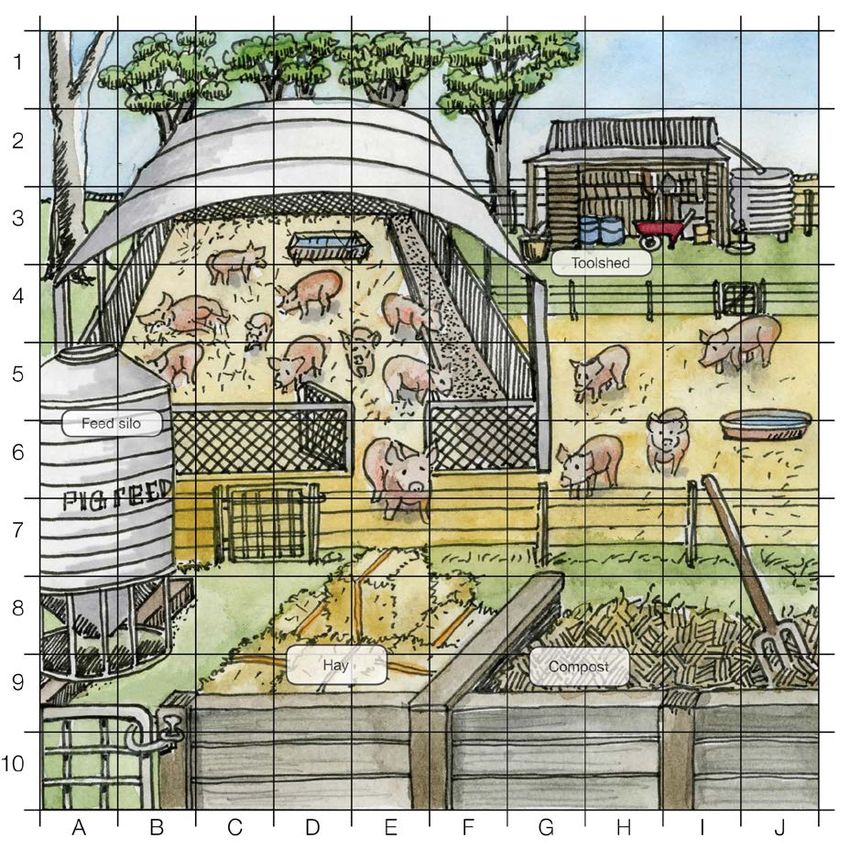
Teacher notes

Australian                  Design and Technologies
                            Strand: Design and Technologies knowledge and understanding
Curriculum                  Investigate how and why food and fibre are produced in managed environments

content                     ACTDEK021

descriptions                Mathematics
                            Strand: Measurement and Geometry: Location and transformation

                            Use a grid reference to describe locations ACMMG113

                            Describe routes using landmarks and directional language ACMMG114

                            Geography
                            Strand: Geographical Inquiry and Skills: Collecting, recording, evaluating and
                                    representing

                            Collect and record relevant geographical data and information, using ethical protocols,
                            from primary and secondary sources, for example, people, maps, plans, photographs,
                            satellite images, statistical sources and reports ACHGS034

                            Cross Curriculum Priorities
                            Sustainability

                            OI.2:    All life forms, including human life, are connected through ecosystems on
                                     which they depend for their wellbeing and survival.

                            OI.3:    Sustainable patterns of living rely on the interdependence of healthy social,
                                     economic and ecological systems.

                            OI.5     World views are formed by experiences at personal, local, national and global
                                     levels, and are linked to individual and community actions for sustainability.

                            OI 7:    Actions for a more sustainable future reflect values of care, respect and
                                     responsibility, and require us to explore and understand environments.

                            OI.8:    Designing action for sustainability requires an evaluation of past practices,
                                     the assessment of scientific and technological developments, and balanced
                                     judgments based on projected future economic, social and environmental
                                     impacts.
                            Source: Australian Curriculum, Assessment and Reporting Authority (ACARA), downloaded from
                            the Australian Curriculum website in February 2015.

6   I   FINDING FARMS   I
Teacher notes
Implementing Using the unit
The unit can be used in a number of ways. It will be of most benefit to teachers who
the unit and wish to implement a sustained sequence of activities following the inquiry stages
identified in the About the approach section of this unit and content descriptions in
activities in the the primary years in Design and Technologies, Mathematics and Geography as stated
in the Australian Curriculum.
classroom
Selecting activities
At each stage several activities are suggested from which you are encouraged to select
the most appropriate for your purposes. Not all activities in each stage of the unit
need to be used. Alternatively, you may add to or complement the suggested activities
with ideas of your own.
It is suggested that teachers create a hyperlinked unit. Organise the digital resources
for your class’s use on a website or wiki or provide them on your interactive
whiteboard.
Resourcing the unit
The resources suggested are on the whole, general rather than specific. Schools and
the contexts in which they exist vary widely as does the availability of some resources
– particularly in remote areas. There is a strong emphasis in the unit on gathering
information and data; research and observations also feature strongly as these
methods develop important skills and ensure that the exploration of the topics are
grounded in a relevant context.
Some YouTube and online videos in addition to Internet based resources are suggested
in the unit. You will need to investigate what is available in your school.
Adapting the unit
The unit is targeted at primary students. This is a suggested age range only and
teachers are encouraged to modify activities to suit the needs of the students with
whom they are working.
The unit’s topics are based on content descriptions of the Australian Curriculum and
on the key cross curriculum priority of sustainability. They embrace content that we
believe is of relevance and significance to all students. We encourage you to explore
ways in which the content can be adjusted to the context in which you are working.
Many of the activities contain the following icons offering a suggestion on how many
students should be involved:
Suggested for individuals
Suggested for pairs or small groups
Suggested for larger groups or entire classes
Resource sheets are provided for some activities. Most are for photocopying and
distribution to students. They are identified within units in bold italic: Resource 1.1.
The resource sheets are designed to assist teachers to facilitate learning without
having to access a range of other resources.
I FINDING FARMS I 7Teacher notes
What about assessment?
Rather than being a task carried out at the end of the unit, assessment is viewed as
integral to the entire unit sequence. Each activity should be regarded as a context for
assessment of student learning.
When planning and implementing the unit of work make clear decisions on what you
will focus on in assessing learning. The unit provides an opportunity for a range of
skills and understandings to be observed. We encourage you to devise an assessment
plan or assessment rubric that features areas to be assessed over subsequent lessons.
In planning for assessment, student learning in the following areas can be considered:
• Understandings about the topic
• Development of skills
• Exploration and clarification of values
• Use of language in relation to content
• Ability to use and critically analyse a range of texts
• Ability to analyse and solve problems
• Ability to interpret information, perceive its meaning and significance, and use it to
complete real-world tasks
• Ability to work cooperatively with others
• Approach to learning (independence, confidence, participation and enthusiasm)
For this unit, the following understandings are provided to assist teachers in planning
for assessment.
Assessment strategies
Each stage in the inquiry sequence provides information about student learning. There
are, however, two stages in the unit that are central to assessment: the Engage stage
and the Evaluate stage. Work that is undertaken in these stages can assist teachers to
monitor growth and observe concrete examples of the way student ideas have been
refined or have changed through the unit sequence. Work samples should be retained
for this purpose.
This unit contains a ‘Student Task’ which is well suited for assessment, as it is the
summation of the work undertaken by the students in the unit.
8 I FINDING FARMS ITeacher notes
Some questions Should I do all the activities?
At each stage of a unit, a number of activities are listed. You would not be expected to
and possible do them all. Instead, the unit is designed so that a selection of activities can be made
at each stage. You should select the activities according to the needs and interests of
answers your students and the time, relevance to the existing school curriculum and resources
available to you.
While you are encouraged to follow the suggested inquiry sequence for each unit, it is
quite possible to pick and choose from the range of activity ideas throughout the unit.
It may also be used in conjunction with other programs you use.
How do these units fit into my weekly program?
Although the unit integrates a range of key subject areas, it is not designed to be a
total program. It is assumed that regular routines that operate in your classroom will
continue to run alongside your unit of work. For example, you may have regular times
for use of the library, for maths, physical education etc. These things don’t change –
although student’s writing topics or choice of topics to research in the library or in
Information and Communication Technology classes may be influenced by this unit.
How long should the unit run?
This will of course depend on your particular circumstances but generally, a few weeks
to a term are suggested.
I don’t know much about food and fibre production myself –
will I be able to teach it effectively?
Yes! The unit is designed in such a way that you, as the teacher are a co-learner, and
you are therefore provided with teacher notes, plus readily available resources that
are mainly web-based. Most importantly, you will find that you learn with the students
and make discoveries with them.
I FINDING FARMS I 9Fast facts about Australian agriculture
National Farmers’ This page provides basic food and fibre production information that may be helpful
when you interact with the school students.
Federation • Agriculture plays a vital role in Australia, contributing to our social, economic and
environmental sustainability.
Farm Facts 2012 • In 2011, there were 157,000 farmers in Australia. Around half of these were mixed
crop and livestock farmers (22 percent), beef cattle farmers (20 percent) or dairy
farmers (8 percent).
Sources: Australian Bureau of Statistics, 2010-11 Agricultural Census; Australian Bureau
of Statistics, Australian Social Trends, Australian Farming and Farmers, December 2012,
Catalogue No. 4102.0.
• These farmers own or manage Australia’s 135,000 farm businesses – 99 percent
of which are Australian owned.
Sources: Australian Bureau of Statistics, 2010–11 Agricultural Census; Australian Bureau of
Statistics, Agricultural Land and Water Ownership, December 2010, Catalogue No. 7127.0.
• Each Australian farmer produces enough food to feed 600 people, 150 at home
and 450 overseas. Australian farmers produce 93 percent of Australia’s daily
there domestic food supply.
In 2011, Sources: Keogh M, Australian Farm Institute, 2009, “Australia’s response to world food
,000 security concerns”, Address to the 1st National Farmers’ Federation Annual Congress – Prime
were 157 Minister’s Science, Engineering and Innovation Council (2010); Australia and Food Security
in a Changing World. The Prime Minister’s Science, Engineering and Innovation Council,
farmers Canberra, Australia.
lia.
in Austra
• The average Australian farmer is male (72 percent), 53 years old (compared with
40 years old for people in other occupations), and a self-employed owner manager
(56 percent).
Sources: Australian Bureau of Statistics, 2010–11 Agricultural Census; Australian Bureau
of Statistics, Australian Social Trends, Australian Farming and Farmers, December 2012,
Catalogue No. 4102.0.
• As of June 2012, there were 290,000 people employed in Australian agriculture.
The complete agricultural supply chain, including the affiliated food and fibre
industries, provide over 1.6 million jobs to the Australian economy.
Sources: Australian Bureau of Agricultural & Resource Economics and Sciences (ABARES),
Australian Commodity Statistics, 2012; Australia’s Farm Dependent Economy: Analysis of the
role of Agriculture in the Australian Economy. Modelling undertaken by Econtech.
• The agricultural sector, at farm-gate, contributes 2.4 percent to Australia’s total
gross domestic product. The gross value of Australian farm production in 2011–12
was $46.7 billion.
Sources: Australian Bureau of Statistics, Value of Agricultural Commodities Produced,
2011–12, Catalogue No. 7503.0; Australian Bureau of Statistics, 2010–11, Australian System
e g r o s s value of National Accounts, Catalogue No. 5204.0; ABARES, Australian Commodity Statistics, 2012.
Th • Australian farmers are environmental stewards, owning, managing and caring
alian
of Austr for 59 percent of Australia’s land mass.
r m p r o d uction Sources: Australian Government Department of Agriculture, Fisheries and Forestry,
At a Glance, 2012.
fa
2 was
in 2011–1
• Farmers are at the frontline of delivering environmental outcomes on behalf of the
Australian community, with 94 percent of Australian farmers actively undertaking
lion.
$46.7 bil
natural resource management.
Source: Australian Bureau of Statistics, Natural Resource Management on Australian Farms
2006–07.
• Australia’s primary industries have led the nation in reducing greenhouse gas
emissions: a massive 40 percent reduction between 1990 and 2006.
Source: Australian Government Department of Climate Change, National Inventory by
Economic Sector 2006.
Source: National Farmers’ Federation Farm Facts 2012 at http://www.nff.org.au/farm-facts.html
10 I FINDING FARMS IFast facts about Australian agriculture
Meat and • Australia’s national cattle herd stands at 28.5 million head with the beef industry
accounting for 57 percent of all farms with agricultural activity.
Livestock • Australia produced around 2.2 million tonnes of beef and veal in 2012–13 directly
contributing to 1 percent of Australia’s gross domestic product.
Industry • Australia’s national sheep flock is 74.7 million head with the sheep industry
accounting for 32 percent of all farms with agricultural activity.
• Australia produces approximately 6 percent of the world’s lamb and mutton supply and
in 2012–13 exported 51 percent of all lamb and 96 percent of all mutton produced.
• Australia’s beef and lamb industry employs approximately 200,000 workers across
farm, processing and retail.
• Australian cattle and sheep farmers are the custodians of almost half of Australia’s
land.
• Australia’s beef and lamb industry is committed to ensuring a sustainable food
supply for future generations with ongoing research and development projects
relating to water, soil, biodiversity, animal welfare, energy, emissions and more.
Source: Meat and Livestock Australia http://mla.com.au
Fishing and Australia’s marine domain, our Exclusive Economic Zone, is one of the largest in the
world, covering around 10 million square kilometres. This is larger than mainland
Aquaculture Australia (7.69 million square kilometres). Despite the size of this zone Australia ranks
46th in the world for seafood production.
Industry Australia has progressively adopted a more ecosystem-based approach to fisheries
management which looks at the effect of fishing practices not just on the target species,
but also on the environment and other related species. Fisheries managers monitor
both stock and fishing levels as well as a range of other environmental factors to ensure
the amount of seafood harvested every year does not deplete stocks. In addition,
government observers travel regularly on fishing boats to ensure compliance to quotas,
bycatch limits and other regulations.
Source: Fisheries Research and Development Corporation, 2013 http://frdc.com.au/
During 2011–12 in Australia:
’s marine
Australia
• There were 6,991 people directly employed in the commercial fishing, hunting and
trapping sector, and 3,642 in aquaculture enterprises.
overs
domain c • The sector comprises approximately 120 wild catch fisheries and 70 aquaculture species.
n d 1 0 m illion • The gross value of Australian commercial seafood and products (for example, pearls)
arou tres. was valued at $2.3 billion, an increase of 3 percent on the previous year.
e k i l o m e
squar • Australian imports of fisheries products increased by 5 percent.
• The value of production for the wild-catch sector declined by 1 percent to $1.3 billion
and production volume decreased by 4 percent to 157,505 tonnes. While the gross
value of aquaculture production rose by 10 percent ($100 million) to $1.1 billion.
• The largest contributor to Australian aquaculture production in 2011–12 was
salmonids, which make up 52 percent of the total aquaculture production volume
and 49 percent of the value.
• Tasmania accounted for the largest share of gross value of production (30 percent),
followed by South Australia (19 percent) and Western Australia (17 percent).
Commonwealth fisheries accounted for 13 percent of the gross value of production.
Source: ABARES, 2013 http://data.daff.gov.au/data/warehouse/9aam/afstad9aamd003/2012/
AustFishStats_2012_v1.0.0.pdf
I FINDING FARMS I 11Fast facts about Australian Agriculture
Cotton Industry • Every year cotton farmers make an important social and economic contribution
to the nation creating jobs for 8,000 people (in Northern New South Wales and
Southern Queensland alone), support for more than 4,000 businesses and over
$2 billion for the national economy in export earnings.
Sources: Cotton Australia Pocket Guide to Cotton, Judith Stubbs and Associates Report 2011.
• In 2013, there were 1,181 cotton farms. 63 percent were in New South Wales and
37 percent were in Queensland. Of those farms cotton makes up 17 percent of
land area on farm.
Source: Cotton Annual 2014.
a l i a ’s c otton • Australia’s cotton growers produce enough cotton to provide jeans, socks,
Aust r underwear and a shirt for 450 million people. The overall yield in 2012 was
o w e r s p r oduce 10.37 bales per hectare – the first time in history that average yields have
gr exceeded 10 bales per hectare. Australia’s cotton growers produce yields almost
lmost three times the world average.
yields a Sources: Cotton Australia tables (compilation of industry sources), ABARES Crop Report,
r e e t i m es the December 2012, Pocket Guide to Cotton 2014.
th
erage. • The average Australian cotton farmer is 39 years old, has a family owned and
world av operated farm, employs on average six or more people, grows other crops like
sorghum, soybeans, wheat and canola, has 496 hectares of cotton and is not only
a farmer but also a builder, mechanic meteorologist, agronomist, conservationist,
scientist and marketer.
Sources: Pocket Guide to Cotton 2014, Monsanto audited numbers 20.12.13, 2013 Cotton
Practices Grower Survey, Cotton Research and Development Corporation.
• The Australian cotton crop was worth almost $2.3 billion at the farm gate.
Source: Cotton Australia tables (compilation of industry sources), Cotton Compass.
• The Australian cotton industry has achieved a 40 percent increase in water
productivity over the last decade, i.e 40 percent less water is now needed to grow
one tonne of cotton lint, compared to 2003.
Source: The Australian Cotton Water Story 2011.
• The ratio of dryland cotton (rain grown) to irrigated cotton varies depending on the
% l e s s w ater is market and conditions. Of the 2011–12 crop 5 percent was dryland and 95 percent
40 irrigated. Favourable grain and sorghum prices meant many dryland farmers opted
to grow
needed
not to plant cotton at that time.
Sources: Cotton Australia tables (compilation of industry sources), ABARES Crop Report
e of
one tonn
December 2012.
nt • Australian cotton growers have reduced their insecticide use by 95 percent over
cotton li the past 15 years. Source: Monsanto Audited numbers 20.12.2013.
r e d t o 2003.
comp a • Cotton growers are good environmental stewards, owning and caring for native
vegetation equivalent to 40 percent of the area of their cotton farms, on average.
Source: 2011 Cotton Grower Survey (Cotton Research and Development Corporation and
Cotton Catchment Communities Co-operative Research Centre).
Source: Cotton Australia http://www.cottonaustralia.com.au
12 I FINDING FARMS IFast facts about Australian Agriculture
Pork Industry • Australia is the first nation in the world to introduce the voluntary phase-out of
gestation stalls.
• Pork accounts for approximately 0.4 percent of the national greenhouse gas
emissions – significantly lower than other agricultural sectors, including beef at
11.2 percent, sheep at 3.4 percent, and cattle at 2.7 percent.
Source: Garnaut, R. 2008, The Garnaut climate change review – final report, available at:
http://www.garnautreview.org.au/index.htm
• Whether housed indoors or outdoors, a pig spends more time resting than any
other domestic animal.
’s pig
Australia • Australia’s pig herd health is one of the cleanest in the world, free from many
ne of
detrimental diseases found in most other pig producing countries
herd is o • The feed component (mainly grains such as wheat, barley and sorghum) makes up
nest
the clea
about 60 percent of the total cost of producing pork.
orld.
in the w
• Pigs have a very wide angle of vision (310 degrees) and are therefore easily
distracted.
• On average, a sow will produce 10–12 piglets per litter.
• The average growth rate of Australian pigs is around 600–650 grams a day from
birth to sale.
• Pigs have colour vision but they can’t focus both eyes on the same spot.
• Pigs are unable to perspire and they lose heat through their mouths. Their ideal
growing temperature is 20–22˚C.
Source: Australian Pork Limited http://www.australianpork.com.au
I FINDING FARMS I 13Fast facts about Australian Agriculture
Forestry Industry • Forestry plays a vital role in Australia, contributing to our social, economic and
environmental sustainability.
• Forests are also the foundation for a broad range of cultural and spiritual
experiences for diverse groups of people. They are a major tourist attraction for
Australian and overseas visitors, providing for a vast array of recreational and
educational activities.
• In 2010–11, the total turnover of Australia’s forest product industries was more
than $24 billion.
• Australia has 125 million hectares of forest, equivalent to 16 percent of Australia’s
s t r a l i a has 125 land area. Australia has about 3 percent of the world’s forest area, and the seventh
A u largest reported forest area of any country worldwide.
o n h e c t ares
mill i • Australia’s 123 million hectares of native forests are dominated by eucalypt forests
and acacia forests.
,
of forest
t to 16%
• 32 percent of all Australia’s native forests (private and public land) are protected
u i v a l e n
eq for biodiversity conservation. With 73 percent of Australia’s identified old growth
’s l a n d area. forests in formal or informal nature conservation reserves.
of it • 9 percent (36.6 million hectares) of the native forests were available and suitable
for commercial wood production in 2010–11 comprising 7.5 million hectares of
multiple-use public forests and 29.1 million hectares of leasehold and private
forests.
• Forests protect soil and water resources and are increasingly being recognised
for their carbon storage and sequestration capability. The total carbon stored
in forests, wood and wood products and paper products was in the order of
400 million tonnes in 2010.
• Australia’s native and plantation forests provide the majority of the timber and
a significant proportion of the paper products used by Australians.
• On average, each year, every Australian consumes the equivalent of about 1 cubic
metre of harvested log in the form of timber products, including timber for home
building, joinery and furniture and paper products.
rotect
Forests p
• Australia’s forest management is among the best in the world in terms of
conservation reserves and codes of practice for production forests.
i l a n d w ater
so • Australia has two forestry certification schemes that enable users of wood and
u r c e s a s well wooden products to know the source of the wood.
reso
r i n g c a rbon. • The sector directly employs 73,267 people in the forest and wood products
as st o industry in Australia (2011). This includes full and part time employees with
1.5 percent of all employees being Indigenous.
Sources: http://www.agriculture.gov.au/forestry
http://au.fsc.org/
http://www.forestrystandard.org.au/
http://www.naturallybetter.com.au/
http://www.forestlearning.edu.au/
14 I FINDING FARMS IStep 1: Engage with the topic
Getting started
Farms
Purpose
Much of the food and materials our community rely upon started as some form of
To provide students with
agriculture on a farm. Whether it came from a field, a forest, a fishery, a piggery or
opportunities to:
a free range farm there was a natural or managed environment responsible for its
• gather information about growth.
student’s prior knowledge about
Capture student interest and FIND OUT what they know about farms.
farms, different types of animals
raised or crops grown and what Talk with students about what they know about farms, whether they
they produce have ever visited one, have a family member who owns one or know of
• pool ideas and share with others someone who farms as a way of living.
• build an interest in maps and DISCUSS the diversity of farms that exist in Australia. INTRODUCE terms
map reading like fishery; forest; piggery; free range farm; cattle station; dairy farm;
sheep farm; oyster farm; tree farm; cotton farm; vineyard; cherry farm,
• learn about maps with grid lines
mixed farm etc.
and grid references
Ask students to RECORD what they know about farms, where they are
• develop skills in making
located, what they produce and for whom?
connections between ideas
• help set directions for an Use e-Postcards
investigation
ABC OPEN’s ‘Video Postcards’ project invites people across regional Australia to share
• provide data for assessment a corner of their earth with the world.
purposes.
VIEW the following Video Postcards and INVESTIGATE farms that
produce some of our food and fibre sources.
CHECK the map on the bottom right hand corner of each page and TALK
about where these farms are located in Australia.
CHECK OUT Preston in Tasmania. What food source is farmed there?
https://open.abc.net.au/projects/video-postcards-30rs6yp/contributions/postcard-
from-preston-rena-s-story-74vh5un
INVESTIGATE what food Port Lincoln is famous for producing.
https://open.abc.net.au/projects/video-postcards-30rs6yp/contributions/port-
lincoln-the-tuna-town-98md5tv
FIND OUT more about what is grown in Barooga, in the Goulburn Valley in
Victoria.
https://open.abc.net.au/projects/video-postcards-30rs6yp/contributions/i-love-
barooga-at-harvest-time-53lq3pm
CHECK OUT what’s grown in Muttaburra in Queensland.
https://open.abc.net.au/projects/video-postcards-30rs6yp/contributions/stepping-
into-a-grazier-s-boots-04bk8ga
VIEW the videos and use clues from the maps located in the bottom right
hand corner of each page and student’s background knowledge to TALK
about these farms and the places they are located.
I FINDING FARMS I 15Step 1: Engage with the topic
Immerse the students in the topic of maps
Introduce the term ‘map’. Ask students what a map might be.
SHOW students different maps, for example Google Maps, a road map, a
plan of the school, a street directory, a world map. EXPLAIN how maps
are an explanation of places.
TALK with the students about the need to be a bit of a detective when
finding places on a map, as maps give lots of clues. Using Google Maps
invite students to FIND where they live and where the school is located.
Ask students to OBSERVE the streets travelled to get to school and to
draw a map of the route taken.
Talk with the See: https://www.google.com.au/maps/
students about the LOOK at large street directory maps, globes, large board atlases, or Google
Maps and ask students to:
need to be a bit of • IDENTIFY places they see, for example: land masses, oceans, islands,
a detective when streets. Invite each student to make a statement about what they can
see on the map or globe, for example: land masses, the equator, the
finding places on a North Pole, oceans and names of countries.
IDENTIFY those things you cannot see on the map or globe, for
map, as maps give •
instance people, houses, trees.
lots of clues. Using the map or globe, INTRODUCE and IDENTIFY places like North and South Pole,
the equator, and introduce terms north, south, east and west instead of up, down,
below and above.
Ask students in pairs or small groups to DRAW a map of the route they
take to their house and add symbols to show features of places these pass.
For example -!-!-!-! for a railway track.
As a class, SHARE maps and chart symbols used by the students.
DISPLAY these for reference.
Aerial maps
SIMULATE an aerial map. COLLECT together an assortment of objects and spread
them out on a table or on a sheet of paper on the floor. Ask students in groups to:
• STAND so that they can LOOK DOWN at them and to DRAW a map of what they
see.
• Use colours and symbols to REPRESENT the different objects.
TALK about how people have been making maps for hundreds of years
and how old maps look very different from today’s maps.
SHOW students a range of maps from the past.
See: http://www.oldmapsonline.org/map/rumsey/0466.054
or http://www.oldmapsonline.org/map/rumsey/0466.051
TALK about how maps from the past were often made from sketches
whereas today most maps are made using aerial photographs and satellite
images.
EXPLAIN that aerial photographs are taken by cameras fitted to
aeroplanes. SHOW students an example of aeroplanes and the cameras
used. See: http://www.aerialhotshots.com.au/aerial-surveillance.php
16 I FINDING FARMS IStep 1: Engage with the topic
Brainstorm
Talk about how making maps of the way land is used can help us to understand the
many things about an area.
BRAINSTORM ideas about how land use maps can show what is grown on
farms; fished in oceans; and grown in forests. List key words and create a
flow chart to show links between them. Making maps of
SHOW students aerial photographs taken of farms in rural areas to
consolidate understandings.
the way land is
See: http://www.aerialhotshots.com.au/rural-aerial-photography.php used can help us
Using the 15 aerial photographs available on this site TALK with students
about aerial photographs being a ‘bird’s eye view’.
to understand the
EXPLAIN how land use maps can use symbols to show different types of many things about
land use and they can also use different colours to represent different land
uses.
an area.
BRAINSTORM symbols that could be used to represent features seen in
these photos. For example: a dam, river, shed, field, paddock, trees, or
round yard.
BRAINSTORM symbols that could be used on maps to represent:
• cotton fields
• water tanks
• forest
• shelterbelt or windbreak
• shearing shed
• water troughs
• sheltered sheds
• aquaculture ponds
• tree plantings
• cattle and/or sheep yards
COLLATE and DISPLAY student ideas.
I FINDING FARMS I 17Step 1: Engage with the topic
Setting the task
Note: This is a suggested assessment task
EXPLAIN to the class that their task will be to work in small groups to FIND OUT
more about maps with grid lines and grid references and LOCATE symbols to show
different places and locations on farms.
Explain that each group will INVESTIGATE maps relating to five primary
industry sectors that produce food and fibres. They will also EXPLORE the
natural or managed environment in which the food and fibres are grown.
Explain that each group will CHOOSE one primary industry sector,
RESEARCH it and either, WRITE and DRAW or design and MAKE a game
with a grid reference system for others to use accompanied by a text that
challenges them to locate objects and follow routes from one object to
another.
Investigate maps
Explain that later in the unit each student will also CHALLENGE others to
relating to primary use their student-created grid reference system to LEARN more about a
primary industry sector and what it produces.
industry sectors
that produce food
and fibres and
also explore the
natural or managed
environment in
which the food and
fibres are grown.
18 I FINDING FARMS IStep 2: Explore the topic
Explore maps and some primary industry sectors
Purpose Things with grid lines and grid references
To provide students with As a class VIEW a selection of tools and maps with grid lines and grid references.
opportunities to develop their
VIEW a simple Excel spreadsheet and TALK about how it uses grid lines in the lines
understanding of:
going both across and up and down the sheet, forming a grid.
• maps with grid lines and grid
references LOOK AT creative ways students from across the world have incorporated grid lines
into hand drawn maps.
• symbols used on maps
SEE ‘The World Map in My Cone Hat’ drawn by Nguyen Thi Phoung Anh,
• land use maps
aged 12, from Vietnam: http://children.library.carleton.ca/cgi-bin/childmap/
• primary industry sectors that picture.php?Number=1995-121w
produce food and fibres
VIEW ‘My Place is Puzzling to Me’ by Francisco M. Monares Leon, aged 10
• a focus for the forthcoming from United State of America:
experiences in the ‘Explain’ stage http://www.explokart.eu/petchenik/submissions/US-2.jpg
of the inquiry.
LOOK at ‘The World of My Dreams’ by Altug Namik Yavas, aged 8
from Turkey: http://children.library.carleton.ca/cgi-bin/childmap/picture.
php?Number=2013-140w
CHECK OUT ‘Life in the Universe’ by Meric Senduran, aged 10 from
Turkey: http://www.explokart.eu/petchenik/submissions/TR-6.jpg
VIEW ‘The World in My Hand’ by Allison Lee, aged 9 from Canada:
http://www.explokart.eu/petchenik/submissions/CA-3.jpg
Lastly, LOOK at ‘The Man and Transformation of the World’
by Thaïs Martins Raposeiro, aged 12 from Brazil:
http://www.explokart.eu/petchenik/submissions/BR-6.jpg
Using the grid within Thaïs’s map, INTRODUCE students to the language
of grid references. NUMBER the grids going up and down his map that can
allow students to pin point a place on his map.
See: http://www.explokart.eu/petchenik/submissions/BR-6.jpg
Look at creative Using the grid references ASK questions like:
• Where is Brazil located?
ways students from
• What grid references can be used locate Russia?
across the world • What grid references locate Canada?
have incorporated • How might we use grid references to show the location of Argentina?
grid lines into hand
drawn maps.
I FINDING FARMS I 19Step 2: Explore the topic
Explore more maps with grids
VIEW ‘The World in a Click’ by Ana Carolina Otton Sarmanho,
aged 12 from Brazil.
See: http://children.library.carleton.ca/cgi-bin/childmap/picture.
php?Number=2011-23w
CONSIDER a keyboard just like a grid referencing tool and invite students
to DEVISE questions using the names of the number and alphabet keys to
pinpoint places featured in Ana’s map.
For example:
• Can you find the country located at V 4? It begins with the letter ‘V’.
Explain that maps • See if you can name the country located at C 3? It begins with the letter
‘C’ and its capital city is Bogota.
use symbols, little • Name the two countries that are located at S 2.5.
pictures or shapes, • Find the two European countries located at Y 6.5.
to represent things • Play games using the keys!
in real life. Maps with symbols
EXPLAIN to the class that maps also use symbols, little pictures or shapes to
represent things in real life. For example a white square with a red cross on it might
represent a hospital.
Ask students to VISUALISE a weather map, as they use different symbols to show us
how the weather is changing, and what type of weather we should expect. Elicit ideas
from students about the symbols they can recall on weather maps.
Extend ideas about symbols used on maps by viewing more student made maps in
Barbara Petchnick’s World Map Competition.
VIEW a map titled ‘The map of the world’ by Nikola Zlatanov, aged 7
from Bulgaria at: http://children.library.carleton.ca/cgi-bin/childmap/picture.
php?Number=1999-11w
LOOK AT how she incorporated symbols to show different types of land use.
VIEW a map titled ‘Wild animals – Inhabitants of land and sea’ by Kamila
Sojka, aged 12 from Poland, and discuss the different symbols of animals
found on the map and places where they are located: http://children.library.
carleton.ca/cgi-bin/childmap/picture.php?Number=1999-67w
20 I FINDING FARMS IStep 2: Explore the topic
RESEARCH TASK: PART 1
Investigate maps with grids
Re-state to the class that they will be viewing illustrated maps with grid lines and grid
references to:
• LOCATE different places and locations on farms
• LEARN about five primary industry sectors that produce food and fibre and the
natural or managed environment in which the food and fibre are grown.
Form groups Learn about five
Form groups and ASK groups to:
primary industry
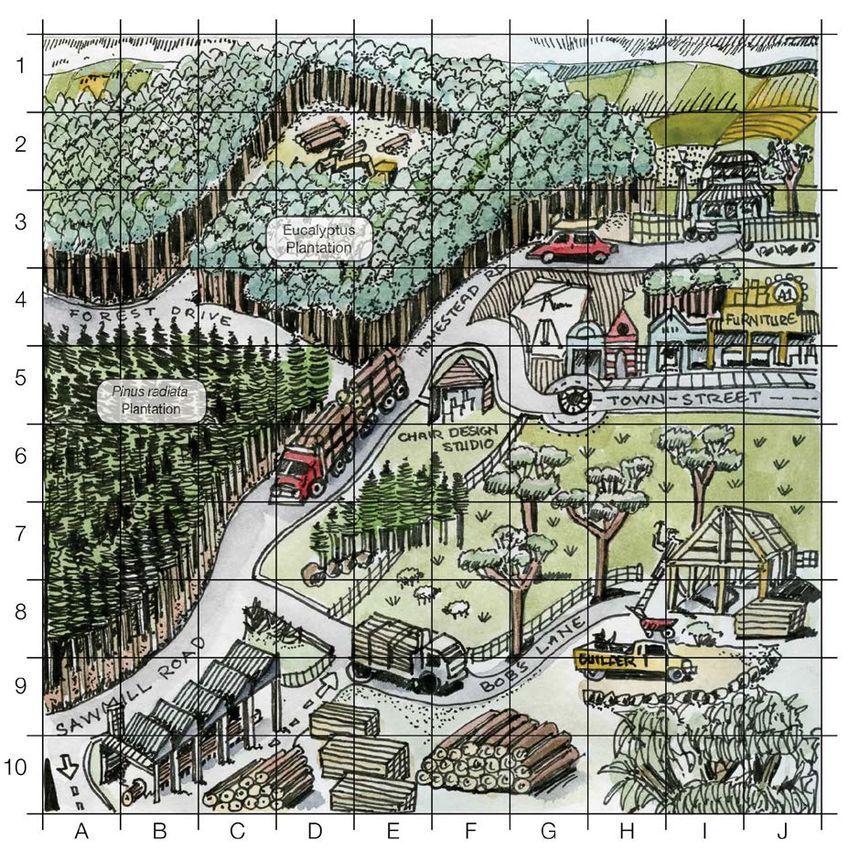
• Use the grid references printed on the illustrated maps located in
Resource 1.1 to FIND places and locations on farms. sectors that
• USE the letters across the bottom of the maps for the first part of the produce food
grid reference and the numbers up the side for the second part of the
grid reference. and fibre and the
• EXPLORE features of the primary industry sector featured in each natural or managed
map.
• CATEGORISE and LIST the natural (living) and managed (non-living)
environment in
elements of the place in which the food and fibre are grown. which the food and
• Use these understandings to DRAW or DESIGN and MAKE a game
with a grid reference system for others to use, accompanied by a text
fibre are grown.
that challenges them to locate objects and follow routes from one
object to another.
View maps with grids about five primary industry sectors
EXPLAIN to the students that their task is to start researching. Invite students in their
groups to VIEW the following maps, and RECORD grid references about places and
locations found on each one of the maps.
Resource 1.1 features six illustrated maps.
Using the maps with grid references INVESTIGATE and LOCATE the
natural or managed environmental elements of the place where food and
fibres are grown. Ask students to CATEGORISE and LIST the natural
(living) and managed (non-living) elements of the place where the food
and fibres are grown that can be seen on the maps and record these using
grid references.
I FINDING FARMS I 21Step 2: Explore the topic
Deciding on a primary industries sector to find out more about
Encourage the students to CHOOSE a primary industries sector to find out
more about.
Explain that their task is to FIND OUT more about one industry sector that
produces food and fibre and the natural or managed environment in which
the food and fibre are grown.
Re-state that each group of students will WRITE and DRAW or DESIGN
and make a game with a grid reference system for others to use
accompanied by a text that challenges them to locate objects and follow
Identify, describe and routes from one object to another.
record the food or More resources
fibre produced, and In assigned groups, invite students to CHOOSE from the ‘relevant primary industries’
featured below as a starting point and IDENTIFY, DESCRIBE and RECORD the food
the natural (living) or fibre produced by the sector they chose, and the natural (living) and managed
and managed (non-living) elements of the environment in which the food and fibres are grown.
For Australian Cotton producers see:
(non-living) elements http://cottonaustralia.com.au/cotton-classroom
of the environment http://cottonaustralia.com.au/uploads/publications/POCKET_GUIDE_-_FINAL.pdf
http://www.youtube.com/watch?v=cbKh1Xtfmao&list=UUcTsQcz7PRPX1bl3J3ORv-g&index=3
in which the food and http://www.youtube.com/watch?v=2yEpXeBVVg4
http://www.youtube.com/watch?v=QRwCRGopwHE
fibres are grown. http://www.youtube.com/watch?v=QgXPMFR6nqY
For Fisheries and Aquaculture in Australia see:
http://fish.gov.au/
http://www.youtube.com/watch?v=V2ZHabeg3kw&list=PLC8B09244EFAEE63A
For Australian Oyster Farming see:
http://www.oystersaustralia.org.au/farming
For Salmon Farming see:
http://www.tsga.com.au/salmon-farming/
For Australian Pork producers see:
http://www.aussiepigfarmers.com.au/looking-after-the-environment/
http://www.aussiepigfarmers.com.au/types-of-farming/indoor-intensive-housing/
http://www.aussiepigfarmers.com.au/types-of-farming/barn-reared-eco-housing/
http://www.aussiepigfarmers.com.au/types-of-farming/free-range
For Australian Beef and Lamb producers see:
http://virtualfarm.mla.com.au/
http://www.target100.com.au/Farmer-stories
http://www.mla.com.au/Cattle-sheep-and-goat-industries
http://www.youtube.com/Target100AUS
For Forest Management and Timber producers see:
http://forestlearning.edu.au/find-a-resource/article/28/going-bush-various-demand-for-
plantation-and-native-forests.html
22 I FINDING FARMS IStep 2: Explore the topic
Develop a retrieval chart
When investigations are completed as drafts, remind groups to DEVELOP a retrieval
chart on which students’ DOCUMENT information and ideas are collected.
RESEARCH TASK: PART 2
Remind students of the remaining focus of their task:
• To FIND OUT more about one industry sector that produces food and
fibre and the natural or managed environment in which the food and
fibre are grown.
• To WRITE and DRAW or DESIGN and make a game with a grid
reference system for others to use, accompanied by a text that
challenges them to locate objects and follow routes from one object to
another.
I FINDING FARMS I 23Step 3: Explain understandings
Purpose Approaches to producing food and fibre
To provide students with Using the information gathered, each group prepares a presentation using a grid
opportunities to: reference system for others to use to locate objects and describe routes, explaining
how one sector produces food or fibre.
• describe a primary industries
sector that grows food or fibre Encourage students to use a clear grid referencing system as part of their presentation.
• explain what it produces and Remind students to CONSIDER a presentation technique that will engage
describe the natural (living) or someone to interact with their grid system and asks another person to
managed (non-living) elements locate and find objects, places and routes taken in a primary industry
of the environment in which food sector.
and fibre are grown
• gather information about the Open-ended questions
topic Ask students what they know about open-ended questions and what they are used for.
• develop skills of formulating VIEW or LISTEN to various presentations where someone is using questions to
questions and gathering data engage another person in playing a game or interacting with a challenge from a
• develop communication skills television game show or YouTube videos where games are being played. Ask students:
• develop the understanding of • What is the role of the questioner?
how we can learn from others
• What was the role of the other person?
• develop a storyboard.
• What information was the questioner trying to gather?
• What types of questions are being asked?
• How effective were the questions?
Ask students to DRAFT a range of questions they might use to engage
someone, or more than one person, to INTERACT with their grid system
Prepare a which asks another person to LOCATE and FIND objects, places and
routes taken in a primary industry sector.
presentation using
For example:
a grid reference • Look at Map A and then Map B and DISCOVER the different locations
system for others on the cotton farm. CALL OUT the grid references that feature
something natural on the cotton farm.
to use to locate • GIVE the grid reference for the location of the start of the irrigation
objects and channel.
• SHARE the grid reference for where the cotton seed is stored.
describe routes,
• Invite students to PRACTICE creating such questions as part of their
explaining how one presentation planning.
sector produces • REHEARSE questions.
food or fibre. Decide on what to present and how to do so
Re-state the purposes of the task and ask students to CONSIDER how they are going
to bring their information together and present it so that the main points come across
clearly. MODEL the construction of video and slideshow tools. Students now use
the information they have gathered to CONSTRUCT a presentation for the research
being undertaken.
See: http://cooltoolsforschools.wikispaces.com/ for ideas.
24 I FINDING FARMS IStep 4: Elaborate on concepts and ideas
Presentation planning
Purpose Working with the information, maps and grid references
To provide students with A number of strategies can be used to help students finalise their presentation
opportunities to: planning.
• share their maps with grid lines MODELLING creative ideas might assist.
and grid references
Invite students to CONSIDER something like...
• apply what they have learned
and communicate the food and Tim’s Tour of...
fibre types that can be grown Come on a tour of...
in the primary industries sector You will have a map and directions.
and the natural or managed
Around each map are letters and numbers to help you find your way.
environment in which the food or
fibre are grown A compass shows the directions of north, south, east and west.
A key identifies local routes and distances.
• plan their presentation
There are fibres we use and foods we eat hidden on the farm.
• conduct their presentation
See if you can find them all.
• share investigation findings.
Pepa’s tour of...
Join Pepa pig and her friends to begin your tour of...
Travel through the farm, its surroundings, along creeks and through treacherous
swamps.
Pepa has hidden... somewhere along the way. See if you can find it.
Instructions:
Moor your canoe at the Yass River (E1) Take the sandy path east. Where the path
splits...
Going further with the planning of the presentation
Invite students to CONFIRM the idea planned for their presentation.
Ask students to CREATE a final plan for completing the presentation.
Students may need to DOCUMENT their key messages, CREATE an image
bank and COLLATE references and acknowledgements for their work
sample. Invite them to summarise these and the learning achieved in a
journal, log or reflection.
Review and submit
Note: This is a suggested assessment task.
Invite students to REVISE and fine-tune their presentation using a map
with a grid reference system to ENGAGE someone, which asks another
person to LOCATE and FIND objects, places and routes taken in a primary
industry sector.
CONSIDER hosting an afternoon of presentations to showcase the
students’ work to the school community and beyond.
Or HOLD a Game Day!
I FINDING FARMS I 25You can also read