PG&E Business Outlook - February 2020
←
→
Page content transcription
If your browser does not render page correctly, please read the page content below

PG&E Business Outlook
February 2020

Forward-Looking Statements
This presentation contains statements regarding                    and governance in connection therewith;                               • the impact of the Utility’s implementation of its PSPS
management’s expectations and objectives for future periods                                                                              program, including the timing and outcome of the PSPS OII
                                                                   • the impact of the 2018 Camp fire and 2017 Northern
as well as forecasts and estimates regarding PG&E                                                                                        and whether any fines or penalties will be imposed on the
                                                                   California wildfires, including whether the Utility will be able
Corporation’s and Pacific Gas and Electric Company’s (the                                                                                Utility as a result; and the costs in connection with PSPS
                                                                   to timely recover costs incurred in connection therewith
“Utility”) Chapter 11 emergence, improvements and                                                                                        events;
                                                                   through rates; the timing and outcome of the remaining
investments, and growth outlook; their planned operational,
                                                                   wildfire investigations and the extent to which the Utility will      • the timing and outcomes of the 2020 GRC, FERC TO18, TO19,
safety and structural improvements, including but not limited
                                                                   have liabilities associated with these fires; the timing and          and TO20 rate cases, 2018 and 2019 CEMA applications, WEMA
to the expected participation in the AB 1054 Wildfire Fund and
                                                                   amount of insurance recoveries; and potential liabilities in          application, future applications for FHPMA, FRMMA, and
the Utility’s 2020-2022 Wildfire Mitigation Plan; clean energy
                                                                   connection with fines or penalties that could be imposed on           WMPMA, future cost of capital proceedings, and other
opportunities; and five-year financial outlook, including but
                                                                   the Utility if the CPUC or any other law enforcement agency           ratemaking and regulatory proceedings;
not limited to ratebase growth through 2024, capital
                                                                   were to bring an enforcement action, including a criminal             • the timing and outcomes of CPUC OIIs that remain open;
expenditure through 2024, 2020 and 2021-2024 earnings
                                                                   proceeding, and determined that the Utility failed to comply
overview and assumptions, planned cost savings and rates                                                                                 • the Utility’s ability to efficiently manage capital expenditures
                                                                   with applicable laws and regulations (which actions could
and bills trajectory and potential capital raise. These                                                                                  and its operating and maintenance expenses within the
                                                                   also adversely impact a timely emergence from Chapter 11);
statements and other statements that are not purely                                                                                      authorized levels of spending and timely recover its costs
historical constitute forward-looking statements that are          • the risks and uncertainties associated with the 2019 Kincade        through rates, and the extent to which the Utility incurs
necessarily subject to various risks and uncertainties. Actual     fire;                                                                 unrecoverable costs that are higher than the forecasts of
results may differ materially from those described in              • whether the Utility can obtain wildfire insurance at a              such costs;
forward-looking statements. PG&E Corporation and the               reasonable cost in the future, or at all, and whether
Utility are not able to predict all the factors that may affect                                                                          • the outcome of the probation and the monitorship, and the
                                                                   insurance coverage is adequate for future losses or claims;
future results. Factors that could cause actual results to                                                                               costs that the Utility may incur as a result, including the costs
                                                                   and whether the Utility will be able to obtain full recovery of
differ materially include, but are not limited to:                                                                                       of complying with any additional conditions of probation,
                                                                   its significantly increased insurance premiums, and the
                                                                                                                                         including expenses associated with any material expansion
• the risks and uncertainties associated with PG&E                 timing of any such recovery;
                                                                                                                                         of the Utility’s vegetation management program;
Corporation’s and the Utility’s Chapter 11 cases, including, but   • whether the ability of PG&E Corporation and the Utility to
not limited to, their ability to develop, consummate, and                                                                                • the ability of PG&E Corporation and the Utility to continue as
                                                                   finance costs, expenses and other possible losses with                going concerns; and
implement a plan of reorganization, the ability to obtain          respect to claims related to the 2018 Camp fire and the 2017
applicable bankruptcy court, creditor or regulatory                Northern California wildfires, through securitization                 • the other factors disclosed in PG&E Corporation and the
approvals, the effect of any alternative proposals, views or       mechanisms or otherwise, which potential financings are not           Utility’s joint annual report on Form 10-K for the year ended
objections related to the plan of reorganization, potential        addressed by AB 1054 as it only applies to wildfires occurring        December 31, 2018, as updated in their subsequent joint
complexities that may arise in connection with concurrent          after July 12, 2019;                                                  quarterly reports on Form 10-Q and their joint annual report
proceedings involving the bankruptcy court, the CPUC, and                                                                                on Form 10-K for the year ended December 31, 2019, and other
the FERC, increased costs related to the Chapter 11 cases, the     • the timing and outcome of future regulatory and legislative         reports filed with the SEC, which are available on PG&E
ability to obtain sufficient financing sources for ongoing and     developments in connection with the potential financing of            Corporation’s website at www.pgecorp.com and on the SEC
future operations, the ability to satisfy the conditions           the Utility’s wildfire-related liabilities, SB 901, future wildfire   website at www.sec.gov.
precedent to financing under the debt and equity                   reforms, inverse condemnation reform, and other wildfire
commitments to finance the proposed plan of reorganization         mitigation measures or other reforms targeted at the Utility;
and the risk that such agreements may be terminated,               • the occurrence, timing and extent of damages in connection          Unless otherwise indicated, the statements in this
disruptions to PG&E Corporation’s and the Utility’s business       with future wildfires, the associated financial impact on the         presentation are made as of February 18, 2020. PG&E
and operations and the potential impact on regulatory              Utility and the potential for AB 1054 to mitigate such impact (if     Corporation and the Utility undertake no obligation to update
compliance;                                                        at all);                                                              information contained herein. This presentation was
                                                                                                                                         attached to PG&E Corporation and the Utility’s joint current
• whether PG&E Corporation and the Utility will be able to         • the outcome of the Utility’s CWSP, including the Utility’s          report on Form 8-K that was furnished to the SEC on
emerge from Chapter 11 by June 30, 2020 with a plan of             ability to comply with the targets and metrics set forth in its       February 18, 2020 and is also available on PG&E Corporation’s
reorganization that meets the requirements of AB 1054, and         2020-2022 Wildfire Mitigation Plan; the cost of the program;          website at www.pgecorp.com.
whether PG&E Corporation and the Utility will need to              and the timing and outcome of any proceeding to recover
undertake significant changes in ownership, management             such cost through rates;
                                                                                                                                                                                                              1
PG&E Corporation and Pacific Gas and Electric Company: Use of Non-
             GAAP Financial Measures and No Securities Offering

PG&E Corporation and Pacific Gas and Electric Company: Use of Non-GAAP Financial Measures

PG&E Corporation discloses historical financial results and provides guidance based on “non-GAAP core earnings” and “non-
GAAP core EPS” in order to provide a measure that allows investors to compare the underlying financial performance of the
business from one period to another, exclusive of items impacting comparability.

Beginning with the quarter and full year periods ended December 31, 2020, PG&E Corporation and the Utility changed the name of
their principal non-GAAP earnings metric from “non-GAAP earnings from operations” to “non-GAAP core earnings” in order to
align more closely with the terminology used by their industry peers. Likewise, PG&E Corporation and the Utility will now refer to
adjustments as “non-core items” rather than “items impacting comparability.”

“Non-GAAP core earnings” is a non-GAAP financial measure and is calculated as income available for common shareholders
less non-core items. “Non-core items” include items that management does not consider representative of ongoing earnings
and affect comparability of financial results between periods. “Non-GAAP core EPS”, also referred to as “non-GAAP core
earnings per share”, is a non-GAAP financial measure and is calculated as non-GAAP core earnings divided by common shares
outstanding (diluted). PG&E Corporation and the Utility use non-GAAP core earnings and non-GAAP core EPS to understand and
compare operating results across reporting periods for various purposes including internal budgeting and forecasting, short-
and long-term operating planning, and employee incentive compensation. PG&E Corporation and the Utility believe that non-
GAAP core earnings and non-GAAP core EPS provide additional insight into the underlying trends of the business, allowing for a
better comparison against historical results and expectations for future performance.

Non-GAAP core earnings and non-GAAP core EPS are not substitutes or alternatives for GAAP measures such as consolidated
income available for common shareholders and may not be comparable to similarly titled measures used by other companies.

No Securities Offering

This is not an offering of securities and securities may not be offered or sold absent registration or an applicable exemption from
the registration requirements.
                                                                                                                                      2
PG&E System at a Glance

PG&E Overview                                   Key Highlights
PG&E Corporation is a holding company           Roughly two-thirds of PG&E’s revenues are associated
whose primary operating subsidiary is Pacific   with owning and operating gas, electric, and generation
Gas and Electric Company, an investor-          infrastructure. The remaining third are pass-through
owned energy company that operates in           costs associated with commodity procurement.
Northern and Central California and delivers
some of the nation’s cleanest energy.                Californians served                      ~16M
                                                     Miles of electric lines                 ~125,000
                                                     Miles of natural gas pipelines          ~50,000
                                                     MW utility-owned generation             ~7,700
       PG&E’s                                        Carbon-free and renewable
       Service                                       energy delivered (2018)                  >85%
       Area

                                                   2019 WEIGHTED AVERAGE RATEBASE = $40.2B

                                                                         Gas
                                                                        ~25%
                                                                                  Electric
                                                                                      ~60%
                                                                    Generation
                                                                      ~15%

                                                                                                          3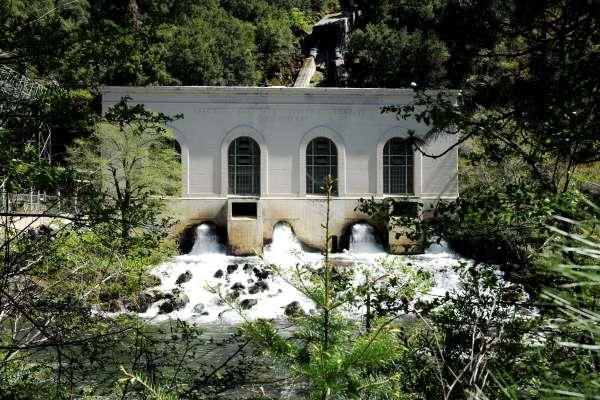
Executive Summary

Emergence                                                Positioned for timely Chapter 11 exit
                                                         ∎ Settlements reached with major wildfire victim groups and regulatory resolution
                                                         ∎ Clarity in ratemaking clarity through progress in major rate cases

Improvement                                              Changes in leadership, governance, structure, operations, and
                                                         oversight to better manage risks and localize operations
                                                         ∎ Improved enterprise risk reduction through data-driven enhanced safety
                                                           measures, enterprise-wide safety system, and long-term system upgrades
                                                         ∎ Regional restructuring and reducing administrative burdens for our frontline
                                                           supervisors to enable a greater focus on customers and safety
                                                         ∎ Appointed new Chief Safety Officer and independent safety advisor, and established
                                                           independent oversight committee

Sustainable Growth                                       Investing to enhance wildfire mitigation, increase customer
                                                         focus, and advance clean energy goals
                                                         ∎ Forecasting ~$37B - ~$41B in infrastructure investments over the next 5 years,
                                                           resulting in ~8% ratebase growth
                                                         ∎ Advancing our track record of supporting California’s climate leadership and
                                                           investing in building and transportation electrification

See the Forward-Looking Statements for factors that could cause actual results to differ materially from the guidance provided and underlying assumptions.   4
Agenda

   1     Recent Progress Enables Timely Emergence

  2      Operational, Safety & Structural Improvements

  3      Clean Energy Opportunities

  4      Sustainable Financials

                                                         5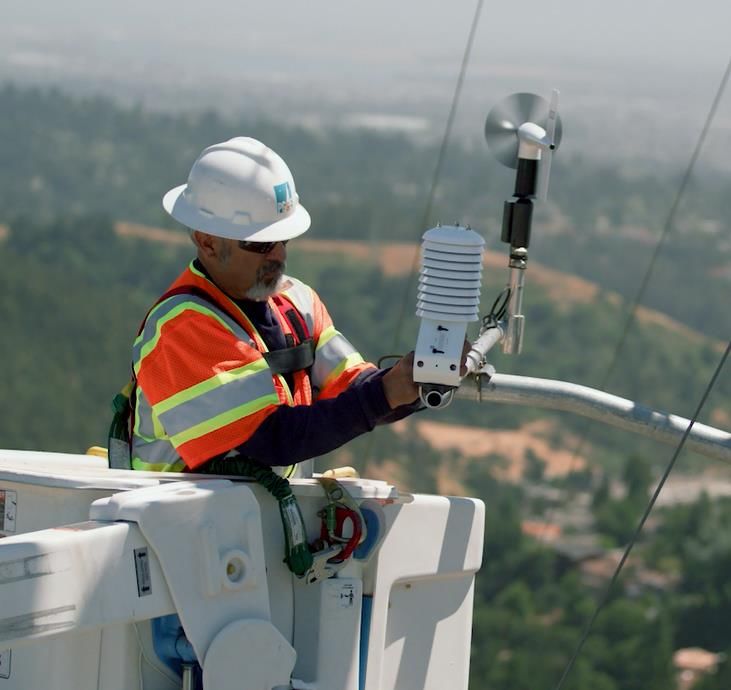
RECENT PROGRESS ENABLES TIMELY EMERGENCE
                      Resolution of Key Issues
Wildfire settlements, regulatory resolutions, the enactment of AB 1054, and establishment of a multi-year
investment and rate roadmap resolve uncertainty and provide stability.

              Third-Party Claims                                                                   Ratemaking                                          Regulatory & Legislative

✓ Settlements reached with key                                               ✓ 2020 General Rate Case (GRC)                                       ✓ Wildfire OII Settlement (1)
      constituents                                                                 Settlement                                                        Agreed not to seek recovery for $1.6B of wildfire
      Settlements totaling $25.5B with:                                            Proposes revenue requirements through 2022:                       related expenses, including:
       • Tort Claimants Committee and                                              • Includes two-way balancing account recovery                     • ~$700M of inspections and repairs expense
          Representatives of ~70% of Individual Fire                                  for wildfire mitigation, vegetation                            • ~$500M of Catastrophic Expense
          Victim Claimants: $13.5B                                                    management, and insurance costs                                   Memorandum Account (CEMA) expense
       • Subrogation Claimants: $11B                                                                                                                 • ~$400M in CEMA capital
       • County and Local Public Entities: $1B
                                                                             ✓ 2019 Gas Transmission and Storage                                  ✓ Locate & Mark OII Settlement (1)
                                                                                   (GT&S) Final Decision
✓ Settlement agreements avoid need                                                 • Adopted revenue requirements through 2022
                                                                                                                                                     Modified settlement of $110M:
                                                                                                                                                     • $66M of system enhancements
      for claims estimation and Tubbs Fire                                                                                                           • $44M fine to the California General Fund
      trial                                                                  ✓ 2020 Cost of Capital Final Decision
      Provide for an expedient confirmation and exit                               Adopted capital structure through 2022:                        ✓ Ex Parte OII Settlement – Final
      from Chapter 11 within the AB1054 deadline                                   • Maintains 10.25% return on equity (ROE)                         Final Decisions in both Phases 1 and 2:
                                                                                   • Maintains 52% equity structure, as requested                    • Phase 1 remedies of $97.5M
✓ Settlement agreement with                                                        • Reduces preferred stock from 1.0% to 0.5%, as                   • Phase 2 remedies of $10.0M
      Consenting Noteholders                                                         requested
       • Refinance or reinstate ~$21.5B of senior notes                            • Approves cost of long-term debt of 5.16%
           and bank debt
                                                                                                                                                  ✓ AB 1054 Wildfire Fund
                                                                                                                                                     Creation of ~$21B fund subject to:
       •   Expected ~$1B cost savings to customers                                                                                                   • $4.8B initial contribution and $193M annual
                                                                                                                                                        contribution
                                                                                                                                                     • ~$2.4B liability cap (2)
                                                                                                                                                     • $3.2B of capital excluded from equity return
                                                                                                                                                     • Full participation upon Chapter11 emergence(3)

(1)   Subject to CPUC and Bankruptcy Court approvals.
(2)   The liability cap is calculated as 20% of equity transmission and distribution ratebase and applies over a three-year measurement period.
(3)   Assuming Plan of Reorganization (POR) is confirmed on or before June 30, 2020.
                                                                                                                                                                                                         6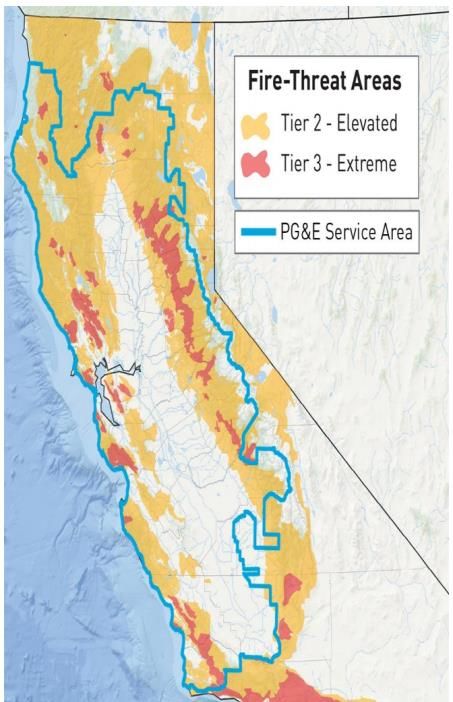
RECENT PROGRESS ENABLES TIMELY EMERGENCE
          Path to June 2020 Confirmed Plan

Upcoming Bankruptcy Court and CPUC milestones will allow for timely confirmation of PG&E’s Plan.

Chapter 11      1.31        2.5         2.7           2.28         3.10            5.15         5.27
              Amended    RSA  with  Proposed       Key parties’ Disclosure     Deadline to First Day of
              POR Filed Consenting Disclosure      Disclosure Statement          Submit     Confirmation
                        Noteholders Statement      Statement Hearing            Ballots to    Hearings
                         Approved      Filed       Views Filed                 Vote on Plan

   CPUC
                                           2.25 – 3.4     3.13      3.20    April           May
                                           Hearings     Opening    Reply Expected      Expected Final
                                                         Briefs    Briefs Proposed     Decision, incl.
                                                                          Decision        AB1054
                                                                                        Compliance
                                                                                        Approval by
                                                                                           CPUC

                                                                                                           7
RECENT PROGRESS ENABLES TIMELY EMERGENCE
                     Plan of Reorganization Summary

   Key Elements of the Plan of Reorganization                                                             $59 Billion in Plan Funding Sources ($B)
   PG&E’s Plan of Reorganization prioritizes wildfire victims,
                                                                                                                      1.6                 Cash Immediately Prior to Emergence
   puts customers ahead of investors, and enables continued
                                                                                                                      2.2                 Insurance Proceeds
   support of California’s clean energy goals. Key elements of
   the Plan include:                                                                                                  6.0                 Temporary Utility Debt
   • Satisfaction of pre-petition wildfire claims ($25.5B) and
     funding for participation in the statewide Wildfire Fund ($5.0B)
   • Creditors made whole ($27.75B)                                                                                   9.6                 Reinstated Utility Debt
   • Collective bargaining agreements are assumed
   • Corporate and Utility governance satisfies AB1054
   • Puts PG&E on path to help the state meet its clean energy
     goals and become the company that customers and                                                                 17.8                 New Utility Debt
     communities expect and deserve

   Plan Has Stakeholder Support
                                                                                                                     4.8                  New Holding Company Debt
   Official Committee of Tort Claimants
                                                                                                                     1.4                  Deferred TCC Settlement
   Attorneys representing fire victims who hold over 70% of the
   more than 70,000 claims that have been filed
   Subrogation Claimants and Key County and Local Public Entities                                                    15.8                 New Equity in PG&E Corp
   Ad Hoc Noteholder Committee
   Labor (IBEW)
                                                                                                             Sources of Funds

See the Forward-Looking Statements for factors that could cause actual results to differ materially from the guidance provided and underlying assumptions.                  8
RECENT PROGRESS ENABLES TIMELY EMERGENCE
                          Potential Capital Raise
                                   $59B funding for entirety of plan of reorganization has been secured.
                                             ~$27B may be raised via future public offerings.

       Sources of Funds: $59.0B                                                                                                        Potential Capital Raise: $26.925B

                                                                                                                                                   4.8    New HoldCo Debt

                                                                                                                                                   5.8    New Utility Debt
            Backstop, Bridge,
              and Potential
              Capital Raise                               26.9                                                                                     6.0    New Temp. Utility Debt
               ($26.925B)                                                                                                                          1.4    Deferred Common Equity (1)

                                                                                                                                                   9.0    New Common Equity (3)

                                                           1.6
                                                           2.2                      Cash at Emergence                                      Potential
                                                                                    Insurance Proceeds                                    Capital Raise
                                                           12.0
                                                                                    Noteholder RSA
                       Capital
                      Secured
                                                                                    Debt                                               Committed Capital: $22.825B
                     ($32.075B)
                                                            9.6                     Reinstated Utility                                  Equity backstop commitment           Up to $12B
                                                                                    Debt
                                                                                                                                        Utility debt bridge financing        $5.825B
                                                                                    Equity Issuance to
                                                           6.8
                                                                                    Wildfire Claimants (2)                              HoldCo debt bridge financing         $5B
                                            Sources of Funds
(1) Deferred Wildfire Claims payments to be made on January 15, 2021 ($650M) and January 15, 2022 ($700M).
(2) Common Equity to the Fire Victims to be issued to the Trust at a P/E multiple of 14.9x subject to Trust having a minimum ownership of 20.9%.
(3) Capital to be raised within the parameters of the Backstop Agreement.
See the Forward-Looking Statements for factors that could cause actual results to differ materially from the guidance provided and underlying assumptions.                                9
RECENT PROGRESS ENABLES TIMELY EMERGENCE
Structural and Governance Commitments
PG&E is moving forward with a number of structural, management and governance changes to improve
operations and ensure long-term accountability for sustained performance.
Operational & ▪ Regional restructuring placing leadership and operations closer to
Structural customers
▪ Metrics developed in consultation with the CPUC enable regular
oversight of PG&E’s safety and operational performance
Management ▪ Enhanced Chief Risk Officer and Chief Safety Officer roles, in addition to
Chief Ethics and Compliance Officer, reporting directly to PG&E’s CEO
▪ Majority of executive compensation will be at risk and based on safety
and customer-focused metrics
Corporate ▪ Refreshed Board with a goal of 50% California residents
Governance ▪ Refined skills matrix for Board member selection that includes
extensive safety requirements
▪ Refreshed Board has expanded PSPS, risk management, and wildfire
mitigation responsibilities
10Agenda
1 Recent Progress Enables Timely Emergence
2 Operational, Safety & Structural Improvements
3 Clean Energy Opportunities
4 Sustainable Financials
11OPERATIONAL, SAFETY, AND STRUCTURAL IMPROVEMENTS
Regionalization Model
Over time, we will reorganize our operations into smaller regions designed to get us closer to our
customers and be more responsive to specific regional and community needs.
Proposed New Regional Operating Model PG&E’s Diverse Customer Base
▪ One key goal of this new structure is to improve A regionalized model will help to more effectively
PG&E’s performance in critical customer- serve our diverse customer base:
centric areas such as:
▪ More quickly addressing localized safety Agriculture Commercial
issues
▪ Reducing outage response times
▪ Faster interconnections for customers
▪ Building a stronger and more personal
connection between customers and the
new regional leadership
▪ Core operations—including work execution and
service delivery—will be brought closer to
customers through regionalization, while key
enterprise functions will continue to be
centralized
High Tech and
Bio Tech
See the Forward-Looking Statements for factors that could cause actual results to differ materially from the guidance provided and underlying assumptions. 12OPERATIONAL, SAFETY, AND STRUCTURAL IMPROVEMENTS
Evolution of Risk Management at PG&E
Risk management at PG&E has significantly evolved. In collaboration with the commission and external
stakeholders, PG&E has developed models to identify, rank, measure, and mitigate all top safety risks.
Data-Driven, Risk-Based Decision Making Regulatory Alignment
Our improved risk management processes are Our risk assessment methodology was developed in
ensuring that our efforts and investments have consultation with regulators and intervenors and is
the greatest impact on reducing our top risks: delivering transparency and accountability for risk
management results.
Enterprise-wide All quantitative risk Risk Assessment Safety Model
Event-based Risk assessments based Mitigation Phase Assessment Proceeding
Register on bowtie analysis ▪ Includes a quantitative ▪ Describes agreed-upon
(from LOB Siloed Risk
Identify Evaluate and Monte Carlo deep dive into top safety risk assessment
Register) simulations risks and an analytical methodology for all IOUs
(from qualitative and initial basis for risk mitigations ▪ Establishes accountability
quantitative risk to be included in the reporting to track spend
ERM* assessments) company’s GRC request and risk reduction results
Effort and Monitor Respond Data-driven
outcome-based mitigation decisions
metrics to monitor based on alternative
completion and analysis, risk GRC
effectiveness reduction value, and
(from effort-based metrics risk-spend efficiency General Rate Case
to monitor completion) (from subject matter expertise
driven) ▪ Provides assessment of safety risks, proposed mitigations, and
forecasted cost to implement mitigations
* ERM – Enterprise Risk Management 13OPERATIONAL, SAFETY, AND STRUCTURAL IMPROVEMENTS
Wildfire Mitigation Overview
We developed our expanded wildfire safety programs based on analysis of the accelerated wildfire risks
stemming from climate change.
We met or exceeded goals for core elements of our 2019 Wildfire Mitigation Plan, resulting in a ~25%
reduction in ignitions. (1)
PG&E Specific Risk Drivers Wildfire Threat in PG&E’s 2019 Wildfire Mitigation Plan
Service Area Progress
Vegetation and equipment failure ~95% of the wildfire risk can be Met or exceeded goals on key
account for >70% of ignitions in HFTDs addressed in ~20% of the total elements:
overhead circuit miles in HFTDs (2)
171 out of 150 circuit
2015-2017 Fire Incident Drivers System 114% miles hardened and
for PG&E’s Tiers 2 and 3 Hardening hardened passed quality validation
49% Vegetation
2,498 out of 2,455 circuit
Equipment Failure
3rd Party
Vegetation 102% miles worked and
Management cleared validated
Animal
28% Other/Unknown
~ 50k transmission,
Enhanced 100% ~700k distribution, and
13% Inspections inspected ~200 substation assets
inspected
8%
3% 426 out of 400 weather
Situational 100%+ stations and 133 out of 96
HD cameras installed
Awareness completed
Fire Incident Drivers and operationalized
(1) Ignitions associated with PG&E assets in high fire-threat districts (HFTD) as compared to the 3-year historical average.
(2) Based on PG&E’s relative risk assessment where each circuit was scored on various factors to determine the locations of the greatest wildfire risk areas. Aggregating the relative risk score showed that approximately
95% of the wildfire risk is in 22% of the distribution line miles, or approximately 5,500 circuit miles. 14OPERATIONAL, SAFETY, AND STRUCTURAL IMPROVEMENTS
2020 Wildfire Mitigation Plan Detail
PG&E is committed to sustaining and building upon 2019 progress with our 2020-22 Wildfire Mitigation Plan.
The 2020-22 Plan will focus on reducing ignitions through core programs, reducing wildfire spread by
leveraging situational awareness tools, and reducing PSPS customer impacts.
Core Program Projections Program Goal Context
462 ▪ Risk-prioritized approach can substantially
System
7,100
171 241 378
Hardening address ~95% of the wildfire risk by hardening
(miles) line-miles over 10+ years ~20% of HFTD overhead line-miles (1)
2019 2020 2021 2022
Enhanced ▪ Leveraging 2019 insights and balancing EVM
2,498
Vegetation
Management
1,800 1,800 1,800
25,500 resources to continue D-line work and expand
2019 2020 2021 2022 line-miles over 10+ years T-line rights-of-way to reduce PSPS impacts
(miles)
Enhanced
Inspections
Tier 2
Tier 3
~370,000 ▪ Using risk-informed maintenance cycles
▪ Annual inspections of facilities in Tier 3 areas
(frequency) 2019 2020 2021 2022
structures on ▪ Three-year cycles for facilities in Tier 2 areas
avg per year (2)
▪ Real-time monitoring of weather conditions and
1,300
426 400
Weather 274
improved accuracy of meteorology models
Stations
weather stations ▪ 1 weather station roughly every 20 circuit miles
(units)
2019 2020 2021 2022 installed by 2021 (3) across HFTDs
▪ Live feeds and time-lapse data allow PG&E and
High Definition
Cameras
133 200 200
58 600 external agencies to identify, confirm, and track
(units) HD, pan tilt zoom wildfires
2019 2020 2021 2022
cameras by 2022 (3) ▪ Targeting ~90% visual coverage across HFTDs
(1) Based on PG&E’s relative risk assessment where each circuit was scored on various factors to determine the locations of the greatest wildfire risk areas. Aggregating the relative risk score showed that approximately
95% of the wildfire risk is in 22% of the distribution line miles, or approximately 5,500 circuit miles.
(2) Starting in 2020, Tier 2 assets will be inspected on a three-year cycle and Tier 3 assets will continue to be inspected annually.
(3) In 2018, PG&E installed approximately 200 weather stations and 9 HD cameras.
See the Forward-Looking Statements for factors that could cause actual results to differ materially from the guidance provided and underlying assumptions. 15OPERATIONAL, SAFETY, AND STRUCTURAL IMPROVEMENTS – WILDFIRE MITIGATION
System Hardening
In 2019, PG&E exceeded our system hardening goal by completing and quality validating 171 miles of system
hardening, all of which were in Tiers 2 and 3 High Fire Threat Districts.
System Hardening Approach 2019 Progress and Program Evolution
1. Replacing overhead circuits with
insulated conductors, stronger poles, 171 miles of system hardening completed
2019
and covered secondary lines and quality validated in HFTDs, or 114% of
Progress our 2019 goal
2. Converting overhead circuits to
underground lines
241 miles out of a total 7,100 line miles that
3. Retiring or removing overhead assets 2020 Target will be targeted over 10+ years
when customers can be served by
other means (e.g. Distributed
Generation, microgrids) System hardening can address ~95% of
Program the wildfire risk through targeting of
Impact ~20% of the total overhead line-miles
within HFTDs(1)
(1) Based on PG&E’s relative risk assessment where each circuit was scored on various factors to determine the
locations of the greatest wildfire risk areas. Aggregating the relative risk score showed that approximately
95% of the wildfire risk is in 22% of the distribution line miles, or approximately 5,500 circuit miles.
Wildfire Mitigation Plan Element | SYSTEM HARDENING | VEGETATION MANAGEMENT | ENHANCED INSPECTIONS | SITUATIONAL AWARENESS | PSPS IMPROVEMENTS
See the Forward-Looking Statements for factors that could cause actual results to differ materially from the guidance provided and underlying assumptions. 16OPERATIONAL, SAFETY, AND STRUCTURAL IMPROVEMENTS – WILDFIRE MITIGATION
Enhanced Vegetation Management (EVM)
PG&E’s enhanced vegetation management program goes beyond compliance. The program is evolving to
balance our overall goals, including shifting resources for rights-of-way (ROW) expansion that will have the
dual benefit of reducing wildfire risk and reducing PSPS footprints.
EVM Program Approach 2019 Progress and Program Evolution
1. Overhang Clearing: Removing overhanging
branches and limbs directly above but outside the 2019 2,498 miles in HFTD areas worked
radial clearance zone around electric power lines Progress and validated, or 102% of our 2019 goal
2. Hazard Tree Mitigation: Removing or trimming
trees that are determined to be hazard trees based
on their species, health, and proximity to power lines ▪ 1,800 miles worked
2020 ▪ Comprehensive EVM program that
3. ROW Expansion: Additional vegetation clearance Target and enables broader hazard tree
work on lower voltage transmission lines (e.g.
60/70kV or 115kV) to raise wind thresholds on lines
Approach evaluation and ROW expansion on
for PSPS events lower voltage transmission lines
Enhanced Vegetation Management
Figure 1: Illustrative example of enhanced vegetation work, which exceeds mandated Figure 2: Advanced vegetation management analytical model using remote sensing
clearances and includes overhang trimming, ground-to-conductor fuel reduction, and data to identify which trees pose the greatest risk
mitigation of hazard trees in HFTDs, in addition to ROW expansion (not pictured)
Wildfire Mitigation Plan Element | SYSTEM HARDENING | VEGETATION MANAGEMENT | ENHANCED INSPECTIONS | SITUATIONAL AWARENESS | PSPS IMPROVEMENTS
See the Forward-Looking Statements for factors that could cause actual results to differ materially from the guidance provided and underlying assumptions. 17OPERATIONAL, SAFETY, AND STRUCTURAL IMPROVEMENTS – WILDFIRE MITIGATION
Enhanced Inspections
In 2019, PG&E conducted an unprecedented number of enhanced fire ignition-based inspections and high-
priority corrective actions of all transmission, distribution, and substation assets in HFTD areas.
Wildfire Safety Inspection Program 2019 Progress and Program Evolution
Incorporating enhanced inspections, which
include ground and aerial inspections, and 2019 ▪ 100% accelerated safety inspections of
Progress electric infrastructure in HFTD areas,
climbing inspections of every transmission
tower, into routine inspections including:
• ~50,000 transmission towers,
Standardized Structure
Model Template for Camera • ~700,000 distribution poles, and
Angles
• ~200 substations
▪ Comprehensive ground, climbing or
helicopter inspections, and in some cases
High Resolution UAV Image using drones
2020 ▪ PG&E has rolled its WSIP program into its
Target modified routine inspections
and ▪ Enhanced inspections will be implemented
Approach for Tier 3 facilities every year and Tier 2
Note: Icons above do not
reflect all images/angles that Cracked Insulator visible in facilities on a three-year cycle to facilitate
will be captured as part of zoomed image a thorough understanding of asset
drone inspections
Figure 1: Drone inspections complement and further enhance the ground
conditions in HFTDs
and climbing visual inspections
Wildfire Mitigation Plan Element | SYSTEM HARDENING | VEGETATION MANAGEMENT | ENHANCED INSPECTIONS | SITUATIONAL AWARENESS | PSPS IMPROVEMENTS
See the Forward-Looking Statements for factors that could cause actual results to differ materially from the guidance provided and underlying assumptions. 18OPERATIONAL, SAFETY, AND STRUCTURAL IMPROVEMENTS – WILDFIRE MITIGATION
Improved Situational Awareness
PG&E has established fire detection and fire spread modeling capabilities based on an industry-leading
satellite system that offers 24/7 advance warning of potential new fire incidents. These data-driven
investments will improve our risk-informed decision-making processes in 2020 and beyond.
New Data and Analytics Improved Situational Awareness
▪ Real time monitoring of HFTD areas with: ▪ Custom and interactive web application for near-time
fire detections where users can track multiple
5 100+ 600+ properties, including the general intensity and spread
of fires
Satellites HD, pan-tilt- Weather ▪ By 2022, PG&E aims to have ~90% coverage across
zoom cameras stations HFTD areas with the installation of ~600 high-
definition cameras
▪ Custom and proprietary 1-min GOES-R fire
detection data pipeline established with the Space ▪ Increasing weather forecast granularity to a 2km x
Center and Engineering Center 2km spatial resolution (vs. 3km x 3km in 2019)
Figure 1: Example Camera Output and Web Interface Figure 2: Internal Web Application Showing Real-Time Figure 3: Example Output from the Fire Spread Model
Weather Station Data from Multiple Networks Application
Wildfire Mitigation Plan Element | SYSTEM HARDENING | VEGETATION MANAGEMENT | ENHANCED INSPECTIONS | SITUATIONAL AWARENESS | PSPS IMPROVEMENTS
See the Forward-Looking Statements for factors that could cause actual results to differ materially from the guidance provided and underlying assumptions. 19OPERATIONAL, SAFETY, AND STRUCTURAL IMPROVEMENTS – WILDFIRE MITIGATION
Public Safety Power Shutoff (PSPS) Improvements
Leveraging learnings from 2019, PG&E is committed to reducing customer impact by minimizing the frequency,
scope, and duration of future PSPS events.
2020 PSPS Goals and Mitigation Approach Reduced Customer Impacts in 2020 and Beyond
Goals by September 1, 2020: By utilizing Distributed Generation Enabled
Microgrids (DGEM), PG&E is targeting a ~20%
50% 33%(1) reduction in number of customers impacted.
faster restoration times reduction in affected
customers
CURRENT STATE FUTURE STATE
Mitigation Approach: Customers Customers
affected: 200K affected: 160K
▪ Distributed Generation Enabled Microgrids
(DGEM) at 20 priority substations to power safe-to-
Outage Outage
energize areas by June 1, 2020 (2)
DGEM
▪ Additional Sectionalization with enhanced
segmentation strategies on distribution and
transmission lines
Tier 3 Tier 3
▪ Increased Restoration Capabilities with up to
65 helicopters and fixed-wing aircraft with cameras
Note: Illustrative example
(1) As compared to the 2019 PSPS events, i.e. if the exact same weather patterns are seen in 2020 as experienced during the largest PSPS events in 2019 our mitigation efforts should reduce the number of customers impacted by
those PSPS events by approximately one-third.
(2) CPUC Docket: R.19-09-009
Wildfire Mitigation Plan Element | SYSTEM HARDENING | VEGETATION MANAGEMENT | ENHANCED INSPECTIONS | SITUATIONAL AWARENESS | PSPS IMPROVEMENTS
See the Forward-Looking Statements for factors that could cause actual results to differ materially from the guidance provided and underlying assumptions. 20OPERATIONAL, SAFETY, AND STRUCTURAL IMPROVEMENTS
Significant Progress in Gas Safety
We have demonstrated progress and continued focus on gas system safety since 2010, achieving industry-
leading gains in process safety, asset management, and technology innovation.
Industry Recognitions and Certifications Gas System Safety Progress 2010 2019
PAS 55 / Best-in-Class Asset Management Gas Average Odor Response 33.3 20.8
ISO 55001 One of the first utilities to receive certification Time
Minutes
Process Safety Performance 3rd Party Dig In Reduction 3.5 1.04
API RP 754 Excavation / 1000 Tickets
Indicators
2010 2011-19
Pipeline Safety Management
API RP 1173 Transmission Automated Valves 0 360
Systems
Installed
NTSB recommended 235
Opened state-of-the-art facilities: Pipeline Strength Tested 0 >1,495
Miles
▪ Gas Control Center, San Ramon
▪ Gas Safety Academy, Winters Pipeline Made Piggable 130 >1,316
Miles
▪ Gas Safety and Innovation, Dublin
Distribution Main Replaced 27 863
Miles Incl. all known
cast iron
21OPERATIONAL, SAFETY, AND STRUCTURAL IMPROVEMENTS
Continued Focus on Gas Safety
Our goal is to be the safest, most reliable gas utility in the United States. Gas Operations will further improve
safety though strength testing, asset management, workforce safety and reductions in non-conformance.
Asset Integrity & Risk Management Public Safety
of highest risk transmission
100 0
Pipeline & Hazardous Materials
vintage pipe segments that
Safety Administration (PHMSA)
are subjected to a high risk of
significant incidents within 5 years
percent land movement in proximity
to population planned to be
replaced by 2027
63 percent
of transmission pipelines
made piggable by 2029 90 percent
reduction in all Notice-of-
Violations (NOVs) and non-
conformances within 5 years
See the Forward-Looking Statements for factors that could cause actual results to differ materially from the guidance provided and underlying assumptions. 22OPERATIONAL, SAFETY, AND STRUCTURAL IMPROVEMENTS
Continued Progress in Generation Safety
Generation safety continues to be a priority; we are receiving industry-leading recognition while
enhancing our existing programs, technologies and oversight capabilities.
2019 Over Next 5 Years:
2019DCPP
DCPPRating:
Rating: Since 2015: Over Next 5 Years:
“Exemplary”
“Exemplary”performance
performancerating from >$340 million invested in
rating
>$600
>$600 million million
investment in
investment in safety
nuclear industry
from nuclear independent
industry oversight agency;dams, reservoirs, canals and
independent safety improvements to our dams,
waterways improvements to our
highest rating
oversight a nuclear
agency; plant
highest can receive
rating a reservoirs, canals and waterways
dams, reservoirs, canals
nuclear plant can receive and waterways
Nuclear Generation Safety Power
PowerGeneration
GenerationSafety
Safety
▪ “Exemplary” rating is the 13th ▪ Of PG&E’s 96 dams regulated by
for DCPP over its operating the California Division of Safety of
life, second to only one other Dams, 90 rated satisfactory (best
site in the country performance), 6 fair, 0 poor, and 0
unsatisfactory. All dams rated fair
▪ DCPP is an industry top- have safety improvement
quartile performer in projects underway or complete
maintaining worker radiation
exposure as low as reasonably
▪ Dam Safety Advisory Board
achievable (ALARA)
employs a panel of external
industry experts who continually
provide input to enhance our
program
See the Forward-Looking Statements for factors that could cause actual results to differ materially from the guidance provided and underlying assumptions. 23Agenda
1 Recent Progress Enables Timely Emergence
2 Operational, Safety & Structural Improvements
3 Clean Energy Opportunities
4 Sustainable Financials
24CLEAN ENERGY OPPORTUNITIES
Commitment to California’s Clean Energy Future
We are recommitting to California’s clean energy future by implementing and advocating for
clean energy policy and investing in electrification.
Implementing State Policy Continued Policy Promoting Transparency
Goals Advocacy and Reporting
▪ Procuring renewables to achieve ▪ Advocating for a federal price on ▪ Producing a Climate Strategy
60% RPS by 2030 and Carbon carbon Report in 2021 with a 2 Degree
Neutrality by 2045 Scenario Analysis
▪ Supporting California’s stringent
▪ Offering customer programs to tailpipe emissions standards ▪ Continuing to engage with our
achieve 2X energy efficiency in and backing litigation to maintain external Sustainability
existing buildings by 2030 comparable federal standards Advisory Council
▪ Investing in charging ▪ Supporting local ordinances ▪ Continuing other voluntary
infrastructure to support 5M zero- promoting all-electric new
reporting on GHG emissions,
emission vehicles by 2030 construction climate-driven risks, and ESG
▪ Targeting pilots and programs to disclosures
increase access to clean
energy in disadvantaged
communities
See the Forward-Looking Statements for factors that could cause actual results to differ materially from the guidance provided and underlying assumptions. 25CLEAN ENERGY OPPORTUNITIES
Transportation Electrification Opportunity
We will extend our track record of enabling California’s adoption of advanced energy technologies by investing
$385M in transportation electrification by 2025, positioning for long-term load growth.
2020
0.2% 2025
1.2% 2030
CAGR(1) CAGR(1)
In the near term, growth of EVs offsets load In the long-term, transportation electrification
loss from Distributed Generation and EE is forecasted to drive load growth
Electric Vehicles Today 2030 Electric Vehicle Goals
▪ 270 thousand EVs registered to PG&E customers ▪ 2 million EVs registered to PG&E customers to
▪ 1 of 5 EVs in the U.S. are in PG&E’s service area and meet California’s state goal of 5M EVs
11% of new vehicle sales are EVs
▪ Equivalent to the load of 1 million new homes
▪ 35% average annual growth in PG&E territory since
2015
▪ $1.70/gallon equivalent charging cost, compared to
$3.60/gallon of gasoline(2)
(1) System electric sales, based on PG&E’s 2019 Integrated Energy Policy Report (IEPR) filed with the California Energy Commission.
(2) California 2019 average price of regular gasoline, from U.S. Energy Information Administration.
See the Forward-Looking Statements for factors that could cause actual results to differ materially from the guidance provided and underlying assumptions. 26CLEAN ENERGY OPPORTUNITIES
Building Decarbonization and the Future of Natural Gas
In alignment with key stakeholders and in support of California’s zero-carbon objectives, PG&E is committed
to managing an equitable and viable transition to zero-carbon alternatives for electric and gas customers.
PG&E will:
Support Support state & Fund and implement Procure RNG and Continue exploring
decarbonization local government incentives and hydrogen to reduce new CNG end uses
while keeping policies and programs to support the carbon footprint to reduce emissions
energy promote all- electrification of gas from carbon-heavy
affordable electric new technologies industries like rail
construction and marine
In support of targeted decarbonization, PG&E will:
• Work with stakeholders to avoid investments in new gas assets that might prove underutilized while maintaining
system safety and reliability
• Encourage efficient electrification by seeking authorization to spend up to $500M over the next ten years to enable
building electrification
See the Forward-Looking Statements for factors that could cause actual results to differ materially from the guidance provided and underlying assumptions. 27Agenda
1 Recent Progress Enables Timely Emergence
2 Operational, Safety & Structural Improvements
3 Clean Energy Opportunities
4 Sustainable Financials
28SUSTAINABLE FINANCIALS
Attractive Ratebase Profile
Sustainable Future Upon Emergence Projected Ratebase Growth
~8%
Industry-leading growth from
investments in wildfire risk reduction,
and safety and reliability 6.5%
Disciplined focus on cost optimization
to balance ratebase growth and
affordable rates
Investment to support California’s PG&E PG&E
clean energy economy Historical Forecast
2014-2018 2019-2024
Ratebase profile is expected to support strong post-emergence earnings growth.
See the Forward-Looking Statements for factors that could cause actual results to differ materially from the guidance provided and underlying assumptions. 29SUSTAINABLE FINANCIALS
Substantial Capital Investments
Unprecedented level of system investments, accelerated wildfire risk reduction, and continued
execution of gas safety commitments drive substantial capital investments.
2019 Act. 2020 2019-2024
2021 CAPEX
2022FORECAST ($B)
2023 2024 Subject to Ongoing and
Future Recovery Requests
$7.3-$8.7
$7.6-$8.2 $7.4-$8.1
~$7.5 $7.2-$7.8 Spend driven by:
$7.0 ▪ Wildfire Mitigation Plan
Memorandum Account
(WMPMA)
▪ Catastrophic Event
Memorandum Account
(CEMA)
2019 Act. 2020 2021 2022 2023 2024
General Rate Case (GRC) and Gas Transmission & Storage (GT&S) (1) Transmission Owner (TO)
AB1054 Fire Risk Mitigation (2) Spend Above Authorized
(1) The 2023 GRC will include gas transmission and storage.
(2) Capex forecast includes ~$3.2B of fire risk mitigation capital expenditures included in the Utility’s approved wildfire mitigation plans on which PG&E Corporation and the Utility will not earn an equity return.
(3) Low end of the range reflects authorized capital expenditures, including the full amount recoverable through a balancing account where applicable. High end of the range includes capital spend above authorized.
See the Forward-Looking Statements for factors that could cause actual results to differ materially from the guidance provided and underlying assumptions. 30SUSTAINABLE FINANCIALS
2019-2022 Wildfire Mitigation Plan Investments
PG&E’s AB1054-mandated fire risk mitigation capital expenditures of ~$3.2B is anticipated
to be fully expended in 2022.
WILDFIRE MITIGATION INVESTMENTS ($B)
~$3.4
~$2.9
~$2.8
~$2.6
1.5
1.4
1.4
1.6
1.3 0.9
0.1 0.9
0.9 0.7
0.5 0.6
2019 2020 2021 2022
ACTUAL FORECAST FORECAST FORECAST
CapEx AB1054 CapEx OpEx
Note: The 2020 to 2022 wildfire mitigation forecast is as of December 2019 and is consistent with the 5-year forecast. The 2020-22 costs reflect program assumptions that were later updated in the 2020 Wildfire Mitigation
Plan filing on February 7, 2020, which forecasts ~$2.6B of annual spend. PG&E is tracking the capex subject to the AB 1054 exclusion in the Wildfire Mitigation Plan Memorandum Account and Wildfire Mitigation Balancing
Account. The AB 1054 excluded capex is dependent on the CPUC-approved amounts for PG&E’s WMP capital expenditures.
See the Forward-Looking Statements for factors that could cause actual results to differ materially from the guidance provided and underlying assumptions. 31SUSTAINABLE FINANCIALS
Ratebase Growth Forecast
WEIGHTED AVERAGE RATEBASE FORECAST
BY RATE CASE ($B) Potential Growth Opportunities
~8% CAGR
on equity earning ratebase 2019- 2024 (1, 2) ▪ Additional wildfire mitigation
$57-$60
$53-$55 ▪ Transportation electrification
$50-$51 (Phase II Light Duty)
$47-$48
~$44.5
$40.2 ▪ Additional distributed
generation-enabled
microgrids
▪ Grid modernization
2019 Act 2020 2021 2022 2023 2024
General Rate Case (GRC) (3) Gas Transmission & Storage (GT&S) (4)
Transmission Owner (TO) Spend Above Authorized
(1) Ratebase reflects reductions for the following capital items: (a) $240M disallowance by the CPUC in the 2019 GT&S rate case; (b) $3.2B of fire risk mitigation excluded from earning a ROE, pursuant to AB 1054; and (c)
$403M the Utility agreed not to seek recovery of as part of the Wildfire OII settlement.
(2) Ratebase growth including non-equity earnings ratebase is ~9%.
(3) The 2023 GRC will include gas transmission and storage and will move to a four year case cycle.
(4) Includes $400M for 2011-2014 spend subject to audit added in 2020.
See the Forward-Looking Statements for factors that could cause actual results to differ materially from the guidance provided and underlying assumptions. 32SUSTAINABLE FINANCIALS
2020 Earnings Overview and Assumptions
Substantial progress has been made but there remain a few critical uncertainties that affect earnings.
Shifting focus to non-GAAP core earnings and non-core earnings. Non-GAAP Core Earnings (1) in 2020 will be
impacted partial period of Chapter 11 case pendency, financing, and regulatory matters.
2020 Non-GAAP Core Earnings Assumptions Key Factors Affecting 2020 Non-GAAP Core
Earnings
($ billions) CapEx Ratebase Authorized CPUC ROE across the Enterprise 10.25%
2020 GRC Settlement $4.4 $30.5 Drivers of Variance from Authorized
- Net Below the Line and Spend Above
2019 GT&S Decision 0.7 5.4 150M-200M
Authorized
2019 TO Plan under Formula Rates 1.5 8.6 - Unrecovered Interest Expense (2) 150M-250M
AB1054 Spend 0.9 -
Key Factors Affecting Non-Core Earnings
Total ~$7.5 ~$44.5
- Chapter 11 Costs ~1B
Financing: $6B of OpCo debt refinanced with securitization - Wildfire Fund-Related Costs 484M
in 2021
- Investigation Remedies and Delayed
~110M
Cost Recovery (3)
+ GT&S Capital Audit ~(191M)
Key remaining uncertainties
(1) Beginning with the quarter and full year periods ended December 31, 2019, PG&E Corporation and the Utility changed the name of their principal non-GAAP earnings metric from "non-GAAP earnings from operations" to "non-
GAAP core earnings" in order to align more closely with the terminology used by their industry peers. Likewise, PG&E Corporation and the Utility will now refer to adjustments as "non-core items" rather than "items impacting
comparability".
(2) Unrecovered Interest Expense from $4.75B HoldCo and $6B Incremental OpCo Debt. Represents interest expense from second half of 2020. OpCo debt is temporary before take out from securitization.
(3) Includes OII penalties and cost recovery associated with Paradise rebuild.
See the Forward-Looking Statements for factors that could cause actual results to differ materially from the guidance provided and underlying assumptions. 33SUSTAINABLE FINANCIALS
2021-2024 Earnings Overview and Assumptions
Post emergence, factors impacting non-GAAP core earnings will reduce over time.
Key Factors Affecting Non-GAAP Core Earnings (1) (2)
2020 2021 2022 2023 2024
Authorized
10.25% across the Enterprise
CPUC ROE
Drivers of Net BTL and Spend Above AFUDC back to normal levels in 2021
Variance Authorized Overspend reduced significantly in 2021
from Decreases due to reduction in
Authorized Unrecovered Interest Expense
HoldCo leverage
Non-Core Ch. 11 Costs
Earnings
Factors Wildfire Fund-Related Costs Remains at $0.5B
Investigation Remedies and Delayed Cost
Recovery (3)
Securitization
$1.5 B in 2021
Impacts
GT&S Capital
Audit
(1) Beginning with the quarter and full year periods ended December 31, 2019, PG&E Corporation and the Utility changed the name of their principal non-GAAP earnings metric from "non-GAAP earnings from operations" to
"non-GAAP core earnings" in order to align more closely with the terminology used by their industry peers. Likewise, PG&E Corporation and the Utility will now refer to adjustments as "non-core items" rather than "items
impacting comparability".
(2) In its financial disclosure statement filed on February 18, 2020 with the bankruptcy court, the company also references adjustments to arrive at forecasted non-GAAP Normalized Estimated Net income for 2021.
(3) Includes OII penalties and cost recovery associated with Paradise rebuild.
See the Forward-Looking Statements for factors that could cause actual results to differ materially from the guidance provided and underlying assumptions. 34SUSTAINABLE FINANCIALS
Cost Savings Areas of Focus
Identified an average of $1B per year in operational costs through 2025. These savings will
moderate the expected increase on customer bills to support infrastructure investment.
Plan of Reorganization results in an additional $1B in net interest savings to customers.
Average Annual Savings of $1B through 2025
Process Real Estate &
Energy Costs
Redesign Other
• Work and resource • Monetization of • Surplus property
planning excess renewable disposition
energy
• Contract • Headquarters
management redesign
$4.9B $0.8B $0.8B
through 2025 through 2025 through 2025
2020 • CPUC approved EE 2020 plan with $56.5M forecasted savings
achievements • Realized $127.5M in excess renewables sales for 2020
Safety is PG&E’s highest responsibility. PG&E’s commitment to safety should never be compromised for cost reductions or other efficiencies.
See the Forward-Looking Statements for factors that could cause actual results to differ materially from the guidance provided and underlying assumptions. 35SUSTAINABLE FINANCIALS
AB1054 Wildfire Fund
California established Wildfire Fund to address timely compensation for victims and liquidity
needs for Investor-Owned Utilities (IOUs).
Total Funding and Participation Fund Mechanics
Upon Plan of Reorganization confirmation by Wildfire Fund claims paid by fund followed by CPUC review:
June 30, 2020, PG&E expects to be fully
Claims filed against IOU
eligible for participation.
IOU seeks payment from fund for eligible claims exceeding $1B,
WILDFIRE FUND FUNDING SOURCES ($B) request is reviewed by fund administrator before releasing funds
Additional Funding
over 10 Years 3.0 IOU Ongoing
Contribution IOU files cost recovery application at the CPUC
for claims above insurance (1)
DWR CPUC to evaluate if utility conduct was reasonable (2)
Surcharge $21B
10.5 Repays SMIF in Net
Loan Allowed costs Disallowed costs
Contributions
from IOUs and
Wildfire Fund is not IOU reimburses the Fund
Customers
reimbursed (subject to the cap)
Capitalization by PG&E Initial
June 2020 Contribution
4.8
~$10B
Shareholder Liability Cap
Current 0.3 SDG&E For utility caused fires deemed imprudent, the Fund is re-infused up
Capitalization 2.4 SCE
to the liability cap, currently estimated at ~$2.4B (calculated based on
$4.8B SMIF Loan
20% of PG&E Equity T&D ratebase for 2019). Applies to aggregate
2.0
reimbursements to the fund over a rolling three calendar year period.
(1) Amounts above insurance that are not covered by the wildfire fund could be recovered from customers if the utility conduct was deemed reasonable.
(2) Serious doubt standard applies as long as utility has received its safety certification for the year in which the fire occurred.
See the Forward-Looking Statements for factors that could cause actual results to differ materially from the guidance provided and underlying assumptions. 36Conclusion
Our five-year outlook is positioned for
significant growth and sustained
performance
We are positioned to emerge from
Chapter 11 and provide
safe, affordable, and
clean energy
to our customers for the long term
37Appendix
APPENDIX
                            Refresher: Revenue Sources and Standard Rate Cases

  Roughly two-thirds of PG&E’s revenues are associated with owning and operating gas, electric, and generation
  infrastructure. The remaining third are pass-through costs associated with commodity procurement.

       2019 Revenue Sources (1)                                                                                  PG&E’s Standard Rate Cases

                                                                                                                                                                                                                               Next Rate
                                                                                                                    Rate Case and                                                                 Time Period
                                                                                                                                                                                                                                 Case
                                                                               ~8%                                  Regulatory                                 Rate Case Cycle                     of Current
                                                                                                                                                                                                                               Effective
                         ~52%                                                   Gas Transmission
                                                                                & Storage
                                                                                                                    Jurisdiction                                                                   Rate Case
                                                                                                                                                                                                                                 Year
                      General Rate Case                                                                             General Rate Case
                                                                                                                    (GRC)                                        Every 4 years                     2020-2022                       2023
                                                                                ~10%                                CPUC
                                                                                 Electric

                                      ~30%                                       Transmission                       Gas Transmission &
                                                                                                                    Storage (GT&S) (2)                           Every 4 years                      2019-2022                      2023
                                       Pass-through
                                                                                                                    CPUC

                                                                                                                    Transmission Owner                                                                                         Rates are
                                                                                                                                                                  In effect until
                                                                                                                    (TO) Formula Rate (3)                                                               2019+                  updated
                        California Public Utilities Commission (CPUC)                                                                                               replaced
                                                                                                                    FERC                                                                                                       annually
                        Federal Energy Regulatory Commission (FERC)
                                                                                                                    Cost of Capital
                                                                                                                                                               Every 3 years (4)                   2020-2022                        TBD
                                                                                                                    CPUC

(1)   Operating revenue reflects accrued, authorized revenue and recorded pass-through expenses, assuming no balancing account under or over earning or catch-up.
(2)   Gas Transmission & Storage will be subsumed under the General Rate Case in the 2023 filing.
(3)   TO20 Formula rate became effective May 1, 2019 – December 31, 2019 (subject to refund pending settlement or litigation outcome). Thereafter, the Formula rate will be subject to the annual update filing process to be filed with
      FERC on December 1 of every year (on an informational basis) for the rates that will be effective on January 1 of the upcoming year. In addition to the rate update feature, the true-up component of the Formula rate ensures
      that PG&E will recover the actual cost incurred to provide service.
(4)   The Cost of Capital framework requires the utility to file an application every three years to establish a new Cost of Capital, primarily for the utility’s cost of debt, cost of preferred, cost of equity and capital structure. On April
      22, 2019, PG&E filed its 2020 Cost of Capital application and ultimately proposed a return on equity (ROE) of 12% after AB 1054 was enacted into law. The CPUC issued a final decision in December 2019 maintaining PG&E’s ROE
      at 10.25%, common equity percentage at 52%, and reduced the preferred stock percentage from 1.0% to 0.5%.
                                                                                                                                                                                                                                                    39
You can also read