Greater Wellington Road Safety Investigation 2008 - Transport Strategy Development
←
→
Page content transcription
If your browser does not render page correctly, please read the page content below
Attachment 1 to Report 09.169
                                                  Page 1 of 69

Greater Wellington Road Safety
Investigation 2008

Transport Strategy Development

Jacqueline Maass                                       TP/08/01/01
                                                       February 2009
Christine Walther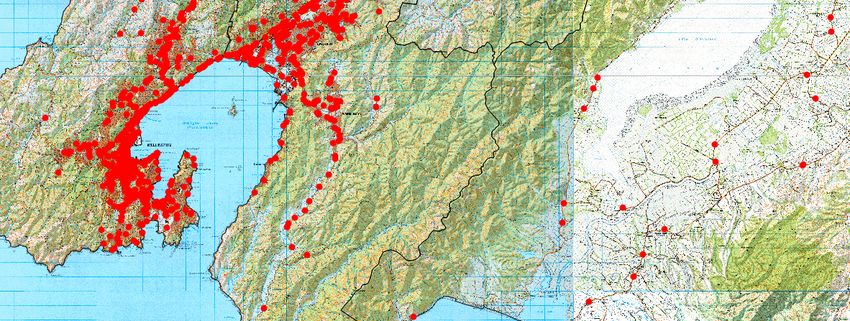
Attachment 1 to Report 09.169
                                                                                 Page 3 of 69

Contents
        Phase I                                                                            5

1       Introduction                                                                       5

2       Characteristics of the Study Area                                                  5
2.1     Roading Network                                                                    5
2.2     Population                                                                         7
2.3     Vehicle Accessibility                                                              7

3       Road Crashes                                                                       8
3.1     Social Cost                                                                        8
3.2     Crash Rates                                                                        9
3.3     Latest Trends                                                                     13
3.4     Crash Trend by Severity                                                           14
3.5     Crash Trends by Road Type                                                         17

4.      Road Users                                                                        20
4.1     Distribution                                                                      20
4.2     Vulnerable Road Users                                                             21

5.      Causal Factors                                                                    24

6.      Trends over 20 years                                                              25

7.      Conclusions                                                                       30

        Phase II                                                                          31

8       Road Crashes                                                                      31
8.1     Population and VKT                                                                31
8.2     Hospitalisation and CARD data                                                     33

9       Investigation of Dominant Issues and Road User Groups                             36
9.1     Focus on Alcohol and Speed                                                        36
9.2     Road Users                                                                        40
9.2.1   Cars                                                                              40
9.2.2   Children                                                                          45
9.2.3   Vulnerable Road Users                                                             46

10      Road Safety                                                                       52
10.1    Education                                                                         53
10.2    Enforcement                                                                       53
10.3    Vehicle Engineering                                                               56
10.4    Road Engineering                                                                  56

11      Structural Changes                                                                56
11.1    Systemic Changes over 20 years                                                    56
11.2    LTSA, LTNZ and NZTA                                                               59
11.3    NZ Police and Traffic Safety Service (TSS)                                        60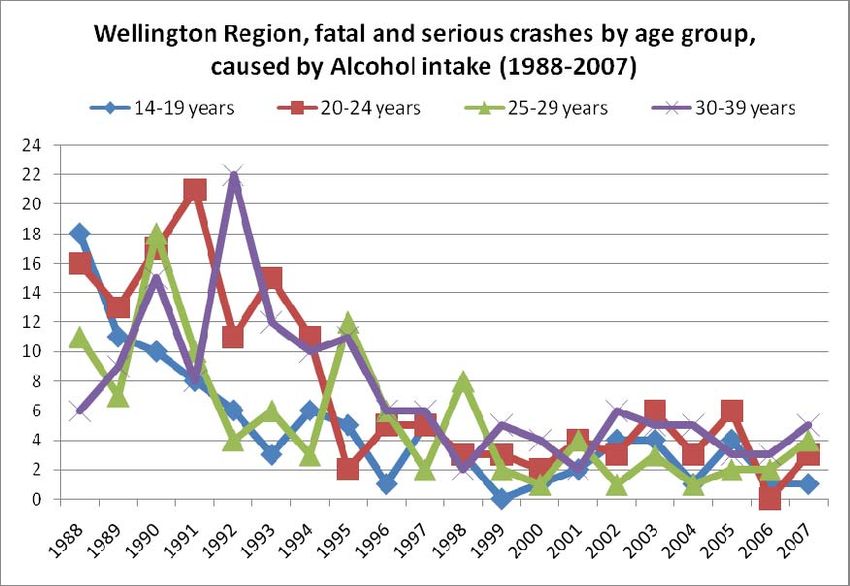
Attachment 1 to Report 09.169
                                                                                Page 4 of 69

12      Conclusions                                                                      60

13      Possible Approaches for the Future                                               61

Appendix                                                                                 64
A       The Data bases                                                                   64
I       Crash Analysis System (CAS)                                                      64
II      Hospitalisation Data                                                             64
III     Communications and Resource Deployment (CARD) system                             65
B       Table of Events                                                                  66
C       Police codes                                                                     69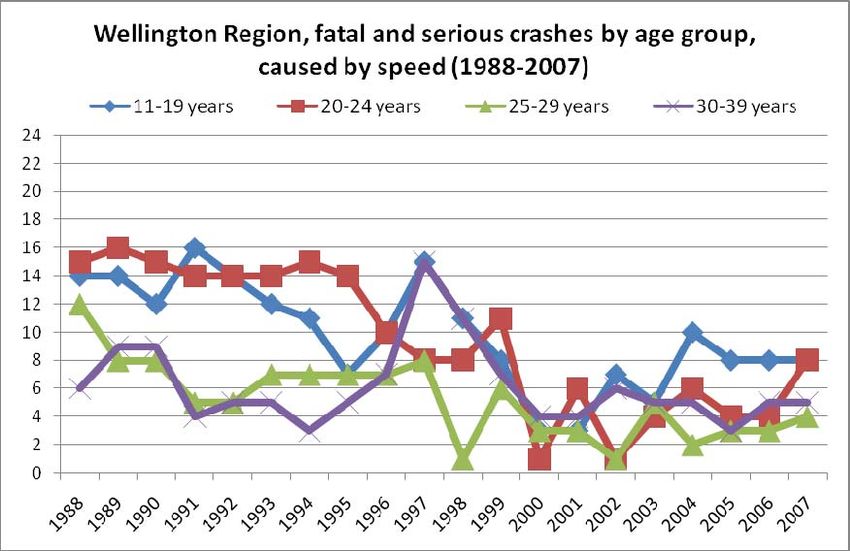
Attachment 1 to Report 09.169
                                                                                                         Page 5 of 69

                                                     Phase I

1              Introduction

The purpose of this project is to investigate crash rates in the greater Wellington region and to
determine in the first phase, if the numbers have been increasing over the last ten years. If that
should be the case, the causes are to be identified in phase two and areas for remedial action
are to be determined in phase three.

2              Characteristics of the Study Area

2.1            Roading Network

The greater Wellington Region has eight territorial authorities (TAs), which are listed in the table
below (see table 1).
                           Road Length in km                                      Injury Crashes 1998‐2007
                                                              5 years
      Local                                        Pop. In    Average
                     State     Urban     Rural                                                                Rate/

                                                                                   Serious

                                                                                              Minor
    Authorities                                     2007     VKT (2003‐   Fatal
                     high       local     local                                                       Total   1,000
                                                               2007)
                     ways      Roads     Roads                                                                Pop.

                                                  Wellington Region

Carterton District    15         27       406       7,300      32,876     19       50        125      194      27

Kapiti Coast
                      46         230      154     101,500     140,029     48      208        533      789      18
District

Hutt City             33         446       30      48,000     497,709     47      338        1,638    2,023    20

Masterton
                      30         112      685      23,100     122,322     21      107        482      610      26
District

Porirua City          97         194       43      50,700     188,173     26      189        686      901      18

South Wairarapa
                      45         54       560       9,140      44,290     18       82        175      275      30
District

Upper Hutt City       28         152       82      40,000     127,870     18      145        510      673      18

Wellington City       67         626       56     190,500     717,624     47      615        2,874    3,536    20

TOTAL                2,522      4,404    16,652   470,240    1,870,893    244     1,751      7,041    9,036    22

All New Zealand                                                                                                24
Table 1: Characteristics of the road networks in the greater Wellington Region

The largest network of roads belongs to the Masterton District with more than 680 km of local
rural roads followed by Wellington City with more than 600 km local urban roads. Between the
years of 1998 and 2007 the highest numbers of fatal injury crashes were counted in the Kapiti
Coast District with 48, followed by Wellington City and Hutt City with 47 fatal crashes each. The
injury crash rate per 1,000 population in the districts of Carterton, Masterton and South
Wairarapa are above the average crash rate of the region. Kapiti Coast, Porirua and Upper Hutt

WGN_DOCS‐#615309‐V1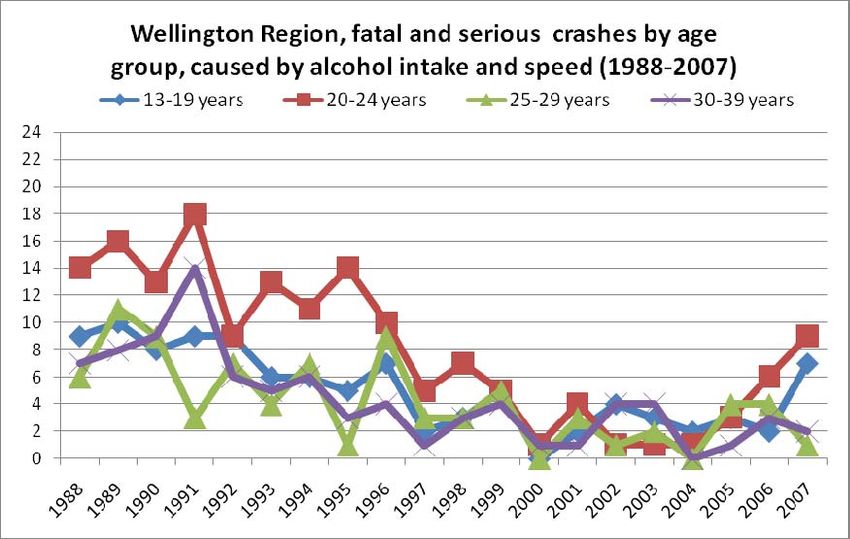
Attachment 1 to Report 09.169
                                                                                        Page 6 of 69

have the lowest crash rate per 1,000 inhabitants of 18. The Wellington Region average crash
rate per 1,000 Population of 22 is slightly below the national average of 24.
This report focuses on the injury crashes. Figure 1 shows the crash sites of fatal and serious
injuries for 2005‐2007 in the south west part of the Wellington Region. Most of these crashes
occurred along the state highways and the main traffic arteries as well as in the urban areas.

Figure1: All fatal and serious injury crashes in the Wellington Region 1998‐2007

WGN_DOCS‐#615309‐V1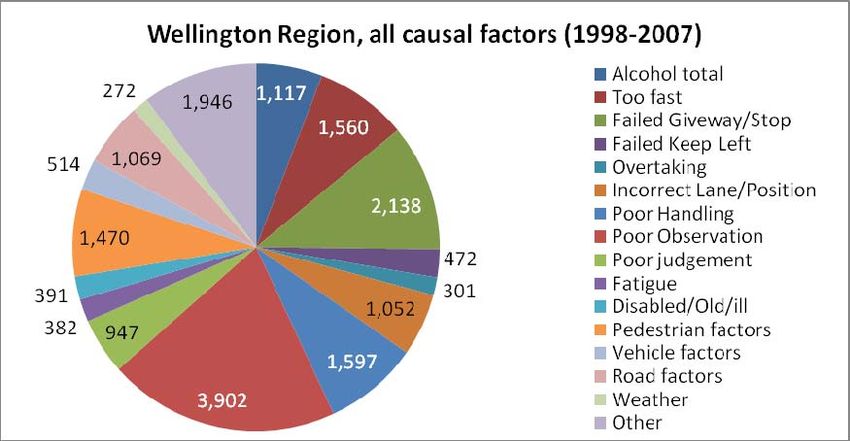
Attachment 1 to Report 09.169
                                                                                       Page 7 of 69

2.2      Population

Figure 2: Population of the Wellington Region 1998‐2007

The population in the region between 1998 and 2007 has been steadily increasing. There has
been a total increase of 8 per cent for the period. The population of the Wellington Region is
11% of the New Zealand total.

2.3      Vehicle Accessibility

New Zealand’s vehicle fleet composition shows an overall growth rate for the last few years (see
figure 3). In particularly the motor cycle fleet shows a significant increase over the last three
years, followed by an increasing number of buses.

Figure 3: Development of vehicle fleet composition in New Zealand relative to January 2000

WGN_DOCS‐#615309‐V1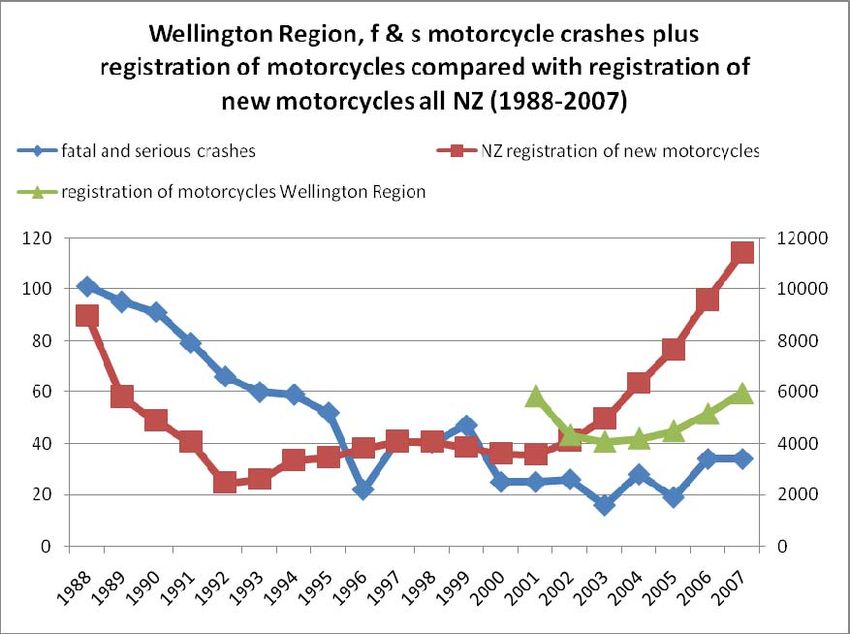
Attachment 1 to Report 09.169
                                                                                                                                   Page 8 of 69

The light fleet ownership has been increasing over the last seven years as well and matches the
trend with more than 50 vehicles plus per 1,000 Population between 2001 and 2007.

Figure 4: New Zealand light fleet ownership per 1,000 Population

3              Road Crashes

3.1            Social Cost

In 2007, the numbers of road crashes in the Wellington Region have resulted in social costs of
around $394 million.1 The figure below explains the distribution of the social cost for local urban
and open roads and for state highways each with open and urban roads as well as the different
injury‐severity. The highest number of social costs in 2007 resulted for the local urban roads in
the category of serious injury (see figure 5).

1 “The social cost of road crashes and injuries is a measure of the total cost of road crashes to the nation. It includes loss of life and life quality, loss

of productivity, medical, legal and court and property damage costs” (see definition of MoT: www.transport.govt.nz/socialcost/). The social cost is
based on industry standard values per reported crash for each year. In 2007 the social cost per crash for fatal crashes was: $3,881,000; for serious
$680,000; for minor injuries $83,000 and $2,300 for a non-injury crash

WGN_DOCS‐#615309‐V1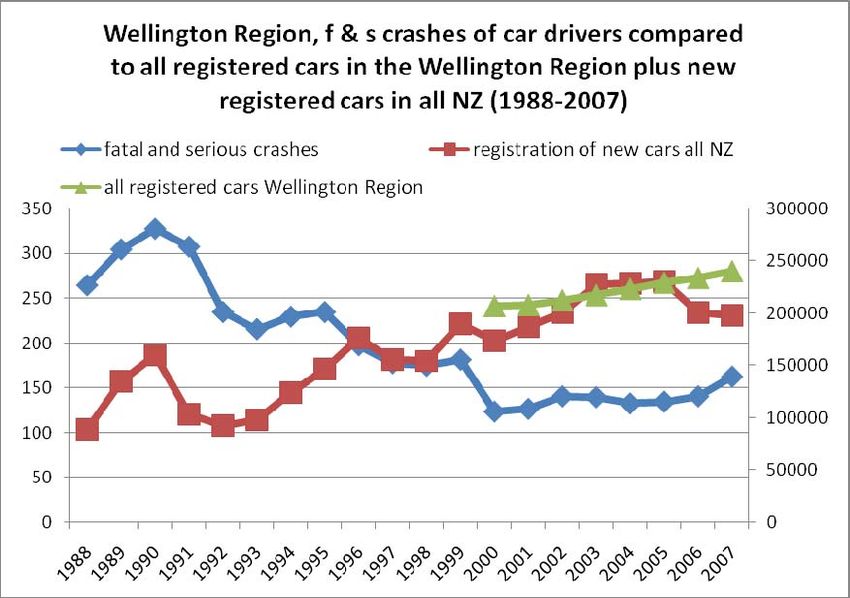
Attachment 1 to Report 09.169
                                                                                       Page 9 of 69

Figure 5: Social Costs in the Wellington Region in 2007 distributed for the different authorities
and injury severity

The social costs of crashes in New Zealand add up to $4,357.5 million, of which the greater
Wellington region accounts for 9%.

3.2 Crash Rates

To identify the crash trends for the region as a whole and for the individual TAs, an overall
picture is needed. Figure 6 shows that over the last four years the total crash numbers have
increased after several years of declining.

WGN_DOCS‐#615309‐V1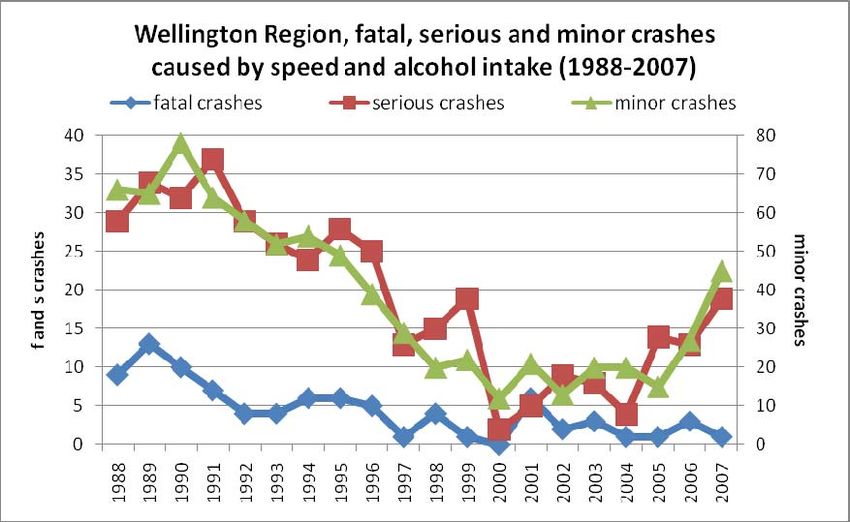
Attachment 1 to Report 09.169
                                                                                     Page 10 of 69

Figure 6: Total crash number of the Wellington Region 1988‐2007

When these numbers are divided into injury and non‐injury crashes (figure 7) the numbers of
non‐injury crashes have a faster growth rate during the last three years (2005‐2007) than the
correlating numbers of injury crashes in the region. Much of the increase in non‐injury crashes
seems to be attributed to an increase in reporting of such incidents, which needs further
investigation in Phase II.

Figure 7: Total number of injury and non‐injury crashes in the Wellington Region 1998‐2007

WGN_DOCS‐#615309‐V1
Attachment 1 to Report 09.169
Page 11 of 69
Figure 8: Serious and fatal crashes in the Wellington Region 1988‐2007
Figure 8 shows a significant rise in serious and fatal crashes since 2005, a trend consistent with
the overall increase in crashes shown throughout this report.
Wellington City dominates the overall crash trend for the region due to the sheer numbers. It is
therefore necessary to review the numbers accordingly for each district. Figure 9 shows that the
crash rate per 1,000 inhabitants has increased over the years with the exception of Hutt and
Upper Hutt Cities.
Figure 9: Crash rate per TA in the Wellington Region summed up for the periods of 1989‐2002
and 2003‐2007
Figure 10 points out the numbers of crashes per 1,000 vehicle kilometres travelled (VKT) on local
roads for each TA area. In four of the eight TAs, the crash rate increased.
WGN_DOCS‐#615309‐V1Attachment 1 to Report 09.169
Page 12 of 69
Figure 10: Crash rate per 1,000 VKT summed up for the periods of 1999‐2002 and 2003‐2006
*VKT for local roads only
To be able to see whether the upward trend in crash numbers is a temporary or a one‐off
occurrence, other related indicators are compared (see figure 11).
Figure 11: Related indicators in percentage change to the year 2000 for the Wellington Region
The basic indicators contrasted and indexed to the year 2000 show a common upward trend,
except for the VKT percentage growth between 2005 and 2006.
WGN_DOCS‐#615309‐V1Attachment 1 to Report 09.169
Page 13 of 69
In 2007 a strong increase for the total injury crashes and for the fatal/serious casualties is noted.
The increase in the hospitalisation numbers is similarly strong during the last years. The
population has been slightly but steadily increasing.
3.3 Latest Trends
For an impression of the latest trends, the numbers of the first six months of 2008 were
compared to the equivalent numbers for the previous two year’s data.
Figure 12: Cumulated injury crash numbers for 2006‐2008
The figure shows that in 2007 there were more injury crashes than in the previous year. The first
six months of 2008 are very similar to the numbers of 2007.
Figure 13/14: Cumulated injury crash numbers 2006‐2008 divided by severity (fatal (f), serious (s)
and minor(m))
WGN_DOCS‐#615309‐V1Attachment 1 to Report 09.169
Page 14 of 69
Figures 13 and 14 show, that the numbers of fatal and serious injury crashes for the first half of
2008 are aligned with those in 2006. This is a slight improvement compared to 2007. The minor
injury crashes resemble those in 2007 which maintains the upward trend.
3.4 Crash Trend by Severity
Figure 15: Total of injury crash numbers for 1998‐2007 for the Wellington Region
If the numbers of all injury crashes in the region are examined by severity, it is clear that the
number of minor crashes has steadily increased since 2001, with a strong rise in the last three
years. The serious injury crashes display a smaller increase and the fatal crashes are slightly
decreasing.
The distribution of total injury crashes by the individual TAs for the year 2007 is displayed in
figure 16.
WGN_DOCS‐#615309‐V1Attachment 1 to Report 09.169
Page 15 of 69
Figure 16: Injury crash numbers for the TAs in the year 2007
The most crashes occurred in Wellington City with 520 injury crashes, followed by Hutt City with
277. The TAs with less population have accordingly smaller numbers like Carterton District with
36 injury crashes for the year but altogether more per 1,000 population (see table 1). For a
better picture on that point, the numbers for each TA are shown below.
Figure 17/18: Injury crash numbers for Wellington City and Porirua City between 1998 and 2007
It is noticeable that Porirua City has a strong increase of minor injury crashes over the last five
years. The fatal and serious ones are decreasing since 2005.
WGN_DOCS‐#615309‐V1Attachment 1 to Report 09.169
Page 16 of 69
Figure 19/20: Injury crash numbers for Kapiti Coast District and Hutt City between 1998 and
2007
In the Kapiti District the numbers of minor and serious injury crashes are diverging since 2005.
The minor ones increased as well as in Hutt City where the numbers in that category nearly
doubled over the last two years.
Figure 21/22: Injury crash numbers for Upper Hutt City and South Wairarapa District between
1998 and 2007
Where Upper Hutt City shows similarity in the numbers to the Kapiti Coast District, South
Wairarapa displays a more up‐and‐down trend of minor injuries over the last five years.
WGN_DOCS‐#615309‐V1Attachment 1 to Report 09.169
Page 17 of 69
Figure 23/24: Injury crash numbers for Kapiti Coast and Masterton District between 1998 and
2007
Carterton has a small number of injury crashes overall but between 2006 and 2007 an increase
in the serious and minor category is visible. Masterton shows as the only district a downward
trend in the minor injury crashes for 2007.
3.5 Crash Trends by Road Type
After displaying the numbers for the total injury crashes in the region and the individual TAs,
relating them to the numbers of inhabitants and reviewing the latest trends for each severity
category it is also of interest where the crashes happen. Therefore the next part focuses on the
different categories of roads.
Figure 25: Total injury crashes in the Wellington Region by road type for 2007
WGN_DOCS‐#615309‐V1Attachment 1 to Report 09.169
Page 18 of 69
Most crashes happen on local urban roads which accounts for 63% of the total injury crashes.
Considering only the state highways, most accidents happen on the open state highway roads
which account for 18% (see figure 25 and 26).
Figure 26: Total injury crashes in the Wellington Region by road type between 1998 and 2007
Over the last ten years the local urban roads show an increase of injury crash numbers since
2003. The urban state highways have a slight increase as well over the last three years whereas
the numbers of the open state highways and the open local roads almost remained static.
Figure 27/28: Injury crash numbers by road type for Wellington and Porirua City between 1998
and 2007
WGN_DOCS‐#615309‐V1Attachment 1 to Report 09.169
Page 19 of 69
Over the last five years Wellington City displays a strong rise in the injury crash numbers on local
urban roads, which matches the trend in Porirua City and the last two years of Hutt City. Kapiti
Coast District shows an upward trend for urban local roads. The crash numbers for its open state
highways decreased between 2006 and 2007.
Figure 29/30: Injury crash numbers by road type for Kapiti Coast District and Hutt City between
1998 and 2007
Upper Hutt City shows a strong rise in the injury crash numbers for open state highways which
are, by 2007, almost as high as the numbers for local urban roads where most injury crashes
happen.
Figure 31/32: Injury crash numbers by road type for Upper Hutt City and South Wairarpa District
between 1998 and 2007
The overall small numbers of injury crashes in South Wairarapa show an increase of crashes on
open state highways, which in 2007 account for the main injury crash sites.
Masterton and Carterton District have small numbers of injury crashes too. Notable is an overall
decreasing trend for injury crashes in Masterton on all road types except for local urban roads.
WGN_DOCS‐#615309‐V1Attachment 1 to Report 09.169
Page 20 of 69
Figure 33/34: Injury crash numbers by road type for Carterton and Masterton District between
1998 and 2007
4. Road Users
4.1 Distribution
The following figure displays the number of injured road users in percent for 2007 for the
Wellington Region.
Figure 35: Injured road users in % for the Wellington Region in 2007
Car and Taxi occupants dominate the numbers of a proportion of injured road users, followed by
an almost even distribution of ‘Motor Cycle/Moped’, ‘Pedestrian’, ‘Cyclists’ and ‘SUV/VAN’ with
about 10% each. The closer examination of the serious and fatal crashes shows a greater
percentage of ‘Motorcycle/Moped’ as well as ‘Others’. Therefore the proportions of ‘Car/Taxi’,
‘SUV/VAN’ and ‘Truck’ are accordingly smaller.
WGN_DOCS‐#615309‐V1Attachment 1 to Report 09.169
Page 21 of 69
The number of casualties (=number of all injured people involved in one single crash) over the
period of 2003‐2007 for all New Zealand shows that Motor Cyclists have the highest number of
injuries by time spent travelling (figure 36).
Figure 36: Casualties per million hours for all New Zealand (2003‐2007)
Figure 37 shows that the Wellington region compared to all New Zealand, has a much higher
number of injured cyclists per million km. The numbers for injured vehicle occupants and
pedestrians in the Wellington Region are smaller.
Figure 37: Casualties per 100 million km for all New Zealand and the Wellington Region (2003‐
2007)
4.2 Vulnerable Road Users
WGN_DOCS‐#615309‐V1Attachment 1 to Report 09.169
Page 22 of 69
The injury crash numbers of vulnerable road users have increased over the last few years (see
figure 38).
Figure 38: Injured vulnerable road users in % for the Wellington Region between 1998 and 2007
Only the number of injured pedestrians has decreased slightly between 2006 and 2007. The
numbers of injured Cyclists, Motor Cyclists/Moped drivers has increased sharply since 2003.
How the trend is backed by the different TAs is shown in the figures below.
Figure 39/40: Injury crash numbers by road type for Wellington and Porirua City between 1998
and 2007
The Porirua, Carterton and South Wairarapa figures show the numbers of pedestrian injury
crashes decreasing.
WGN_DOCS‐#615309‐V1Attachment 1 to Report 09.169
Page 23 of 69
Figure 41/42: Injury crash numbers by road type for Kapiti Coast District and Hutt City between
1998 and 2007
Figure 43/44: Injury crash numbers by road type for Upper Hutt City and South Wairarapa
District between 1998 and 2007
Though the numbers of Motor Cycles/Mopeds involved in injury crashes are quite small, they
increased rapidly in Masterton and Carterton District compared to the other groups of
vulnerable road users in these areas. In South Wairarapa the number of Motor Cyclist injury
crashes had a very strong increase in 2004 and remained since then on a higher level.
WGN_DOCS‐#615309‐V1Attachment 1 to Report 09.169
Page 24 of 69
Figure 45/46: Injury crash numbers by road type for Carterton and Masterton District between
1998 and 2007
While most numbers are too small to be of statistical significance, they should not be neglected
in the second phase when the reasons for the increasing injury crash numbers are to be
examined.
5. Causal Factors
An important part of examining the injury crashes are the causal factors.
Figure 47: The various crash factors for the Wellington Region for all injury crashes 1998‐2007
There are usually many factors that contribute to a single injury crash. The numbers therefore
do not display the main factor causing the crash but all the factors which led to the crash
according to the police report.
WGN_DOCS‐#615309‐V1Attachment 1 to Report 09.169
Page 25 of 69
When summed up into four categories of causal factors, human/driver factors2 are the most
significant cause of crashes (see figure 48).
Figure 48: The various crash factors grouped into 4 main categories for the Wellington Region for
all injury crashes 1998‐2007
6. Trends over 20 years
If the numbers in the region for the decade of 1988‐1997 are compared to the ones covering the
next ten years and the same numbers for all New Zealand in the latter period, it is clear that the
causal factor distribution remains steady overall.
Figure 49: Combined causal factors for the Wellington Region 1988‐2007 and all New Zealand
1998‐2007
2 In the ‘Human/Driver’ causal factor are the ten numbers of causal factors merged which range from ‘too fast‘, ‘Failed to give way/stop‘ to
‘Disabled/old/ill’ (see figure 46).
WGN_DOCS‐#615309‐V1Attachment 1 to Report 09.169
Page 26 of 69
When the numbers for the latest period for the region are divided into local roads and state
highways, the local roads show the highest percentage numbers for all four categories. This is
not surprising due to the fact that most crashes occur on that type of road. There is not a
significant difference between the proportion of the causal factors for local roads and state
highways.
Figure 50/51: The four main categories of causal factors for the Wellington Region 1998‐2007 by
road authorities
WGN_DOCS‐#615309‐V1Attachment 1 to Report 09.169
Page 27 of 69
The comparison of the Police Crash List Report over the decades 1988‐1997 and 1998‐2007,
relating to the Driver/Vehicle factors, shows that the percentage of the causal factors has
changed comparably in few of the listed factors (see figure 52 and 53). Notable exceptions are
“alcohol”, which has fallen from 18% to 12%, and “poor observation” which has increased from
31% to 38%. The other crash factors show a quite constant number over the last two decades.
Figure 52: Police Crash List Report 1988‐1997
Figure 53: Police Crash List Report 1998‐2007
WGN_DOCS‐#615309‐V1Attachment 1 to Report 09.169
Page 28 of 69
It is pleasing to note that total crash numbers decreased by 31%, deaths and serious injuries fell
by 27% and 40% between 1988/97 and 1998/07. The total number of crashes at intersection
decreased by about 3,000 and accounts therefore for almost the complete drop in crash
numbers in those ten years compared to the previous decade.
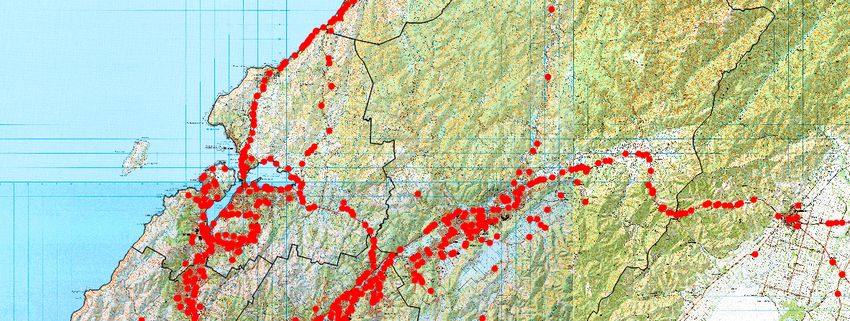
With the focus on the fatal and serious injury crashes between 2005 and 2007 (see figure 54) it
is notable that the crashes occour in a similar pattern like the plotted crashes for the whole
decade (see figure 1).
Figure 54: All fatal and serious injury crashes in the Wellington Region 2005‐2007
The Police Crash List Report for those three years is compared with the one for the period of
2002‐2004 to detect changes that might be characteristic for the last three years, pointing out
facts that might relate to the rising crash numbers.
WGN_DOCS‐#615309‐V1Attachment 1 to Report 09.169
Page 29 of 69
Figure 55: Police Crash List Report 2002‐2004
Figure 56: Police Crash List Report 2005‐2007
The injury crash Driver/Vehicle factors between 2005 and 2007 show a shift in the percentages
which ranges, compared to the period of 2002 and 2004, between ‐2% and +2%. The factors that
increased by two percent are i.e. ‘Too fast’, ‘Poor handling’ and ‘Poor observation’. The Crash
type shows an increase during those periods of about 2,000 crashes in the MidBlock Type and
about 1,000 crashes for the intersections. Those approximately 3,000 crashes account for the
overall rise in the last period.
WGN_DOCS‐#615309‐V1Attachment 1 to Report 09.169
Page 30 of 69
When the Crash Movement categories are compared, the major shift is noted for ‘Rear
End/Obstruction’ which increased by 5%. Second is ‘Crossing/Turning’ which decreased by 3%
followed by ‘Bend‐Lost Control/Head On’ with 2% decrease.
7. Conclusions
So far the increasing crash numbers appear to be genuine and not just a result of an increase in
the reported police data. The abrupt rise in the injury crash numbers is mainly caused by the
minor‐injury crashes. Furthermore, the current injury crash numbers of the first half of 2008
follow the trend of the last two years. That suggests the numbers for the whole year 2008 are
likely to be very high again.
Most of the injury crashes happen on local urban roads (63%), which vary by the different
districts and their share in the specific types of roads.
Human/drivers factors are the most common causal factors attributed to the reported crashes,
which include the most dominant ones ‘Poor observation’, ‘Failed to give way/stop’, ‘Too fast’
and ‘Poor handling’.
Overall, the general pattern of causal factors and crash types has remained fairly constant over
the last 20 years suggesting that a fresh approach to improving safety is necessary if significant
improvements are to be gained.
The focus in phase two will be on further comparisons of the last two decades. A time line will
be developed to examine what part, if any, systemic changes have played in contributing to the
current upward crash trend.
WGN_DOCS‐#615309‐V1Attachment 1 to Report 09.169
Page 31 of 69
Phase II
Phase II of the investigation looks at the crash numbers in more detail particularly with a focus
on fatal (f) and serious (s) injury crash/casualty numbers of the whole region. Information is
presented about organisational changes in the different agencies over 20 years.
The small numbers in some TAs do not allow robust statistical analysis, therefore the emphasis
is on the whole Wellington Region rather than on the different TAs.
8 Road Crashes
8.1 Population and VKT
The contrast of the fatal and serious (f & s) injury crash numbers with the population over the
last 10 years shows, that the inhabitants of the Wellington Region are steadily increasing,
whereas the f and s crashes decrease until 2000 and start increasing again thereafter (see figure
57). The percentage growth clearly shows that the increase of the f and s crash numbers in the
recent years was much higher than the rise of the population.
Figure 57: Wellington Region, fatal and serious injury crash numbers compared to the population
growth (1998‐2007)
WGN_DOCS‐#615309‐V1Attachment 1 to Report 09.169
Page 32 of 69
The Vehicle Kilometres Travelled (VKT) in m km show a different development over the last
seven years. Since 2005 the VKT numbers were going down, whereas the fatal and serious crash
numbers are steadily increasing (see figure 58). People might therefore drive shorter distances
than in the previous years and/or rely on public transport services more often. The petrol prices
displayed a strong upward trend during the last years, which might relate to the decrease in VKT
as well (see figure 59).
Figure 58: Wellington Region, fatal and serious injury crash numbers compared to the VKT3 in m
km (2001‐2007)
Figure 59: Octane Petrol prices over the years related to the CPI in New Zealand (1981‐2006)
(source: statistics online)
3
VKT numbers for Local Roads and State Highways in the Wellington Region
WGN_DOCS‐#615309‐V1Attachment 1 to Report 09.169
Page 33 of 69
8.2 Hospitalisation and CARD data
The next figure shows the f and s casualties and the hospitalisation numbers for the deaths and
discharges after >1 and >3 days. It is notable that both curves are quite similarly in curvature for
the last 10 years (see figure 60).
Figure 60: Wellington Region, fatal and serious casualties compared to the hospitalisations > 1
and >3 days (1998‐2007)
Hospital records confirm the trend displayed by the f and s injury casualties. Those casualties
account for approximately 70 % of the hospitalisation data. Figure 5 shows the split of deaths
and discharges in the Wellington Region for >1 day and >3 days. The graph supports the
conclusion of the phase I report there is a real increase in numbers of reported crashes since
2004.
WGN_DOCS‐#615309‐V1Attachment 1 to Report 09.169
Page 34 of 69
Figure 61: Wellington Region, deaths plus discharges, hospitalisation data (1999‐2007)
When the numbers are related to the reported crashes by the New Zealand Police
Communications and Resource Deployment (CARD) system and the Crash Analysis (CAS) system,
some more differences can be observed (see figures 61, 62 and 63).
The reported crashes of the CARD system in 2003 are significantly higher than the corresponding
CAS data in the year 2003. The number of crashes reported to CAS was much smaller than the
number of crashes reported by CARD or by the hospitals. The glitch is caused by the reporting
rate of filed Traffic Crash Reports (TCRs) entered into CAS which was comparatively lower in that
particular year.
Nonetheless an increase of incidents can be found in all three data bases between 2005 and
2007.
Between 2005 and 2006 about 500 more vehicle incidents were reported by the police. This
accounts for a rise in the total number of crashes, especially for those cases where a TCR was
written. The number of K6 and K9 (reported cases in CARD which require a TCR) increased
between 2006 and 2007, whereas K1 and K34 at the same time show a decrease. The overall
number of reports in both years remains quite steady on a high level. That shift is explained by
the Police having been urged during 2006 to increase their overall reporting rate on TCRs which
get into the CAS data base. Since CAS reports do not result from the categories K1 and K3, the
shift to more K6 cases is explained. The steep increase in the CAS data in minor and non‐injury
crashes is caused by the increased reporting rate of the police. Severe crashes like fatal and
serious ones have been reported previously to a good extent.
4
See appendix C for priority numbers and code explanation
WGN_DOCS‐#615309‐V1Attachment 1 to Report 09.169
Page 35 of 69
Figure 62: Wellington Region, police reported crashes in the CAS system (1999‐2007)
Figure 63: Wellington Region, police reported crashes in the CARD system (1999‐2007)5
Overall, this further examination of recent f and s data confirms the increase in crashes is real
and not explained by a change in reporting rates.
5 See appendix C for priority numbers and code explanation
WGN_DOCS‐#615309‐V1Attachment 1 to Report 09.169
Page 36 of 69
9 Investigation of Dominant Issues and Road User Groups
This chapter focuses on the present main target areas concerning road safety (alcohol and
speed) and on the different types of road users.
9.1 Focus on Alcohol and Speed
For several years the focus of police enforcement has been on speed and alcohol. The following
figures show:
• crashes caused by alcohol intake (figure 64),
• crashes caused by speed (figure 65)
• crashes caused by speed and alcohol intake (figure 66).
Figure 64: Wellington Region, alcohol involved in injury crashes by severity (1988‐2007)
Figure 64 shows the trend of minor injury crashes resembles the one of the serious crashes until
the year 2003. Since 2005 minor injury crashes have increased markedly. The numbers of
crashes caused by alcohol intake have reduced significantly but have reached a plateau for much
of the past decade.
WGN_DOCS‐#615309‐V1Attachment 1 to Report 09.169
Page 37 of 69
Figure 65: Wellington Region, speed involved in injury crashes by severity (1988‐2007)
The f and s crashes caused by speed show a lesser decrease since 1988 compared to crashes
involving alcohol. Again, minor and serious crashes went up over the last five years.
Figure 66: Wellington Region, speed and alcohol involved in injury crashes by severity (1988‐
2007)
WGN_DOCS‐#615309‐V1Attachment 1 to Report 09.169
Page 38 of 69
The number of crashes related to speed and alcohol intake is relatively low over the years in
general, but shows a strong increase over the last five years, similar to the serious and minor
crashes related to only one of the causal factors.
The following figures show the fatal and serious crashes over the years, which were related to
alcohol and/or speed by age group for the drivers under the age of 40 years (see figure 67, 68
and 69).
Figure 67: Wellington Region, alcohol involved in fatal and serious crashes by age group (1988‐
2007)
Between 1988 and the end of the 1990s, a huge decrease is visible in every age group
concerning the crashes related to alcohol influence. During these years younger drivers had
more fatal and serious crashes than the age groups over 40 years in age. But for the last ten
years the number of crashes related to alcohol was relatively steady on a lower level. This
coincides with the tough advertising introduced from 1995. The actions taken to lower the
numbers of crashes related to alcohol and intoxicated drivers were effective.
Of the injury crashes related to ‘Speed’, younger people dominate the trend before and after
1995 when the speed cameras were introduced. The number of total f and s injury crashes in
this category dropped. However, there is an increase of f and s injury crashes of people between
20 and 25 years of age over the last five years.
WGN_DOCS‐#615309‐V1Attachment 1 to Report 09.169
Page 39 of 69
Figure 68: Wellington Region, speed involved in fatal and serious crashes by age group (1988‐
2007)
Figure 69: Wellington Region, alcohol and speed involved in fatal and serious crashes by age
group (1988‐2007)
WGN_DOCS‐#615309‐V1Attachment 1 to Report 09.169
Page 40 of 69
There is a notable increase in the last four years of drivers between the age of 13 and 25 for
fatal and serious crashes related to ‘Alcohol’ and ‘Speed’.
9.2 Road Users
This section takes a closer look at the f and s injury crashes by road user. The trend of the total
serious and fatal crash numbers is dominated by car drivers.
9.2.1 Cars
The 20 year curve is quite similar to the one of the total injury crashes (see figure 70).
Figure 70: Wellington Region, fatal and serious crashes of car drivers (1988‐2007)
The next figure shows the registration of new cars per year for all New Zealand as well as the
total number of registered cars in the whole Wellington Region, combined with the f and s injury
crashes (see figure 71).
WGN_DOCS‐#615309‐V1Attachment 1 to Report 09.169
Page 41 of 69
Figure 71: f and s injury car crashes and numbers of all registered cars in the Wellington Region
compared to the registration of new cars in all New Zealand (1988‐2007)
Over the last 10 years the number of registered cars in NZ has grown steadily. In 2007 there
were approximately 40,000 new cars more registered compared to the year 2000. It is notable
that the growth of new registered cars is steadier than the increase of fatal and serious injury
crashes concerning car drivers, especially in the last two years. In the Wellington Region the
total number of registered cars shows a steady increase especially in the last two years whereas
the number of new car registrations in all NZ declined.
Other factors that influence the annual crash statistics include the increased enforcement since
1995 and improved vehicle standards and engineering achievements, which make vehicles and
roads safer. The latter, no doubt, also contribute to the reduced severity of crashes. The safety
features of a vehicle largely depend on its age as well as the engine size and therefore the power
of the vehicle. Figure 72 shows the mean age of cars in New Zealand, which has been steadily
increasing.
WGN_DOCS‐#615309‐V1Attachment 1 to Report 09.169
Page 42 of 69
Figure 72: Mean age in years of the cars in New Zealand (1999‐2007)
The mean age has risen over the last years. The average age of a car in NZ is 12.29 years which is
comparatively high and increases the probability of fatal and serious crashes due to inferior
safety equipment. The average age of a car in the USA and Germany in 2005 was less than 8
years and in the EU15 States an average of 8.8 years. Many vehicle engineering improvements
have been made for vehicles during the last 20 years, but the adoption of this safer technology
is relatively slow.
Since the fatal and serious injury crashes for cars have risen since the year 2000, the next figures
focus on the time frame between 2000 and 2007.
The main causal factors for fatal and serious crashes with cars are shown in the figure below
(see figure 73). The most important factor to mention is ‘Poor observation’. This indicator rose
significantly between 2006 and 2007, as well as ‘Failed give way/Stop’ and ‘Too fast’. The factors
‘Alcohol’ and ‘Poor handling’ decreased, but are still on a higher level.
WGN_DOCS‐#615309‐V1Attachment 1 to Report 09.169
Page 43 of 69
Figure73: Wellington Region, some selected causal factors for f and s injury car crashes (2000‐
2007)
The following figure shows the car drivers by age group and sex. It is interesting to note, that
male drivers are generally more likely to be involved in f and s crashes, especially at a younger
age, whereas female drivers are more represented in the older age groups (see figure 74).
Figure 74: Wellington Region, f and s injury crashes by car drivers, age group and sex (sum 2000‐
2007)
WGN_DOCS‐#615309‐V1Attachment 1 to Report 09.169
Page 44 of 69
The next three figures focus on alcohol and speed and show differences by age group or/and sex
(see figure 75, 76 and 77).
Figure 75: Wellington Region, alcohol related f and s injury car crashes by age group and sex
(sum 2000‐2007)
Alcohol and speed separately play a role for car drivers of both sexes involved in injury crashes.
Interesting to note is the fact that fatal and serious crashes caused either by alcohol or speed,
were more numerous among older women than older men. Also the fact, that female drivers
involved in f and s injury crashes rarely combined the two factors alcohol and speed – in
contrast to the younger men having a fatal or serious injury crash. For male drivers ‘Speed’ is
often a cause for fatal and serious car crashes.
Figure 76: Wellington Region, alcohol and speed related f and s injury car crashes by age group
and sex (sum 2000‐2007)
WGN_DOCS‐#615309‐V1Attachment 1 to Report 09.169
Page 45 of 69
Figure 77: Wellington Region, speed related f and s car injury crashes by age group and sex (sum
2000‐2007)
9.2.2 Children
In the years 1994 and 1995 the government made the child restraints for 0‐2 and 3‐5 year olds
mandatory. Fatal and serious crashes, where young children were involved, show a downward
trend since the year 1994 (see figure 78).
Figure 78: Wellington Region, f and s injury crashes with children between 0 and 5 years old
involved (1988‐2007)
WGN_DOCS‐#615309‐V1Attachment 1 to Report 09.169
Page 46 of 69
9.2.3 Vulnerable Road Users
Fatal and serious crashes for vulnerable road users are examined in this section. There is a
tendency for single vehicle motorcycle incidents not to be reported or reported as non injury
when they may involve minor injury. This is also true for cyclist and pedestrian incidents where
minor injury is involved and the parties go their separate ways.
Motorcyclists
The number of severely injured motorcyclists in crashes decreased continually between 1988
and 1996 but increased again in 1997, alternating on a lower level with a stagnation between
2006 and 2007 (see figure 79).
Figure 79: Wellington Region, f and s injury motorcyclist crashes (1988‐2007)
In the following figure the motorcyclist f and s injury crash numbers are compared with the
registration of new motorcycles (see figure 80). There is a huge increase (approx. nearly 50%) in
the registration numbers in the Wellington Region since 2003. The increase of fatal and serious
injury crashes has risen by a similar proportion.
WGN_DOCS‐#615309‐V1Attachment 1 to Report 09.169
Page 47 of 69
Figure 80: f and s motorcyclist injury crashes and registration of motorcycles in the Wellington
Region compared with the registration of new motorcycles in all New Zealand (1988‐2007)
The number of registered motorcycles in the Wellington Region rose steadily since 2003. It
follows the general trend for all NZ.
It is not surprising that most of the severe motorcycle crashes happen during the weekends on
local, urban roads since the Motorbikes are commonly used as a recreational vehicle (see figure
81 and 82).
WGN_DOCS‐#615309‐V1Attachment 1 to Report 09.169
Page 48 of 69
Figure 81: Wellington Region, f and s motorcyclist injury crashes by weekday (sum 2003‐2007)
Figure 82: Wellington Region, f and s motorcyclist injury crashes by road type (sum 2003‐2007)
WGN_DOCS‐#615309‐V1Attachment 1 to Report 09.169
Page 49 of 69
Figure 83: Wellington Region, f and s injury motorcycle crashes by age group (sum 2003‐2007)
Between 2003 and 2007 the most fatal and serious motorcycle crashes occurred within the age
group of 20‐24 years and the 40‐44 year old motorcyclists (see figure 83).
Cyclists
In the last two years the number of cyclists has grown while cycling was promoted for the
Wellington Region and especially for Wellington City. Over the last six years cyclist crashes show
a strong increase and displays the highest rise in comparison to the other vulnerable road users.
The fatal and serious crashes rose over this period from 10 to over 35 (see figure 84). In January
1994 the government established the compulsory cycle helmet wearing, but the effect of this
law on the severe injury crash numbers cannot be identified.
WGN_DOCS‐#615309‐V1Attachment 1 to Report 09.169
Page 50 of 69
Figure 84: Wellington Region, fatal and serious injury cycle crashes (1988‐2007)
Figure 85: Wellington Region, f and s injury cycle crashes by movement category (sum 2002‐
2007)
WGN_DOCS‐#615309‐V1Attachment 1 to Report 09.169
Page 51 of 69
The more in‐depth investigation of the period between 2002 and 2007 shows, that most crashes
with cycles fall into the movement category ‘Crossing and turning’, followed by ‘Rear
end/Obstruction’ (see figure 85), and the main causal factors are ‘Failed to give way/Stop’ and
‘Poor observation’. In 2/3 of the accidents, the car driver is at fault (see Regional Cycling
Strategy 2004).
Pedestrians
Fatal and serious pedestrian injury crashes occur mainly in urban areas. The pattern alternates
over the last 20 years with a slight downward trend (see figure 86).
Figure 86: Wellington Region, fatal and serious injury crashes with pedestrians (1988‐2007)
Nearly all of these crashes are caused by a collision with a vehicle, but the crash trend is
influenced by the behaviour of the people. For example many people go out for celebrating in
pubs or restaurants after work or on the weekend. That is why a lot of fatal and serious crashes
with pedestrians occur between Thursdays and Saturdays, with a peak on Fridays (see figure 87).
Alcohol is involved in a lot of crashes occurring on the weekends. Not only concerning injury
crashes with pedestrians but in general. The numbers of intoxicated pedestrians involved in
injury crashes is not exact, because when the driver is positively tested for alcohol, the test for
the other party may sometimes be omitted.
WGN_DOCS‐#615309‐V1Attachment 1 to Report 09.169
Page 52 of 69
Figure 87: Wellington Region, f and s injury crashes with pedestrian by weekday (sum 1988‐
2007)
Figure 88 shows that a higher number of those crashes happen mid block. On the other hand
the crashes at intersections have been increasing since 2003.
Figure 88: Wellington Region, f and s injury crashes by movement category ‘pedestrian vs.
vehicle’ on intersections or mid block (1988‐2007)
10 Road Safety
WGN_DOCS‐#615309‐V1Attachment 1 to Report 09.169
Page 53 of 69
10.1 Education
Over the years since 1995 there have been several advertising campaigns as well as a budget for
each year to spend on road safety. In the different Territorial Authorities (TAs), road safety
campaigns were held in schools, targeting children of different age groups, training for
Motorcyclists and various campaigns throughout the nation, targeting driver behaviour and
raising awareness for certain crash causal factors. In 2006 the drivers test for older people was
introduced to ensure their ability to drive safely.
The current advertising campaign NZTA (formerly Land Transport NZ/Transit) is called The Road
Safety Campaign and is run in partnership with the New Zealand Police. It uses the successful
campaign in Victoria, Australia as a blueprint and is part of the New Zealand road safety
strategy. The focus is on the five major problem areas: Speed, Drink driving, Failure to give way,
Fatigue and Safety belts. Main realistic road safety adverts aimed at encouraging a culture shift.
The Government provides funding of approximately $12.5 million per year. This funding
supports a $255 million Police strategic enforcement programme. The alcohol‐campaign now
has a focus on the younger generation.
There is another campaign which is part of the New Zealand Transport Strategy, the Sustainable
Transport Campaign. It focuses on two areas: travel choice and emissions. The Government
provides funding of approximately $1.5 million per year.
Other advertising is concerned with vehicle safety. Currently a series of television
advertisements are run that promote the Australian New Car Assessment Programme (ANCAP).
People are to be pointed to the `Rightcar´ website so they can look up the safety ratings of
vehicles. There is also a campaign that specifically looks at side curtain airbags and electronic
stability control. People are encouraged to consider these safety features as a priority in their
next vehicles.
There are also regional road safety education campaigns, which focus on cyclists, like ‘Don´t
Burst My Bubble’ (Driver/cyclist share the road campaign) or ‘Be Bright on your Bike’ (Cyclist
visibility campaign).
10.2 Enforcement
The most important changes in Enforcement occurred more than ten years ago. The level of
blood alcohol was decreased, speeding fees increased and speeding cameras were installed.
Together with the enforcement of restraints and cycle helmets those measures combined within
a relatively short period of time and the introduction of a Highway Patrol had a certain impact
on driver behaviour and the severity of crashes.
To try to measure the output of Police performance, the numbers of reported Police hours are
compared. It must be pointed out that in the financial year 2006/2007 the system of reported
police hours was transformed into numbers of full time equivalent staff (FTE)6. Each police
6 From the fiscal year 2006/2007 onward the numbers are projected FTEs multiplied by 1,500
WGN_DOCS‐#615309‐V1Attachment 1 to Report 09.169
Page 54 of 69
position was assigned a work scheme, which accounted for the approximate proportion of each
possible activity in that particular position over one year (e.g. percentage split of speed controls,
office work, educational programmes etc.). That means that currently the system accounts for
‘expected’ input and not for the output value. In practice it has become more difficult to
monitor the exact number of hours spent on certain policing actions. Every police station for
instance is supposed to deliver the same share of hours for a certain position, where in fact they
might not be able to, for various reasons. But this shift in actual hours spent on each policing
action would not be visible, due to the previously assumed percentages for the different policing
actions. When it comes to an efficiency question, it is now harder to match the money spent for
the policing actions with the FTE numbers.
In figure 89 the annual hours/FTEs for selected Police Road Policing and Community
engagement are shown between 2001/2002 and 2008/2009.
Figure 89: Wellington Region hours/FTEs for Police Road Policing and Community engagement
(2000/01‐2008/09)
It is notable that the most important changes over the nine years occurred in the `Enhanced
Alcohol CBT7 Project´ and in the hours for the `Drinking/Drugged driver control´. The former
increased between 2001/2002 and 2003/2004 by approximately 10,000 hours. The latter
7
CBT= Compulsory Breath Test
WGN_DOCS‐#615309‐V1Attachment 1 to Report 09.169
Page 55 of 69
increased one year later (between 2003/2004 and 2004/2005) by almost the same number of
hours but decreased again over the following years.
Without the hours for the national CBT‐Project, the total number of police hours increased over
the last nine years for the Wellington Region by 2,910 hours which are 1.94 FTE. The total
number of FTE for the Wellington Region is 156.6.
The number of hours spent on national programmes (see figure 90) was mainly steady for the
Highway Patrol (once completely launched in 2001/2002) and the Traffic Camera operations,
which have been increasing over the last two fiscal years. The number of hours for the CBT‐
Project increased strongly between the fiscal year 2001/2002 and 2003/2004, then decreased a
little and remained static for some years before there was an increase in the number of hours
over the last two years.
Figure 90: New Zealand Police Strategic Road Policing in hours/EFT (2001‐2009)
WGN_DOCS‐#615309‐V1Attachment 1 to Report 09.169
Page 56 of 69
10.3 Vehicle Engineering
Over the period of 20 years vehicles became safer for occupants. Anti‐lock braking systems and
airbags were introduced for most cars by the end of the 1980s/beginning of the 1990s. Ten
years later, crumple zones were made a feature of every car by law and the repair rules for
vehicles became stricter. The protection for the driver made huge steps together with the
increased average engine size and power of the vehicles available. Those major improvements
and changes occurred mainly in the first half of the surveyed 20 years. In the last couple of years
mainly improvements of the existing standards were made.
10.4 Road Engineering
We were able to obtain any useful data on the investment made in road safety engineering
works over the period. Anecdotally road maintenance appears to be adequate and road
controlling authorities generally report a continuous programme of safety works.
For example the Wellington City Council´s Safer Road Programme, which focuses on Kerb
extensions and Black Spots (single spots where engineering measures will improve the safety for
the road users considerably).
The NZTA has continuously undertaken Highway safety works, such as median barriers, which
are installed all over the region.
11 Structural Changes
11.1 Systemic Changes over 20 years
This chapter examines the developments and systemic changes over the last 20 years. The
changes are displayed as ‘Education’, ‘Coordination’, ‘Engineering’, ‘Enforcement’ and
‘Organisation Structure’ (see figure 91 and Table of events, Appendix B). Some had more
influence than others and it can take one or more years for some changes to be implemented
and become fully effective.
On closer examination, some of the changes in the crash numbers since 1988 might be linked to
the different influences. The developments in vehicle engineering in the 1980s and 1990s are
notable, e.g. the fitting of ABS, Airbags, Crumple zones or the stricter rules of repair and other
vehicle standards. The advancement of educational efforts and trainings also play an important
role. The multitude of mergers in the New Zealand transport organisations during the last 20
years is also shown, but it is not possible to relate these to changes in the crash numbers. The
NZ Police monitoring and surveillance, combined with other enforcement rules set by the
government, are likely to have caused some changes in the crash numbers as well. However, it is
difficult to measure the influence of campaigns or controls. The installation of speed cameras
may have more effect on the crash numbers than the amendments of vehicle standards, but it is
not possible to identify by how much. Investments made on road safety engineering over the
WGN_DOCS‐#615309‐V1Attachment 1 to Report 09.169
Page 57 of 69
last decade were not reviewed for their effectiveness as this would need to be done on a site by
site basis.
The changes in the organisation structures led necessarily to new tools and coordination across
all levels of administration (e.g. new community programmes as well as Road Safety Action Plans
for each TA) to maintain and accelerate the efficiency of the structures. However, such changes
need some time to be fully effective and established.
Other factors have changed as well, like the higher fuel prices and the greater awareness of
climate changes or health issues, which affect people´s behaviour. Overall it has not been
possible to identify the influence of any of these changes on the reported crash numbers.
WGN_DOCS‐#615309‐V1Attachment 1 to Report 09.169
Page 58 of 69
Figure 91: Total fatal and serious injury crash numbers of all NZ and Wellington Region with different influences over the years (1988‐2007)
WGN_DOCS‐#615309‐V1Attachment 1 to Report 09.169
Page 59 of 69
11.2 LTSA, LTNZ and NZTA
The first major structural changes occurred in the mid 1990s when the staff of the Ministry of
Transport (MOT) was downsized and partly redistributed to other governing bodies. 4,000
members of staff were reduced to a number of 40, concerned with the essence of the
ministerial work for the MOT. That had an impact on the affected institutions, the different
projects and the focus of the road safety educational programmes of the Land Transport Safety
Authority (LTSA).
Until 2005 the LTSA had their own engineers working together with the different road
controlling engineers on the safety reports. Crash reduction studies (CRS) were done annually
for some districts and in longer intervals for others.
Usually low cost improvement measures were implemented in response to each report and if
obvious markers were found, i.e. a higher alcohol factor, the TAs would consider working with
the police or other concerned authorities on that issue. Now each TA is completely in charge of
conducting CRS.
When the LTSA became Land Transport New Zealand (LTNZ) by merging with Transfund NZ in
December 2004, the focus was shifted from sole safety to a broader range of priorities. There
was no specific outline considering the road safety work for the engineers from LTSA or
outlines concerning their new role in the organisation. The staff changed due to the merger
and no specific parameters how the prior safety focus in the new organisation could be
maintained on a comparatively high level were specified. Other employees joining LTNZ did
not have an engineering background like most of the former LTSA employees concerned with
road safety.
In August 2008 the LTNZ merged with Transit NZ and became the New Zealand Transport
Agency (NZTA).
Each TA should provide a Road Safety Action Plan (RSAP), which states the different issues and
the actions taken to ensure safe roads for the TAs. The basic idea of RSAP came up about 10
years ago back from the LTSA.
The success of the road safety programmes and action plans depends on the dedication and
commitment of the different TAs (especially the person assigned) and where they put the
emphasis. As for the role of LTNZ and now NZTA, providing assistance, encouragement and
advice to the TAs is the main focus. The Ministry is now trying to get the focus a little more
back on the road safety and made it a NZ Transport Strategy target. There is also a deficiency
data base since 2007 which the road controlling authorities can use to identify the best actions
for road safety improvements and use as a contribution to the RSAPs. We have been able to
determine the use of this database for the region.
WGN_DOCS-#627286-V1 PAGE 59 OF 65Attachment 1 to Report 09.169
Page 60 of 69
11.3 NZ Police and Traffic Safety Service (TSS)
The merger of the TSS branch of MOT Road Transport Division and the New Zealand Police in
1992 had significant impacts. The most important changes are noted in the way that all
policing duties are carried out now, the funding and recording of police time and the attitude
of the public toward the police.
A very important point is the funding arrangement between the MOT, ACC, LTSA as well as the
police. The agencies wanted to make sure that they get the services or outputs they
purchased. Hence the police has to deliver a certain number of hours of traffic output, which is
measured by contacts each hour and a certain number of expected tickets for a certain
number of contacts.
In the past, New Zealand had separate organisations policing the transport laws and the
criminal law, which both had different policing styles. The police itself relied on a quiet style,
necessary for solving crimes and keeping order and opposite to the TSS. That was one of the
reasons why the police had much better public relations than the MOT (later TSS). Being
absorbed into the general police and being used to a certain style of policing made it difficult
for the former members of the TSS to adjust to the required degree of public cooperation by
the police.
In the years after the merger these different styles were mostly ignored and some people see
in that fact as a reason for the increase of the road toll in the following years.
12 Conclusions
The overall trend when analysing fatal and serious road crash statistics over the past 20 years
is a decrease in crash numbers until around 2000, followed by a steady increase in crash
numbers thereafter.
A number of important road safety initiatives across the three E’s (Education, Enforcement and
Engineering) have been implemented over this period. For example: national campaigns
focusing on speed, drink driving, give way, fatigue, and safety belts; regional campaigns;
increased speeding fines, lower blood alcohol levels, speed cameras, child restraints and cycle
helmets; vehicle safety improvements such as airbags and ABS brakes, new vehicle safety
standards, electronic stability control, and road infrastructure improvements in the Wellington
region such as the safer routes to schools programme, wire rope median barrier installation,
and lowering of speed limits through the Wellington City CBD and other parts of the network.
However, despite all of these improvements, the available data suggests a steady increase in
crash numbers over more recent years since 2000. It is likely that road safety gains achieved by
the various initiatives have been off‐set somewhat by a number of factors identified in this
report.
Vehicle ownership has been steadily increasing along with an increasing number of drivers in
the 20‐29 year old age group (the age group that features most predominantly in crash
numbers).
PAGE 60 OF 65 WGN_DOCS-#627286-V1You can also read