Greater Ottawa REGIONAL INFRASTRUCTURE PLAN December 2, 2015 - Type text - Hydro One
←
→
Page content transcription
If your browser does not render page correctly, please read the page content below

[Type text]

Greater Ottawa
REGIONAL INFRASTRUCTURE PLAN
December 2, 2015
Greater Ottawa – Regional Infrastructure Plan                                      2 Dec 2015

                                         [This page is intentionally left blank]

                                                                                           2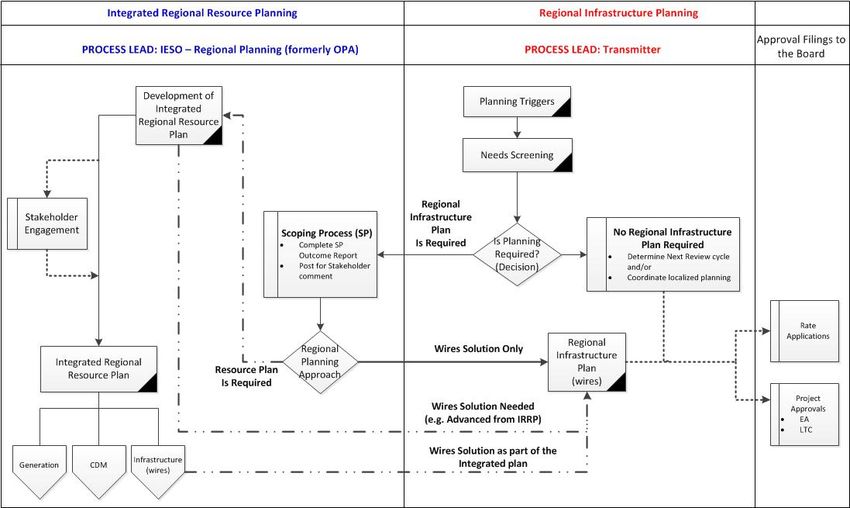
Greater Ottaawa – Regional Infrastructure
                           I              Pllan   2 Deec 2015

Prepared and
         a supported
                   d by:

 Compan
      ny
 Hydro One
       O Networkss Inc. (Lead Transmitter)
                              T

 Hydro Ottawa
       O      Limiteed

 Independ
        dent Electricity System Op
                                 perator

 Hydro One
       O Networkss Inc. (Distribu
                                ution)

 Hydro Hawkesbury
       H          In
                   nc.

 Ottawa River
        R     Power Corporation
                    C

                                                           3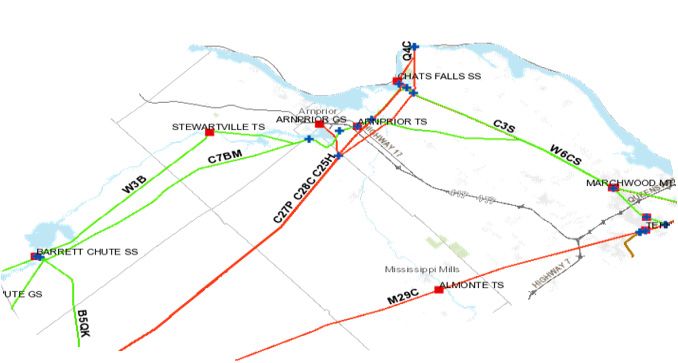
Greater Ottawa – Regional Infrastructure Plan                                      2 Dec 2015

                                         [This page is intentionally left blank]

                                                                                           4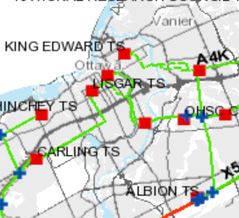
Greater Ottawa – Regional Infrastructure Plan                                                      2 Dec 2015

DISCLAIMER
This Regional Infrastructure Plan (“RIP”) report was prepared for the purpose of developing an electricity
infrastructure plan to address all near and mid-term needs identified in previous planning phases and also
any additional needs identified based on new and/or updated information provided by the RIP Working
Group.

The preferred solution(s) that have been identified in this report may be reevaluated based on the findings
of further analysis. The load forecast and results reported in this RIP report are based on the information
provided and assumptions made by the participants of the RIP Working Group.

Working Group participants, their respective affiliated organizations, and Hydro One Networks Inc.
(collectively, “the Authors”) make no representations or warranties (express, implied, statutory or
otherwise) as to the RIP report or its contents, including, without limitation, the accuracy or completeness
of the information therein and shall not, under any circumstances whatsoever, be liable to each other, or to
any third party for whom the RIP report was prepared (“the Intended Third Parties”), or to any other third
party reading or receiving the RIP report (“the Other Third Parties”), for any direct, indirect or
consequential loss or damages or for any punitive, incidental or special damages or any loss of profit, loss
of contract, loss of opportunity or loss of goodwill resulting from or in any way related to the reliance on,
acceptance or use of the RIP report or its contents by any person or entity, including, but not limited to,
the aforementioned persons and entities.

                                                                                                           5
Greater Ottawa – Regional Infrastructure Plan                                      2 Dec 2015

                                         [This page is intentionally left blank]

                                                                                           6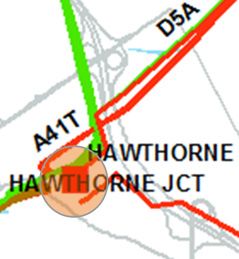
Greater Ottawa – Regional Infrastructure Plan 2 Dec 2015
EXECUTIVE SUMMARY
THIS REGIONAL INFRASTRUCTURE PLAN (“RIP”) WAS PREPARED BY HYDRO
ONE AND THE WORKING GROUP IN ACCORDANCE WITH THE ONTARIO
TRANSMISSION SYSTEM CODE REQUIREMENTS. IT IDENTIFIES
INVESTMENTS IN TRANSMISSION FACILITIES, DISTRIBUTION FACILITIES, OR
BOTH, THAT SHOULD BE DEVELOPED AND IMPLEMENTED TO MEET THE
ELECTRICITY INFRASTRUCTURE NEEDS WITHIN THE GREATER OTTAWA
REGION.
The participants of the RIP Working Group included members from the following organizations:
Hydro Ottawa Limited
Hydro Hawkesbury Inc.
Hydro One Networks Inc. (Distribution)
Independent Electricity System Operator
Hydro One Networks Inc. (Transmission)
Ottawa River Power Corporation
This RIP provides a consolidated summary of needs and recommended plans for both the Ottawa Area
Sub-Region and Outer Ottawa Area Sub-Region that make up the Greater Ottawa Region for the near
term (up to 5 years) and the mid-term (5 to 10 years). No long term needs and associated plans (10 to 20
years) have been identified.
This RIP is the final phase of the regional planning process and it follows the completion of the Ottawa
Sub-Region’s Integrated Regional Resource Plan (“IRRP”) by the IESO in April 2015 and the Outer
Ottawa Area Sub-Region’s Needs Assessment (“NA”) Study by Hydro One in July 2014.
The major infrastructure investments planned for the Greater Ottawa Region over the near and mid-term,
identified in the various phases of the regional planning process, are given in the Table below.
No. Project I/S date Cost
1 Almonte TS: addition of breaker to sectionalize line M29C November 2015 $4.7M
Russell TS and Riverdale TS: construction of feeder ties to allow
2 2017-2020 $2.0M
extra load transfers
3 Lisgar TS: replacement of transformers T1 and T2 December 2017 $13.9M
4 Hawthorne TS: replacement of autotransformers T5 and T6 May 2018 $15.7M
5 Overbrook TS: replacement of transformers T3 and T4 June 2018 $1.1M(1)
6 115kV Circuit A6R: additional tap to off load Circuit A4K June 2019 $9-11M
Hawthorne TS: replacement of transformers T7 and T8 and add one
7 October 2019 $1.1M(2)
44kV feeder position
8 King Edward TS: Replace Transformer T4 June 2021 $12M
(1)
The transformers are at end of life and are being replaced as part of Hydro One sustainment program. The cost shown here
represents the incremental cost of installing the next larger size units.
(2)
Incremental cost for larger transformer only.
7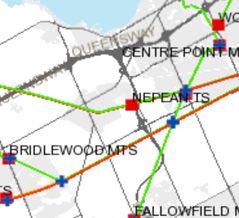
Greater Ottawa – Regional Infrastructure Plan                                                    2 Dec 2015

The IRRP study had also identified the need for additional 230/115 kV autotransformation capacity at
Merivale TS and provision for a supply for a new station in the southwest area. The options to address
these needs are still being studied by the Working Group and as part of the IESO community engagement
activities. The Working Group expects to finalize recommendation to address these needs by summer
2016.

Investments to address the other mid-term needs, for cases where a decision is not required until 2020,
will be reviewed and finalized in the next regional planning cycle.

No long term needs were identified at this time. As per the OEB mandate, the Regional Plan should be
reviewed and/or updated at least every five years. The region will continue to be monitored and should
there be a need that emerges due to a change in load forecast or any other reason, the next regional
planning cycle will be started earlier to address the need.

                                                                                                          8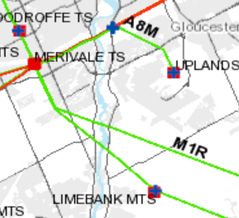
Greater Ottawa – Regional Infrastructure Plan                                                                                                      2 Dec 2015

TABLE OF CONTENTS
Disclaimer ..................................................................................................................................................... 5
Executive Summary ...................................................................................................................................... 7
Table of Contents .......................................................................................................................................... 9
List of Figures ............................................................................................................................................. 11
List of Tables .............................................................................................................................................. 11
1. Introduction .......................................................................................................................................... 13
    1.1 Scope and Objectives.................................................................................................................. 14
    1.2 Structure...................................................................................................................................... 14
2. Regional Planning Process ................................................................................................................... 15
    2.1 Overview .................................................................................................................................... 15
    2.2 Regional Planning Process ......................................................................................................... 15
    2.3 RIP Methodology ....................................................................................................................... 18
3. Regional Characteristics ....................................................................................................................... 19
4. Transmission Facilities Completed Over Last Ten Years or Currently Underway .............................. 22
5. Forecast And Other Study Assumptions .............................................................................................. 24
    5.1 Load Forecast ............................................................................................................................. 24
    5.2 Other Study Assumptions ........................................................................................................... 25
6. Adequacy of Facilities and Regional Needs over the 2015-2025 Period ............................................. 26
    6.1 500 and 230 kV Transmission Facilities .................................................................................... 28
    6.2 230/115 kV Transformation Facilities ........................................................................................ 28
    6.3 115 kV Transmission Facilities .................................................................................................. 29
    6.4 Step-Down Transformation Facilities......................................................................................... 30
7. Regional Plans ...................................................................................................................................... 32
    7.1 Hawthorne Autotransformer T5 and T6 ..................................................................................... 32
         7.1.1 Description ........................................................................................................................ 32
         7.1.2 Recommended Plan and Current Status ............................................................................ 33
    7.2 Autotransformation Capacity and South West Area Station Capacity ....................................... 33
         7.2.1 Merivale TS Autotransformers T21 and T22/Hawthorne Autotransformer T9 ................ 33
         7.2.2 Supply to South West Area – Line and Station Capacity ................................................. 34
         7.2.3 Recommended Plan and Current Status ............................................................................ 36
    7.3 115 kV Transmission Circuit A4K Supply Capacity.................................................................. 37
         7.3.1 Description ........................................................................................................................ 37
         7.3.2 Current Status ................................................................................................................... 37
    7.4 Station Capacity – Ottawa Centre 115 kV Area ......................................................................... 38
         7.4.1 Description ........................................................................................................................ 38
         7.4.2 Recommended Plan and Current Status ............................................................................ 38
    7.5 Station Capacity - Hawthorne TS 44kV ..................................................................................... 40
    7.6 Bilberry Creek TS End of Life ................................................................................................... 40
         7.6.1 Description ........................................................................................................................ 40
         7.6.2 Recommended Plan and Current Status ............................................................................ 41
    7.7 Almonte TS and Terry Fox TS Reliability ................................................................................. 41
         7.7.1 Description ........................................................................................................................ 41

                                                                                                                                                                9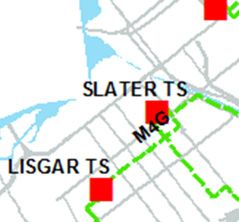
Greater Ottawa – Regional Infrastructure Plan                                                                                                  2 Dec 2015

       7.7.2 Recommended Plan and Current Status ............................................................................ 42
   7.8 Orleans TS Reliability ................................................................................................................ 43
       7.8.1 Description ........................................................................................................................ 43
       7.8.2 Recommended Plan and Current Status ............................................................................ 43
   7.9 Load Restoration for the Loss of B5D/D5A ............................................................................... 43
       7.9.1 Description and Current Status ......................................................................................... 43
   7.10 Load Loss for S7M Contingency ................................................................................................ 44
       7.10.1 Description and Current Status ......................................................................................... 44
   7.11 Voltage Regulation on 115kV Circuit 79M1.............................................................................. 44
       7.11.1 Description and Current Status ......................................................................................... 44
   7.12 Voltage at Stewartville TS .......................................................................................................... 44
       7.12.1 Description and Current Status ......................................................................................... 44
   7.13 Voltage Drop at Terry Fox MTS for E34M open at the Merivale End ...................................... 44
       7.13.1 Description ........................................................................................................................ 44
       7.13.2 Recommended Plan and Current Status ............................................................................ 45
   7.14 Low Power Factor at Almonte TS .............................................................................................. 45
       7.14.1 Description and Current Status ......................................................................................... 45
8. Conclusion and Next Steps ................................................................................................................... 46
9. References ............................................................................................................................................ 49
Appendix A: Stations in the Greater Ottawa Region .................................................................................. 50
Appendix B: Transmission Lines in the Greater Ottawa Region ................................................................ 52
Appendix C: Distributors in the Greater Ottawa Region ............................................................................ 53
Appendix D: Area Stations Load Forecast ................................................................................................. 55
Appendix E: List of Acronyms ................................................................................................................... 60

                                                                                                                                                         10
Greater Ottawa – Regional Infrastructure Plan 2 Dec 2015
List of Figures
Figure 1-1 Greater Ottawa Region .............................................................................................................. 13
Figure 2-1 Regional Planning Process Flowchart ....................................................................................... 17
Figure 2-2 RIP Methodology ...................................................................................................................... 18
Figure 3-1 Ottawa Sub-Region ................................................................................................................... 19
Figure 3-2 Outer Ottawa Sub-Region, Eastern Area .................................................................................. 20
Figure 3-3 Outer Ottawa, Western Area ..................................................................................................... 20
Figure 3-4 Greater Ottawa Region – Electrical Supply .............................................................................. 21
Figure 5-1 Greater Ottawa Region Summer Extreme Weather Peak Forecast ........................................... 24
Figure 7-1 Hawthorne TS ........................................................................................................................... 32
Figure 7-2 Merivale TS ............................................................................................................................... 33
Figure 7-3 South West Area........................................................................................................................ 35
Figure 7-4 Option to Rebuild A5RK as Double-Circuit 115 kV Line ........................................................ 37
Figure 7-5 Downtown Ottawa Stations ....................................................................................................... 38
Figure 7-6 Bilberry Creek TS and the East Ottawa Area............................................................................ 41
Figure 7-7 Lines E29C and E34M (M29C). In-Line Breaker at Almonte TS. ........................................... 42
List of Tables
Table 6-1 Near and Mid-Term Regional Needs.......................................................................................... 27
Table 6-2 Adequacy of 230/115 kV Autotransformer Facilities ................................................................ 29
Table 6-3 Adequacy of 115 kV Circuits ..................................................................................................... 30
Table 6-4 Adequacy of Step-Down Transformer Stations - Areas Requiring Relief ................................. 30
Table 6-5 Adequacy of Step-Down Transformer Stations – Areas Adequate ............................................ 31
Table 8-1 Regional Plans – Next Steps, Lead Responsibility and Plan In-Service Dates .......................... 47
Table 8-2 List of Mid-Term Needs to be Reviewed in Next Regional Planning Cycle.............................. 48
Table D-1 Stations Coincident Load Forecast (MW) ................................................................................. 56
Table D-2 Stations Non Coincident Forecast (MW)................................................................................... 58
11Greater Ottawa – Regional Infrastructure Plan 2 Dec 2015
[This page is intentionally left blank]
12Greater Ottawa – Regional Infrastructure Plan 2 Dec 2015
1. INTRODUCTION
THIS REPORT PRESENTS THE REGIONAL INFRASTRUCTURE PLAN
(“RIP”) TO ADDRESS THE ELECTRICITY NEEDS OF THE GREATER
OTTAWA REGION.
The report was prepared by Hydro One Networks Inc. (“Hydro One”) and documents the results of the
joint study carried out by Hydro One, Hydro Ottawa Limited (“Hydro Ottawa”), Hydro Hawkesbury Inc.
(“Hydro Hawkesbury”), Ottawa River Power Corporation (“ORPC”) and the Independent Electricity
System Operator (“IESO”) in accordance with the Regional Planning process established by the Ontario
Energy Board (“OEB”) in 2013.
The Greater Ottawa Region covers the municipalities bordering the Ottawa River from Arnprior in the
West to Hawkesbury in the East and North of Highway 43. At the center of this region is the City of
Ottawa. Electrical supply to the Region is provided from fifty-two 230 kV and 115 kV step-down
transformer stations. The summer 2015 area load of the Region was about 1800 MW. The boundaries of
the Region are shown in Figure 1-1 below.
Figure 1-1 Greater Ottawa Region
13Greater Ottawa – Regional Infrastructure Plan 2 Dec 2015
1.1 Scope and Objectives
This RIP report examines the needs in the Greater Ottawa Region. Its objectives are to: identify new
supply needs that may have emerged since previous planning phases (e.g. Needs Assessment, Local Plan,
and/or Integrated Regional Resource Plan); assess and develop a wires plans to address these needs;
provide the status of wires planning currently underway or completed for specific needs; and identify
investments in transmission and distribution facilities or both that should be developed and implemented
to meet the electricity infrastructure needs within the region.
The RIP reviews factors such as the load forecast, transmission and distribution system capability along
with any updates with respect to local plans, conservation and demand management (“CDM”), renewable
and non-renewable generation development, and other electricity system and local drivers that may
impact the need and alternatives under consideration.
The scope of this RIP is as follows:
A consolidated report of the needs and relevant plans to address near and mid-term needs (2015-
2025) identified in previous planning phases (Needs Assessment, Scoping Assessment, Local
Plan or Integrated Regional Resource Plan).
Identification of any new needs over the 2015-2025 period and a wires plan to address these
needs based on new and/or updated information.
Develop a plan to address any longer term needs identified by the Working Group
The IRRP or RIP Working Group did not identify any long term needs at this time. If required, further
assessment will be undertaken in the next planning cycle because adequate time is available to plan for
required facilities.
1.2 Structure
The rest of the report is organized as follows:
Section 2 provides an overview of the regional planning process.
Section 3 describes the region.
Section 4 describes the transmission work completed over the last ten years.
Section 5 describes the load forecast and study assumptions used in this assessment.
Section 6 describes the results of the adequacy assessment of the transmission facilities and
identifies the needs.
Section 7 discusses the needs and provides the alternatives and preferred solutions.
Section 8 provides the conclusion and next steps.
14Greater Ottawa – Regional Infrastructure Plan 2 Dec 2015
2. REGIONAL PLANNING PROCESS
2.1 Overview
Planning for the electricity system in Ontario is done at essentially three levels: bulk system planning,
regional system planning, and distribution system planning. These levels differ in the facilities that are
considered and the scope of impact on the electricity system. Planning at the bulk system level typically
looks at issues that impact the system on a provincial level, while planning at the regional and distribution
levels looks at issues on a more regional or localized level.
Regional planning looks at supply and reliability issues at a regional or local area level. Therefore,
it largely considers the 115 kV and 230 kV portions of the power system that supply various parts of
the province.
2.2 Regional Planning Process
A structured regional planning process was established by the Ontario Energy Board (“OEB”) in 2013
through amendments to the Transmission System Code (“TSC”) and Distribution System Code (“DSC”).
The process consists of four phases: the Needs Assessment 1 (“NA”), the Scoping Assessment (“SA”), the
Integrated Regional Resource Plan (“IRRP”), and the Regional Infrastructure Plan (“RIP”).
The regional planning process begins with the NA phase, which is led by the transmitter to determine if
there are regional needs. The NA phase identifies the needs and the Working Group determines whether
further regional coordination is necessary to address them. If no further regional coordination is required,
further planning is undertaken by the transmitter and the impacted local distribution company (“LDC”) or
customer and develops a Local Plan (“LP”) to address them. These needs are local in nature and can be
best addressed by a straight forward wires solution.
In situations where identified needs require coordination at the regional or sub-regional levels, the IESO
initiates the SA phase. During this phase, the IESO, in collaboration with the transmitter and impacted
LDCs, reviews the information collected as part of the NA phase, along with additional information on
potential non-wires alternatives, and makes a decision on the most appropriate regional planning
approach. The approach is either a RIP, which is led by the transmitter, or an IRRP, which is led by the
IESO. If more than one sub-region was identified in the NA phase, it is possible that a different approach
could be taken for different sub-regions.
The IRRP phase will generally assess infrastructure (wires) versus resource (CDM and Distributed
Generation) options at a higher or more macro level, but sufficient to permit a comparison of options. If
the IRRP phase identifies that infrastructure options may be most appropriate to meet a need, the RIP
phase will conduct detailed planning to identify and assess the specific wires alternatives and recommend
1
Also referred to as Needs Screening.
15Greater Ottawa – Regional Infrastructure Plan 2 Dec 2015
a preferred wires solution. Similarly, resource options that the IRRP identifies as best suited to meet a
need are then further planned in greater detail by the IESO. The IRRP phase also includes IESO led
stakeholder engagement with municipalities and establishes a Local Advisory Committee in the region or
sub-region. Since the Ottawa Sub-Region was in transition to the new regional planning process, the
IESO led IRRP engagement for this sub-region was initiated after the completion of the IRRP.
The RIP phase is the final stage of the regional planning process and involves: confirmation of previously
identified needs; identification of any new needs that may have emerged since the start of the planning
cycle; and development of a wires plan to address the needs where a wires solution would be the best
overall approach. This phase is led and coordinated by the transmitter and the deliverable of this stage is a
comprehensive report of a wires plan for the region. Once completed, this report can be referenced in rate
filing submissions or as part of LDC rate applications with a planning status letter provided by the
transmitter. Reflecting the timelines provisions of the RIP, plan level stakeholder engagement is not
undertaken at this stage. However, stakeholder engagement at a project specific level will be conducted as
part of the project approval requirement.
The regional planning process specifies a 20 year planning assessment period for the IRRP. No specific
period has been specified for the RIP. The RIP focuses on the wires options and, given the forecast
uncertainty and the fact that adequate time is available to identify and plan new wire facilities in
subsequent planning cycles, a study period of 10 years is considered adequate for the RIP. The only
exception would be the case where major regional transmission is required for an area with limited or no
transmission facilities. In these cases the RIP would review and assess longer term needs if identified in
the IRRP.
To efficiently manage the regional planning process, Hydro One has been undertaking wires planning
activities in collaboration with the IESO and LDCs for the region as part of and/or in parallel with:
Planning activities that were already underway in the region prior to the new regional planning
process taking effect.
The NA, SA, and LP phases of regional planning.
Participating in and conducting wires planning as part of the IRRP for the region or sub-region.
Figure 2-1 illustrates the various phases of the regional planning process (NA, SA, IRRP, and RIP) and
their respective phase trigger, lead, and outcome.
16Greater Ottawa – Regional Infrastructure Plan 2 Dec 2015
Figure 2-1 Regional Planning Process Flowchart
17Greater Ottaawa – Regional Infrastructure
I Pllan 2 Dec 2015
2.3 RIP
R Methodology
The RIP phase
p consistss of a four steep process (seee Figure 2-2)) as follows:
1. Data Gathering:
G Thhe first step of
o the process is the review w of planning assessment ddata collected in the
previoous stages of the regional planning
p proccess. Hydro O One collects thhis informatioon and reviewws it
with the
t Working Group G to reco
onfirm or upd date the informmation as requuired. The daata collected
includdes:
Net
N peak demaand forecast at a the transforrmer station leevel. This inccludes the effeect of any
diistributed genneration or conservation an nd demand maanagement prrograms.
Existing
E area network
n and capabilities
c in
ncluding any bbulk system ppower flow asssumptions.
Other
O data andd assumptionss as applicablee such as asseet conditions; load transferr capabilities, and
prreviously com mmitted transm mission and distribution
d syystem plans.
2. Techn nical Assessm ment: The seco ond step is a technical
t asseessment to revview the adeqquacy of the
regionnal system inccluding any previously
p ideentified needss. Additional nnear and mid-term needs m may
be ideentified at thiss stage.
3. Alternnative Develo opment: The third
t step is th
he developmeent of wires ooptions to adddress the needds and
to com
me up with a preferred alteernative based d on an assesssment of techhnical consideerations,
feasib
bility, environnmental impacct and costs.
4. Impleementation Plan: The fourtth and last step p is the devellopment of thhe implementaation plan forr the
preferrred alternativve.
Figure 2-2
2 RIP Method
dology
18Greater Ottaawa – Regional Infrastructure
I Pllan 2 Dec 2015
3. REGION
R NAL CH
HARAC
CTERIS
STICS
THE GRREATER OTTAWA
O REGION COVERS THE MUN NICIPALITTIES
BORDEERING THHE OTTAWWA RIVER R FROM A RNPRIOR R IN THE W
WEST TO
HAWKE ESBURY INI THE EAAST AND NORTH O OF HIGHW
WAY 43. AAT THE
CENTEER OF THIIS REGION
N IS THE CITY OF OTTAWA A (SEE FIG
GURE 3-1)).
ELECT RICAL SU
UPPLY TO O THE REGGION IS P
PROVIDED D FROM FFIFTY-TW
WO
V AND 115
230 KV 5 KV STEPP-DOWN TRANSFO
T ORMER STTATIONS. THE 20155
SUMME ER PEAK AREA LO OAD OF THHE REGIOON WAS AAPPROXIM MATELY
1840 MW.
M
Bulk electtrical supply to
t the Greaterr Ottawa Reg
gion is provideed through thhe 500/230 kV
V Hawthorne TS
and a netw
work of 230 kV k and 115 kV V transmissio
on lines and s tep-down trannsformation ffacilities. Thee area
has been divided
d into two sub-regions as shown in
i Figure 1-1 and describeed below:
The Ottawa
O Sub-RRegion comprrises primarilly the City off Ottawa. It iis supplied byy two 230/1115 kV
autotrransformer sttations (Hawtthorne TS annd Merivale TS, eight 2330 kV and thhirty-three 1115 kV
transfformer station
ns stepping do
own to a loweer voltage. Loocal generatioon in the areaa consists of tthe 74
MW Ottawa Health Science Non-Utility
N Generator
G (“N
NUG”) locatedd near the doowntown areea and
conneected to the 115 kV networrk. The Ottaw
wa Sub-Regio n is shown inn Figure 3-1 bbelow.
Figure 3-1 Ottawa Sub-R
Region
Hydro o Ottawa is th
he main LDC that serves th he electricity demand for thhe City of Otttawa. Hydro One
Distriibution suppliies load in thee outlying areeas of the sub--region. Bothh Hydro Ottaw
wa and Hydroo One
Distriibution receiv
ve power at th he step-down transformer sstations and ddistribute it to the end userss, i.e.
industtrial, commerrcial and residdential custom mers.
The Outer
O Ottawa Sub-Region covers the reemaining areaa of the Great ater Ottawa R Region. The eaastern
area (shown
( in Figgure 3-2) is served
s by thrree 230 and ffive 115 kV sstep-down traansformer staations.
Hydro o One Distrib bution and Hy ydro Hawkesb bury are the L
LDCs in the area that disttribute powerr from
the staations to the end
e use custo omers. It also includes a lar
arge industriall customer, Ivvaco Rolling Mills,
in L’O
Orignal, Ontaario.
19Greater Ottawa – Regional Infrastructure Plan 2 Dec 2015
Figure 3-2 Outer Ottawa Sub-Region, Eastern Area
The western area of the Outer Ottawa Sub-Region is served by one 230 kV and two 115 kV step-
down transformer stations. Hydro One Distribution is the LDC that supplies end use customers for
these stations. The area includes the following generating stations: Barrett Chute GS, Chats Falls GS
and Stewartville GS with a peak generation capacity of about 450 MW.
Figure 3-3 Outer Ottawa, Western Area
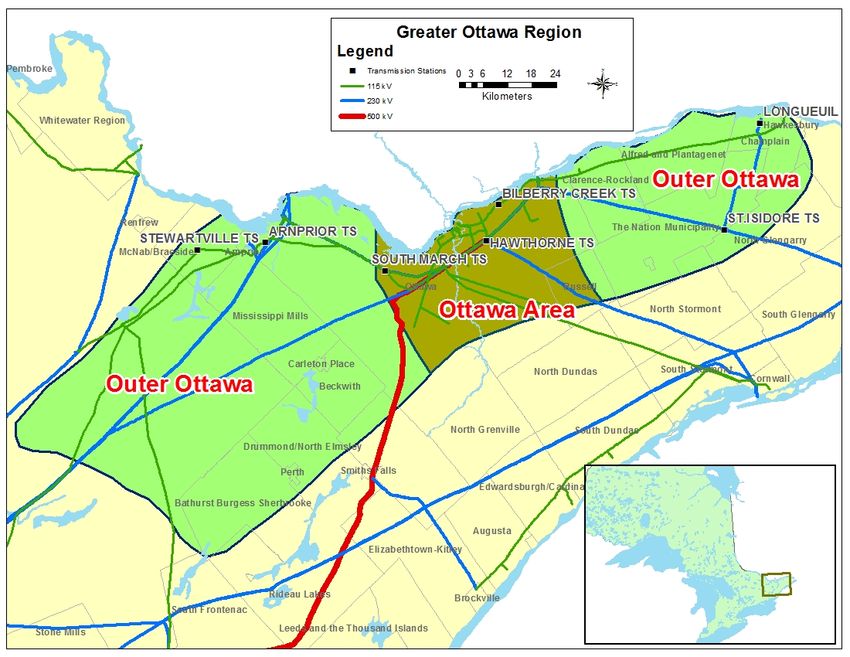
An electrical single line diagram for the Greater Ottawa Region facilities is shown in Figure 3-4.
20Greater Ottawa – Regional Infrastructure Plan 2 Dec 2015
Ottawa 115kV Area MW Supply= Σ (Hawthrone T4, T5, T6, T9), ( Merivale T21, T22), (C7BM
from Chatfalls and Barret Chute), (W6CS from Stewartville) and OHGS
IPB
N.R.C TS Bilberry
South March SS Cyrville Masson
Stewartville GS/TS Creek TS
W6CS MTS Masson
Arnprior TS
M4G Epworth MTS A2 79M1
Marchwood Bridlewood Cumberland DS
S7M A4K Rockland DS
MTS MTS Orleans Navan Wilhaven
Barrett Chute
C7BM Carling TS TS DS DS
SS
Fallowfield King Overbrook TS
MTS Edward TS Moulton MTS
C7BM D5A Rockland East DS
Chat Falls A5RK
GS Manotick H9A
DS Riverdale TS
Lisgar TS Slater TS Clarence DS
Manordale MTS A6R
M5G
Centre Point Richmond MTS Wendover DS
A3RM OHGS
MTS
C7BM Merivale Uplands MTS NAE TS A3RM
MTS Hawkesburry MTS
F10MV Hawthorne
Lincoln A8M A8M DESN
Heights TS IPB Masson
Woodroffe TS Hinchey TS Merivale TS
V12M Hawthorne TS Masson
X522A
M1R To
L2M Ivaco CTS
Lennox
South X523A Longueuil TS
Limebank
MTS Gloucester
DS
Marionville D5A B5D To IPB
Greely DS
DS Beauharnois
Russell DS
Kanata MTS
St. Isidore TS
M31A A41T
C3S M32S Outaouais
Chat Falls GS M30A A42T IPB Masson
To St.. Lawrence
South March TS Nepean TS L24A TS
Albion TS Ellwood MTS
To M29C
Cherrywood
Almonte TS Terry Fox MTS 115kV
Figure 3-4 Greater Ottawa Region – Electrical Supply
230kV
500kV
21Greater Ottawa – Regional Infrastructure Plan 2 Dec 2015
4. TRANSMISSION FACILITIES COMPLETED
OVER LAST TEN YEARS OR CURRENTLY
UNDERWAY
OVER THE LAST 10 YEARS A NUMBER OF TRANSMISSION PROJECTS
HAVE BEEN COMPLETED, OR ARE UNDERWAY, AIMED AT IMPROVING
THE SUPPLY TO THE GREATER OTTAWA REGION IN GENERAL AND THE
CITY OF OTTAWA IN PARTICULAR.
These projects were identified as a result of either: joint Hydro One, IESO and Hydro Ottawa planning
studies to meet the needs of Hydro Ottawa or Hydro One Distribution; and/or, to meet provincial
government policies. A brief listing of the completed projects over the last 10 years is given below:
Hawthorne TS x Gamble Junction double circuit 230 kV Overhead line (2008) – the single 115 kV
circuit H9A was rebuilt as a two circuit 230 kV tower line with increased capacity. Connect Cyrville
MTS (2008) – connected new Hydro Ottawa owned Cyrville TS to 115 kV circuits A4K and A2.
Hawthorne TS x Outaouais TS double circuit 230 kV line (2009) – built to provide up to 1250MW of
transfer capability with Hydro Quebec as part of the new HVDC interconnection.
Connect Ellwood MTS (2012) – connected new Hydro Ottawa owned Ellwood TS to 230 kV circuits
M30A and M31A.
Connect Terry Fox MTS (2013) – connected new Hydro Ottawa owned Terry Fox MTS to 230 kV
circuit M29C.
Hawthorne TS 115 kV switchyard Upgrade (2014) – replaced 115 kV breakers with inadequate short
circuit capability with new breakers of higher short circuit capability. This work improved system
reliability by allowing 115kV switchyards to be operated with bus tie closed. This work also
facilitated incorporation of DG in the Ottawa area.
Build new Orleans TS (2015) – built a new step-down transformer station in East Ottawa supplied
from 230 kV circuit D5A and 115 kV circuits H9A. This station will provide additional load meeting
capability to meet Hydro One Distribution and Hydro Ottawa requirements. It will also provide
improved reliability for Hydro One Distribution customers in the Orleans-Cumberland area.
Hinchey TS (2015) – Connect idle winding of transformer T1/T2 to new Hydro Ottawa metalclad
switchgear.
The following projects are currently underway:
Add 230 kV inline breaker on 230 kV circuit M29C at Almonte TS (2015) – to improve reliability of
supply for Almonte TS and Terry Fox MTS.
Replace 45/75 MVA, 115/13.2 kV step down transformers with new 60/100 MVA, 115/13.2 kV at
Overbrook TS (2017) – the existing transformers are at end-of-life and the new replacement
transformers have a higher rated capacity and will provide additional load meeting capability.
22Greater Ottawa – Regional Infrastructure Plan 2 Dec 2015
Replace 225 MVA, 230/115 kV autotransformers T5 and T6 at Hawthorne TS with new 250 MVA,
230/115 kV autotransformers (2018) – the existing transformers have inadequate capacity and were
identified and recommended for replacement during the IRRP phase for the Ottawa Sub-Region [1].
Replace 50/83 MVA, 230/44 kV step down transformers with new 75/125 MVA, 230/44 kV units at
Hawthorne TS (2019) – the existing transformers are at end-of-life and the new replacement
transformers have a higher rated capacity and will provide additional load meeting capability.
23Greater Ottawa – Regional Infrastructure Plan 2 Dec 2015
5. FORECAST AND OTHER STUDY ASSUMPTIONS
5.1 Load Forecast
The load in the Greater Ottawa Area is forecast to increase at an average rate of approximately 2.25%
annually up to 2020, at 0.96% between 2020 and 2025 and at 0.45% beyond 2025. The growth rate varies
across the Region with most of the growth concentrated in the Ottawa Sub-region.
3000
2500
2000
MW
1500 Coincident
Non‐Coincident
1000
500
0
2015 2020 2025 2030 2035
Figure 5-1 Greater Ottawa Region Summer Extreme Weather Peak Forecast
Figure 5-1 shows the Greater Ottawa Region extreme weather peak summer coincident and non-
coincident load forecast. The coincident forecast represents the sum of the peak load at the time of the
region’s peak load and represents loads that would be seen by the autotransformer stations and is used to
determine the need for additional auto-transformation capacity. The non-coincident forecast represents the
sum of the individual stations peak load and is used to determine the need for stations and line capacity.
Coincident and Non-coincident load forecasts for the individual stations in the Greater Ottawa Region are
given in Appendix A.
The RIP load forecast was developed as follows:
RIP Working Group participants confirmed that the load forecast, CDM, and DG information
used in the IESO’s 2015 IRRP for the Ottawa Sub-Region[1] and Hydro One’s 2014 NA [2] was
still valid and there were no changes.
The station coincident loads used in the RIP are as given in the IRRP for Ottawa Sub-Region and
NA for the Outer Ottawa Sub-Region. The coincident loading is used for evaluating the adequacy
of bulk transmission circuits and the 230/115kV autotransformers.
24Greater Ottawa – Regional Infrastructure Plan 2 Dec 2015
Stations non-coincident load forecast was developed using the summer 2015 actual peak load
adjusted for extreme weather and applying the station net growth rates as identified in the IRRP
and NA. The non-coincident forecast is used to determine adequacy of station capacity. The net
growth rate accounts for CDM measures and connected DG. Details on the CDM and connected
DG are provided in the IRRP [1] and NA for Ottawa Sub-Region [2] and are not repeated here.
5.2 Other Study Assumptions
The following other assumptions are made in this report.
The study period for the RIP Assessments is 2015-2025.
All planned facilities for which work has been initiated and are listed in Section 4 are assumed to
be in-service.
Summer is the critical period with respect to line and transformer loadings. The assessment is
based therefore based on summer peak loads.
Station capacity adequacy is assessed by comparing the non-coincident peak load with the
station’s normal planning supply capacity, assuming a 90% lagging power factor for stations
having no low-voltage capacitor banks and 95% lagging power factor for stations having low-
voltage capacitor banks. Normal planning supply capacity for transformer stations in this Sub-
Region is determined by the summer 10-Day Limited Time Rating (LTR).
Adequacy assessment is conducted as per ORTAC.
25Greater Ottawa – Regional Infrastructure Plan 2 Dec 2015
6. ADEQUACY OF FACILITIES AND REGIONAL
NEEDS OVER THE 2015-2025 PERIOD
THIS SECTION REVIEWS THE ADEQUACY OF THE EXISTING
TRANSMISSION AND DELIVERY STATION FACILITIES SUPPLYING THE
GREATER OTTAWA REGION AND LISTS THE FACILITIES REQUIRING
REINFORCEMENT OVER THE NEAR AND MID-TERM. NO LONG TERM
NEEDS HAVE BEEN IDENTIFIED.
Within the current regional planning cycle two regional assessments have been conducted for the Greater
Ottawa Region. The April 2015 Ottawa Sub-Region IRRP report [1] was prepared by the IESO in
conjunction with Hydro One and Hydro Ottawa. The July 2014 Outer Ottawa Sub-Region NA report [2]
was prepared by Hydro One and considered the remainder of the Greater Ottawa region.
The IRRP [1] and NA [2] planning assessments identified a number of regional needs to meet the area
forecast load demand over the near to mid-term between 2015 and 2025. These regional needs are
summarized in Table 6.1 and include needs for which work is already underway and/or being addressed
by an LP study. A detailed description and status of work initiated or planned to meet these needs is given
in Section 7.
A review of the loading on the transmission lines and stations in the Greater Ottawa Region was also
carried out as part of the RIP report. Sections 6.1 to 6.3 present the results of this review. Additional
needs identified as a result of the review are also listed in Table 6-1.
26Greater Ottawa – Regional Infrastructure Plan 2 Dec 2015
Table 6-1 Near and Mid-Term Regional Needs
Type Section Needs Timing(4)
Needs identified in IRRP [1] and NA [2]
7.1 Hawthorne TS T5 and T6 – LTR(1) exceeded 2018(2)
230/115kV Transformation Capacity
7.2.1 Merivale TS T22 - LTR(1) exceeded 2019
7.2.2 S7M Circuit – Capacity 2019 and 2026
Transmission Circuit Capacity
7.3 A4K Circuit - Capacity 2019(2)
7.4 Center 115kV Area - Capacity 2017-2021(3)
7.5 Hawthorne TS T7 and T8 – LTR(1) exceeded 2019
Station Capacity
7.2.2 South West Area - Capacity 2020
7.6 Bilberry Creek TS - Refurbishment 2023
7.7 Almonte TS/Terry Fox MTS - Reliability 2015
7.8 Orleans TS - Reliability No plan recommended(5)
Supply Security, Reliability and Restoration 7.9 B5D+D5A Circuits – Restoration No plan recommended(5)
7.10 Load Loss for S7M Contingency No plan recommended(5)
7.11 79M1 Circuit – Voltage Regulation 2023
Voltage Regulation 7.12 Stewartville TS – Voltage Regulation No plan recommended(5)
7.13 Almonte TS/Terry Fox MTS –Voltage Regulation No plan recommended(5)
7.14 Almonte TS – Low Power Factor No plan recommended(5)
Additional Needs identified in RIP
7.2.1 Merivale TS T22 and Hawthorne TS T9 – Continuous 2024/25
ratings exceeded
7.4.2.4 King Edward TS – Capacity 2021
(1)
LTR – Limited time ratings to accommodate emergency loading for a short time under contingency conditions
(2)
Projects have been initiated.
(3)
Miscellaneous stations. Some are already in execution.
(4)
Timing shows the proposed in service date for project underway, and the need date for the projects not yet started.
(5)
Review did not recommend plan for mitigation. Please see the need details in Section 7.
27Greater Ottawa – Regional Infrastructure Plan 2 Dec 2015
6.1 500 and 230 kV Transmission Facilities
All 500 kV and 230 kV transmission circuits in the Greater Ottawa Region are classified as part of the
Bulk Electricity System (“BES”). They connect the Region to the rest of Ontario’s transmission system
and to the Hydro Quebec transmission system. A number of these circuits also serve local area stations
within the region and the power flow on them depends on the bulk system transfers as well as local area
loads. These circuits are as follows (refer to Figure 3-4):
1. Hawthorne TS to Merivale TS 230 kV transmission circuits M30A/M31A – supply Albion TS and Ellwood TS.
2. Hawthorne TS to Cornwall 230 kV transmission circuits D5A/B5D/B31L – supply Orleans TS, St. Isidore TS
and Longueuil TS. Also connects to Hydro Quebec at Beauharnois Station and to Lievre Power at Masson GS.
3. Merivale TS to Chats Falls 230 kV transmission circuits M32S/C3S – supply Nepean TS, South March TS and
Kanata MTS
4. Merivale TS x Cherrywood TS 230 kV transmission circuits E29C/E34M (M29C) – supply Terry Fox MTS and
Almonte TS.
Based on current forecast station loadings and bulk transfers, the M30A/M31A circuits will require
reinforcement by 2020. The M30A/M31A upgrade will be addressed by Hydro One based on the
recommendation stemming from an IESO Bulk System Planning study [6]. All other 230 kV circuits are
expected to be adequate over the study period.
6.2 230/115 kV Transformation Facilities
Almost sixty percent of the Region load is supplied from the 115 kV transmission system. The primary
source of 115 kV supply is from 230/115 kV autotransformers at Hawthorne TS and Merivale TS.
Additional support is provided from 115 kV generation at Barrett Chute GS, Stewartville GS, part of
Chats Falls GS, and the Ottawa Health Science NUG and the Ottawa River generation at Chaudière.
Support from DG and CDM was considered as part of the load forecast.
Table 6-2 summarizes the results of the adequacy studies and gives the need dates for reinforcement of
the 230/115 kV autotransformer facilities at Hawthorne TS and Merivale TS. Assuming no change in the
system configuration, the forecasted loading will result in the Limited Time Rating (“LTR”) of the
Merivale autotransformer being exceeded by 2019 and the continuous rating of the Merivale and
Hawthorne autotransformers by 2024/25.
The need dates are sensitive to the availability of hydraulic generation from Barrett Chute GS,
Stewartville GS and Chats Falls GS and are based on 98% dependable generation availability as per
ORTAC criteria. This corresponds to about 18 MW of available generation. A higher level of generator
output from these stations would defer the need dates.
28Greater Ottawa – Regional Infrastructure Plan 2 Dec 2015
The need dates assume that the Hawthorne TS 225 MVA, 230/115 kV autotransformers T5 and T6 have
been replaced with new 250 MVA units. The T5 and T6 replacement work is underway and is therefore
not identified in the table below.
Table 6-2 Adequacy of 230/115 kV Autotransformer Facilities
2015 MVA MVA Load Meeting Limiting Need
Overloaded Facilities
Loading Capability Contingency Date
Merivale TS 230/115kV
261 312(1) T21 2019
autotransformer T22
Merivale TS 230/115kV (2)
182 250 2024
autotransformer T21
Hawthorne TS 230/115kV (2)
189 250 2025
autotransformer T9
(1)
Limited time rating exceeded.
(2)
Continuous rating exceeded with all elements in service based on existing system configuration
6.3 115 kV Transmission Facilities
The Greater Ottawa Region 115 kV transmission facilities can be divided in five main sections: Please see
Figure 3-4 for the single line diagram.
1. Hawthorne 115 kV Center – has four circuits A3RM, A4K, A5RK and A6R. Reinforcement is
required for the A4K circuit as a loss of the A5RK circuit would result in the loading exceeding the
rating on the A4K circuit between Hawthorne TS and Moulton MTS (for details see Section 7.3).
2. Hawthorne 115 kV East – has two circuits A2 and H9A/79M1. These are expected to be adequate
over the study period.
3. Merivale 115 kV Center – has two circuits M4G and M5G. These are expected to be adequate over
the study period.
4. Merivale 115 kV West – has five circuits C7BM, F10MV, S7M, V12M and W6CS. Upgrading is
required of the S7M tap to Fallowfield TS since forecasted loading will exceed circuit continuous
rating (for details see section 7.4)
5. Merivale 115 kV South – has two circuits L2M and M1R. These circuits are adequate for the study
period.
The loading on the limiting sections is summarized in Table 6-3.
29Greater Ottawa – Regional Infrastructure Plan 2 Dec 2015
Table 6-3 Adequacy of 115 kV Circuits
Corridor Section Overloaded Rating Contingency 2015 Need Date
Circuit (A) Loading
(A)
1. Hawthorne TS Hawthorne TS x A4K 1070 A5RK 1006 2017
x Blackburn Moulton TS
Jct. x
Overbrook TS
4. S7M tap to STR R14-R15 x S7M 590 All facilities in- 278 2024
Fallowfield Fallowfield service(1)
MTS Jct.(2)
(1)
Continuous rating exceeded.
(2)
Please see Figure 7-4.
6.4 Step-Down Transformation Facilities
There are a total of fifty-two step-down transmission connected transformer stations in the Greater Ottawa
Region. The stations have been grouped based on the geographical area and supply configuration. The
non-coincident station loading in each area and the associated station capacity and need date for relief is
provided in Table 6-4 below. As shown areas requiring additional transformation capacity are the Center
115kV area, the South West 115kV area and the South 115kV area. Table 6-5 shows the non-coincident
station loads for all areas which are adequate over the 2015-2025 study period. Details of the areas and
associated stations are given in Appendix B.
Table 6-4 Adequacy of Step-Down Transformer Stations - Areas Requiring Relief
Area/Supply Capacity (MW) 2015 Loading Need Date
(MW)
Center 115 569(1) 516 2018
South West 115 70 60 2019
South 115 182 151 2024
(1)
With Overbrook TS 45/75 MVA transformers replaced with larger 60/100 MVA units.
30Greater Ottawa – Regional Infrastructure Plan 2 Dec 2015
Table 6-5 Adequacy of Step-Down Transformer Stations – Areas Adequate
Area/Supply Capacity (MW) 2015 Loading 2025 Loading
(MW) (MW)
East 115 340 231 229
West 115 504 351 425
Center 230/13.2kV 147 121 126
Center 230/44kV 153(1) 103 136
West 230 397 382 389
Outer East 115 80 56 62
Outer West 115 106 83 96
Outer East 230 149(2) 92 90
Outer West 230 100 48 45
(1)
With Hawthorne TS 50/83 MVA transformers replaced with larger 75/125 MVA size units.
(2)
Includes Longueuil TS and St Isidore TS load.
31Greater Ottaawa – Regional Infrastructure
I Pllan 2 Dec 2015
7. REGION
R NAL PL
LANS
This section discusses needs, presen nts wires alterrnatives and th
the current preeferred wires solution for
addressingg the electricaal supply needds for the Greeater Ottawa R
Region. Thesse needs are liisted in table 6-1
and includ
de needs prev RRP for the Otttawa Sub-Reegion [1] and thhe NA for thee
viously identiffied in the IR
Outer Ottaawa Sub-Reg gion [2] as welll as the adequ
uacy assessmeent carried ouut as part of thhe current RIP
P
report.
7.1 Hawthorne
H Autotransfo
A ormer T5 an
nd T6
7.1.1 Descriptio
on
Hawthorn ne TS is a majjor supply poiint for the city
y of Ottawa ((Figure 7 -1). The station hhas four
230kV/11 15 kV autotran nsformers. Twwo of these au utotransformeers, T5 and T
T6, have lowerr ratings, withh 225
MVA con ntinuous and 256
2 MVA LT TR, respectiveely. Under co ntingency connditions, i.e. one of the
autotransfformers out of service, the ratings of theese two autotrransformers aare exceeded and this limitts the
supply to the 115 kV network
n from the 230 kV sy ystem. As thee load continuues to grow oon the 115 kV
V
network, this
t limitation n needs to be addressed. Th his had been identified as a near term nneed in the Otttawa
Sub-Regio on IRRP [1] an
nd was includded in the Onttario Power AAuthority’s (““OPA”, now ppart of IESO)) June
[5]
2014 letteer to Hydro One
O .
Hawthorne TS
Figure 7-1
7 Hawthornee TS
32Greater Ottaawa – Regional Infrastructure
I Pllan 2 Dec 2015
7.1.2 Recommeended Plan and
a Curren
nt Status
Hydro On ne has establisshed a projectt to replace au
utotransformeers T5 and T66 with new hiigher rated
autotransfformers. Thesse autotransfo
ormers will haave an LTR oof at least 3500 MVA. This iinvestment w will
provide addditional capaacity and meeet the needs of
o the area. It iis expected thhat the projecct will be
completedd in 2018.
The cost of
o this projectt is expected to
t be $15.7 million.
m The prroject will bee a transmissioon pool
investmennt as the autottransformers provide
p supplly to all custoomers in the G
Greater Ottawwa Region.
7.2 Autotransform
mation Capa
acity and So
outh West A
Area Station
n Capacity
7.2.1 Merivale TS
T Autotransformers T21
T and T2 2/Hawthorn
ne Autotran
nsformer T99
Merivale TS has two 2302 kV/115 kV V autotransfo
ormers with ann LTR stationn capacity of 312 MVA. TThe
station is supplied from
m Hawthorne TS and from generators loocated west of Ottawa, alonng the Ottawaa
River and d the Madawaaska River. Merivale TS is shown in Figgure 7-2.
Meriivale TS
Figure 7-2 Merivale TS
The expeccted load grow wth provided by the LDCss and the miniimum hydro ggeneration assumption
described in Section 6.2 causes the station
s capaciity to be exceeeded under ccontingency conditions by 2019.
In addition, it is expectted that autotrransformers at
a Merivale TS S and Hawthoorne TS will reach their
continuouus loading limmits of 250 MV a 2025. Th e exact timingg of the autottransformer nneeds
VA by 2024 and
is dependent on the folllowing factorrs:
33Greater Ottawa – Regional Infrastructure Plan 2 Dec 2015
The South West area load forecast includes a proposed connection of a single large load increase
coming into service in 2019.
The need date is sensitive to generation at Stewartville GS, Barrett Chute GS and Chats Falls GS
as its effect is to reduce the flow through the autotransformers.
A potential solution to the need for additional supply capacity in the South West Area is a new
230 kV supply station which would remove some of the demand growth and existing load from
the 115 kV network (see Section 7.2.2 for a complete description of this issue). This work would
also help defer the need for additional autotransformer capacity at Merivale TS.
In order to address the Merivale TS autotransformer capacity concerns, additional 230/115 kV
transformation capacity or load transfer from the 115 kV to the 230 kV system is required.
The provision of additional transformation capacity requires replacing the Merivale TS T22
autotransformer with a newer higher rated transformer in 2019 and adding a third autotransformer at the
station in 2024. Alternatively a third transformer can be added at Merivale TS by 2019. To meet the
required 2019 need date a decision on the autotransformer work is required by summer 2016.
Transferring load to the 230kV system requires establishing a new 230/27.6kV transformer station in the
South West area to pick up some of the existing load and all of the new load growth. This is described in
the following section.
7.2.2 Supply to South West Area – Line and Station Capacity
The South West area is served by Fallowfield MTS, Richmond MTS and Manotick DS connected to the
115kV circuit S7M out of Merivale TS. Load demand in the area is expected to increase by 52 MW in the
next 10 years and both the line and station capacity are forecast to be exceeded by 2019.
The line limitation was identified in the OPA’s June 2014 letter [5] to Hydro One. A section of the S7M
circuit between the main line at STR R14-R15 JCT and Fallowfield Junction (see Figure 7-3 below) had a
capacity of 420A. Hydro One review of the line capacity showed that the line rating was limited to
respect safety clearances due to an underbuilt distribution feeder at Fallowfield MTS. This issue has been
resolved with Hydro Ottawa carrying out the necessary work to lower the distribution feeder and increase
the transmission line clearance. The line rating has been increased to 590A and is now adequate to meet
forecast load until 2026.
Additional transformation capacity is required in the South West Area and both Fallowfield MTS and
Richmond DS require load relief. Hydro Ottawa is planning for a capacity increase at Richmond DS and
potentially a new station to relieve Fallowfield MTS in the Barrhaven area.
The IESO has initiated a public engagement process to gather community input for a preferred supply
plan for the area including consideration of the potential for incremental CDM and DG resources and/or
transmission expansion in the form of a new TS. The IRRP [1] recommended that given the required
34You can also read