Interaction of a Low-Pressure System, an Offshore Trough, and Mid-Tropospheric Dry Air Intrusion: The Kerala Flood of August 2018 - MDPI
←
→
Page content transcription
If your browser does not render page correctly, please read the page content below
atmosphere
Article
Interaction of a Low-Pressure System, an Offshore
Trough, and Mid-Tropospheric Dry Air Intrusion:
The Kerala Flood of August 2018
Vinay Kumar 1, * , Prabodha Kumar Pradhan 2 , Tushar Sinha 1 , S. Vijaya Bhaskara Rao 2 and
Hao-Po Chang 1
 1   Department of Environmental Engineering, Texas A&M University, Kingsville, TX 78363, USA;
     tushar.sinha@tamuk.edu (T.S.); hao-po.chang@students.tamuk.edu (H.-P.C.)
 2   Department of Physics, Sri Venkateswara University, Tirupati 517502, India;
     prabodhakumar@gmail.com (P.K.P.); svbhaskarrao@svuniversity.ac.in (S.V.B.R.)
 *   Correspondence: vinay.kumar@tamuk.edu

 Received: 28 May 2020; Accepted: 9 July 2020; Published: 13 July 2020

 Abstract: The present study examines the Kerala Flood Event (KFE, 15–16 August 2018, in India)
 that occurred along the west coast of India and resulted in ~400 mm of rainfall in one day. The KFE
 was unique in comparison to previous floods in India, not only due to the rainfall duration and
 amount, but also due to the fact that the dams failed to mitigate the flood, which made it the worst in
 history. The main goal of this study is to analyze and elucidate the KFE based on meteorological
 and hydrological parameters. A propagating low-pressure system (LPS) from the Bay of Bengal
 (BoB) caused the streak of plenty of rainfall over Kerala, the west coast, central India, and the BoB.
 Additionally, the upper-tropospheric anti-cyclonic system over the Middle East region inhibited a
 northward advancement of LPS. On the western coast of India, a non-propagating (with diurnal
 fluctuations) offshore trough was observed over the west coast (from Kerala to Gujarat state).
 Therefore, a synergic interaction between LPS, an intrusion of dry air in the middle-troposphere, and
 the offshore trough was the main reason for KFE. However, after around ten days, rainfall saturated
 the dam capacities; thus, the released water, along with the amount of precipitation on the day of the
 event, was one of the other possible reasons which worsened the flood over Kerala.

 Keywords: Kerala Flood Event; off-shore trough; low-pressure systems

1. Introduction
      The quantity and availability of surface precipitation play important roles not only in
hydrometeorology, but also in water resource management. Be it irrigation, agriculture, controlling
floods, coping with droughts, or administering a freshwater supply, the timely assessment of events is
vital to answering critical questions, such as when, where, and how much will it rain. Over the Indian
subcontinent, the northward propagation of the monsoon and surface rainfall amounts are governed by
remote teleconnections and internal dynamics of the monsoon itself [1]. During the summer monsoon,
extreme flood events have significant social, economic, ecological, environmental, hydrological, and
health impacts on regional and local communities. Therefore, the sudden kick-off of a natural disaster
requires a detailed prioritization list of flood forecasts, assessments of the damages, risks, and improved
management of floods. July and August are the rainiest months in India, and bring moderate to plenty
of rainfall and sometimes floods over various parts of India. Recently, the state of Kerala (in India)
witnessed the worst flooding of the century, which occurred from 15 to 16 August in 2018. The flood
destroyed thousands of houses, leading to about 500 deaths, inundated water in cities and villages,

Atmosphere 2020, 11, 740; doi:10.3390/atmos11070740                        www.mdpi.com/journal/atmosphere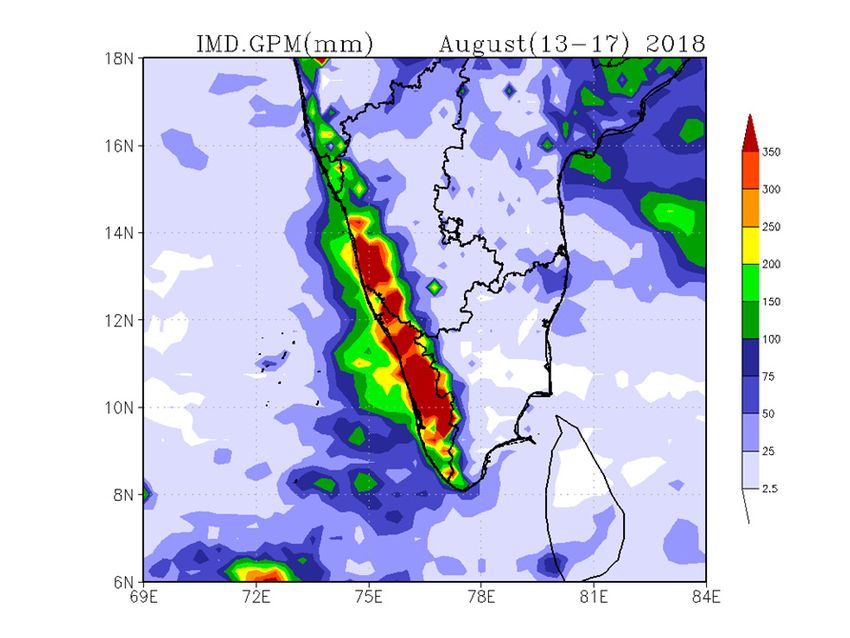
Atmosphere 2020, 11, 740                                                                             2 of 21

collapsed bridges, and severely damaged communications [2]. The impact of the Kerala Flood Event
(KFE) was much more severe in the following districts in Kerala: Idukki, Palakkad, Kollam, Kottayam,
Malappuram, Ernakulam, and Pathanamthitta. The damages that occurred during the KFE were so
severe that restoration facilities were obtained from various parts of India and transported to Kerala
state. After the flood, in the last week of August, drought and a high temperature took over the Idduki
district, where the water levels in the wells were reported to have fallen by 20 feet (from various online
websites, e.g., Business Insider and Swarajyamag).
     Extreme weather events are associated with low-pressure systems, cloud bursts, cyclones, and
landslides, which have significant socioeconomic impacts [3,4]. However, over India, low-pressure
systems (LPS) embedded in mean monsoonal flow produce abundant rainfall over land and oceanic
regions; almost every year, LPS remains a leading cause of the flood. The KFE region is located along
the orography of the western coast (~2.5 km height) of India. The torrential rainfall that occurred during
the KFE caused landslides in the mountain regions and loosened soil in the hill slopes. Flash floods
collect mud and debris along their way to the river.
     Several research works have appeared on KFE, considering various aspects of this flood, e.g.,
hydrology [5–7], natural disasters [8], meteorological modeling [9], and a climate change perspective [10].
They have analyzed rainfall data of more than 100 years and used generalized extreme value
distributions [5,6]. They have presented a return period of 1 to 3 days of extreme rainfall and
contributions of dams in KFE. In terms of the analysis of hydrological datasets for the Periyar basin,
the probability of such extreme rainfall in August is quite low, with a value of 0.6% over Kerala [7].
Kerala state has almost seven river basins (Achencoil River, Bharathappuzha, Ithikkara, Karuvannur,
Karamana, Manimala, Muvattupuzha, Pallikkal and Kallada, and Periyar). A dataset obtained from
the Sentinel-2A satellite and the modified normalized difference water index demonstrated that the
water was lodged in the low-lying coastal area of Kerala based on [8].
     Furthermore, the role of monsoonal depression over the Bay of Bengal (BoB), mid-tropospheric
moisture transport, and the modeling of vorticity have been used to explain features of Kerala floods [9].
A recent study hinted at a possible increase in flooding events over the Kerala region in the future,
based on climate projections and scenarios [10]. All of the studies, as mentioned above, were either
limited to a smaller portion of the flood region or considered other aspects of the flood than we
elucidate here. Additionally, the present study used high-resolution rainfall station datasets to explain
rainfall over a larger area of the flood and considered other crucial atmospheric factors to explain KFE,
in order to draw unique conclusions.
     We will now revisit some of the well-known flood events of India, other than KFE, and their
causes and details. The Mumbai flood (~900 mm/day), which occurred on 26 July 2005, is a widely
known example of extreme rainfall which drew the attention of the Indian community and researchers.
The eastward movement and intensification of the offshore trough is considered to be one of the
main reasons for this flood [11]. Floods, followed by continuous heavy precipitation for days (1 or
2 days), remain the costliest natural disasters in India, such as the Uttarakhand flood (15 June 2013,
~400 mm/day), Jammu and Kashmir (J&K) flood (5 September 2014, ~200 mm/day), and Chennai flood
(2 December 2015, ~350 mm/day) [12–16]. In the case of Uttarakhand’s flood, the moisture supply
was the result of a combined contribution from nearby water bodies, the Arabian Sea, and the Bay of
Bengal. A fast-moving LPS and Himalayan orographic effect played an essential role in this flood [17].
Extreme rainfall events in the orographic region may be attributed to cloud burst, e.g., the Leh flood
(6 August 2010, ~150 mm/day) [18]. Some extreme rainfall events are the result of scale interactions
between several events, e.g., a synoptic scale, mesoscale, large scale, and LPS [15]. In most flood events,
LPS and it’s interactions with other local systems remain a crucial reason for the occurrence of floods.
The KFE of 2018 attracted attention from the media, scientific community, and policymakers, because it
was one of the worst floods of the century over Kerala [5]. Due to continuous rainfall over the Western
Ghats, major dams in Kerala reached full capacity before the KFE [5]. Furthermore, it has been noted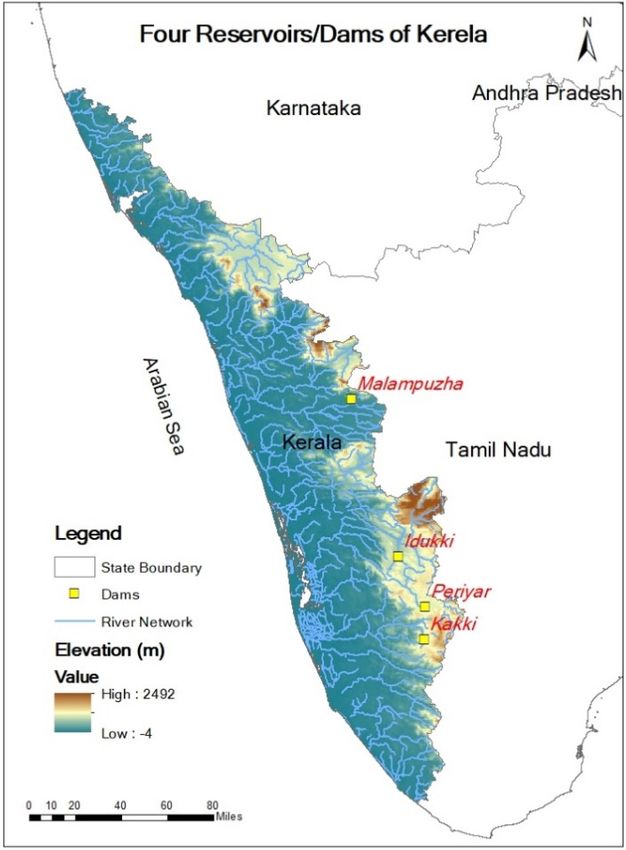
Atmosphere 2020, 11, 740                                                                            3 of 21

that during the active southwest monsoon season, heavy rainfall events (HREs) along the west coast of
India cause flash floods; such floods are the most common natural disasters of the region [19].
      To study HREs, over the west coast of India, during the monsoon season, a field experiment, namely
ARMEX-I (Arabian Monsoon Experiment, Phase I), was performed by the Indian Climate Research
Programme (ICRP), Govt. of India [20]. As part of the ARMEX-I (observational data that was collected
from June to August in 2002), particular observations were collected to study the HREs associated with
synoptic systems, such as offshore troughs, strong low-level jets, and low-pressure-systems [21–25].
Several modeling studies on HREs along the west coast, notably the Mumbai flood case, have been
reported [22,26]. These studies suggest that mesoscale model techniques have commendable skills
for simulating the HREs 48 h in advance. Around 80% of intense rainfall events along the west coast
of India are associated with offshore troughs [12,19,20,27,28], strong cross-equatorial flow over the
Arabian Sea [29], and the low-pressure system over the Arabian Sea near the Gujarat and Maharashtra
coast [30]. Other well-known low-pressure systems that form over BoB and move inward across land
along the monsoonal trough-lane are parts of the monsoonal system [31]. Among the many dynamic
features of a monsoon, strong cross-equatorial flow in the lower troposphere, widely known as the
low-level monsoon jet, plays a vital role in the Indian summer monsoon rainfall (ISMR), which occurs
during June–September [32]. All extreme rainfall events are diverse in their initiation, spread, and
impacts. In recent work, it has been speculated that a rise in the surface temperature and moisture over
orographic regions favors flood events, due to an increase in convective available potential energy [33].
Many stations in west coast regions have exhibited a rise in temperature in the last 100 years [34].
      Some of the valid questions that can be raised regarding KFE are as follows: Did intensification of
the offshore trough, LPS over BoB, and mid-tropospheric dry air intrusion air from the Middle East
region trigger extreme precipitation over the Kerala region? Did the release of water from dams add fuel
to KFE? Furthermore, what were the favorable conditions for the serial clustering of convection along
the west coast of India? Can the strength of the monsoonal kinetic energy, net-tropospheric moisture,
and mean tropospheric temperature field across BoB, the Arabian Sea, and the Indian monsoon zone
play any crucial role in the enhancement of the convection over Kerala? Is there a synergic role of
the interaction of LPS, the offshore trough, and mid-tropospheric dry air intrusion from Middle East
regions for KFE? Such probable issues associated with KFE are analyzed and discussed in this research.
Furthermore, the present research work addresses the regional and dominant features of the synoptic
conditions over the Indian subcontinent. As a whole, this study tried to fill the gap in the understanding
of the interaction between monsoonal LPS, the offshore trough, and other regional features.

2. Data and Methodology
     The daily rainfall dataset from the Global Precipitation Measurement (GPM) satellite, Indian
Meteorological Society (IMD) rain gauge in-situ datasets, and the IMD + TRMM (Tropical Rainfall
Measuring Mission) merge rainfall dataset were used in this study [35]. GPM is a constellation-based
satellite mission specifically designed to provide a new generation of observations of rainfall and
snowfall from space to improve our understanding of Earth’s water and energy cycle and has
been in operation since 28 February 2014. These datasets provide near real-time precipitation at a
spatial-temporal resolution of 25 × 25 km horizontal resolutions. Furthermore, the Indian Meteorological
Society’s satellite products (esp. the water vapor channel) were used to study the synoptic features
of KFE. These datasets were used for understanding the dynamic characteristics of the convective
systems that caused severe rainfall along the west coast of Kerala state.
     INSAT-3D images are an improved design of the Very High-Resolution Radiometer (VHRR-2)
capable of generating images of the Earth in six wavelength bands. These images are available in
visible, shortwave infrared, middle infrared, water vapor, and two bands in thermal infrared regions.
They offer an improved 1-km resolution in the visible band for the monitoring of mesoscale phenomena
and severe local storms [36]. For KFE, we used water vapor and thermal infrared bands to understand
the synoptic features and convection. To address the issues involving the dynamics of HREs during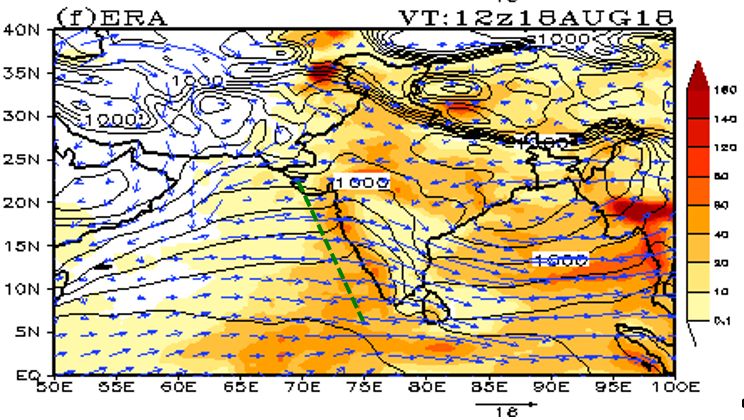
Atmosphere 2020, 11, 740                                                                             4 of 21

KFE, we used the European Centre for Medium-Range Weather Forecast (ECMWF) ERA-Interim
reanalysis of the global atmosphere covering the data-rich period since 1979 (https://apps.ecmwf.int).
The ECMWF reanalysis (ERA-Interim) dataset [37], along with ground-based and satellite observations,
were used in this study. The ERA-Interim reanalysis uses a state-of-the-art model with four-variational
data assimilation (4DVAR) scheme. The datasets have high spatial resolutions and are easy to access
for use in research.
     Additionally, these ERA-Interim meteorological variables are available at a T255 resolution, but
we optimally interpolated all required variables at a 25 × 25 km horizontal resolution. The data on
runoff was obtained from ECMWF reanalysis. Data for the flooded water for Kerala’s dam were
acquired from http://tamcnhp.com/wris/#/waterData.

3. Overview of the Kerala Flood Event
      The daily accumulated rainfall, 850 mb wind anomalies, and track of the monsoon depression
through 13–18 August 2018 over the Indian region are portrayed in Figure 1a. The path of low pressure
is ~4◦ south of the mean position of LPS tracks (the black dashed line is the mean position of monsoon
depressions) and lasted for six days. As usual, most of the heavy rainfall is located in the southern part
of the LPS track. A low-pressure system embedded in the mean monsoon flow brings copious rainfall
to its southwest sector. Over BoB, LPS lingered for a while; thus, heavy rainfall is evident over that
area. Furthermore, it will be interesting to investigate the rainfall over west-coastal regions and Kerala,
as LPS advances westward. It has been observed that when LPS over BoB and the offshore trough
near the Gujrat region are active, then the Indian landmass receives plenty of rainfall. Some of the
prominent features of rainfall are visible over central BoB; these are extended inland along the track of
monsoonal depression, central India, and over the western coast (Figure 1a). The authors focus on
the spatial spread of rainfall over Kerala and adjoining states through 13–17 August, 2018 (Figure 1b).
The maximum accumulation of rainfall (>350 mm) was recorded over northern Kerala and southern
coastal regions of Karnataka. An adjacent state, Tamilnadu, being under the rain-shadow influence
(receives low rainfall due to the subsidence of cold and dry air), received less rainfall. A central water
commission report on the Kerala flood also recorded rainfall of 214 to 398 mm over various cities of
the Kerala districts [38]. Notably, on a single day (15 August), the recorded rainfall was more than
the climatological precipitation of August. The daily area-averaged rainfall over the Kerala region
(8◦ N–13◦ N; 74◦ E–78◦ E) is depicted in Figure 1c, which shows moderate to heavy rainfall during
8–19 August 2018, while heavy rainfall on 15 August and 16 August only. Rain-gauge rainfall (from
IMD) for some of the flood-affected cities of Kerala shows an abundant amount of rainfall (>300 mm)
on 15–16 August (Figure 1d). A previous study documented that, during active spells, the western
coast, between 14◦ N–16◦ N and 18◦ N–20◦ N, is the most favorable location of intense rainfall due
to deeper cloud systems [39]. It has been noted that the heavy rainfalls over Kerala state and the
adjoining west coast of India are associated with a quasi-stationary trough, in which a cyclonic vortex
is sometimes embedded [27].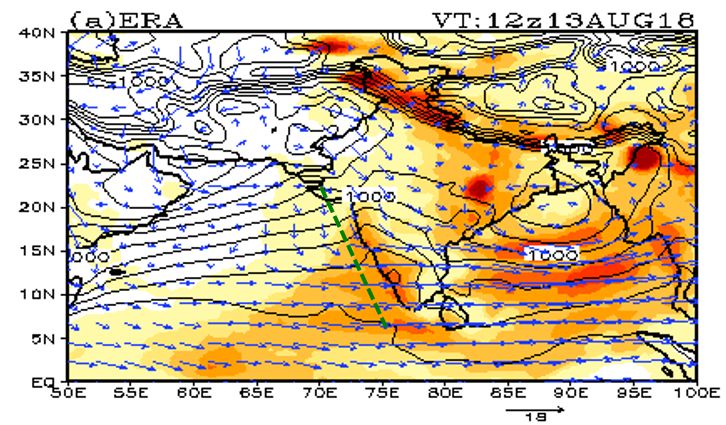
16 August only. Rain-gauge rainfall (from IMD) for some of the flood-affected cities of Kerala shows
 an abundant amount of rainfall (>300 mm) on 15–16 August (Figure 1d). A previous study
 documented that, during active spells, the western coast, between 14° N–16° N and 18° N–20° N, is
 the most favorable location of intense rainfall due to deeper cloud systems [39]. It has been noted that
 the heavy rainfalls over Kerala state and the adjoining west coast of India are associated with a quasi-
Atmosphere 2020, 11, 740                                                                           5 of 21
 stationary trough, in which a cyclonic vortex is sometimes embedded [27].

Atmosphere 2020, 11, x FOR PEER
                             (a)REVIEW                                                      (b)                       5 of 21

 Atmosphere 2020, 11, x; doi: FOR PEER REVIEW                                           www.mdpi.com/journal/atmosphere

                              (c)                                                          (d)
     Figure 1. (a) Accumulated rainfall (mm, shaded), wind anomaly (850 mb), and low-pressure system
     (LPS) track (blue line) over India during 13–18 August 2018, where the dark dashed line represents
     the mean positions of monsoon
                                monsoon depressions.      (b) Kerala state derived from Indian Meteorological
                                           depressions. (b)
              (IMD) ++Global
     Society (IMD)      GlobalPrecipitation
                                 PrecipitationMeasurement
                                                Measurement      (GPM)
                                                              (GPM)      merged
                                                                       merged     products
                                                                               products    at aat25
                                                                                                  a km
                                                                                                    25 km   resolution
                                                                                                         resolution for
     for
     13–1713–17  August
            August       2018.
                     2018.      (c) Daily
                            (c) Daily      area-averaged
                                       area-averaged       rainfall
                                                       rainfall (mm)(mm)
                                                                       overover
                                                                            the the  Kerala
                                                                                Kerala   statestate  (8◦ N–13
                                                                                                (8° N–13°   N ◦and
                                                                                                                 N and
                                                                                                                    74°
     74 ◦ E–78◦ E) during August 2018. (d) Different station rainfall over Kerala derived from an IMD rain
     E–78°   E) during August 2018. (d) Different station rainfall over Kerala derived from an IMD
     gauge during 03 UTC 15–1615–16 August
                                     August 2018
                                              2018 (stations with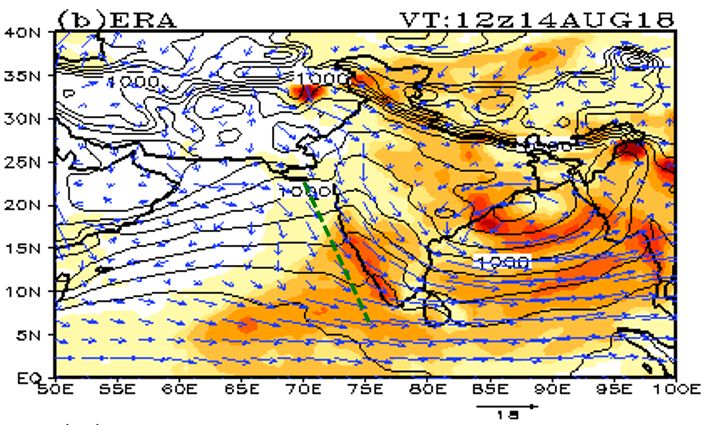
The daily mean wind flow pattern at 850 to 300 hPa levels from 13 to 17 August 2018 is displayed
in Figure 3a–t. At the 850 hPa level, wind flow characterized by strong south-westerlies (strong wind
speed within a range of 15–20 ms−1) along the west coast of India, known as a low-level jet [41], can
be seen over AS. The wind speed of the core of the low-level jet is ~20 ms−1 from 5° N to 15° N over
AS and the west coast of India. A strong dry-cold, north-westerly wind flow pattern from Middle
Atmosphere 2020, 11, 740                                                                                                    6 of 21
East countries merged over the Indian landmass, with highly moist-warm, south-westerly wind
causing unstable atmospheric conditions between the longitude of 50° E –70° E (Figures 2 and 3 and
4.2. Large
Figure    S2).and
                TheSynoptic-Scale
                      combinationSystems          Concomitantair
                                         of two contrasting       with the Kerala
                                                                     masses     in a Flood
                                                                                      boundary layer flow produces heavy
rainfall   over theJet
      Low-Level         western     coast, termed the coastal
                           (LLJ), Low-Pressure-System,               phase Trough,
                                                                  Offshore    [42]. Theand anti-cyclonic  circulation over the
                                                                                              Blocking High
Middle     East  region     and   Tibet   region   at  300 mb    served  as  the    anomalous
      During the summer monsoon LPS over BoB (at ~996 mb), the offshore trough (green            blocking   high, limiting    LPS
                                                                                                                   dashed line),
to the   south    of  the   mean     position   (black   dashed    line in   Figure    1a). On   many
and dry air intrusion from the middle-East (at 600 mb) are as displayed in Figure 2a–e. A well-organizedof  the occasions,     it is
perceived      that the
feature of ISMR,       theblocking
                             offshore high
                                         trough,produces
                                                   is visiblea in
                                                                dry
                                                                  thespell
                                                                      MSLP  of from
                                                                                 the monsoon,     droughts,
                                                                                       Kerala to the           heatwaves,
                                                                                                      Gujrat region    (Figureand  2,
floods   in  the  pre-monsoon         and   monsoon     season.   A  previous      study  advocated   that
see along the west coast of India). Besides, the intrusion of dry air from the Middle East is well-mixed    the moist   and   cold
air-mass
at 600 mbadvected
              into the LPS fromoverthethe
                                        maritime     region A
                                            Indian region.    could   be referred
                                                                 previous              to as LLJ,
                                                                            study showed       thatand  another
                                                                                                    in such        dry-cold
                                                                                                             situations,  dryair-air
mass    from    the  Middle      East  desert    could   be  referred  to  as   continental    tropical
intrusion can introduce non-uniform saturated instability to produce heavy rainfall [40]. Along with    [43].  Both  air-masses
were
LPS and observed      from trough,
            the offshore      850 to 500      hPa levels
                                        the mixing         and theair
                                                       of cold-dry    system
                                                                        from the  of different  air masses
                                                                                      Middle East             merged into
                                                                                                    and warm-moist            LPS
                                                                                                                         air from
over   the
as it is oneeastern
               of thecoast     of India
                        critical   features(Figure
                                              in the3a–d).   For the
                                                      formation       middle to uppersaturated
                                                                   of non-uniformly         troposphere,    twostatic
                                                                                                      air and    high-pressure
                                                                                                                      instability
systems     are  prominent:       one  over    the  Middle    Eastern  area    (30°   N –35  °N
that can be exploited to lead to heavy rainfall. This kind of instability is not a very common   and  50°  E –60  °E)element
                                                                                                                      and Tibet   in
region    (Figure    3d),   and   the  other   acting   as the  blocking    high    and  forcing  monsoon
the generation of flood events. The interaction between monsoon depression, the offshore trough, and          depression     to  be
limited    to the south
dry air intrusion            of the meanfor
                        is responsible        position
                                                the heavyof monsoonal
                                                             rainfall over depressions.
                                                                              Kerala state (Figure 2).

                 Accumulated total
                                total rainfall                −1 mean sea level pressure (contours), and wind
      Figure 2.
      Figure  2. Accumulated          rainfall (shaded;
                                               (shaded; mm·d
                                                          mm·d−1),),mean  sea level pressure (contours), and wind
      flow pattern
      flow  pattern at
                     atthe
                        the600
                            600hPa
                                 hPalevel
                                      level valid
                                          valid     at 00
                                                 at 00 UTCUTC on 13
                                                           on (a)   (a)August,
                                                                        13 August,
                                                                                (b) 14(b) 14 August,
                                                                                        August, (c) 15 (c) 15 August
                                                                                                       August  (d) 16
      (d) 16 August, (e) 17 August, and (f) 18 August 2018 derived from ERA-Interim reanalysis at 25 km
      resolutions. Dashed green lines indicate the position of the offshore trough.
Atmosphere 2020, 11, x; doi: FOR PEER REVIEW                                                 www.mdpi.com/journal/atmosphere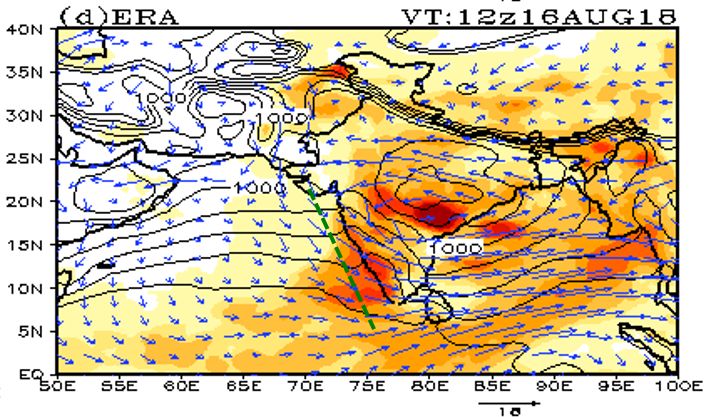
Atmosphere 2020, 11, 740                                                                           7 of 21

     The daily mean wind flow pattern at 850 to 300 hPa levels from 13 to 17 August 2018 is displayed
in Figure 3a–t. At the 850 hPa level, wind flow characterized by strong south-westerlies (strong wind
speed within a range of 15–20 ms−1 ) along the west coast of India, known as a low-level jet [41], can be
seen over AS. The wind speed of the core of the low-level jet is ~20 ms−1 from 5◦ N to 15◦ N over AS
and the west coast of India. A strong dry-cold, north-westerly wind flow pattern from Middle East
countries merged over the Indian landmass, with highly moist-warm, south-westerly wind causing
unstable atmospheric conditions between the longitude of 50◦ E–70◦ E (Figures 2 and 3 and Figure S2).
The combination of two contrasting air masses in a boundary layer flow produces heavy rainfall
over the western coast, termed the coastal phase [42]. The anti-cyclonic circulation over the Middle
East region and Tibet region at 300 mb served as the anomalous blocking high, limiting LPS to the
south of the mean position (black dashed line in Figure 1a). On many of the occasions, it is perceived
that the blocking high produces a dry spell of the monsoon, droughts, heatwaves, and floods in the
pre-monsoon and monsoon season. A previous study advocated that the moist and cold air-mass
advected from the maritime region could be referred to as LLJ, and another dry-cold air-mass from the
Middle East desert could be referred to as continental tropical [43]. Both air-masses were observed
from 850 to 500 hPa levels and the system of different air masses merged into LPS over the eastern coast
of India (Figure 3a–d). For the middle to upper troposphere, two high-pressure systems are prominent:
one over the Middle Eastern area (30◦ N–35◦ N and 50◦ E–60◦ E) and Tibet region (Figure 3d), and the
other acting as the blocking high and forcing monsoon depression to be limited to the south of the
mean position of monsoonal depressions.
     As an analogy, KFE carries a silent feature of an active monsoon viz. a high speed of LLJ, 18 ms−1
(Figure 3i), and relative vorticity of 100 × 10−6 ·s−1 (Figure S3a,b), which are way higher than the
corresponding typical values recorded during the monsoon season [30]. The west coast rainfall is
associated with the offshore trough, the interaction between TEJ and STWJ, and LPS embedded with
mesoscale bands, which are linked to the movement of a disturbance from the BoB to Indian landmass.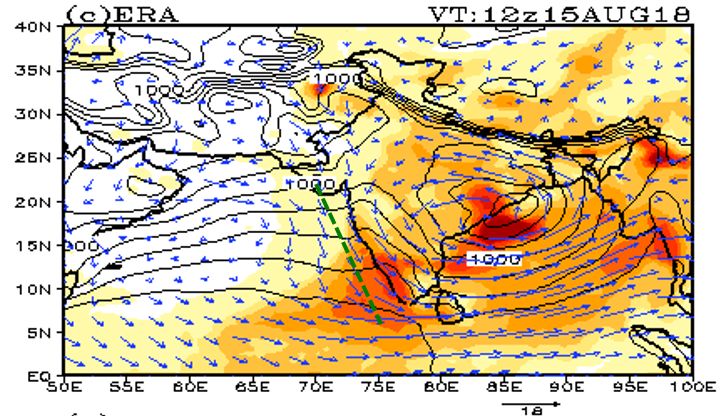
Atmosphere 2020, 11, x FOR PEER REVIEW 7 of 21
Atmosphere 11, 740
2020, (e)
August, 17 August, and (f) 18 August 2018 derived from ERA-Interim reanalysis at 25 km8 of 21
resolutions. Dashed green lines indicate the position of the offshore trough.
Figure3.3.Wind
Figure Windspeed
speed(shaded; ms−1
(shaded;ms −1) (b) 700,
and direction at (a) 850, (b) 700, (c)
(c) 500,
500, and
and (d)
(d)300
300hPa
hPalevels
levels
validat
valid at00
00UTC
UTCon on(a)
(a)13
13August,
August,2018;
2018; similarly,
similarly,(e–h,
(e–h,i–l,
i–l,m–p
m–pand
andq–t)
q–t)present
presentthe
the14,
14,15,
15,16,
16,and
and
17August
17 August2018
2018data
dataderived
derivedfrom
fromERA-Interim
ERA-Interimreanalysis
reanalysisatat25
25km
kmresolutions.
resolutions.
4.3. Role
As anof Kinetic
analogy, Energy
KFE During
carries athe Kerala
silent Flood of an active monsoon viz. a high speed of LLJ, 18 ms−1
feature
(Figure
The 3i), and variability
diurnal relative vorticity of 100
of kinetic energy× 10(KE
−6·s−1 (Figure S3a–b), which are way higher than the
at 850 hPa), net tropospheric moisture (from 1000
corresponding
to 300 hPa), andtypical values recorded
mean tropospheric during the
temperature monsoon
(from 1000 toseason
100hPa)[30].
wereThe west coast
averaged rainfall
for the activeis
period of 8–21 August 2018. The average was obtained for over the Arabian Sea (50 E–72.5with
associated with the offshore trough, the interaction between TEJ and STWJ, and LPS embedded
◦ ◦ E;
5mesoscale
◦ N–15 N),bands,
◦ Bay of which
Bengal are linked
(0–19.5 ◦ N, 78to the
◦ E–96movement
◦ of a landmass
E), and Indian disturbance
(72.5from
◦ the BoB
E–82.5 ◦ E; 5 to
◦ Indian
N–15 ◦ N)
landmass.
(Figure 4a–c), respectively. We followed the procedure presented in [44,45] to compute the kinetic
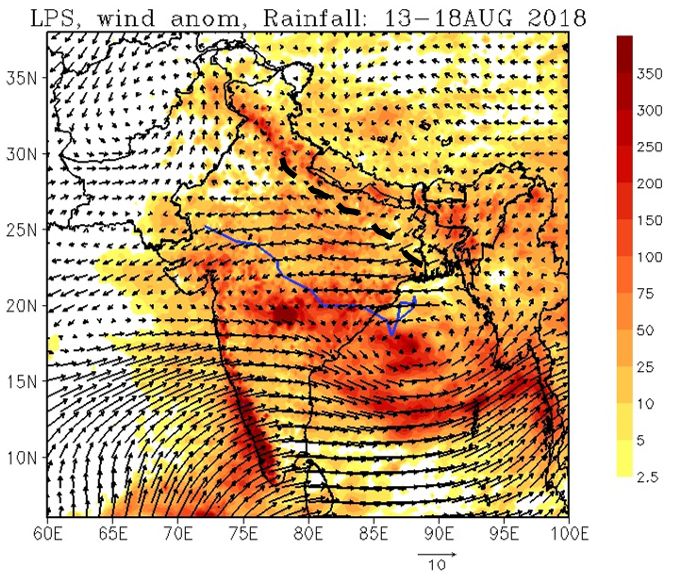
energy, net tropospheric moisture, and mean tropospheric temperature. Figure 4a depicts the daily
variations of kinetic energy over AS, BoB, and the Indian landmass at 0000 UTC on 8–21 August 2018.
It shows a significant difference in kinetic energy over the Kerala flood region and other nearby regions.
It is suggested that the threshold value of kinetic energy (at 850 hPa) during the onset period was
Atmosphere 2020, 11, x; doi: FOR PEER REVIEW www.mdpi.com/journal/atmosphere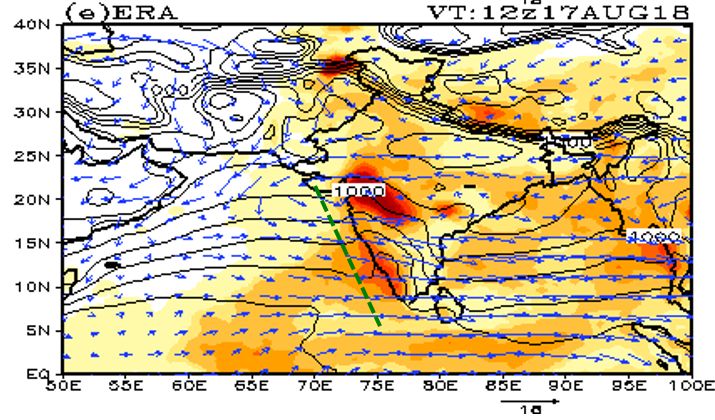
Bay of Bengal (0–19.5° N, 78° E –96° E), and Indian landmass (72.5° E –82.5° E; 5° N –15° N) (Figure
–c), respectively. We followed the procedure presented in [44,45] to compute the kinetic energy,
tropospheric moisture, and mean tropospheric temperature. Figure 4a depicts the daily variations
kinetic energy over AS, BoB, and the Indian landmass at 0000 UTC on 8–21 August 2018. It shows
Atmosphere 2020, 11, 740 9 of 21
ignificant difference in kinetic energy over the Kerala flood region and other nearby regions. It is
ggested that the threshold value of kinetic energy (at 850 hPa) during the onset period was about
0 m2s−2 over the Indian
about monsoon
~40 m2 sdomain [45];Indian
−2 over the duringmonsoon
KFE, the domain
kinetic energy was always
[45]; during KFE, the>80kinetic
m2s−2. energy was always
ditionally, the kinetic
>80 m energy was quite strong
2 s−2 . Additionally, over the
the kinetic BoB, was
energy withquite
a peak of ~150
strong overmthe
2s−2, as shown
BoB, with a peak of ~150 m2 s−2 ,
Figure 4a. The magnitude
as shown of in kinetic energy
Figure 4a. and net mean
The magnitude temperature
of kinetic energy during
and netthemeanKerala flood during the Kerala
temperature
re higher than their corresponding climatological/average values (Figure S4)
flood were higher than their corresponding climatological/average values (Figure for the same daysS4) for the same days
d over the same region.
and over It isthe
evident
samefrom
region.theItdisplay thatfrom
is evident the kinetic energy
the display over
that thethe entire
kinetic Indianover the entire Indian
energy
onsoon region (AS,monsoon
BoB, andregionIndian(AS,
landmass) varied from 65 to 160 m 2s−2, which indicates2highly
BoB, and Indian landmass) varied from 65 to 160 m s−2 , which indicates highly
ive conditions of the Indian monsoon. The
active conditions of the Indian meanmonsoon.
tropospheric Thetemperature
mean troposphericremained lower thanremained lower than
temperature
climatology, which itsisclimatology,
due to the excess
whichrainfall
is due toover
theAS, BoB,rainfall
excess and theoverIndian
AS,landmass
BoB, and the(Figure 4c).landmass (Figure 4c).
Indian
wo apparent indicators of the extreme rainfall event (here, KFE), viz. the net tropospheric moisture and
Two apparent indicators of the extreme rainfall event (here, KFE), viz. the net tropospheric moisture
etic energy, were significantly superior
and kinetic energy, to their
were corresponding
significantly superiorclimatological values (Figure
to their corresponding 4b,c). In values (Figure 4b,c).
climatological
case of KFE, theIntransport
the case of of KFE,
moisture was distinct
the transport from thewas
of moisture nearby Arabian
distinct from Sea, while the
the nearby Arabian Sea, while the
shore trough was offshore
responsible for the convergence of the flux of moisture.
trough was responsible for the convergence of the flux of moisture.
Atmosphere 2020, 11, x FOR PEER REVIEW
Figure 4. (a) 850 hPa daily variation of kinetic energy (m2 s−2 ) over the Arabian Sea (50◦ E–72.5◦ E;
(c)
5◦ N–15◦ N; in black), Bay of Bengal (BoB) (82.5◦ E–97.5◦ E; 5◦ N–15◦ N; in red), and Indian landmass
(72.5◦ E–82.5◦ E; 5◦ N–15◦ N;Figure 4. (a)
in blue) were850derived
hPa daily variation
from of kinetic
ERA-Interim energy (m
reanalysis 2s−2) over the Arabian Sea (50° E –72.5°
for 00 UTC of
N net
8–21 August 2018, as were (b) the –15° N; in black),moisture
tropospheric Bay of Bengal
(NTM; (BoB) −1
gm kg(82.5°
) andE (c)
–97.5°
meanE;tropospheric
5° N –15° N; in red), and Indian land
temperature (MTT; ◦ K). (72.5° E –82.5° E; 5° N –15° N; in blue) were derived from ERA-Interim reanalysis for 00 UTC
21 August 2018, as were (b) the net tropospheric moisture (NTM; gm Kg−1) and (c) mean troposp
5. Precipitation and Tropospheric Features (MTT; °K).
temperature
An accurate estimate of the precipitation intensity and accumulation is essential to understanding
5. Precipitation
the cycle of global water fluxes and the energyand Tropospheric
balance Features
of Earth’s system [46]. A rainfall of >150 mm/day
mosphere 2020, 11, x; doi: FOR PEER REVIEW www.mdpi.com/journal/atmosphere
is defined as extreme rainfall overAn central India [47,48]. However, in
accurate estimate of the precipitation the monsoon intensity
period, theand
amount
accumulation is es
and duration of extreme rainfall, which can the
understanding produce
cyclefloods,
of globaldiffers
waterfrom one geographical
fluxes and the energy location to of Earth’s syste
balance
another. In the case of KFE, the total daily rainfall was more than 200 mm/day, which occurred over the
rainfall of >150 mm/day is defined as extreme rainfall over central India [47,48]. Howev
west coast of India (Figure 5a–i).
monsoonAdditionally,
period, theinamount
(Figureand5a–i), the rainfall
duration is continuous,
of extreme stationary,
rainfall, which can produce floods, di
and intense over Kerala state oneand adjacent regions
geographical of India.
location At theInsame
to another. time,ofover
the case KFE,other areasdaily
the total (e.g., rainfall was more
BoB), the rainfall remains nonstationary.
mm/day, whichOn 14 August,
occurred over moderate
the west coastto heavy rainfall
of India occurred
(Figure over
5a–i). Additionally, in (Figure
coastal regions of Karnatakarainfall
state and continued over Kerala state for the next two days (Figure
is continuous, stationary, and intense over Kerala state and adjacent 5a). regions of Ind
The next day, very heavy rainfall
samewastime,recorded overareas
over other both(e.g.,
Karnataka andrainfall
BoB), the Kerala states
remains(Figure 5b), but On 14 August,
nonstationary.
to heavy rainfall occurred over coastal regions of Karnataka state and continued over Keral
the next two days (Figure 5a). The next day, very heavy rainfall was recorded over both K
and Kerala states (Figure 5b), but the core of the intense rainfall centered in the middle of K
(Figure 1b and Figure 5b). On 16 August, the rainfall was reduced over the Kerala
represented in Figure 5c. Figure 5a–c shows the clustering of total rainfall (sum of l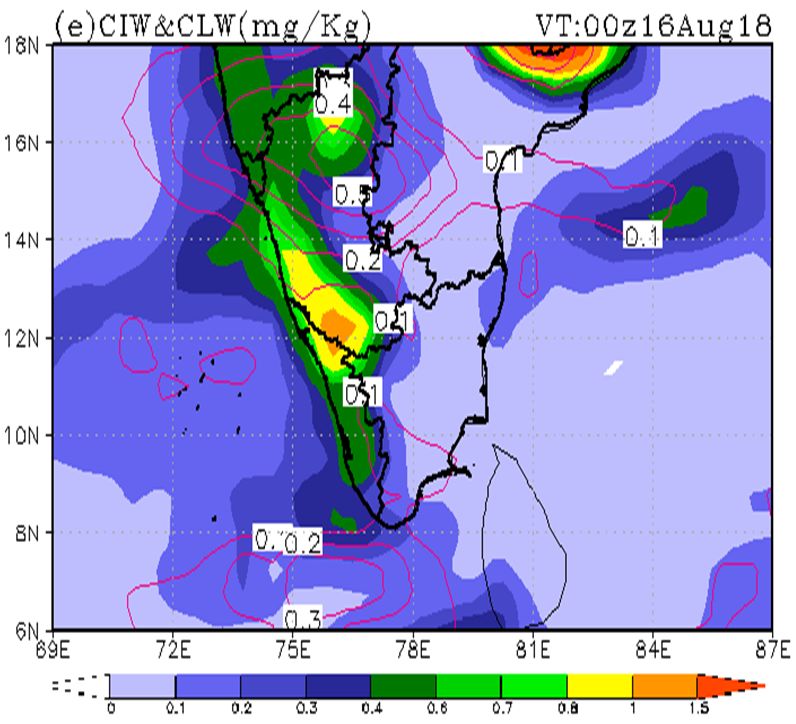
Atmosphere 2020, 11, 740                                                                                            10 of 21

the core of the intense rainfall centered in the middle of Kerala state (Figures 1b and 5b). On 16 August,
the rainfall was reduced over the Kerala state, as represented in Figure 5c. Figure 5a–c shows the
clustering of total rainfall (sum of large-scale precipitation and convective precipitation) during KFE,
closely agreeing with IMD + TRMM merge analysis (Figure 5a–c). Before and on the day of the flood,
most of the rainfall was due to convective precipitation (Figure 5d,e) rather than large-scale stratiform
rainfall (Figure 5g,h). On the next day, 16 August, rainfall from CP and LSP reduced in intensity and
space (Figure 5f,i). Over the west coast, rainfall is associated with an offshore trough produced by
shallow convective clouds (cloud top ~6 km). Figure 5g–i shows large-scale rainfall along the west
coast and east coast that is attributed to offshore troughs. However, on 17 August (Figure is not shown),
the quantity of rainfall reduced drastically, because the intensity of the LPS and offshore trough was
diminished. The combination of synoptic systems, such as monsoon depression, strong LLJ, offshore
troughs along the west coast, and the low-pressure system over BoB caused convective rainfall over
the west coast. However, the large-scale precipitation represents the regular monsoonal rainfall of
Western
AtmosphereGhats   due
           2020, 11,    to LLJ
                     x FOR PEERand offshore troughs.
                                REVIEW                                                              10 of 21

      Figure 5.
      Figure  5. (a–c). 24-haccumulated
                 (a–c) 24-h  accumulatedrainfall    (mm·d−1
                                           rainfall(mm·d   −1 distributions valid at 0300 UTC
                                                             ) distributions valid at 0300 UTC on 14 August 2018,
      0300UTC
      0300  UTCon  on1515 August
                        August     2018,
                                2018, andand
                                          03000300
                                               UTCUTCon 16on  16 August
                                                           August    2018, 2018, respectively,
                                                                           respectively, derivedderived
                                                                                                 from IMDfrom+ TRMM
                                                                                                                IMD +
      TRMM     merged     analysis. Figure  (d–f,g–i) is the  same    as (a–c), but for  convective   and
      merged analysis. Figure (d–f,g–i) is the same as (a–c), but for convective and large-scale stratiformlarge-scale
      precipitation  (mm·d−1 ERA-Interim
      stratiform precipitation   (mm·d−1 ERA-Interim
                                             reanalysis),reanalysis),
                                                          respectively.respectively. Both the
                                                                         Both the datasests    datasests
                                                                                             used         used 25 km
                                                                                                   25 km resolutions.
      resolutions.
     Finally, we examined some of the valued hydrological variables over the KFE region. The total
runoff, temperature
     Finally,       at 2 m,some
              we examined   and evaporation
                                of the valuedare displayed in
                                              hydrological    Figure over
                                                           variables 6a–i. the
                                                                            One of the
                                                                               KFE     recognizable
                                                                                    region. The total
runoff, temperature at 2 m, and evaporation are displayed in Figure 6a–i. One of the recognizable
hydrological impacts of the flood is runoff, which reached the maximum over the Kerala region,
especially on 15 and 16 August (Figure 6b,c). On the next day of KFE, runoff increased over a large
part of the land surface. Generally, temperature and evaporation are temporarily lowered over
locations of moderate to heavy rainfall (Figure 6d–f,g–i). A low value of 2 m shows the areas of
Atmosphere 2020, 11, 740 11 of 21
hydrological impacts of the flood is runoff, which reached the maximum over the Kerala region,
especially on 15 and 16 August (Figure 6b,c). On the next day of KFE, runoff increased over a large part
of the land surface. Generally, temperature and evaporation are temporarily lowered over locations of
moderate to heavy rainfall (Figure 6d–f,g–i). A low value of 2 m shows the areas of Western Ghats with
a higher peak and maximum rainfall spots. However, a reduction of temperature and evaporation
due to the occurrence of rainfall can be seen, whose maxima do not match the peaks of rainfall.
The magnitude of temperature and evaporation shows a reduction in most of the rainfall episodes.
Atmosphere 2020, 11, x FOR PEER REVIEW 11 of 21
Figure 6. Total surface runoff (mm·d−1 ) distributions over the Kerala land region valid at 00 UTC on
(a) 14 August, (b) 15 August, and (c) −116 August 2018 derived from ERA-Interim reanalysis at 25 km
Figure 6. Total surface runoff (mm·d ) distributions over the Kerala land region valid at 00 UTC on
resolutions; both Figure (d–f) and (g–i) are the same as (a–c), but for temperature (◦ C) and evaporation
(a) 14 August, (b) 15 August, and (c) 16 August 2018 derived from ERA-Interim reanalysis at 25 km
(mm·d−1 ), respectively.
resolutions; both Figure (d–f) and (g–i) are the same as (a–c), but for temperature (°C) and evaporation
(mm·d−1), respectively.
6. Vertical Cross-Sections Over the Flood Event and LPS
Meteorological variables related to heavy rainfall have a relatively large magnitude and
penetrate deep in the troposphere. The cross-sections (longitudinal and pressure level) at the locationAtmosphere 2020, 11, 740 12 of 21
6. Vertical Cross-Sections Over the Flood Event and LPS
Meteorological variables related to heavy rainfall have a relatively large magnitude and penetrate
Atmosphere 2020, 11, x FOR PEER REVIEW 12 of 21
deep in the troposphere. The cross-sections (longitudinal and pressure level) at the location of KFE
and LPS Additionally,
of the relative humidity,
lower-level abnormal
westerly windtemperature, and wind
and an accumulation flow arewith
of moisture shown in Figure
vigorous vertical7a–f.
The center
motionof LPS
are significantly
evident demonstrates
from 14 to strong
16 August (Figure LLJ The
7d–f). at the lower
values of troposphere during
the temperature the intrusion
anomaly at the
of colder
centerand drier
of the air in the
monsoon middle troposphere.
depression Thehigher
are significantly dry air(~1.0
imposition
°K) thaninthose
the middle troposphere is
of the environment
seen (surroundings),
on all days overwhereas
AS andsignificant cooling
BoB. At a 300 mb is noticed
level, in the upper
a divergence troposphere.
of wind These
is observed on features
15 August;
closely
however, atagree
a lowerwith the study
level, [44] on the formation
LLJ dominates of LPS during flood events. The location of KFE at
over convergence.
the lower level accumulated plenty of moisture transported from the AS (Figure 7a–c).
Figure 7. (a–c)
Figure Longitudinal
7. (a–c). Longitudinaland and pressure
pressurelevel
levelcross-section of the
cross-section of therelative
relativehumidity
humidity (%;(%; shaded),
shaded),
temperature anomaly
temperature anomaly ◦
( K;(°K;
blue contour),
blue and
contour), andwind
windflow
flowpattern −1
pattern (ms ) )along
−1 alongthethe coast
coast of ofthethe Arabian
Arabian
Sea atSea at◦10.5°
10.5 N valid
N valid at 00at 00 UTC
UTC on 14–16
on 14–16 August
August 2018;2018;
(d–f)(d–f) are same
are the the same as (a–c),
as (a–c), but the
but for for cross-section
the cross-
over section
the eastover
coasttheof east at 20.5of◦ N
BoB coast BoB at 20.5°
derived N derived
from from ERA-Interim
ERA-Interim reanalysis at reanalysis at a 25 km
a 25 km resolution.
resolution.
Additionally, lower-level westerly wind and an accumulation of moisture with vigorous vertical
motion areThe time-evolution
evident from 14 toof 16
theAugust
vertical(Figure
variation of the
7d–f). Thespecific
values humidity over KFE anomaly
of the temperature displays an
at the
enhancement of the moisture content from the surface to the ◦ 500 hPa level (Figure
center of the monsoon depression are significantly higher (~1.0 K) than those of the environment 8a). The
accumulation of specific humidity reached up to 350 mb over the Kerala region, while over BoB, it
(surroundings), whereas significant cooling is noticed in the upper troposphere. These features closely
was up to 600 mb during the KFE. Notably, the middle troposphere was wetter than the boundary
agree with the study [44] on the formation of LPS during flood events. The location of KFE at the lower
layer (Figure 8a), with vigorous upward flow depicting heavy rainfall from 14 to 16 August compared
levelto
accumulated plenty of
BoB. Concomitantly, onmoisture
15 August transported froma the
2018, there was AS (Figure
substantial 7a–c).
build-up of moisture in the lower
troposphere that conforms to the accumulation of moisture associated with upward motion (Figure
Atmosphere 2020, 11, x; doi: FOR PEER REVIEW www.mdpi.com/journal/atmosphereIn contrast, the order of magnitude of specific humidity is almost constant, but a little extended
in the vertical direction. These numbers are very typical and sufficient for the initiation of active
rainfall events. Furthermore, such moisture build-up in the atmospheric column may support flood
events on a local scale.
A spatial pattern and vertical cross-section of the total column water vapor (kg·m−2) and cloud
Atmosphere 2020, 11, 740 13 of 21
ice water content (mg/kg) are displayed in Figure 9. These variables reveal the kind of cloud that
microphysics carry during KFE and are displayed spatially and vertically. The cloud liquid water
content
Theand cloud ice water
time-evolution content
of the are evident
vertical variationalong the specific
of the west coast of India,over
humidity but KFE
not over the KFE
displays an
location (Figure
enhancement 9a–c).
of the This excludes
moisture the possibility
content from the surfaceofto any bighPa
the 500 system
levelbeing responsible
(Figure for the KFE.
8a). The accumulation
The
of KFE seems
specific humidity to have
reached been
up influenced
to 350 mb overregionally
the Keralaandregion,
locallywhile
by low-pressure
over BoB, it wassystems, which
up to 600 mb
favoredthe
during torrential downpour.
KFE. Notably, The figure
the middle indicates
troposphere wasthat the than
wetter maximum values of
the boundary moisture
layer (Figurelayers are
8a), with
indeed overlapping
vigorous upward flow over the locations
depicting heavyof the offshore
rainfall from 14trough and monsoon
to 16 August compareddepression along the west
to BoB. Concomitantly,
coast
on 15 of India2018,
August and east
therecoast
was of BoB. The intensity
a substantial build-upof ofthe offshore
moisture trough
in the lowerdoes not vary that
troposphere much (Figure
conforms
S5a),
to thebut its small deviation
accumulation of moisturewhen moving with
associated inland can produce
upward motion heavy
(Figurerainfall.
8a). TheThe total of
regions perceptible
vigorous
water content
convection showdidthe
surge a little
strong during
vertical the KFE
velocity (Figure
on the order S5b).
of 5 and 10 m/s over BoB and KFE, respectively.
Figure
Figure 8. Pressure-time cross-section
8. Pressure-time cross-section ofof the
the area
area averaged
averaged over
over Kerala
Kerala and
and adjoining
adjoining the
the Arabian
Arabian Sea
Sea
(9 ◦ N–12◦ N; 72◦ E–77◦ E): (a) Specific humidity anomaly (shaded; gm·kg−1 ) and vertical velocity (×100;
(9° N –12° N; 72° E –77 °E): (a) Specific humidity anomaly (shaded; gm·Kg ) and vertical velocity
−1
m −1 s; blue contour) at 00 UTC on 13–18 August 2018 derived from ERA-Interim reanalysis at 25 km
(×100; m−1s; blue contour) at 00 UTC on 13–18 August 2018 derived from ERA-Interim reanalysis at 25
resolutions.
km resolutions. Figure (b) is(b)
Figure theissame as Figure
the same (a), but(a),
as Figure shows
but area-averaged values of
shows area-averaged the low-pressure
values of the low-
system over the Bay of Bengal (17.5◦ N–26◦ N; 72◦ E–88.5◦ E).
pressure system over the Bay of Bengal (17.5° N –26° N; 72° E –88.5° E).
In contrast, the order of magnitude of specific humidity is almost constant, but a little extended in
the vertical direction. These numbers are very typical and sufficient for the initiation of active rainfall
events. Furthermore,
Atmosphere 2020, 11, x; doi:such moisture
FOR PEER build-up in the atmospheric columnwww.mdpi.com/journal/atmosphere
REVIEW may support flood events on
a local scale.
A spatial pattern and vertical cross-section of the total column water vapor (kg·m−2 ) and cloud
ice water content (mg/kg) are displayed in Figure 9. These variables reveal the kind of cloud that
microphysics carry during KFE and are displayed spatially and vertically. The cloud liquid water
content and cloud ice water content are evident along the west coast of India, but not over the KFE
location (Figure 9a–c). This excludes the possibility of any big system being responsible for the KFE.Atmosphere 2020, 11, 740 14 of 21
The KFE seems to have been influenced regionally and locally by low-pressure systems, which favored
torrential downpour. The figure indicates that the maximum values of moisture layers are indeed
overlapping over the locations of the offshore trough and monsoon depression along the west coast
of India and east coast of BoB. The intensity of the offshore trough does not vary much (Figure S5a),
but its small deviation when moving inland can produce heavy rainfall. The total perceptible water
content did
Atmosphere surge
2020, 11, x a little
FOR during
PEER the KFE (Figure S5b).
REVIEW 14 of 21
Figure 9.
Figure 9. The
The cloud
cloud liquid
liquid water
water content
content (shaded)
(shaded) and
and cloud
cloud ice
ice water
water content
content (contour)
(contour) horizontal
horizontal
(a) and vertical-cross
(a) vertical-cross section
section(b)
(b)valid
validatat0000
UTC
UTConon
14 14
August
August2018. BothBoth
2018. (c–d)(c–d)
and (e–f) are the
and (e–f) aresame
the
same as (a–b), but are valid for 00 UTC 15–16 on August 2018 derived from ERA-Interim reanalysis 25
as (a–b), but are valid for 00 UTC 15–16 on August 2018 derived from ERA-Interim reanalysis at at
kmkm
25 resolutions.
resolutions.
7. Other Details of the Extreme Flood Event
There are many other issues (hydrological, social, economic, and environmental) that made the
KFE the worst flood of the century and left footprints on the community in the short and long term.
There were two episodes of heavy rainfall: one through 8–9 August and another that included very
heavy rainfall through 15–17 August. Therefore, it appeared that most of the Kerala reservoirs wereAtmosphere 2020, 11, 740 15 of 21
7. Other Details of the Extreme Flood Event
There are many other issues (hydrological, social, economic, and environmental) that made the
KFE the worst flood of the century and left footprints on the community in the short and long term.
There were two episodes of heavy rainfall: one through 8–9 August and another that included very
heavy rainfall through 15–17 August. Therefore, it appeared that most of the Kerala reservoirs were
saturated and reached their capacity of the Full Reservoir Level (FRL) before KFE. A CWC report
Atmosphere 2020, 11, x FOR PEER REVIEW 15 of 21
(Central Water Commission, India) indicates that the major dams of Kerala were filled with water ~95%
of their storage capacity. Gates of about 35 dams were suddenly opened (without warming) during
during KFE due to a massive inflow of water from the first week of August rainfall, specifically from
KFE due to a massive inflow of water from the first week of August rainfall, specifically from severe
severe rainfall on 15–16 August 2018. The CWC (Central Water Commission) report adds that the
rainfall on 15–16 August 2018. The CWC (Central Water Commission) report adds that the dams did
dams did not help in mitigating the flood; however, dams are not to be blamed for KFE dams being
not help in mitigating the flood; however, dams are not to be blamed for KFE dams being at their full
at their full capacity before the KFE. In such a case, dams have to release excess water or they may
capacity before the KFE. In such a case, dams have to release excess water or they may collapse [7].
collapse [7].
Dams, reservoirs, and wetlands are, in general, created for the generation of electricity, flood
Dams, reservoirs, and wetlands are, in general, created for the generation of electricity, flood
control, and maintaining a water supply. However, heavy rainfall for an extended period and the
control, and maintaining a water supply. However, heavy rainfall for an extended period and the
release of excess water from overflowing dams may be answerable to some extent [5,6]. The path of
release of excess water from overflowing dams may be answerable to some extent [5,6]. The path of
rivers, location of four dams, and orography of Kerala are shown in Figure 10. Idukki, Periyar, and
rivers, location of four dams, and orography of Kerala are shown in Figure 10. Idukki, Periyar, and
Kakki represent the center of excess rainfall. Kakki is the major reservoir in the Pamba sub-basin.
Kakki represent the center of excess rainfall. Kakki is the major reservoir in the Pamba sub-basin. The
The collected water in the four major and well-known dams (Kakki, Periyar, Idukki, and Malampuzha)
collected water in the four major and well-known dams (Kakki, Periyar, Idukki, and Malampuzha)
during the Kerala event in 2018 surpassed the average value of accumulated water from 2009–2018 and
during the Kerala event in 2018 surpassed the average value of accumulated water from 2009–2018
the previous year (2017) (Figure 11a–d). The maximum water discharged from Idukki and Idamalayar
and the previous year (2017) (Figure 11a–d). The maximum water discharged from Idukki and
dams into Pariyar River was 8800 cumes on 16 August 2019, and the maximum amount of water
Idamalayar dams into Pariyar River was 8800 cumes on 16 August 2019, and the maximum amount
attained in the river was 12.40 m high in comparison to the last flood on 27 July 1974, which had a
of water attained in the river was 12.40 m high in comparison to the last flood on 27 July 1974, which
value of 11.11 m high.
had a value of 11.11 m high.
Figure 10.
Figure 10. Thenetwork
Thenetwork ofof rivers,
rivers, the
the elevation
elevation of
of the
the coastal
coastal region,
region, and
and the location of
the location of four
four major
major
reservoirs/dams in Kerala.
reservoirs/dams in Kerala.Atmosphere 2020, 11, 740 16 of 21
Atmosphere 2020, 11, x FOR PEER REVIEW 16 of 21
(a) (b)
(c) (d)
Figure 11.
Figure 11. (a–d).
(a–d). The
Thestorage
storagecapacity ofof
capacity four reservoirs/dams
four in in
reservoirs/dams Kerala: (a) (a)
Kerala: Kakki, (b) (b)
Kakki, Periyar, (c)
Periyar,
Idukki,
(c) andand
Idukki, (d)(d)
Malampuzha.
Malampuzha.
Before and during
during thethe time
timeof ofKFE,
KFE,the thewater
watercollected
collectedininseveral
several dams
dams reached
reached FRL.FRL.In In terms
terms of
of
thethe Idukki
Idukki dam, dam, about
about 345 345 million
million cubiccubic
meters meters
(mcm, (mcm, for spill)
for spill) of waterof water was released
was released in 3 daysin 3(15–17
days
(15–17
AugustAugust 2018)
2018) [38]. The[38]. Therunoff
water water runoff
in Figurein Figure 5j–l indicates
5j–l indicates a jumpa on jump 15 on 15 August
August and 16 and 16 August.
August. This
This
runoff runoff
waterwater
due to due to heavy
heavy precipitation
precipitation showsshows the development
the development of a due
of a flood flood todue to the of
the filling filling of
rivers,
rivers,
reservoirs,reservoirs,
and dams. and Idukki
dams. Idukki
dam and dam and Mullaperiya
Mullaperiya dam are dam are located
located across theacross the Periyar
Periyar River.
River. There
There
was a was a release
release of water of into
water into Periyar
Periyar and Pamba and Pamba rivers
rivers from from
their their associated
associated dams; thus,dams; thethus, the
villages
villages
and livesand lives in
in their their catchment
catchment area were area were affected
affected the most the(Figure
most (Figure
11) [38].11) [38]. Flooding
Flooding execrated execrated
due to
the release
due of water
to the release of from
waterdams
fromcandams be can
attributed to the underestimation
be attributed to the underestimation of water management
of water management in the
KFE
in thecase.
KFEAcase.
NASA report on
A NASA the Kerala
report on the flood
Kerala and thisand
flood studythisdemonstrate the role of
study demonstrate thewater
role ofreleased
water
from thefrom
released dams, asdams,
the well asaswater
well asfrom
waterheavy
from precipitation, resulted resulted
heavy precipitation, in it becoming the worst
in it becoming theflood of
worst
the century
flood in Keralain[7].
of the century Kerala [7].
Apart from
Apart from thethe
heavyheavy precipitation
precipitation over the
over Kerala, Kerala,
flood wasthe exacerbated
flood wasbyexacerbated
the mismanagement by the
mismanagement
of water released from of water
dams,released fromand
landslides, dams, landslides,
stormwater. and stormwater.
Another Another
issue left behind issue
by the KFEleftwas
behind
that
by the
the KFEofwas
course thatwas
rivers thealtered,
course of duerivers
to thewas altered,
erosion dueand
of soil to the erosion
storm surge.of Most
soil and storm
of the damssurge. Most
of Kerala
of the
are dams of
dedicated to Kerala are dedicated
hydro-electric to hydro-electric
power generation, and thepower
rest are generation, and the
used to regulate rest arepractices.
irrigation used to
regulate irrigation
Therefore, other aspects practices.
of KeralaTherefore,
dams and other aspects e.g.,
reservoirs, of Kerala dams and
flood control and reservoirs, e.g., flood
water availability, are
control andThe
debatable. water oldavailability, are debatable.
and poor management The oldofand
practices the poor
damsmanagement practices ofmanagement
in terms of floodwater the dams in
termsalso
may of floodwater management
have contributed. may also
Poor dam and have contributed.
reservoir management Poor dam and reservoir
may have aggravated management
the flood.
may have even
However, aggravated the flood.of
if the authority However,
dams had even if the the
released authority of dams
total water had released
collected before KFE,the total
the water
dams
collected
still wouldbefore
not have KFE, the dams
mitigated thisstill
flood would not have
[7], because mitigatedrainfall
unexpected this flood [7], because
distributed a lot ofunexpected
water over
rainfall
the distributed a lot of water over the region.
region.
8. Concluding Remarks
8. Concluding Remarks and
and Discussion
Discussion
Continuous
Continuousrainfall
rainfallofof
more than
more a week
than occurred
a week duringduring
occurred 9–18 August, 2018, over
9–18 August, Kerala,
2018, overincluding
Kerala,
aincluding
heavy rainfall event
a heavy fromevent
rainfall 15 tofrom
16 August.
15 to 16The KEF did
August. Thenot
KEFmanifest
did not any singleany
manifest prominent synoptic
single prominent
feature
synopticwhich onewhich
feature can rely
oneupon. The upon.
can rely interactions between thebetween
The interactions quasi-stationary offshore trough
the quasi-stationary and
offshore
deviated LPSdeviated
trough and embedded LPSin the large-scale
embedded in flow and mid-tropospheric
the large-scale cold-dry air triggered
flow and mid-tropospheric the KFE
cold-dry air
for almost two days. Based on the diagnostics of MSLP, the winds from 850 to 300 hPa,
triggered the KFE for almost two days. Based on the diagnostics of MSLP, the winds from 850 to 300kinetic energy,
hPa, kinetic energy, net tropospheric moisture, and mean tropospheric temperature can be employed
to paint a realistic picture of Kerala’s extreme rainfall event. The results are summarized in the
following points:
Atmosphere 2020, 11, x; doi: FOR PEER REVIEW www.mdpi.com/journal/atmosphereYou can also read