NYSE & TSX The 3 Reasons to Buy 1. Copper - Launch 2. Gold - Turnaround 3. Silver - Monetize
←
→
Page content transcription
If your browser does not render page correctly, please read the page content below
NYSE & TSX

              The 3 Reasons to Buy
               1. Copper - Launch
               2. Gold - Turnaround
               3. Silver - Monetize

August 2021
                    All figures in US Dollars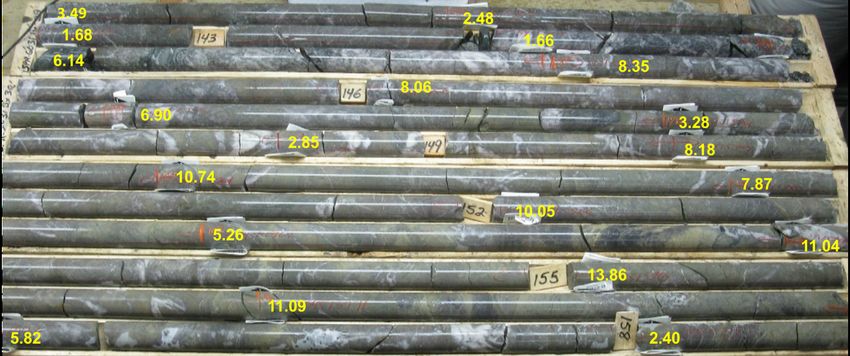
MUX: Cautionary Statement
      This presentation and the information included herein do not constitute an offer to buy or the          Commission (the “SEC”), under the caption "Risk Factors", for additional information on risks,
      solicitation of an offer to subscribe for or to buy any of the securities described herein, nor shall   uncertainties and other factors relating to the Forward-looking Statements. All Forward-looking
      there be any sale of these securities in any jurisdiction in which such offer, solicitation or sale     Statements made in this presentation are qualified by this cautionary statement. Unless
      would be unlawful prior to registration or qualification under the securities laws of any such          otherwise stated, all currency information quoted in this presentation is in U.S. dollars.
      jurisdiction.
                                                                                                              The technical contents of this presentation, including reserves, have been reviewed and
      This presentation contains certain forward-looking statements and information, including                approved by Peter Mah, P.Eng., COO; the exploration technical contents of this presentation
      "forward-looking statements" within the meaning of the Private Securities Litigation Reform Act         including resources content have been reviewed and approved by Stephen McGibbon, EVP
      of 1995 ("Forward-looking Statements"). The Forward-looking Statements are intended to be               Exploration and Luke Willis, P. Geo., Director of Resource Modelling; both are Qualified
      subject to the safe harbor provided by Section 27a of the Securities Act of 1933, Section 21e of        Persons as defined by Canadian Securities Administrators National Instrument 43-101
      the Securities Exchange Act of 1934 and Private Securities Litigation Reform Act of 1995. The           "Standards of Disclosure for Mineral Projects".
      Forward-looking Statements express, as at the date of this presentation, McEwen Mining Inc.
      (the "Company") estimates, forecasts, projections, expectations or beliefs as to future events          Securities and Exchange Commission (“SEC”).
      and results. Forward-looking Statements are necessarily based upon a number of estimates
                                                                                                              Definitions of terms under NI 43-101 differ materially from the definitions of those and related
      and assumptions that, while considered reasonable by management, are inherently subject to              terms in Industry Guide 7 (“Industry Guide 7”) promulgated by the SEC. Under U.S. standards,
      significant business, economic and competitive uncertainties, risks and contingencies. There
                                                                                                              mineralization may not be classified as a “Reserve” unless a determination has been made that
      can be no assurance that such statements and information will prove to be accurate. Therefore,
                                                                                                              the mineralization could be economically and legally produced or extracted at the time the
      actual results and future events could differ materially from those anticipated in such                 reserve determination is made. Under Industry Guide 7 standards, a “Final” or “Bankable”
      statements and information. Risks and uncertainties that could cause results or future events to
                                                                                                              feasibility study or other report is required to report reserves, the three-year historical average
      differ materially from current expectations expressed or implied by the Forward-looking
                                                                                                              precious metals prices are used in any reserve or cash flow analysis to designate reserves and
      Statements include, but are not limited to, factors associated with fluctuations in the market          the primary environmental analysis or report must be filed with the appropriate government
      price of precious metals, mining industry risks, political, economic, social and security risks
                                                                                                              authority.
      associated with foreign operations, the ability of the corporation to receive or receive in a timely
      manner permits or other approvals required in connection with operations, risks associated with
      the construction of mining operations and commencement of production and the projected costs            One consequence of these differences is that “reserves” calculated in accordance with
      thereof, risks related to litigation, the state of the capital markets, environmental risks and         Canadian standards may not be “Reserves” under Industry Guide 7 standards. U.S. investors
      hazards, uncertainty as to calculation of mineral resources and reserves, risk of delisting from a      should be aware that the McEwen Mining properties with reserves as defined by Industry Guide
      public exchange, and other risks. Readers should not place undue reliance on Forward-looking            7 are the Black Fox mine, the Gold Bar project and the San Jose mine. All other properties do
      Statements, which speak only as of the date hereof. The Company undertakes no obligation to             not have “Reserves” as defined by Industry Guide 7 and Investors are cautioned not to assume
      reissue or update Forward-looking Statements as a result of new information or events after the         that any part or all the disclosed mineralized material will be confirmed or converted into
      date hereof, except as required by law. See McEwen Mining's Annual Report on Form 10-K for              Industry Guide 7 compliant “Reserves”.
      the fiscal year ended December 31, 2020, the Quarterly Report on Form 10-Q for the quarters
      ended March 31, 2021, June 30, 2021 and other filings with the Securities and Exchange
MUX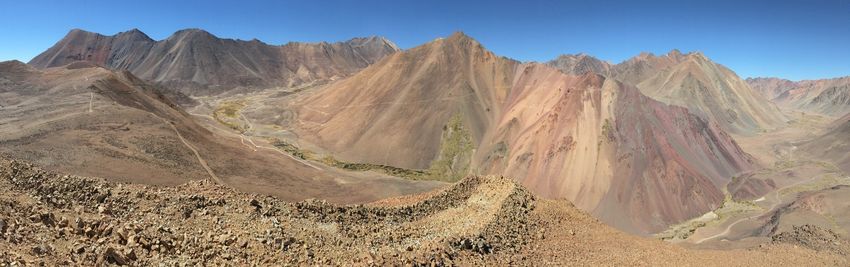
MUX's Value Drivers
                        •   Surfacing value of our large copper asset, Los Azules
                        •   Funding it separately to upgrade from PEA to PFS, then to FS
      McEwen Copper     •   Series B financing $80 M with a Lead order of $40 M by Rob McEwen
                        •   MUX to retain 69% interest plus 1.25% NSR – go public in 12 months
                        •   Reduces MUX's G&A.

                        •   Increasing production & extending life of mines with exploration
                        •   2021 drill programs targeting increased near-term production
      Organic Growth
                        •   $9 M @ Fox, Stock and Grey Fox
      Strategy - Gold   •   $5 M @ Gold Bar and Tonkin deposits
                        •   $9M San José JV.

      Gold - Project    •   Fox Complex Expansion – Preliminary Economic Assessment H2 2021
      Development       •   Gold Bar South – permitting expected Q4 2021.

      Monetizing
                        •   El Gallo, Mexico and San José, Argentina.
      Silver Assets
MUX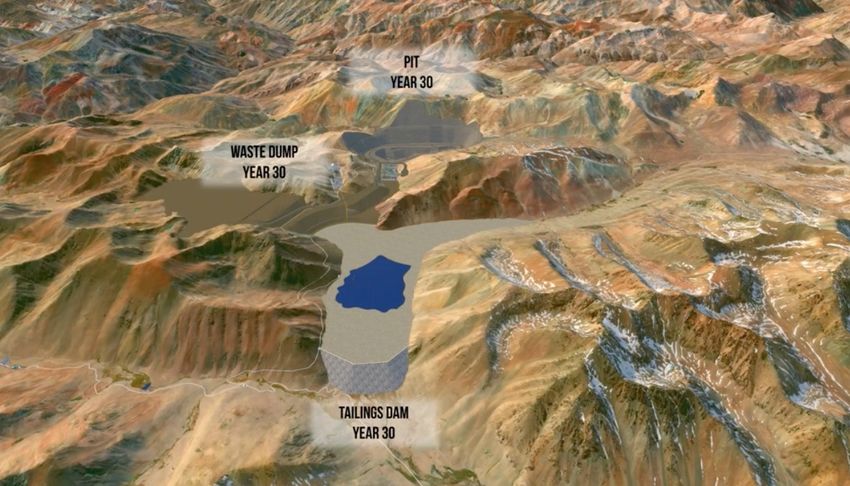
Launching a New Copper Developer

      l   Key asset: 100% of Los Azules Copper
          Project located in San Juan, Argentina

      l   One of the world's largest undeveloped              Elder Creek,
          open pit copper porphyry deposits;                 Nevada (100%)
                                                          • Cu-Au exploration
      l   Financing up to $80M, lead order of $40M,
          2 stage closing.
      l   Use of funds to improve the value to MUX by             Los Azules
          upgrading from PEA to PFS then to FS.
                                                               Argentina (100%)
      l   PEA economics robust at $3/lb, long life, low   • Improving access & increasing its
          cost. NPV(8%) $5 Billion @ current Cu prices      value by advancing the project
                                                            from PEA to PFS then to FS
      l   100% of the Elder Creek Cu-Au greenfield
          exploration in Nevada.
MUX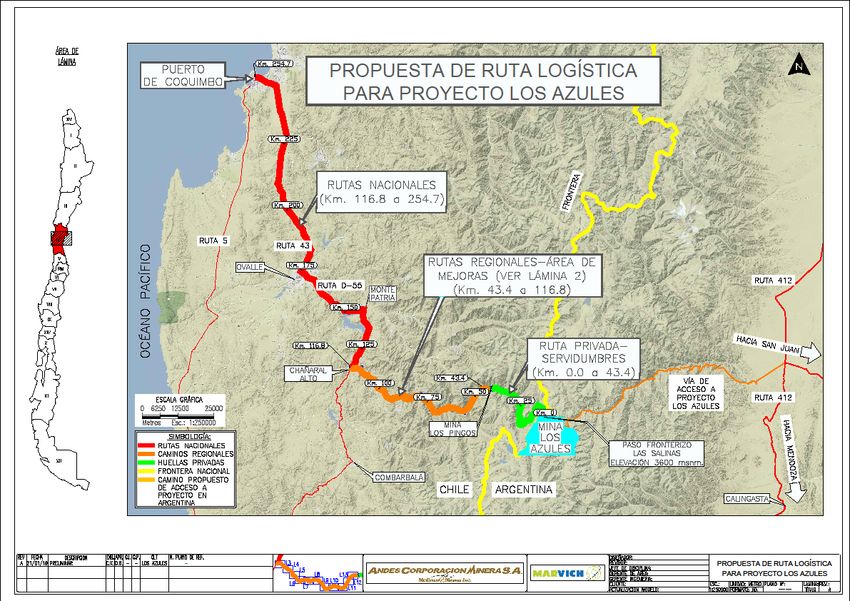
Illustration of Growth in Value of Large Copper Properties
                   Moving From Resource Through Stages to FS
                   $US / lb Paid for the 12 Large Copper Deposits Sold in 2010-18
                                                                                                                        Acquired
                                                                               Announcement   Development      %
                                                                                                                       Cu Eq. R&R
                                                                                                                                         Cu Eq      US$/lb
      Target (Project)                        Buyer
                                                                                   Date          Stage      Acquired                    Grade %     Cu Eq
                                                                                                                       (million lbs)

      Peregrine Metals Limited (Altar)        Stillwater Mining Company         07/11/2011     Resource      100%        12,567           0.45%     $0.036
      Mason Resources Corp                    Hudbay Minerals Inc.              10/31/2018       PEA          86%        14,095           0.35%     $0.002
      Lumina Copper Corp. (Taca Taca)         First Quantum Minerals Limited    06/17/2014       PEA          94%        33,053           0.48%     $0.012
      Antares Minerals Inc.                   First Quantum Minerals Limited    10/18/2010       PEA         100%        12,990           0.60%     $0.034
      Kamoa copper project                    Zijin Mining                      05/26/2015       PEA          49%        26,117           2.50%     $0.015
      Far West Mining Ltd                     Capstone Mining Corp              04/17/2011       PFS         100%         4,307           0.36%     $0.155
      Reservoir Minerals Inc.                 Nevsun Resources Limited          04/24/2016       PFS          80%         3,092           4.78%     $0.134
      Upper Kobuk Mineral projects            South32 Limited                   04/10/2017        FS          50%         5,141           2.10%     $0.026
      Pinto Valley from BHP                   Capstone Mining                   04/29/2013        FS         100%         7,846           0.35%     $0.080
      Augusta Resources (Rosemont)            Hudbay Minerals Inc.              02/10/2014        FS         100%         7,275           0.50%     $0.069
      Norsemont (Constancia)                  Hudbay Minerals Inc.              01/10/2011        FS         100%         5,300           0.47%     $0.080
      Indophil Resources NL (Tampakan)        Alson Group                       09/23/2014        FS          80%        32,160           0.60%     $0.008

                                                                                                                                       Avg. PEA     $0.020
      Legend
      PEA - Preliminary Economic Assessment                                                                                            Avg. PFS     $0.145
      PFS - Pre-Feasibility Study                                                                                                      Avg. FS      $0.053
      FS - Feasibility Study
                                                                                                                                       Total Avg.   $0.059
MUX
Los Azules: NPV Sensitivity
                             Post-Production Decision
                       $6
                                                                                                         Cu Price
  NPV8% Billions US$

                       $5
                       $4
                                                                                                         Au Price                     After-Tax NPV(8%)1
                                                                                                         Ag Price
                       $3
                       $2
                                                                                                         Grade                          • $2.2 B        at $3.00/ lb
                                                                                                                                                            Copper
                                                                                                         CAPEX
                       $1
                       $0                                                                                OPEX
                                                                                                                                        • $5.1 B        at $4.25/ lb
                                                                                                                                                            Copper
                       $-1                                                                               OPEX - Mining

                       $-2                                                                               OPEX - Process
                             -50%      -25%           100%          +25%           +50%
                             $1.15     $2.25          $3.00         $3.75          $4.50                 OPEX – G&A
                                      Change from Base Case (%)
                                         Copper Price ($/ lb)

          1
            PEA Oct 16, 2017 - “NI 43-101 Technical Report - Preliminary Economic Assessment Update for the Los Azules Project, Argentina” (Hatch). All project economic
          metrics, including net present value (NPV), are presented on a post-project approval basis (after completion of additional drilling, prefeasibility and feasibility studies).
          All economic assessments are calculated at the project level and do not include certain costs including corporate office, interest, financing and exploration expenses.
MUX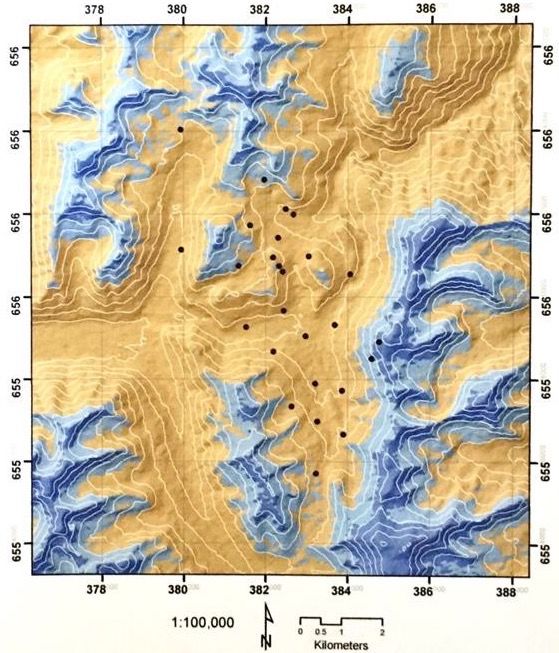
McEwen Copper’s Projected Value Sensitivity

      •   Los Azules total Indicated & Inferred Resources: 29.5 B lbs Copper
      •   Value used for Financing $175 M or $0.006/lb Cu
      •   Post financing 25.5 M shares outstanding
      •   Ownership: MUX 17.5 M shares ~69% plus a 1.25% NSR
                       New investors 8 M shares ~31%
      •   Value at $0.03/lb is $885 M
      •   Value at $0.05/lb is $1.475 B

MUX                        M- millions, B – billions. MUX Shares outstanding: 459 M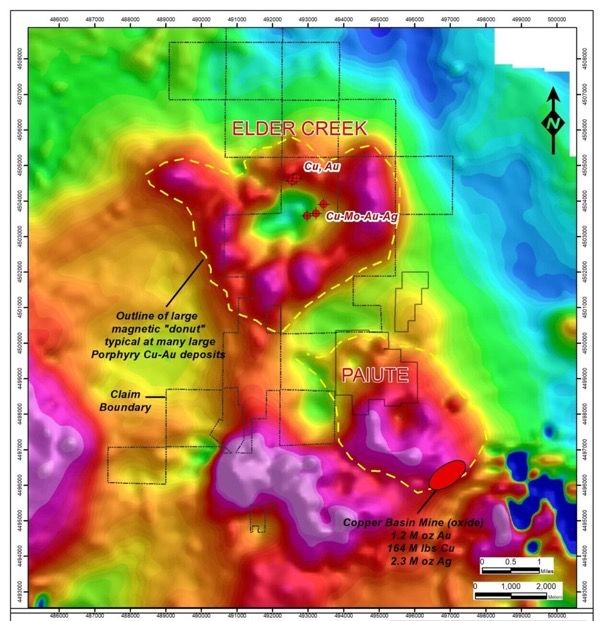
MUX: Historically Traded at a Premium
                   MUX vs GDXJ Relative Performance (Jan 2012 – Aug 2021)
100 %

 80

 60                                                                          MUX                     MUX Outperformance
                                                                             GDXJ                    MUX Underperformance
 40

 20

  0

 -20

 -40
                                                                                                                     GDXJ
 -60
                                                                                                                     MUX
 -80

-100
    2012   2013   2014     2015           2016           2017           2018           2019          2020    2021

MUX                      Source: Bloomberg. Monthly performance, from Jan 1, 2012, to Aug 4, 2021.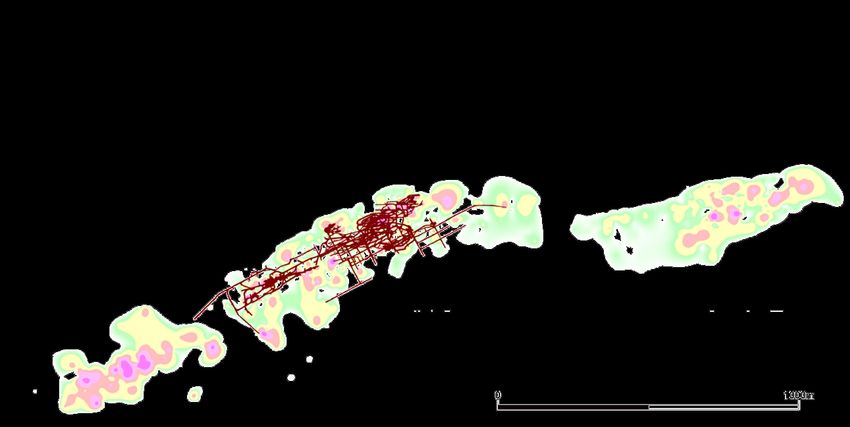
Driving the Turnaround: New Senior Management Team

Rob McEwen                                                 Anna Ladd-Kruger                                        Peter Mah
Chairman & Chief Owner                                     CFO                                                     COO
               Rob has $1/ year salary, has invested                     Anna has 20+ years of mining                             Peter has 30 years of mining
               $165 million in McEwen Mining and                         experience. She was previously CFO &                     experience, with a passion for
               owns 18% of the company’s                                 VP Corp Dev at Excellon Resources,                       developing teams and a focus on
               outstanding shares. He is the founder of                  and CFO o f Trevali Mining, where she                    excellence and innovation. Peter set a
               Goldcorp, was awarded the 2001 PDAC                       was integral to growing the company to                   strong track record in building,
               Developer of the Year, the Order of                       a >$1 B market cap mid-tier producer.                    transitioning and operating mines.
               Canada, and was inducted into The                         Anna is CPA, CMA, and holds MSc in                       Peter holds BASc in Mining and Mineral
Canadian Mining Hall of Fame.                              Economics (Queen's University) and BComm (UBC).         Process Engineering and MASc (UBC).

Adrian Blanco S.                                           Rory Greyvensteyn                                       Stephen McGibbon
Director Operations, Mexico & USA                          Director Operations, Canada                             Executive Vice President, Exploration
               Adrian has extensive mining experience,                     Rory has over 30 years of mining                        Professional Geologist with extensive
               held executive positions in the Americas,                   experience in diversified operations,
                                                                                                                                   exploration, mine production & North
               led business transformations towards                        from deep level gold mining in South
                                                                                                                                   American management experience,
               profitability, promoted highest standards                   Africa to open pit diamond mining in
               of safety & operational excellence. He                      Canada. He has a strong background in                   Steve was senior member of the team
               holds BBA, Chem. Eng., MSc in                               production and large contract                           that discovered Goldcorp’s High Grade
               Corporate Finance (Salford Business                         management. Rory holds a BSc in                         Zone deposit in Red Lake & drove
School) & Executive Management certification (IPADE).      Mining Engineering and a NHD in Metal Mining.                           Premier Gold’s exploration succes, key
                                                                                                                   asset purchases & revitalization at Geraldton mining camp.

MUX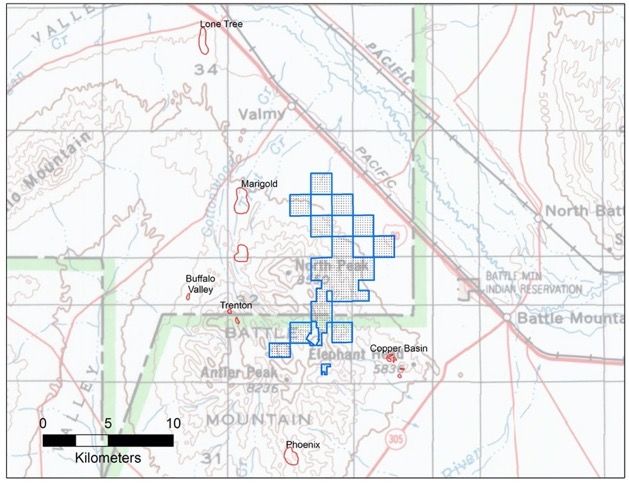
2021 Highlights: On Track & Performing Much Better

      •   New senior management @ head office & mines

      •   H1 production 71,400 GEOs, in line with guidance

      •   2021 production guidance + 20-40% greater than 2020

      •   $50 M debt maturity extended by 2 years to Aug 2023

      •   Dividend from San José mine resumed: $7.5 M received in H1 2021

      •   Cash & liquid assets @ June 30th 1: ~$44 M

      •   2021 exploration budget $23 M

MUX                       1   Includes cash and gold bullion inventory, as of Mar 31, 2021
MUX Regaining Its Mojo
200 %
180
160
Silver
140 101%
120 MUX
100%
100
Copper
80
99%
GDXJ
60 84%
40
Gold
20
21%
0
Mar-2020 Aug-2020
Sep-2020 Mar-2021 Aug-2020
-20
MUX Source: Bloomberg. From Mar 20, 2020 to Aug 4, 2021.Operational Progress Good News
Fox Complex Froome extends Black Fox production by 2.5 yrs
Commercial production scheduled Q4 2021
PEA expansion study H2 2021
$9 M exploration program 2021
Gold Bar Updated feasibility study
300 Koz Recoverable gold
6-year mine life
$5 M exploration program 2021
El Gallo Fenix gold & silver project feasibility study
9.5-year mine life
Investigating financing alternatives
San José Dividend resumed
$9.3 M exploration program 2021
MUXOur Objective: Regain this Lost Ground! Close the Gap!
MUX vs GDXJ Relative Performance - August 2018 – August 2021
100%
80
60
Potential
40 MUX
$3.17
20
0
Closing
The Gap
-20
-40
$1.16
-60 MUX MUX Outperformance Current
GDXJ MUX Underperformance MUX
-80
Aug-2018 Aug-2019 Aug-2020 Aug-2021
MUX Source: Bloomberg. Weekly performance, from August 4, 2018 to August 4, 2021.Turnaround in Progress
Comparative Production H1 2021 vs 2020 & 2021 Guidance
Ounces H1 2021 2021 Guidance Range
Gold 18,800 41,500 - 44,500
San José Mine, Argentina
Silver 1,100,000 2,300,000 - 2,450,000
(49%)
GEO 35,000 72,000 - 77,000
Gold Bar Mine, Nevada GEO 21,500 37,000 - 45,000
Black Fox Mine, Canada GEO 12,300 27,500 - 32,500
El Gallo Mine, Mexico GEO 2,500 4,500 - 5,900
Gold 55,000 110,500 - 127,900
Total Production Silver 1,105,000 2,300,000 - 2,450,000
GEO 71,400 141,000 - 160,400
GEO - gold equivalent ounces. Press releases: Feb 2, 2021 (2021 production guidance), Apr 19, 2021 (Q1-21 production), Jul 13, 2021 (Q2-21 production). Numbers may not
MUX add due to rounding. Q1/ Q2 total silver production sourced from San Jose & 900/ 4,800 oz Ag from the other mines. Gold:silver ratios - 68:1 for Q1 & Q2 2021, 75:1 for 2021.Comparative Production Costs/ Oz1 2021 vs 2020
Costs Are Falling
Q2 2021
Black Fox Mine Cash Costs $917
Canada AISC $1,088
San José Mine Cash Costs $1,105
Argentina (49%) AISC $1,500
Gold Bar Mine Cash Costs $1,463
Nevada AISC $1,619
1- GEO Non-GAAP financial performance measure. Cash costs for the Company’s 100% owned operations equal production costs applicable to sales.
MUX See “Non-GAAP Financial Performance Measures” beginning on page 38 for additional information.Comparative Financials - Production and Costs Changes
Q2 Comparison 2021 vs 2020 & H1 Comparison 2021 vs 2020
Q2 2021 vs Q2 2020 H1 2021 vs H1 2020
% Increase (Decrease)
Production Cash Costs AISC Production Cash Costs AISC
GEOs(1) $/GEO(2) $/GEO(2) GEOs(1) $/GEO(2) $/GEO(2)
Gold Bar Mine, Nevada 131% (17%) (34%) 41% (13%) (25%)
Fox Complex, Canada 223% (71%) (67%) 17% (22%) (29%)
San José Mine,
102% (14%) 2% 46% (9%) (8%)
Argentina(3)
1. Gold Equivalent Ounces (GEOs) are calculated based on a gold to silver price ratio of 68:1 for Q1 and Q2 2021, 94:1 for Q1 2020, 104:1 for Q2 2020, and 75:1 for full year 2021 Production Guidance. 2. Cash gross
profit, cash costs per ounce, all-in sustaining costs (AISC) per ounce, and liquid assets are non-GAAP financial performance measures with no standardized definition under U.S. GAAP. For a description of the non-GAAP
measures see "Non GAAP Financial Measures" section in this press release; for the reconciliation of the non-GAAP measures to the closest U.S. GAAP measures, see the Management Discussion and Analysis for the year
ended December 31st, 2020 filed on EDGAR and SEDAR. 3. Represents the portion attributable to us from our 49% interest in the San José Mine. 4. Both cash costs and AISC per GEO no longer represent key metrics
MUX used by management to evaluate residual leaching at the El Gallo Project. For this reason, the Company has ceased relying on, and disclosing, cash costs and all-in-sustaining costs per ounce as a key metric.Comparative Financials - Liquidity
June 30th, 2021 and December 31st, 2020
Q2 2021 ended Q4 2020 ended
June 30th, 2021 Dec 31st, 2020
Cash and cash equivalents $ 42.2 M 20.8 M
Liquid assets $ 48.9 M 25.9 M
Working capital $ 30.0 M 7.9 M
Long-term debt principal $ 50.0 M 50.0 M
MUXComparative Financials - Financial results Q2 & H1 2021
Ended June 30th, 2021 compared Q2 & H1 2020
2021
Q2 H1
Revenue $ 40.7 M 64.5 M
Cash gross profit (loss) $ 9.6 M 9.7 M
Gross profit (loss) $ 4.1 M (0.9) M
Net loss $ (6.0) M (18.5) M
Net loss per share $ (0.01) (0.04)
MUXCEO's Big & Unique Financial Commitment
$165M Investment 1
18% Ownership
$1/Yr Salary
Shares Stock Ownership Top 10 Holders 3
Outstanding : 459 M Rob McEwen 82.2 M
Van Eck Associates 22.3 M
Rob
Fully Diluted : 495 M McEwen Weiss Asset Management 15.2 M
18% Condire Management 11.1 M
ADTV 2 : 5.6 M BlackRock 8.3 M
Retail
56% Institutional Mirae Asset Global Investments 7.5 M
Price : US$1.16 The Vanguard Group 6.2 M
26%
Invesco Ltd 5.4 M
Market Cap : US$532 M
AIFM Capital AB 5.1 M
ETF Managers Group 4.0 M
MUX 1 - Rob McEwen’s investment: $140 M shares + $25 M, Aug 13, 2018 press release. 2 - Average Daily Trading Volume over 3 months. 3 - Holdings in million shares. Source: Bloomberg, Aug 4, 2021.MUX: Gold, Silver, Copper Assets
4 Mines 5 Development Projects
Gold Gold
Black Fox Ontario Froome
Grey Fox
Gold Bar Nevada
Stock
El Gallo
Mexico
Gold & Silver
Gold & Silver
Fenix
San Jose
Copper
Los Azules
Argentina
MUXOrganic Growth Opportunities - Gold
Fox Complex, Timmins
Mineral Resources: 2,789,000 oz Au Measured & Indicated & 1,183,000 oz Au Inferred
Destor-Porcupine Fault Zone
Fox - Stock Mine & Mill
Trans-Canada Hwy Black Fox Mine
Matheson (incl Tamarack)
20 miles
121,000 oz Au M&I (32 km) Froome
iles 8,000 oz Au Inf
Timmins 28 m m)
(45 k
Grey Fox
1,199,000 oz Au M&I
221,000 oz Au Inf
Fox - Lexam
1,469,000 oz Au M&I 6 miles
954,000 oz Au Inf 10 km N
MUX Resources: M&I - Measured & Indicated, Inf – Inferred. As of December 31, 2020.Fox Complex – Key Exploration Targets Fox Complex
Ontario, CANADA
With Current & Past Production – Potential Both Near Surface & at Depth
Red Lake Timmins Kirkland Lake Stock / Black Fox
Surface
1,000m 3,300ft
2,000m 6,600ft
Grey Fox Area
Stock West Stock East
6.7 g/t Au / 39m 63.6 g/t Au / 6.2m Whiskey Jack
Ore Bodies Headframe/ Shaft 9.9 g/t Au / 39m
147 NE
39.5 g/t Au / 3.8m
McEwen Mineralization Zone Outlines Stock Mine Black Fox Mine 4.8 g/t Au / 19m
27.2 g/t Au / 7m 55.1 g/t Au / 1m incl. 10.3 g/t Au / 6m
incl. 120 g/t Au / 1.6m
GF South
10.9 g/t Au / 18.8m
MUXFox Complex: Black Fox Mine Property
High Priority Targets @ Froome & Grey Fox
Grey Fox
888,000 oz Indicated
Black Fox Mine @ 7.1 g/t Au
173,000 oz Inferred
@ 6.6 g/t Au
Froome
181,000 oz Indicated
@ 5.1 g/t Au
Commercial
production
Q4, 2021
1.2 miles
2 km
N
MUX Please see Appendix for more details.Froome on Target for Q4 Commercial Production
Froome Expected to Deliver Better Economics Than Black Fox
Shallower deposit Shorter haul & access time improve productivity
Wide disseminated style mineralization More consistent grades & continuity
Wider mining widths (mostly 15-40 m) More productive ‘bulk’ mining
Larger stopes More efficient UG development & mine sequencing
Lower gradient & straighter ramp More efficient haulage & reduced UG congestion
Better stoping ground conditions Positive for dilution & grade control
Portals
Surface
Black Fox
Open Pit
Production Mining and
Froome Milling Underway
Deposit
MUX Section Looking NorthFox Complex: Grey Fox Priority Drill Hole
Grade
(g/t Au)
Width
(m)
Grade Width
(g/t Au) (m)
GxW
Whiskey Jack, 1 of 5 Zones at Grey Fox 19GF-1320 2.05 11.0 incl. 5.30 1.6 23
19GF-1313 2.06 11.0 incl. 6.95 1.0 23
Whiskey Jack Long Section Looking North - Near Surface, Good Grades 19GF-1293 5.82 4.4 26
Surface 20GF-1305 2.58 11.9 incl. 4.10 2.8 31
0-
Model Grades
A 20GF-1328 3.58 8.6 incl. 7.97 2.1 31
> 5 g/t Au 19GF-1321 4.78 6.5 31
3.6 – 5 g/t Au
GF11-337 3.59 9.0 32
20GF-1112 16.34 2.6 43
D GF14-917 17.41 2.7 incl. 41.49 1.1 46
GF14-908 11.58 4.1 incl. 18.05 1.4 48
Open B 20GF-1323 5.95 10.0 incl. 13.29 4.2 60
GF14-925 3.93 16.0 63
19GF-1248 5.00 13.0 65
FW
250m - 20GF-1152 4.87 15.6 incl. 17.01 3.5 76
C Potential?
A PR93-19 8.22 9.9 incl. 32.20 2.4 81
E C 20GF-1329 4.78 17.7 incl. 16.42 3.7 85
B 20GF-1323 incl.
31.23 3.4 38.51 2.7 106
D 19GF-1242 9.74 13.0 incl. 14.07 8.4 127
GF11-400 9.26 13.8 incl. 15.21 8.0 127
20GF-1255 20.01 7.9 incl. 131.00 0.7 158
en
t
ul E 20GF-1325 12.67 13.8 incl. 29.48 5.7 175
Fa
Op
1 19GF-1293 52.96 7.4 392
A 0 200m
500m - 19GF-1248 8.99 44.0 incl. 9.90 39.0 396
MUX Drill results presented rounded, using a cut-off grade of 0.5 gpt Au. GxW represents the product of the first grade and width columns for each drill hole.Fox Complex: Stock Area – Establishing a Resource Base
• Historical grades processed at Stock Mine +5 g/t Au
• Close to the mill & near surface
• Several potential mining methods may support PEA
• Footprint of mineralization expanding
one
Fault Z
ne
cupi
or Stock East
e stor-P
D Stock West
Stock Mine
ult 137 Koz Au historic production
aw k Fa Plan View
th
MUX
NighFox Complex: Stock Area – 6 Drills on Stock West
Stock Mine
Stock West 137 Koz Au historic production Stock East
Surface
-500m
Gold Grade x Width
5 km to Property Boundary
(g/t x m)
>100
50 to 100
25 to 50
10 to 25 -1000m
5 to 10
Longitudinal Section Looking North
MUXFox Complex - Stock West – Attractive Gold Grades & Widths
Important Part of Fox Complex Future Expansion Plans
Stock West - Longitudinal Section Looking North
Select Drill Intercepts
2.92 g/t Au over 39.6 m -300m
1 incl 5.05 g/t Au over 6.2 m
and 7.59 g/t Au over 5.9 m
2 3.82 g/t Au over 8.8 m
-500m
2
3 11.29 g/t Au over 2.4 m
3 1
MUX Drill results are true widths and are presented in the May 10, 2021 press release, “McEwen Mining Reports Upbeat Exploration & Delineation Results”Gold Bar: Nevada – Tier 1 Jurisdiction
Gold Bar
Nevada, USA
On Trend - Similar Geology Nevada
Gold Mines
Cortez & Cortez
Criteria 50 Moz Au
Gold Bar
Cortez cluster1
Large footprint,
ü Fourmile
Co
shallow oxide gold Discovery
rt
Goldrush
ez
Fa
Host rock, alteration,
ü
ult
mineralization style
Major faults,
structural traps ü
Tonkin Legend
Intrusions ü MUX Property
NGM Property
Faults
Rob
Underexplored, With Upside Potential Gold Bar
erts
Wa
Cree
ü Surface near mine & deeper targets
ll F
12 miles
au
k Fa
lt
N
ü Oxide & sulfide 20 km
ult
MUX 1. Includes past production and current resources.Gold Bar - $5 M Exploration Budget Explanation
Mine
Near Mine Deposit
Resource Expansion Near mine targets
2021 Drilling Programs
• Ridge Brownfield
Ridge
• Cabin Greenfield
• Pick
• Atlas Pit
Pro
R ob
per
Cabin
Pick
Brownfields
erts
ty B
W
Ri
Ca
all
Known Mineralized Areas
dg
oun
Cre
bin
Fa
e
Gold Bar
ul
Fa
ek F
dar
Fa
Mapping/Sampling
t
South
ul
ult
t
2021 Drilling Programs
y
ault
• West Ridge
Greenfields
Large Faults/Alteration Atlas G
Mapping/Sampling ol
Pit d
Ba
rF
au
MUX ltA Silver Company Inside MUX
Comparisons to 2020 Production (Moz AgEq)
63.7
MUX’s annual silver equivalent production from its two silver
mines compared to the publicly traded silver-focused producers
(Larger production assumes Fenix project goes into production)
19.1
14.7
10.1 10
7.5 6.3 5.6
1.9 1.6 0.6
Pan First Majestic Fortuna McEwen Silver Corp McEwen Endeavour McEwen Silver Bear Excellon Impact Silver
Pan
American First
Silver Fortuna
Silver McEwen
Silver -Silver
San Silver McEwen
Silver -Silver
San Endeavour
Silver McEwen
Silver - San Silver Excellon Impact
American
Silver Majestic Silver San
JoséJosé +
+ Fenix Corp San
JoséJosé +
+ Fenix Silver San
JoséJosé Bear Silver
Silver Silver Fenix Phase
Phase 2 2 Fenix Phase
Phase 1 1 2020
Sources: Company Filings, Laurentian Bank Securities Inc. McEwen Silver scenarios based on average annual LoM AgEq production.
MUX AgEq Resources calculated using: $1,664/ oz Au, $22.29/ oz Ag, $3.23/ lb Cu, $1.08/ lb Zn, $0.9/ lb PbSan José - One of the Highest Grades Mines in the Americas
(49% MUX Ownership)
§ Large Property Property
outline
§ High Grade Mine
San José
Argentina
§ Surrounds Newmont San José
Mine
399 gpt Silver
Reserve Grade 1
6.49 gpt Gold
Mine Life 2 5 Years Newmont
Cerro Negro Mine
2.30 - 2.45 Moz Silver & Production 2020 6
2021E Production 3,4 231,000 oz Au
41.5 - 44.5 Koz Gold
$15.90 - $16.30/ oz Ag Eq 12 miles
2021E AISC5 N
$1,370 - $1,400/ oz Au Eq 20 km
MUX 1., 2. Hochschild “Annual Report and Accounts 2020”. 3. Using 49% MUX ownership. 4. MUX Feb 2, 2021 press release 5. Hochschild 1-5 Mar 2021 presentation. 6. Newmont disclosure.San José Property Exploration Targets
§ 2021 Exploration Budget - $9.3 Million
Aguas Vivas
High grade veins:
Isabel, Luisa & Escondida San José
Argentina
Continuing areas near mine & Cerro Negro: Saavedra
Saavedra, Aguas Vivas & Telken
Telken North
§ Recent Near Mine Results
Newmont
Exploration Cerro Negro Mine
2.0 m @ 62.50 g/t Au & 5,571 g/t Ag close to
Cerro Negro
1.3 m @ 13.80 g/t Au & 3,149 g/t Ag Telken Observed veins
South Inferred veins
1.6 m @ 5.60 g/t Au & 648 g/t Ag
0.9 m @ 2.20 g/t Au & 722 g/t Ag 12 miles
N
20 km
MUX Source: Hochschild Mining: press releases dated Jan 20 2021, 2020 Full Year Results presentation dated Feb 18 2021, 1-5 Mar 2021 and May 19 2021 presentationNear-Term Catalysts
• Launch of McEwen Copper
• Exploration Results
• Fox Complex Expansion PEA in H2
• Froome Commercial Production in Q4
• Monetizing Silver Assets
MUXotivated nited ceptional
Appendix
Launch Presentation

  Los Azules Project
  San Juan, Argentina

July 2021
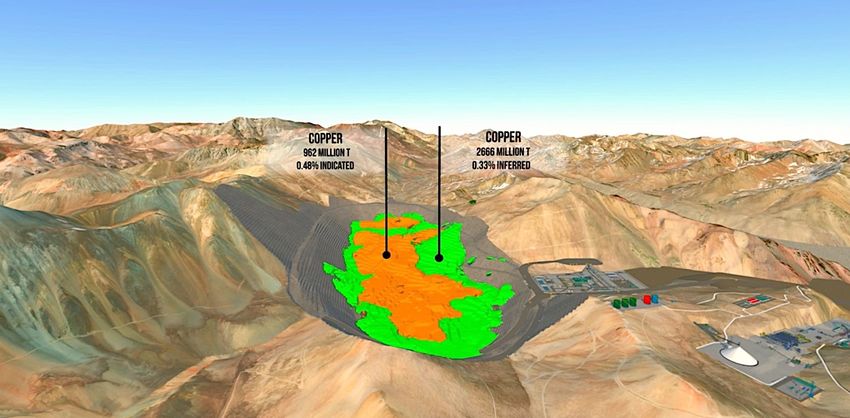
Los Azules: Large Copper Resource
                          Ore                Copper                 Gold                 Silver
                         tonnes                 lbs                   oz                    oz

          Indicated   962 Million          10.2 Billion          1.7 Million          55.7 Million
                                                                                                               World-Class Open Pit
                                             0.48%                0.06 g/t              1.8 g/t                 Copper Resource
           Inferred   2,666 Million        19.3 Billion          3.8 Million         135.4 Million
                                             0.33%                 0.04 g/t             1.6 g/t

                                             Indicated                         Inferred

      Animated project video:
                                                                                                          Conceptual
      https://youtu.be/swTAs
                                                                                                         Process Plant
      ZlLxfI

                       Source: Preliminary Economic Assessment (PEA) Oct 16, 2017 - “NI 43-101 Technical Report –
MUX                      Preliminary Economic Assessment Update for the Los Azules Project, Argentina” (Hatch).
Located in the Prolific Andes Copper Belt
l Situated at 3,500 m elevation
Mara(Alumbrera/Agua Rica)
in the Andes Mountains, on the
border with Chile
l In a pro-mining jurisdiction, the Josemaria
Province of San Juan, Argentina Filo del Sol – Filo Mining
l Accessible by road, and within
20-months by air
Aldebaran
AldebaranRes.
Los Azules - McEwen Copper
l Two exploration camps
established
Major undeveloped copper deposits in San Juan include:
Los Azules, Pachon, Altar, Filo del Sol, and Josemaria.
MUXLos Azules: Preliminary Economic Assessment (PEA)
Highlights of the 2017 Los Azules PEA1 (Hatch Engineering)
Average annual production
1st 13 Years 415 Million lbs Cu at $1.14/lb cash cost
Mine life 36 years
Initial capex $2.4 Billion
Base Case Cu Price $3.00/lb
Payback 3.6 years
After-tax IRR 20.1%
After-tax NPV8% $2.2 Billion
Enough copper to supply 2.2 million electric vehicles per year2
1
Preliminary Economic Assessment (PEA) Oct 16, 2017 - “NI 43-101 Technical Report - Preliminary Economic Assessment Update for the Los Azules Project, Argentina”
(Hatch). All project economic metrics are presented on a post-project approval basis (after completion of additional drilling, prefeasibility and feasibility studies). All economic
assessments are calculated at the Los Azules project level and do not include certain costs including corporate office, interest, financing and exploration expenses.
MUX 2
Assuming 183 lbs of copper per vehicle (Copper Development Association Inc. - copper.org)Los Azules: IRR1 Sensitivity
35% 33.6%
29.8%
30%
25.1%
After-tax IRR 25%
20.1%
20%
14.3%
15%
10%
7.2%
5%
0%
$2.00 $2.50 $3.00 $3.50 $4.00 $4.50
Copper Price ($/lb)
1 Preliminary Economic Assessment (PEA) Oct 16, 2017 - “NI 43-101 Technical Report - Preliminary Economic Assessment Update for the Los Azules Project, Argentina”
(Hatch). All project economic metrics, including internal rate of return (IRR), are presented on a post project approval basis (after completion of additional drilling,
prefeasibility and feasibility studies). All economic assessments are calculated at the Los Azules project level and do not include certain costs including corporate office,
MUX interest, financing and exploration expenses.Executive Leadership Team
Rob McEwen - Chairman and Chief Executive Officer
Rob is the Chairman and Chief Owner of McEwen Mining Inc. (MUX). Rob owns 18% of MUX, his cost base is $165 million, and his salary is $1/yr. Rob is a
passionate innovator, marketer and an avid recreational competitor. He is also a member of the Dean’s Advisory Board, Schulich School of Business; X Prize
Foundation: Vision Circle and Board of Trustees; Global Advisory Counsel; ISSCR (International Society of Stem Cell Research); CEO (Chief Executive
Organization) and WPO (World Presidents’ Organization). Rob was the founder of Goldcorp, and he was awarded the Order of Canada in 2007 and the
Queen Elizabeth's Diamond Jubilee Award in 2013. He holds an Honorary Doctor of Laws and an MBA from York University and a BA from the University of
Western Ontario. Also, he received the 2001 PDAC Developer of the Year Award, was named Canada’s Most Innovative CEO in 2006 by Canadian Business
Magazine and was inducted into The Canadian Mining Hall of Fame in 2017.
Rob and his wife, Cheryl, have donated in excess of $60 million to encourage excellence and innovation in healthcare and education. Their donations have led
to the establishment of the McEwen Stem Cell Institute at Toronto General Hospital, McEwen School of Architecture at Laurentian University, the Rob and
Cheryl McEwen, Graduate Study & Research Building at Schulich School of Business (York University) and the McEwen Leadership Program at St. Andrew’s
College.
Peter Mah – Chief Operating Officer
Peter is the Chief Operating Officer of MUX. He is a professional engineer with 30 years’ global mining experience spanning gold, diamonds and extensive
experience in base metals. As a seasoned mining executive, his well-rounded experience comes from roles including Chief Operating Officer and Executive
Vice President of Luna Gold, Group Executive at Newmont Mining, General Manager at the De Beers Victor Mine, Mine Manager of Newcrest’s Kencana
Mine, as well as engineering roles at Goldcorp and Placer Dome. In 2009, Peter’s Victor Mine Team was awarded Mining Magazine’s international ‘Mine of the
Year’ award. Peter has a passion for building teams that strive for business excellence and innovation. His operating philosophy is anchored on a foundation
of best-in-class safety, health, environmental and social standards. He holds a Bachelor’s of Applied Science in Mining and Mineral Process Engineering and
a Master’s of Applied Science from the University of British Columbia.
Anna Ladd-Kruger – Chief Financial Officer
Anna is the Chief Financial Officer of MUX and is an accomplished financial mining executive with 20 years’ experience. She was previously the Chief
Financial Officer of Trevali Mining, where she was integral to growing the company from a junior exploration company to over $1 billion market cap mid-tier
producer. She also has experience in both gold and base metal companies including Kinross Gold and Vale. She has extensive financial management and
capital markets background and has worked in Latin America. Anna is CPA, CMA, and holds a M.A. in Economics from Queen's University and a B.Comm.
from the University of British Columbia.
MUXProject Leadership Team
Ruben Wallin – Vice President Environment, Safety, Health & Community
Ruben is an environment and sustainability professional with more than 30 years’ of experience in the global mining industry. He has broad corporate and
operational management experience in the areas of environment, health and safety, community relations, government relations, permitting and tailings
management. Ruben has worked extensively throughout South America and Africa during his career and is experienced in current global industry standards
and best practices. In Canada, he has been involved in the successful operation of the Detour Lake Mine, the Canadian Malartic Mine and the Victor Mine.
Before joining McEwen Mining, Ruben held the position of Vice President of Environment and Sustainability for Detour Gold Corporation.
Dave Tyler - Project Director
Dave is a senior mining executive with over 30 years’ expertise in innovation, planning, engineering, permitting, startup and operations of successful mines
internationally. He has authored multiple feasibility studies of major precious and base metals mining projects globally including South America. Mr. Tyler was
previously the Study Director for Newmont Mining, VP Technical Services for Coeur Mining and was also the Vice President Project Development for Twin
Metals leading a $1.1B Copper-Nickel development project near an environmentally sensitive national wilderness area.
Gary Cochran - Project & Construction Manager
Gary is fluent in Spanish and is a seasoned mining and construction professional with over 35 years’ experience in surface mining and associated construction
works. Gary has successfully led multiple large-scale projects and has trained personnel to high standards of safe economical operation in all aspects of
mining and construction. Gary was the Construction & Project Manager for Hudbay Minerals’ Constancia Copper Mine in Peru. He also managed the El
Brocal Zinc open pit mine operations near Cerro de Pasco, Peru. He was involved in managing winter operations and an advisor to Barrick’s Veladero project
in Argentina.
William Thomas - Manager, Business Improvement & Operational Readiness
Bill is an experienced project consulting engineer experienced in facility design optimization, asset management, logistics, safety, training, & change
management. He is an international Consultant, skilled in strategy development, risk management, project processes, engineering & project control toolsets,
team selection, assembly & training, construction, business readiness, commissioning & startup. Bill has been a project consultant to Hudbay Minerals’
Constancia Project in Peru, as well as Project Consultant to both Newmont and Freeport, responsible for defining core business processes to support capital
effectiveness & delivery of business ready facilities.
MUXRequired copper price (US$/t Cu)
MUX
2,000
3,000
4,000
5,000
6,000
7,000
8,000
9,000
10,000
11,000
12,000
13,000
14,000
New Prosperity
Tenke Phase 3
Pebble
El Abra Mill
Al Arco
Galore Creek
Los Azules
Q1
Los Chancas
Salobo 3
San Nicolas
Canaria Norte
Harper Creek
Kamoa-Kakula
Resolution
Spot Copper Price
Kansanshi Sulphide
Ann Mason
Los Helados
Ajax
Cuajone
Price Required at Risked-IRR (12%)*
Kerr-Sulphurets-Mitchell
Rosemont
Nueva Union
Galeno
Radomiro Tomic
Q2
Collahuasi GL4
in the Marketplace
Koksay
Los Calatos
Michiquillay
Haquira
Los Azules - One of the Most Robust
Quebrada Blanca II
Schaft Creek
Development Opportunities
Cumulative Production (Paid kt Cu)
La Granja
Mina Justa
Q3
Udokan
Agua Rica
Inca de Oro
Cotabambas
Los Pelambres 205
Frieda RIver
Cristalino
Andina Phase 2
Tampakan
Centinala DMC
Zafranal
Wafi Golpu
Q4
Cost Curve for Development Stage Copper Projects
Taca Taca
Cerro Casale
Source: Oct 4, 2018 Copper Top Projects Report by Goldman Sachs Global Investment Research. *According to April 13, 2021 Goldman Sachs Report.
El Pachon
Josemaria
Aynak
King KingLos Azules Versus Other Large Scale Copper Developers
Project Name (Ownership) Filo del Sol (100%) Josemaria (100%) Alpala (85%) (2) Vizcachitas (100%) Los Azules (100%) Los Azules
Asset Information Country Argentina / Chile Argentina Ecuador Chile Argentina Rank
Stage PFS FS PEA PEA PEA
F.D. ITM Market Capitalization (B US$) $0.9 $0.3 $1.2 $0.1
Public Markets
Information
Cash (M US$) $25 $78 $139 $4
Total Resources (B lbs C u Eq) 8.4 15.8 37.0 (4) 19.3 34.2 2/5
Resources
Resource Grade (% C u Eq) 0.64% 0.38% 0.52% 0.42% 0.43% 3/5
Approx. Elevation Above Sea Level (km) 4.7 4.5 1.2 .9 3.3
Initial Capex (B US$) $1.3 $3.1 $2.5(5,6) $1.9 $2.4 3/5
Mine Life ( years) 14 19 66 (6) 45 36 3/5
Operations
Information Avg. Annual Production (B/lbs Cu Eq) .27 .40 .34 (5,6) .27 .36 2/5
(based on Cash Costs (Co-Product) (US$/lb Cu Eq) $1.2 $1.6 $1.6 (6) $1.7 $1.5 2/5
latest technical study
Cu price US$3.00/lb AISC (Co-Product) (US$/lb Cu Eq) $1.3 $1.7 $2.0 (6) $1.8 $1.7 2/5
discount rate 8%)
Capital Intensity (Annual Production) (US$/lb Cu Eq) $4.6 $7.6 $7.4 $7.1 $6.6 2/5
After-Tax NPV (B US$) $1.3 $1.5 $4.2 (5,6) $1.8 $2.2 2/5
IRR (%) 23.0% 15.4% 26.5% (6) 20.8% 20.1% 4/5
Source: Company filings, FactSet (1) Converted to Cu Eq. at LT street consensus prices (Cu: US$3.25/lb, Au: US$1,600/oz). (2) 15% owned by Cornerstone Capital
Resources. (3) Franco-Nevada holds a perpetual 1% NSR on Alpala, having advanced SolGold US$100M under a royalty financing agreement. (4) Resources shown
MUX on a 100% basis. (5) Project metrics shown on a 100% basis. (6) Metrics based on PEA case 1: 40 Mtpa throughput.Los Azules: Infrastructure De-risking
Northern Access Road, Power transmission corridor Preliminary airstrip, will be Chile concentrate route is 98%
a new 115 km low altitude all was defined alongside the constructed during the PFS to covered by existing routes
year road will be constructed Northern Access Road, with support workforce movements. accessing Coquimbo Port
during the PFS (replacing the straightforward construction The location will coincide with a shipping facilities for concentrate
existing access road, which proposed permanent airstrip to storage and export.
and maintenance.
crosses two high passes
service the project over the long Border pass approved between
>4,000 m and several rivers). Opportunities for green energy
term. Argentina and Chile.
solutions will be evaluated
during the PFS. Logistic and market studies to
be updated.
MUXMcEwen Copper: Anticipated Deliverables
l 53,000 m Resource and Reserve definition drill program
l New road to provide year round access to the site
l New airstrip to support efficient transport of personnel, food and other essential
supplies to the work site
l Prefeasibility Study (PFS) targeting PEA business cases and potential
improvements
l Greenfield exploration program for Elder Creek Property, Nevada
l Go-public with North American listing in 9 to 12 month
MUXLos Azules: Federal & Provincial Glacier Protection Laws
Potential Permafrost Distribution in the area of Los Azules
The Los Azules Project has a facility and mine layout specifically
planned with reference to permafrost and water bearing geoforms, and
appears to comply with the Provincial & Federal Glacier Laws. It is not
possible to be completely certain when the laws have not been tested
in courts.
Glacier Protection Law exists at the Federal level, with a similar
complementary law at Provincial level. The law is for the protection of
glaciers and the permafrost environment as strategic water resources and
for tourism and scientific interest.
The law is well-intentioned to protect the ice glaciers and their
environments. However, the anti-mining lobby are referencing this law as a
means to impede responsible mine development.
Specifically mentioned in the law is that mining and industrial development
are prohibited in the Periglacial Environment, which is defined as the area
with frozen soils. Periglacial geoforms to be protected are those that are
water-bearing. These geoforms are often referred to as rock glaciers.
The Los Azules Copper Project sits within an area with residual
discontinuous permafrost at higher altitudes. No permafrost is detected
below 3,850 metres. Permafrost is only considered in the Federal
Los Azules Glacier Law and not in San Juan’s Provincial Glacier Law.
Project Footprint Potential
Permafrost
MUX Temp. SensorsLos Azules: Tailings & Water Management
Favorable project location using natural terrain to minimize footprint and water use
The PEA tailings dam solution is configured to
close-off the water catchment downstream from
all upstream mining, processing, and waste rock
and tailings storage, creating a robust separation
between the contacted environment and the non-
contacted environment for the Life of Mine.
MUXLos Azules: Social Investment
l Socio-economic impact
assessment to be completed
l Key stakeholders will be engaged
to develop social investment plan
l Areas of focus:
I. Employment
Local land user engagement Public consultation II. Education and skills training
III. Local business development
IV. Infrastructure development
(roads, green power, schools,
etc.)
V. Capacity building in San Juan
Adventure tourism opportunities Skilled employment & training
MUXElder Creek Project, Nevada
Lone Tree Elder Creek is a porphyry copper-gold exploration
property located in northern Nevada, near the northern end of
the Battle Mountain-Eureka Trend, one of Nevada’s prolific
mineral belts. The project covers 9,600 acres.
Marigold Several exploration and mining companies have explored the
Elder Creek project area since the 1960’s. Early exploration was directed at
copper but with most drilling located north of the current property
core. More recent exploration was directed primarily at gold to
the north and northeast with numerous shallow drillholes
completed. The core of the property and the porphyry deposit
Copper Basin
potential remains largely untested.
The Battle Mountain mining district currently includes three
Phoenix producing mines and one copper-gold development project:
Elder Creek
• Nevada Gold Mines’ (NGM) Lone Tree Gold Mine
• NGM Phoenix Gold & Copper Mine
• SSR Mining’s Marigold Mine Complex
• Copper Basin - Cu-Au development
MUXElder Creek Project, Nevada
Airborne magnetics at Elder Creek document a classic
porphyry system magnetic “donut” pattern which
coincides with the outer limit of alteration that is known to
contain pyrrhotite (a magnetic mineral). The cause of the
central magnetic low could be non-magnetic intrusions that
lack pyrrhotite, or pyrrhotite-destructive alteration.
Drilling in 2018 confirmed the presence of highly encouraging
copper oxide and sulfides in reverse circulation drill hole
RCEC18-01.
0.21% Cu over 152.4 m including 0.44% Cu over 33.5 m
Core hole CCEC18-02 intersected visible chalcopyrite and
molybdenite mineralization throughout, with mineralization best
developed in hydrothermal breccias between 1313.5 – 1365 feet.
0.15% Cu over 200.3 m including 1.20% Cu over 14.2 m
Source: Company Records
MUXContact Information
For additional information:
Rob McEwen Anna Ladd-Kruger
Chairman and Chief Owner Chief Financial Officer
McEwen Mining & McEwen Copper McEwen Mining & McEwen Copper
rob@mcewenmining.com akruger@mcewenmining.com
Tara Saratsiotis Stefan Spears
Executive Assistant to Rob McEwen Vice President, Corporate Development
tsaratsiotis@mcewenmining.com stefan@mcewenmining.com
(647) 258-0395 x230 (647) 408-1849
MUXAppendix: Los Azules Mineral Resource Estimate
Copper Resources
Indicated Inferred
Tonnes (millions) % Cu Contained Metal (million pounds) Tonnes (millions) % Cu Contained Metal (million pounds)
962.0 0.48 10,200 2,666.0 0.33 19,300
Gold Resources
Indicated Inferred
Tonnes (millions) Grams per tonne Contained Metal (Koz) Tonnes (millions) Grams per tonne Contained Metal (Koz)
962.0 0.06 1,700 2,666.0 0.04 3,800
Silver Resources
Indicated Inferred
Tonnes (millions) Grams per tonne Contained Metal (Koz) Tonnes (millions) Grams per tonne Contained Metal (Koz)
962.0 2 55,700 2,666.0 2 135,400
MUX
Source: Preliminary Economic Assessment (PEA) Oct 16, 2017 - “NI 43-101 Technical Report - Preliminary Economic Assessment Update for the Los Azules Project, Argentina” (Hatch).El Gallo: Fenix Feasibility Study* Fenix
Sinaloa
Mexico
Phase 1, Years 1 - 6 Phase 2, Years 7 - 9.5
Gold Production Silver Production
Capex $42 M Initial $24 M Year 6
Avg Annual Production 26 Koz Au 4.5 Moz AgEq
Cash Costs $1,037/ oz Au $14.22/ oz AgEq
AISC $1,045/ oz Au $14.30/ oz AgEq
Base Case Spot Case Upside Case
$1,500/oz Au $1,800/oz Au $1,900/oz Au
$17/oz Ag $25/oz Ag $25/oz Ag
After-Tax IRR 28% 51% 56%
After-Tax NPV@8% $32 M $91 M $98 M
After-Tax Payback 3.6 years 2.9 years 2.8 years
After-Tax Cash Flow/Yr (1) $12 million $25 million $26 million
• Innovative, water saving, tailings disposal
• Phase 1 permitting completed
MUX * Feb 16, 2021 press release. (1) - After-tax cash flow averaged over the years of full production.Stock West Drill Results - Strong, Consistent Mineralized Intercepts
21.40 g/t Au over 30.0m2
Visible Gold (VG)
5.63 g/t Au over 30.0 m1
MUX Core from drill holes: 1. S19-98, 2. S19-106.Fox Complex Expansion Strategy 1
Production Growth Steps to Target 100 -150 Koz / Yr
Leveraging Stock Mill Capacity
Step 1. Froome Commercial production Q4 2021
Bridging gold production for the next 2.5 years
Step 2. Grey Fox Grow scale & increase Life of Mine; PEA H2 2021
Gibson & Whiskey Jack drilling recommencing in Q2
Advance Sooner
Stock - Blue Sky Growth Leveraging existing permits
Restore UG access via existing shaft and/ or ramp
2020-21 aggressive exploration drilling campaign
Stock West resource delineation & step-out drilling underway
MUX 1
Based on existing 3.0 Moz Measured & Indicated Resource from Black Fox, Grey Fox, Stock and Timmins properties.Froome Deposit – Better Mining Conditions Than Black Fox
Shown below is a core interval of the wide zone - consistent grades and favorable ground conditions expected,
providing for overall better mining conditions, compared to Black Fox’s nuggety style mineralization.
From 127 m: 4.55 g/t Au over 53.0 m, incl. 8.92 g/t Au over 10.6 m
MUX Gold grade (g/t) Drill core from hole #15PR-G031. Numbers in yellow represent grams per tonne values over sample length.Fox Complex: Grey Fox 2019-2020 Exploration Highlights
From Multiple Zones of Near Surface Mineralization
Gold Width From
Area Project Hole # Including Au GxM
(g/t) (m) (m)
19GF-1253 265.00 1.2 56.0 318
19GF-1121 261.00 0.6 168.7 157
19GF-1123 39.46 3.8 325.0 143.00 g/t Au / 1.0 m 150
147NE
19GF-1151 10.04 13.2 229.8 133
19GF-1134 6.98 15.5 466 108
19GF-1175 148.00 0.7 189.1 105
19GF-1198 10.87 18.8 281.2 205
19GF-1261 13.62 15.0 69.0 126.50 g/t Au / 1.0 m 204
GF South
19GF-1277 29.12 5.0 98.0 146
19GF-1310 4.25 26.5 335.0 113
GREY FOX
19GF-1187 3.99 34.0 207.0 7.04 g/t Au / 14.0 m 136
147 Zone
19GF-1259 120.50 1.1 7.9 133
19GF-1293 52.96 7.4 147.0 392
19GF-1248 8.99 44.0 181.0 395
19GF-1242 9.74 13.0 107.0 127
Whiskey Jack
20GF-1325 17.07 10.2 250.3 68.15 g/t Au / 2.0 m 174
20GF-1255 20.01 7.9 235.4 131.00 g/t Au / 0.7 m 157
20GF-1323 31.23 3.4 262.0 38.51 g/t Au / 2.7 m 106
19GF-1275 26.25 9.0 892.0 226.00 g/t Au / 1.0 m 236
Gibson
19GF-1106W1 26.74 8.0 739.0 519.00 g/t Au / 0.4 m 215
MUX Width (m) = down hole intersection, drill results using cut-off grade 1 gpt Au. All assays are uncapped.Length Au g/t Cog 1 Cog 3 Length Au g/t Cog 1 Cog 3 Length Au g/t Cog 1 Cog 3
494.0m 1.0
Fox
1.29
1.0 1.59
475.0m 1.0 6.57 536.0m 1.0 1.15
1.0 2.43 1.0 2.97 1.0 0.12
1.0 4.05
1.0 1.84 1.0 0.81
Complex 1.0
1.0
6.59
2.84
1.0 2.28 1.0 3.36
1.0 3.43 1.0 3.47
1.0 1.27
Drill Results 1.0 1.0
8.33 2.30
1.0 16.70 1.0 0.65
1.0
11.24g/t Au / 16.2m
3.08
1.0 7.87 1.0 11.60
1.0 5.34 1.0 2.50
@ 1.0 2.94
1.0 7.71
1.0 6.04
7.72g/t Au / 25m
1.0 4.81 1.0 10.70
1.0 3.11 1.0 8.70
1.0 10.35
Stock West
5.62g/t Au / 29.1m
5.62g/t Au / 29.1m
1.0 6.65 1.0 2.39
1.0 11.25
1.0 3.25
1.0 16.90
1.0 5.08
1.0 5.06 1.0 12.60
1.0 6.67
6.37g/t Au / 42.0m
1.0 7.76 1.0 1.56 1.0 13.65
1.0
6.72g/t Au / 39.0m
1.0 3.05
1.0 5.49 26.80
1.0 5.65
1.0 4.01 1.0 21.40
Strong, 1.0
1.0
6.65
9.52 1.0 4.51 1.0 9.48
1.0 3.45
1.0 5.20 1.0 13.85
Consistent 1.0
1.0
6.15
6.35 1.0 2.60 1.0 13.05
1.0 6.80 1.0 0.85 Hole 1.0 8.70
Mineralized 0.9
0.2
9.45
4.22
1.0 4.12 S19-106 1.0 2.33
0.9 2.71
1.0 2.07 1.0 2.04
Intersections 1.0
1.0
41.40
3.96 Hole
1.0
1.0
3.11
1.15
1.0 0.45
1.0 1.42
1.0 4.17
0.5 6.73
S19-105 1.0 6.15 1.0 0.83
0.5 5.19 1.0 22.80 561.0m 1.0 2.16
Hole 1.0 4.28 1.0 8.32
S19-101 1.0 4.67
1.0 22.30
1.0 1.96
1.0 11.00 1.0 18.70
1.0 7.85 504.1m 1.0 11.80
1.0 6.36
1.0 0.91 Au > 30 10 to 20 3 to 5
1.0 0.99 g/t
MUX 536.0m 1.0 5.71
20 to 30 5 to 10 1 to 3San José Mine Vein Extensions
Cristina
Giovanna
Merce
1 km/0.6 Miles N
Frea
1.0 m @ 7.02 g/t Au, 811 g/t Ag
stina
des
Flore
Ay
Odin
ele
Agu
n
ncia
Maia 1.0 m @ 20.26 g/t Au, 461 g/t Ag
1.0 m @ 2.38 g/t Au, 1,964 g/t Ag Fre Odin
a
Micaela Pila 1.3 m @ 6.67 g/t Au, 762 g/t Ag
r
Emil
Jul ia
ia
Kospi
0.7 m @ 0.30 g/t Au, 18 g/t Ag 1.2 m @ 5.80 g/t Au, 197 g/t Ag
0.9 m @ 8.00 g/t Au, 397 g/t Ag
Isabel
1.6 m @ 7.42 g/t Au, 522 g/t Ag
Erika
Er
TL-03
ika
Hu
Maia
NW
ev
Executing Drill
os
Intercepted DDH Ve
rde
Observed Vein
s 0.8 m @ 1.52 g/t Au, 331 g/t Ag
SJ
Inferred Vein 1.3 m @ 9.51 g/t Au, 1,318 g/t Ag
M
-4
Inferred Fault
90
MUX Source: Hochschild Mining. Lengths are rounded up to the nearest tenth.MUX: Reserves & Resources
Mineral Reserves
Attributable Gold Reserves
Proven Probable Proven + Probable
Tonnes Grams per Contained Metal Tonnes Grams per Contained Metal Tonnes Grams per Contained Metal
43-101 Au Reserves
(millions) tonne (Koz) (millions) tonne (Koz) (millions) tonne (Koz)
Gold Bar South 1.9 1.05 66 1.9 1.05 66
Pick 12.6 0.81 324 12.6 0.80 324
Ridge 1.1 0.87 30 1.1 0.87 30
San José (49%) 0.4 6.73 86 0.1 5.46 16 0.5 6.49 102
El Gallo Heap Leach Material 8.9 0.52 149 1.2 0.52 20 10.1 0.52 170
El Gallo Silver 0.7 0.05 1 3.7 0.13 16 4.4 0.12 17
Black Fox Mine 0.1 3.96 4 0.1 4.10 9 0.1 4.05 14
TOTAL 241 481 723
Attributable Silver Reserves
Proven Probable Proven + Probable
Tonnes Grams per Contained Metal Tonnes Grams per Contained Metal Tonnes Grams per Contained Metal
43-101 Ag Reserves
(millions) tonne (Koz) (millions) tonne (Koz) (millions) tonne (Koz)
San José (49%) 0.4 409 5,251 0.1 354 1,043 0.5 399 6,298
El Gallo Heap Leach Material 8.9 2 451 1.2 2 67 10.1 2 518
El Gallo Silver 0.7 166 3,708 3.7 127 15,017 4.4 133 18,725
TOTAL 9,410 16,127 25,541
MUX Source: Company disclosures to March 11, 2021.MUX: Reserves & Resources
Mineral Resources
Attributable Gold Resources
Measured Indicated Measured + Indicated Inferred
Tonnes Grams per Contained Tonnes Grams per Contained Tonnes Grams per Contained Tonnes Grams per Contained
43-101 Au Resources
(millions) tonne Metal (Koz) (millions) tonne Metal (Koz) (millions) tonne Metal (Koz) (millions) tonne Metal (Koz)
San José (49%) 0.9 7.89 218 0.5 5.68 89 1.3 7.09 307 0.9 5.58 164
Los Azules - - - 962.0 0.06 1,700 962.0 0.06 1,700 2,666.0 0.04 3,800
Heap Leach Material 8.8 0.59 167 1.2 0.60 23 10.0 0.59 190 0.1 0.66 3
El Gallo Silver 1.0 0.08 3 3.5 0.13 15 4.5 0.12 18 0.1 0.14 0.3
Tonkin 17.5 1.44 820 14.7 1.34 627 32.3 1.39 1,447 8.4 1.13 311
Cabin - - - 0.4 0.81 10 0.4 0.81 10 - - -
Ridge - - - 1.4 0.89 39 1.4 0.89 39 0.7 0.65 14
Pick - - - 12.6 0.91 370 12.7 0.91 370 1.0 0.85 27
Gold Bar South - - - 2.3 0.99 74 2.3 0.99 74 0.3 1.06 11
New Pass (50%) 5.0 0.97 156 0.1 0.59 1 5.1 0.97 157 - - -
Limo 5.9 0.89 168 3.7 0.61 73 9.6 0.78 241 2.2 0.70 51
Lexam Open Pit 0.5 2.44 36 12.1 1.89 741 12.6 1.91 777 6.3 1.79 358
Lexam Underground 0.4 5.56 64 4.1 4.82 628 4.4 4.88 692 4.2 4.35 596
Black Fox Mine 0.4 5.35 64 0.1 5.06 19 0.5 5.28 84 0.2 5.32 41
Tamarack - - - 0.8 1.83 46 0.8 1.83 46 - - -
Grey Fox - - - 3.9 7.05 888 3.9 7.05 888 0.8 6.58 173
Froome Underground - - - 1.1 5.09 181 1.1 5.09 181 0.05 4.13 7
Stock East Open Pit - - - 2.0 1.26 83 2.0 1.26 83 0.3 0.91 8
Stock East Underground - - - 0.4 3.19 38 0.4 3.19 38 - - -
TOTAL 1,695 5,644 7,340 5,564
MUX Source: Company disclosures to March 11, 2021. Note: Mineral Resources inclusive of Mineral Reserves (where applicable).MUX: Reserves & Resources
Mineral Resources (Cont’d)
Attributable Silver Resources
Measured Indicated Measured + Indicated Inferred
Tonnes Grams per Contained Tonnes Grams per Contained Tonnes Grams per Contained Tonnes Grams per Contained
43-101 Ag Resources
(millions) tonne Metal (Koz) (millions) tonne Metal (Koz) (millions) tonne Metal (Koz) (millions) tonne Metal (Koz)
San José (49%) 0.9 484 13,359 0.5 335 5,278 1.3 429 18,599 0.9 345 10,115
Los Azules 962.0 2 55,700 962.0 2 55,700 2,666.0 2 135,400
El Gallo Heap Leach Material 8.8 2 451 1.2 2 67 10.0 2 518 0.1 2 7
El Gallo Silver 1.0 155 4,791 3.5 127 14,228 4.5 133 19,019 0.1 129 286
New Pass (50%) 5.0 8 1,320 0.1 3 7 5.1 8 1,326 - - -
Tamarack - - - 0.8 26 663 0.8 26 663 - - -
TOTAL 19,920 75,942 95,825 145,808
Attributable Copper Resources
Measured Indicated Measured + Indicated Inferred
Tonnes Tonnes Pounds Tonnes Pounds Tonnes Pounds
43-101 Cu Resources % Cu % Cu % Cu % Cu
(millions) (millions) (millions) (millions) (millions) (millions) (millions)
Los Azules - - - 962.0 0.48 10,200 962.0 0.48 10,200 2,666.0 0.33 19,300
MUX Source: Company disclosures to March 11, 2021.Note: Mineral Resources inclusive of Mineral Reserves (where applicable).MUX: Cautionary Note Regarding
NON-GAAP Measures
In this presentation, we have provided information prepared or calculated according Earnings from Mining Operations
to U.S. GAAP, as well as provided some non-U.S. GAAP ("non-GAAP") performance
The term Earnings from Mining Operations used in this presentation is a non-GAAP
measures. Because the non-GAAP performance measures do not have any
financial measure. We use and report this measure because we believe it provides
standardized meaning prescribed by U.S. GAAP, they may not be comparable to
investors and analysts with a useful measure of the underlying earnings from our
similar measures presented by other companies.
mining operations. We define Earnings from Mining Operations as Gold and Silver
Total Cash Costs per GEO, and All-in Sustaining Costs (“AISC”) per GEO. Revenues from our El Gallo Mine, Black Fox Mine, and our 49% attributable share of
Total cash costs consist of mining, processing, on-site general and administrative the San José Mine's Net Sales, less their respective Production Costs Applicable to
costs, community and permitting costs related to current explorations, royalty costs, Sales. To the extent that Production Costs Applicable to Sales may include
refining and treatment charges (for both doré and concentrate products), sales costs, depreciation and amortization expense related to the fair value increments on
export taxes and operational stripping costs. All-in sustaining cash costs consist of historical business acquisitions (fair value paid in excess of the carrying value of the
total cash costs (as described above), plus environmental rehabilitation costs, underlying assets and liabilities assumed on the date of acquisition), we deduct this
amortization of the asset retirement costs related to operating sites, sustaining expense in order to arrive at Production Costs Applicable to Sales that only include
exploration and development costs, and sustaining capital expenditures. In order to depreciation and amortization expense incurred at the mine-site level. The San José
arrive at our consolidated all-in sustaining costs, we also include corporate general Mine Net Sales and Production Costs Applicable to Sales are presented, on a 100%
and administrative expenses. Depreciation is excluded from both total cash costs and basis, in Note 5 of McEwen Mining's Annual Report on Form 10-K for the year ended
all-in sustaining cash costs. For both total cash costs and all-in sustaining costs we December 31, 2020.
include our attributable share of total cash costs from operations where we hold less
Cash, Investments and Precious Metals
than a 100% economic share in the production, such as MSC, where we hold a 49%
interest. Total cash cost and all-in sustaining cash cost per GEO sold are calculated The term cash, investments and precious metals used in this presentation is a
on a co-product basis by dividing the respective proportionate share of the total cash non-GAAP financial measure. We report this measure to better understand our
costs and all-in sustaining cash costs for the period attributable to each metal by the liquidity in each reporting period. Cash, investments and precious metals is calculated
ounces of each respective metal sold. We use and report these measures to provide as the sum of cash, investments and ounces of doré held in inventory, valued at the
additional information regarding operational efficiencies both on a consolidated and London P.M. Fix spot price at the corresponding period. A reconciliation to the most
an individual mine basis, and believe that these measures provide investors and directly comparable U.S. GAAP measure, Sales of Gold and Silver, is provided in
analysts with useful information about our underlying costs of operations. A McEwen Mining's Annual Report on Form 10-K for the year ended December 31,
reconciliation to the nearest U.S. GAAP measure is provided in McEwen Mining's 2020.
Annual Report on Form 10-K for the year ended December 31, 2020.
MUXYou can also read